26
Dr Neil J. Bristow Presentation at WSD Steel Success Strategies XXVI New York, 22 nd June 2011 H & W Worldwide Consulting [email protected] +61240286268
Dr Neil J. Bristow
Presentation at WSD Steel Success Strategies XXVI New York, 22nd June 2011
H & W Worldwide Consulting
[email protected]+61240286268

0
100
200
300
400
500
600
700
2005 2010
Bill
ion
US$
Market Cap of top 3 producers
AutomotiveSteelIron Ore
Source: Renault, MB Iron Ore presentation
The market capitalisation of the top iron ore companies has risen from 40% to ~ 60% as value has moved upstream with corresponding declines in steel and the automotive sectors.

1. Consumption and demand drivers
2. Supply response
3. Some impacts of future supply

Strong Chinese steel production
Delays in Supply
Rapid Supply Response
The interplay of the different forces will determine the duration and extent of industry profitability
H & W Worldwide Consulting
Source: BHPBilliton presentation
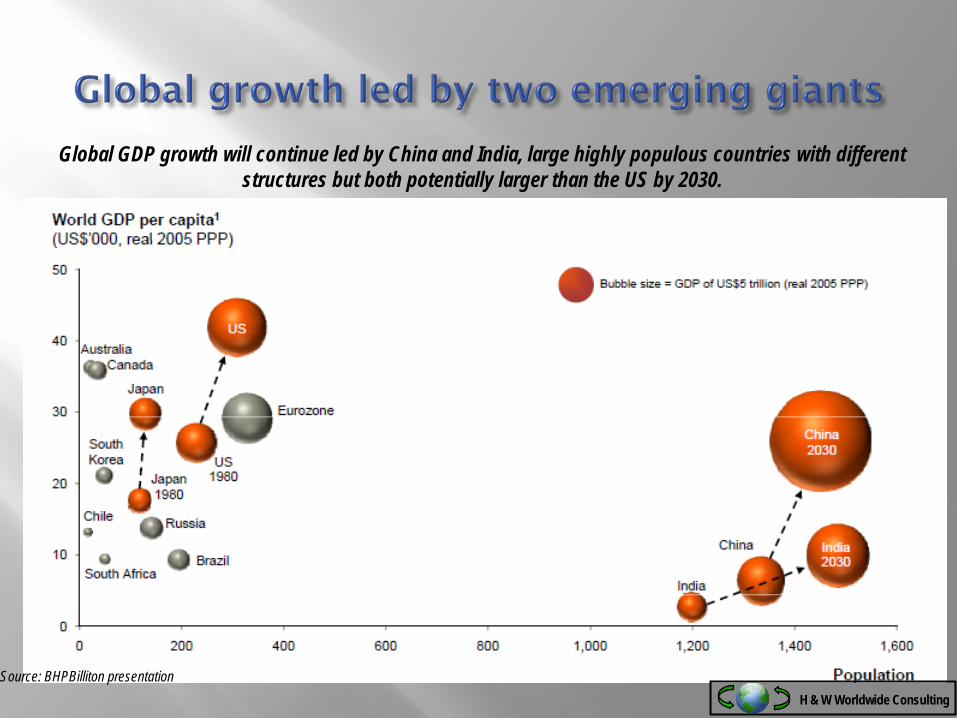
Global GDP growth will continue led by China and India, large highly populous countries with different structures but both potentially larger than the US by 2030.
H & W Worldwide Consulting
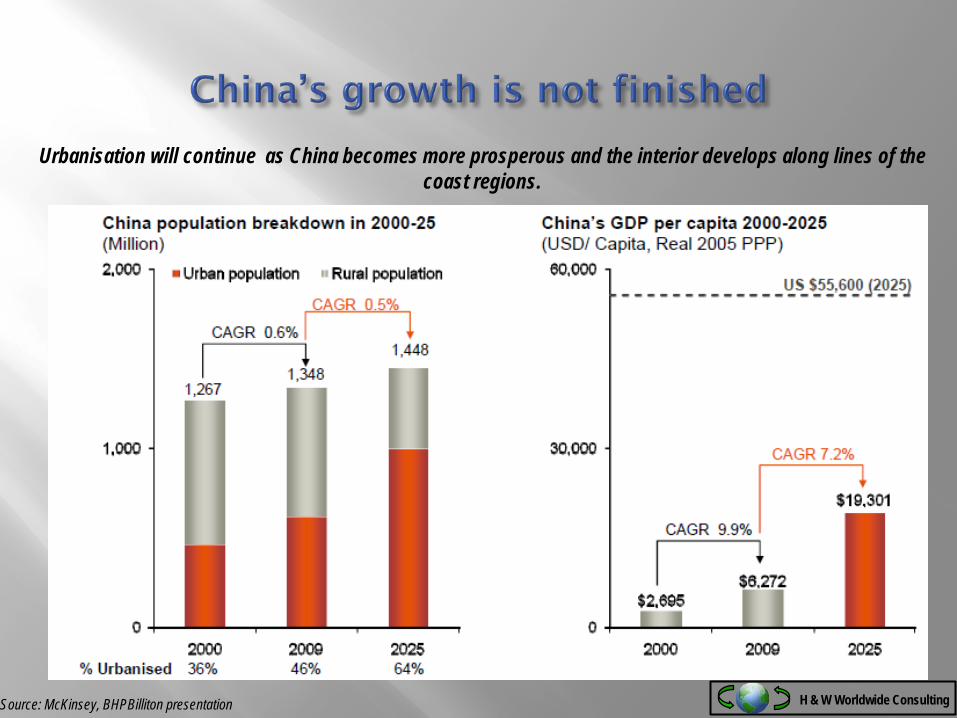
Urbanisation will continue as China becomes more prosperous and the interior develops along lines of the coast regions.
Source: McKinsey, BHPBilliton presentation H & W Worldwide Consulting
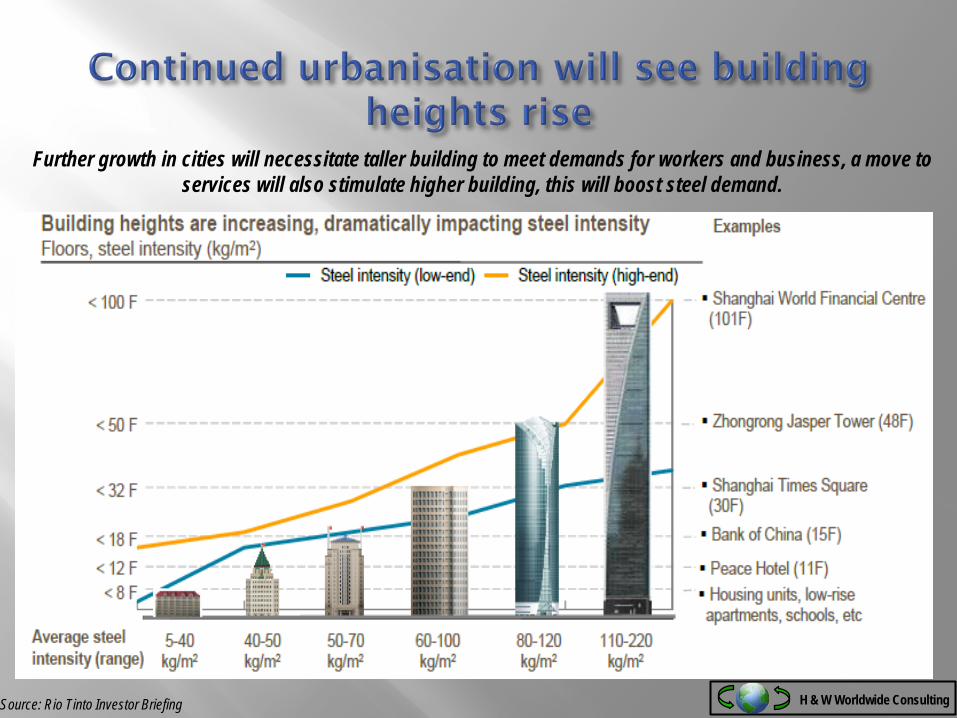
Further growth in cities will necessitate taller building to meet demands for workers and business, a move to services will also stimulate higher building, this will boost steel demand.
Source: Rio Tinto Investor Briefing H & W Worldwide Consulting
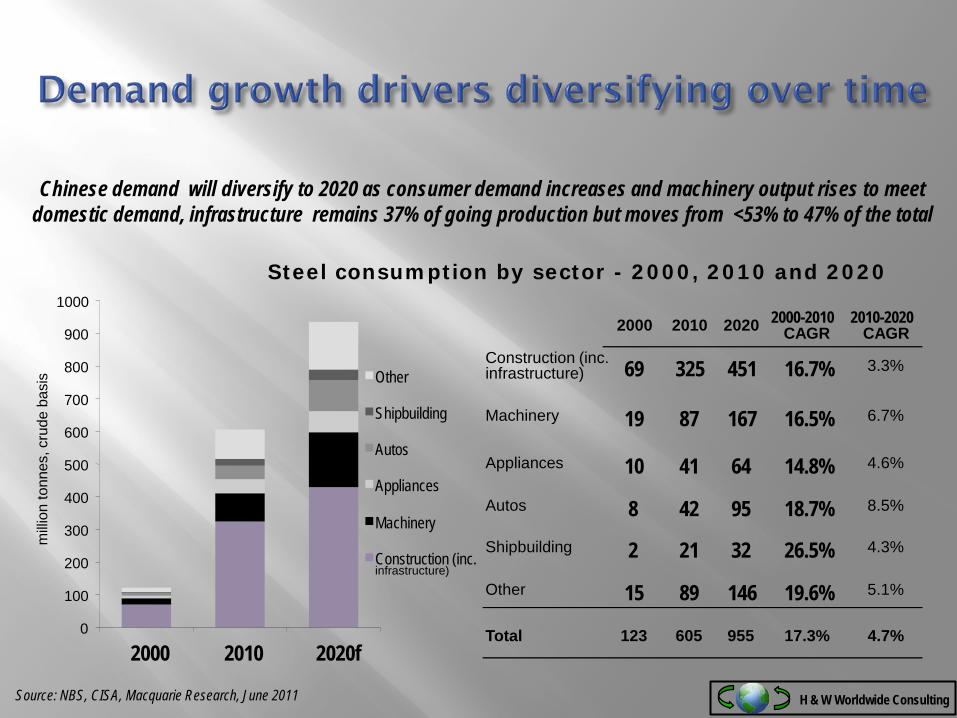
Steel consumption by sector - 2000, 2010 and 2020
Source: NBS, CISA, Macquarie Research, June 2011
2000 2010 2020 2000-2010 CAGR
2010-2020 CAGR
Construction (inc. infrastructure) 69 325 451 16.7% 3.3%
Machinery 19 87 167 16.5% 6.7%
Appliances 10 41 64 14.8% 4.6%
Autos 8 42 95 18.7% 8.5%
Shipbuilding 2 21 32 26.5% 4.3%
Other 15 89 146 19.6% 5.1%
Total 123 605 955 17.3% 4.7%0
100
200
300
400
500
600
700
800
900
1000
2000 2010 2020f
milli
on to
nnes
, cru
de b
asis Other
Shipbuilding
Autos
Appliances
Machinery
Construction (inc.infrastructure)
Chinese demand will diversify to 2020 as consumer demand increases and machinery output rises to meet domestic demand, infrastructure remains 37% of going production but moves from <53% to 47% of the total
H & W Worldwide Consulting
Source: worldsteel, Macquarie Research, June 2011
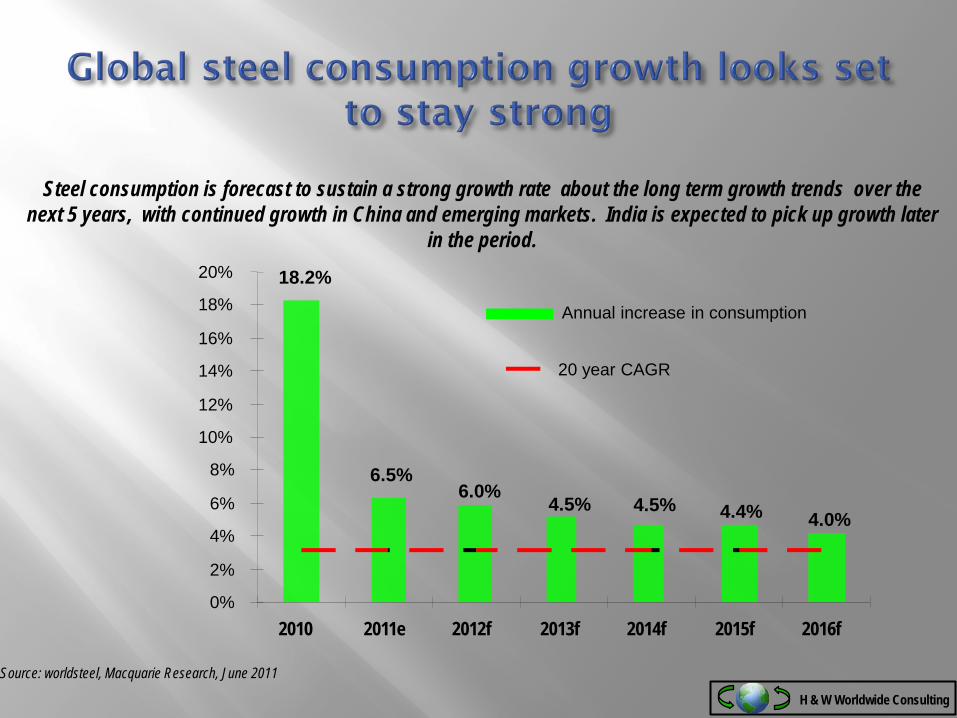
18.2%
6.5%6.0%
4.5% 4.5% 4.4% 4.0%
0%
2%
4%
6%
8%
10%
12%
14%
16%
18%
20%
2010 2011e 2012f 2013f 2014f 2015f 2016f
Annual increase in consumption
20 year CAGR
Steel consumption is forecast to sustain a strong growth rate about the long term growth trends over the next 5 years, with continued growth in China and emerging markets. India is expected to pick up growth later
in the period.
H & W Worldwide Consulting
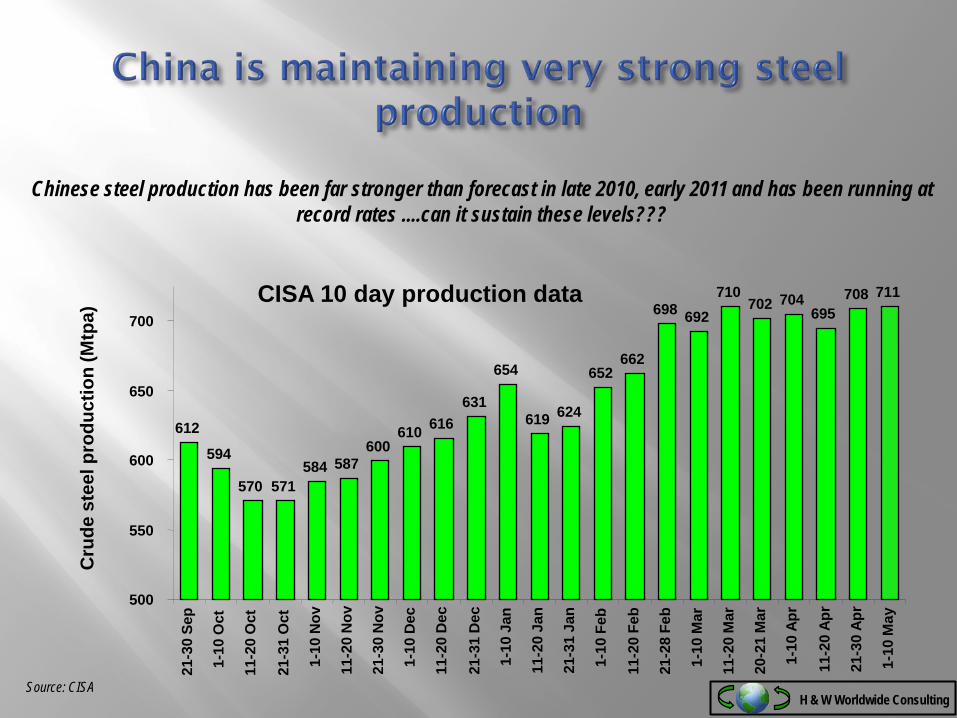
Source: CISA
CISA 10 day production data
612
594
570 571584 587
600610 616
631
654
619 624
652662
698 692710
702 704695
708 711
500
550
600
650
700
21-3
0 Se
p
1-10
Oct
11-2
0 O
ct
21-3
1 O
ct
1-10
Nov
11-2
0 N
ov
21-3
0 N
ov
1-10
Dec
11-2
0 D
ec
21-3
1 D
ec
1-10
Jan
11-2
0 Ja
n
21-3
1 Ja
n
1-10
Feb
11-2
0 Fe
b
21-2
8 Fe
b
1-10
Mar
11-2
0 M
ar
20-2
1 M
ar
1-10
Apr
11-2
0 Ap
r
21-3
0 Ap
r
1-10
May
Cru
de s
teel
pro
duct
ion
(Mtp
a)
Chinese steel production has been far stronger than forecast in late 2010, early 2011 and has been running at record rates ....can it sustain these levels???
H & W Worldwide Consulting
0100200300400500600700800900
1000
Australia South Africa
Brazil India NAFTA CIS China Europe North Asia
mill
ion
tonn
es
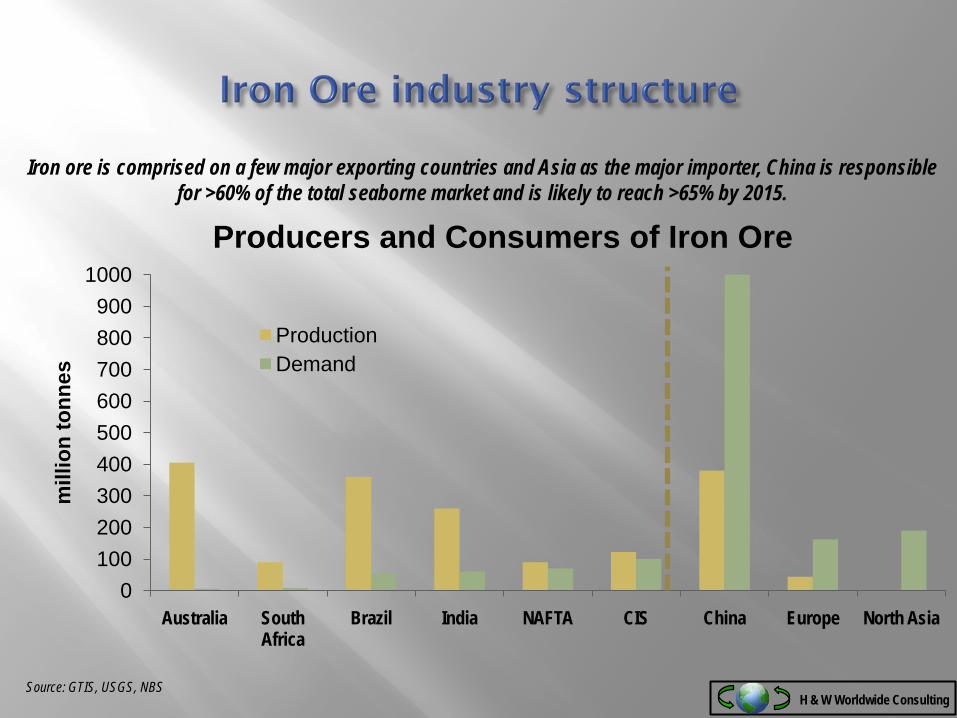
Producers and Consumers of Iron Ore
ProductionDemand
Source: GTIS, USGS, NBS
Iron ore is comprised on a few major exporting countries and Asia as the major importer, China is responsible for >60% of the total seaborne market and is likely to reach >65% by 2015.
H & W Worldwide Consulting
• Demand out look seems positive for next few years
• Hence the supply response will determine when the market comes back into “balance”
• But how quickly can new projects enter the market?
• What will the cost be?
H & W Worldwide Consulting
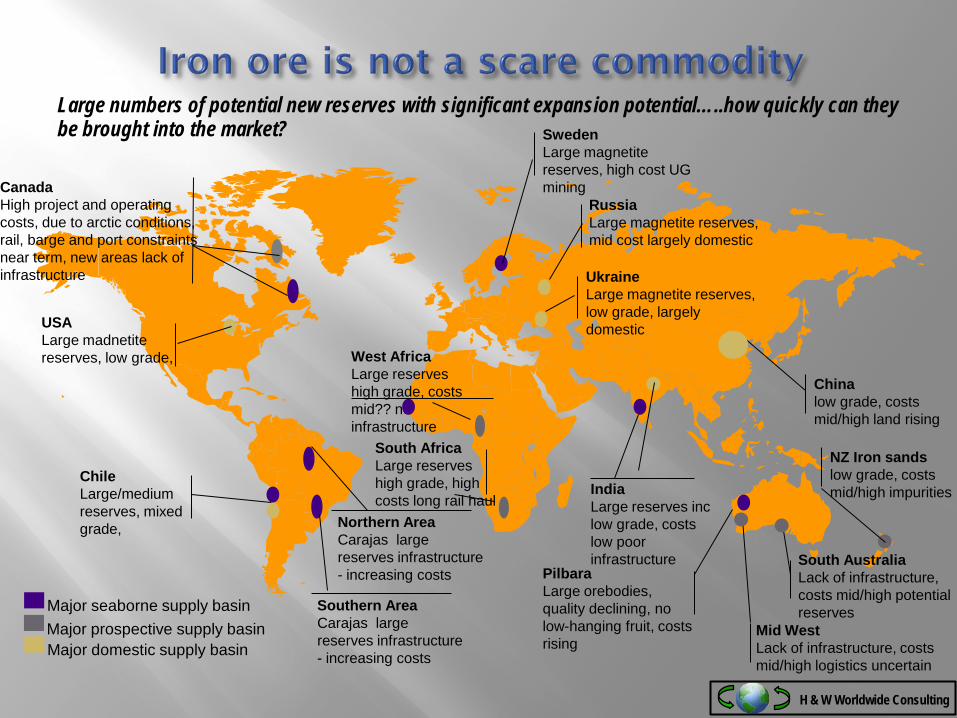
Major seaborne supply basinMajor prospective supply basinMajor domestic supply basin
Mid WestLack of infrastructure, costs mid/high logistics uncertain
Pilbara Large orebodies, quality declining, no low-hanging fruit, costs rising
Northern AreaCarajas large reserves infrastructure - increasing costs
CanadaHigh project and operating costs, due to arctic conditions, rail, barge and port constraints near term, new areas lack of infrastructure
Southern AreaCarajas large reserves infrastructure - increasing costs
SwedenLarge magnetite reserves, high cost UG mining
RussiaLarge magnetite reserves, mid cost largely domestic
UkraineLarge magnetite reserves, low grade, largely domestic
Chinalow grade, costs mid/high land rising
IndiaLarge reserves inc low grade, costs low poor infrastructure
West AfricaLarge reserves high grade, costs mid?? no infrastructure
South AfricaLarge reserves high grade, high costs long rail haul
USALarge madnetitereserves, low grade,
ChileLarge/medium reserves, mixed grade,
South AustraliaLack of infrastructure, costs mid/high potential reserves
NZ Iron sandslow grade, costs mid/high impurities
Large numbers of potential new reserves with significant expansion potential…..how quickly can they be brought into the market?
H & W Worldwide Consulting
• Logistics constraints
• Resources and Reserve Quality
• Rising Environmental and Political Pressures
• Costs – deepening pockets!!!
H & W Worldwide Consulting
100110120130140150160170180190200
Jan-
10
Feb-
10
Mar
-10
Apr
-10
May
-10
Jun-
10
Jul-1
0
Aug
-10
Sep
-10
Oct
-10
Nov
-10
Dec
-10
Jan-
11
Feb-
11
Mar
-11
Apr
-11
May
-11
US
$/t,
62%
Fe
CFR
N.C
hina
por
t
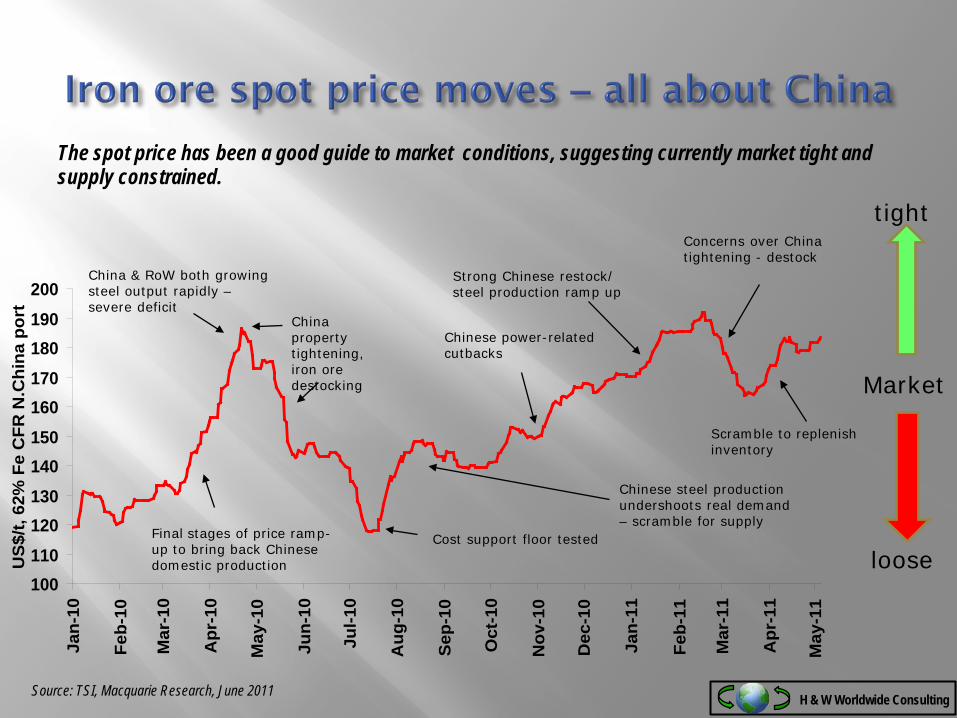
China & RoW both growing steel output rapidly –severe deficit
China property tightening, iron ore destocking
Final stages of price ramp-up to bring back Chinese domestic production
Chinese steel production undershoots real demand – scramble for supply
Chinese power-related cutbacks
Cost support floor tested
Strong Chinese restock/ steel production ramp up
Concerns over China tightening - destock
Scramble to replenish inventory
Source: TSI, Macquarie Research, June 2011
Market
loose
tight
The spot price has been a good guide to market conditions, suggesting currently market tight and supply constrained.
H & W Worldwide Consulting
Source: Mysteel, Port data, Macquarie Research, June 2011
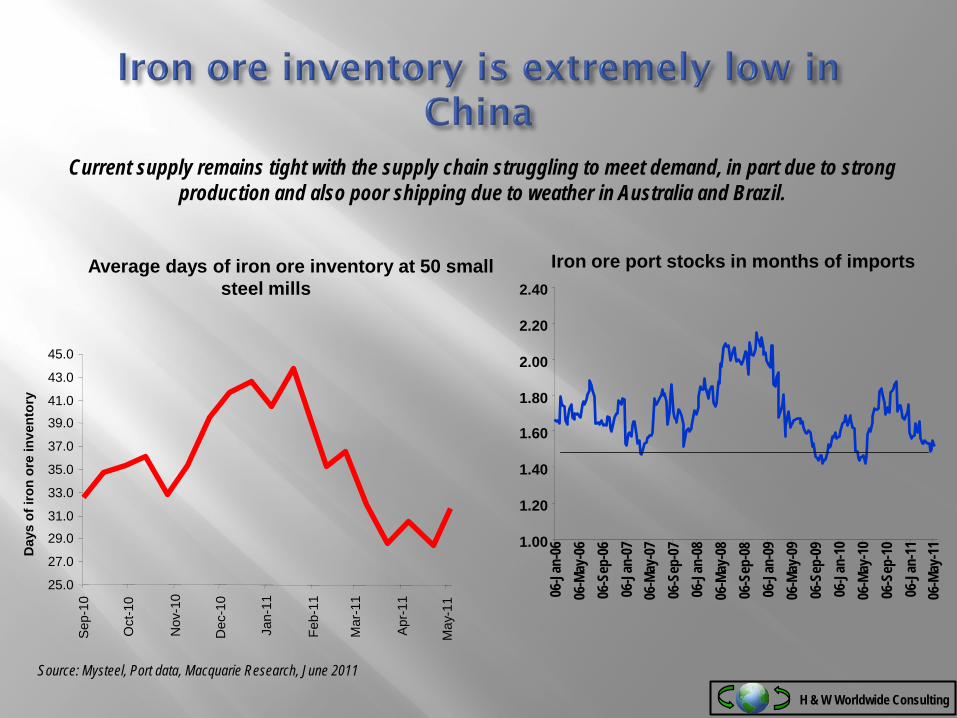
Iron ore port stocks in months of imports
1.00
1.20
1.40
1.60
1.80
2.00
2.20
2.40
06-J
an-0
606
-May
-06
06-S
ep-0
606
-Jan
-07
06-M
ay-0
706
-Sep
-07
06-J
an-0
806
-May
-08
06-S
ep-0
806
-Jan
-09
06-M
ay-0
906
-Sep
-09
06-J
an-1
006
-May
-10
06-S
ep-1
006
-Jan
-11
06-M
ay-1
1
Average days of iron ore inventory at 50 small steel mills
25.0
27.0
29.0
31.0
33.0
35.0
37.0
39.0
41.0
43.0
45.0
Sep-
10
Oct
-10
Nov
-10
Dec
-10
Jan-
11
Feb-
11
Mar
-11
Apr-
11
May
-11
Day
s of
iron
ore
inve
ntor
y
Current supply remains tight with the supply chain struggling to meet demand, in part due to strong production and also poor shipping due to weather in Australia and Brazil.
H & W Worldwide Consulting
Source: Shipping data, Macquarie Research, June 2011
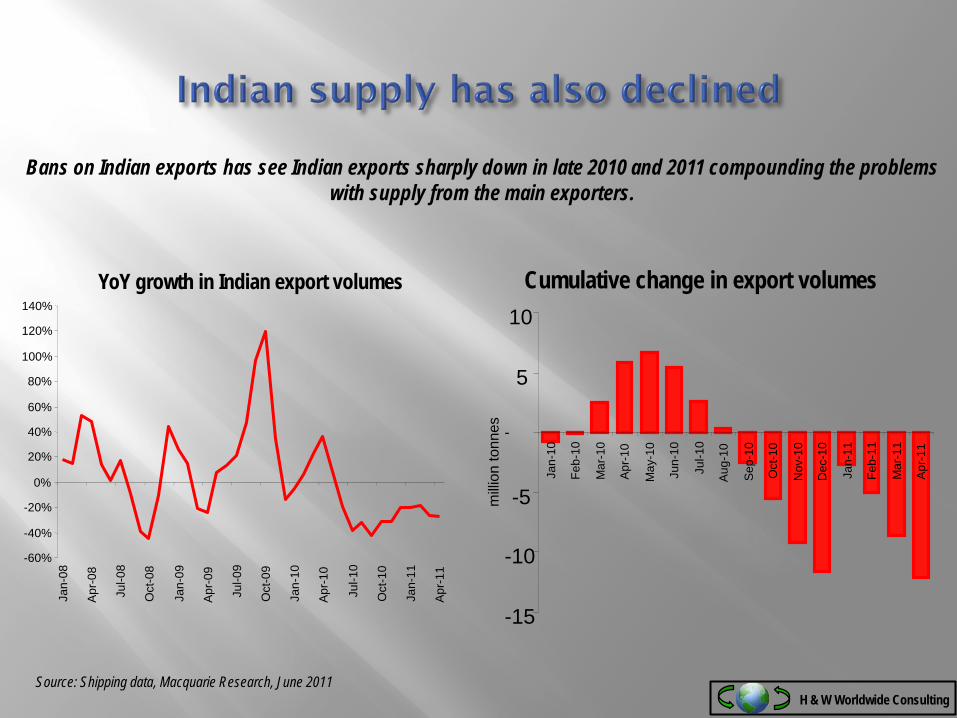
Cumulative change in export volumes
-15
-10
-5
-
5
10
Jan-
10
Feb-
10
Mar
-10
Apr
-10
May
-10
Jun-
10
Jul-1
0
Aug
-10
Sep
-10
Oct
-10
Nov
-10
Dec
-10
Jan-
11
Feb-
11
Mar
-11
Apr
-11
milli
on to
nnes
YoY growth in Indian export volumes
-60%
-40%
-20%
0%
20%
40%
60%
80%
100%
120%
140%
Jan-
08
Apr
-08
Jul-0
8
Oct
-08
Jan-
09
Apr
-09
Jul-0
9
Oct
-09
Jan-
10
Apr
-10
Jul-1
0
Oct
-10
Jan-
11
Apr
-11
Bans on Indian exports has see Indian exports sharply down in late 2010 and 2011 compounding the problems with supply from the main exporters.
H & W Worldwide Consulting

0
50
100
150
200
250
2009 2010 2011
mill
ion
tonn
es
Chinese iron ore imports fines and lump
PakistanKenyaJapanTurkeyKorea, SouthLiberiaQatarLibyaAzerbaijanArgentinaHondurasSwedenNew ZealandPhilippinesUnited StatesThailandNorwayKazakhstanKorea, NorthMyanmarVietnamMexicoMalaysiaVenezuelaCanadaMongoliaMauritaniaRussiaChileUkrainePeruIndonesiaIranSouth AfricaIndiaBrazilAustralia
0
2
4
6
8
10
12
14
16
2009 2010 2011
mill
ion
tonn
es
Chinese pellet imports VietnamMalaysiaMacauPeruNorwaySaudi ArabiaThailandKorea, NorthTrinidad & TobagoUnited Arab EmiratesQatarIndonesiaPhilippinesMexicoVenezuelaUnited StatesAustraliaBahrainChileIndiaSwedenIranKazakhstanUkraineRussiaCanadaBrazilSource: GTIS
Rising fines and pellets as production increased, changes in supply evident as Indian fines decline by 23% YTD and pellet imports double to >14Mt or ~42Mtpa!!!!
H & W Worldwide Consulting

Pressures due to rising costs have seen capex rise very sharply and the cost curve steepen over time. Future capex is estimated at US$183/t for BHPBillitin’s next phase to 240Mtpa, straining the supply response.
Source: BHP Billiton announcements; Macquarie Research H & W Worldwide Consulting

Analysis of delivery of new capacity has shown that ~55% of new capacity announced in 2008 did not materialize., other analysis has supported this view.
Source: BHP Billiton analysisH & W Worldwide Consulting

Source: BHP Billiton analysis
Analysis of delivery of new capacity predicts that delivered production will severely lag announced capacity, thus keeping the market tighter for longer.
Rate of bringing on new supply depends on:-
• Infrastructure and logistics
• Land access
• Political factors
• Environmental approvals
• Quality of new ores
H & W Worldwide Consulting
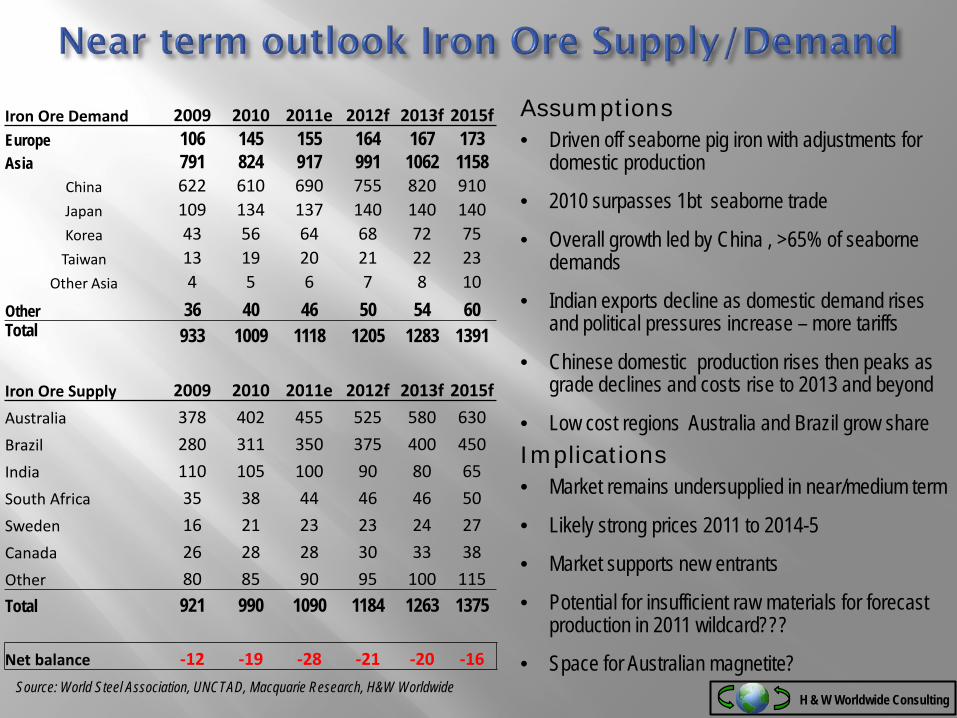
Assumptions• Driven off seaborne pig iron with adjustments for
domestic production
• 2010 surpasses 1bt seaborne trade
• Overall growth led by China , >65% of seaborne demands
• Indian exports decline as domestic demand rises and political pressures increase – more tariffs
• Chinese domestic production rises then peaks as grade declines and costs rise to 2013 and beyond
• Low cost regions Australia and Brazil grow shareImplications• Market remains undersupplied in near/medium term
• Likely strong prices 2011 to 2014-5
• Market supports new entrants
• Potential for insufficient raw materials for forecast production in 2011 wildcard???
• Space for Australian magnetite?Source: World Steel Association, UNCTAD, Macquarie Research, H&W Worldwide
H & W Worldwide Consulting
Iron Ore Demand 2009 2010 2011e 2012f 2013f 2015fEurope 106 145 155 164 167 173Asia 791 824 917 991 1062 1158
China 622 610 690 755 820 910Japan 109 134 137 140 140 140Korea 43 56 64 68 72 75
Taiwan 13 19 20 21 22 23Other Asia 4 5 6 7 8 10
Other 36 40 46 50 54 60Total 933 1009 1118 1205 1283 1391
Iron Ore Supply 2009 2010 2011e 2012f 2013f 2015f
Australia 378 402 455 525 580 630
Brazil 280 311 350 375 400 450
India 110 105 100 90 80 65
South Africa 35 38 44 46 46 50
Sweden 16 21 23 23 24 27
Canada 26 28 28 30 33 38
Other 80 85 90 95 100 115
Total 921 990 1090 1184 1263 1375
Net balance -12 -19 -28 -21 -20 -16
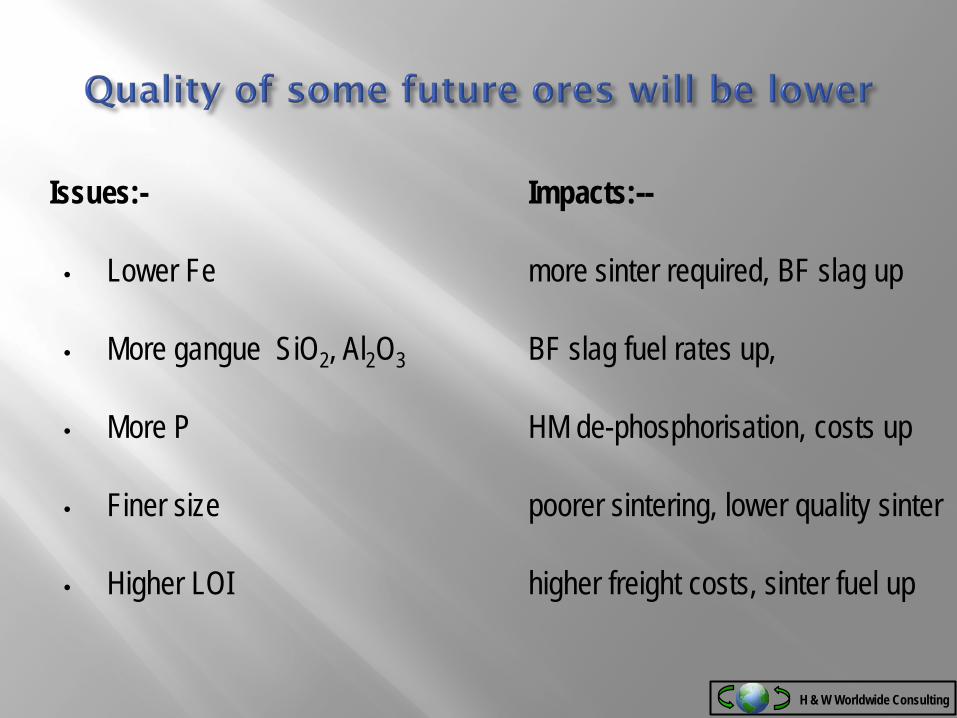
Issues:- Impacts:--
• Lower Fe more sinter required, BF slag up
• More gangue SiO2, Al2O3 BF slag fuel rates up,
• More P HM de-phosphorisation, costs up
• Finer size poorer sintering, lower quality sinter
• Higher LOI higher freight costs, sinter fuel up
H & W Worldwide Consulting

Source: Rio Tinto, Vale June 2011
Divergence of views of pricing between the three majors. Vale seeking quarterly pricing and some VIU adjustments; Rio Tinto looking at range of flexible mechanisms of variable contract length with possible development of lump and pellet indices, BHPBilliton seeking shorter term pricing and increased use of indices –more uncertainty ahead with more opacity??
H & W Worldwide Consulting
0
1000
2000
3000
4000
5000
6000
7000
01/05/09 01/08/09 01/11/09 01/02/10 01/05/10 01/08/10 01/11/10 01/02/11 01/05/11
ICEXNOS ClearingCME GroupLCH.ClearnetSGX
US$ (m)
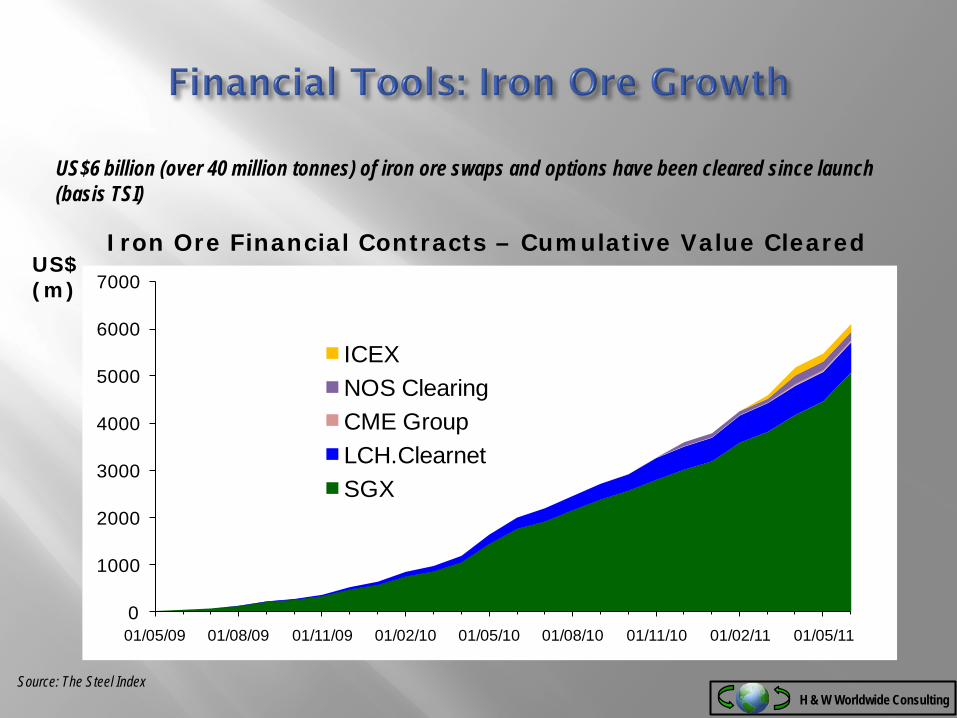
Iron Ore Financial Contracts – Cumulative Value Cleared
US$6 billion (over 40 million tonnes) of iron ore swaps and options have been cleared since launch (basis TSI)
Source: The Steel IndexH & W Worldwide Consulting

• Overall demand and supply suggests iron ore should remain a “star” for a further 3-4 years
• Although significant new capacity is planned delays are highly likely keeping the market tight
• Declining future quality in grade and size will present challenges to steelmakers in sinter, BF & BOF
• Rising uncertainty in pricing mechanism will continue as the market settles on new processes


