Noise Control ● Sound Measurement ● Consultation Richard R. James Community ● Industrial ● Residential ● Office ● Classroom ● HIPPA Oral Privacy Principal P.O Box 1129, Okemos, MI, 48805 Tel: 517‐507‐5067 rickjames@e‐coustic.com Fax: (866) 461‐4103 REVIEW OF NOISE STUDIES AND RELATED MATERIAL SUBMITTED REGARDING EAST COUNTY SUBSTATION/TULE WIND/ENERGIA SIERRA JUAREZ GEN‐TIE PROJECTS DATE:MARCH 4, 2011 Introduction This review was conducted on behalf of Backcountry against Dumps, Inc.1 for their public comments on the PUC/BLM DEIR/DEIS for the proposed East County Substation/Tule Wind/Energia Sierra Juarez Gen-Tie Projects, (referred to here as the proposed "Project"). The State Clearinghouse Number is: 2009121079 (DOI-BLM-CA-D070-2010-0027-EIS (ECO Sub) and DOI- BLM-CA-D070-2008-0040-EIS (Tule Wind)). Although, the focus is on the Applicant's Environmental Document (Section 3.12 Noise) and the Tule Wind Project Draft Noise Analysis Report conducted on behalf of Iberdrola by HDR Engineering for the Tule Wind Project, comments and concerns expressed in this review should be considered as applying to all of the proposed Project, as appropriate for any differences. My work with local communities and citizens groups around the U.S. and Ontario, Canada has focused on the question of how to integrate industrial wind turbines into rural communities. I would like to share my concerns about siting criteria for modern industrial scale wind turbines. I have visited sites throughout the Midwest from western Iowa to the coast of Maine and Ontario to West Virginia where wind turbines were either operating or proposed. I have also reviewed the noise criteria and setbacks proposed by States, Provinces and local government bodies for wind farms. This has given me broad exposure to a number of different situations each with their own requirements. Based on this I find three issues that have a particular importance for my report. I would like to focus on several points: First, setbacks, from property lines to the nearest turbine of less than 2 kilometers (1.25 miles) are clearly inadequate for most quiet rural communities. The presence of nearby will not mask or otherwise offset the noise from wind turbines. 2 Wind turbine noise is distinctively annoying. The reports and documents submitted on behalf of the Project do not correctly or adequately describe the impact of the proposed project on the host community, or its residents whose homes and properties are close to the footprint of the project. This distance may seem extreme but is needed based on the experiences of communities with other wind turbine projects. People living at distances up to 1 mile from wind turbines on flat land and, for turbines located on ridges above the homes at distances of up to 2 miles are experiencing adverse health effects from sleep disturbance at night from audible turbine noise. Other aspects of wind turbine sound emissions, especially amplitude modulated infra and low frequency sounds that may not be reach the threshold of audibility are currently believed to be caused by vestibular disturbances from rapid modulations of the infra and low frequency sound. 1 Backcountry Against Dumps, Donna Tisdale, President, P.O. Box 1275, Boulevard, CA 91905 2 Pedersen, E., van den Berg, F., Why is Wind Turbine Noise poorly masked by road traffic noise?, Inter‐noise 2010, Lisbon, Portugal June 13‐16, 2010 (invited paper)
Transcript
Noise Control ● Sound Measurement ● Consultation Richard R. James Community ● Industrial ● Residential ● Office ● Classroom ● HIPPA Oral Privacy Principal P.O Box 1129, Okemos, MI, 48805 Tel: 517‐507‐5067 rickjames@e‐coustic.com Fax: (866) 461‐4103
REVIEW OF NOISE STUDIES AND RELATED MATERIAL SUBMITTED REGARDING
EAST COUNTY SUBSTATION/TULE WIND/ENERGIA SIERRA JUAREZ GEN‐TIE PROJECTS DATE: MARCH 4, 2011
Introduction
This review was conducted on behalf of Backcountry against Dumps, Inc.1 for their public comments on the PUC/BLM DEIR/DEIS for the proposed East County Substation/Tule Wind/Energia Sierra Juarez Gen-Tie Projects, (referred to here as the proposed "Project"). The State Clearinghouse Number is: 2009121079 (DOI-BLM-CA-D070-2010-0027-EIS (ECO Sub) and DOI-BLM-CA-D070-2008-0040-EIS (Tule Wind)).
Although, the focus is on the Applicant's Environmental Document (Section 3.12 Noise) and the Tule Wind Project Draft Noise Analysis Report conducted on behalf of Iberdrola by HDR Engineering for the Tule Wind Project, comments and concerns expressed in this review should be considered as applying to all of the proposed Project, as appropriate for any differences.
My work with local communities and citizens groups around the U.S. and Ontario, Canada has focused on the question of how to integrate industrial wind turbines into rural communities. I would like to share my concerns about siting criteria for modern industrial scale wind turbines.
I have visited sites throughout the Midwest from western Iowa to the coast of Maine and Ontario to West Virginia where wind turbines were either operating or proposed. I have also reviewed the noise criteria and setbacks proposed by States, Provinces and local government bodies for wind farms. This has given me broad exposure to a number of different situations each with their own requirements. Based on this I find three issues that have a particular importance for my report.
I would like to focus on several points:
First, setbacks, from property lines to the nearest turbine of less than 2 kilometers (1.25 miles) are clearly inadequate for most quiet rural communities. The presence of nearby will not mask or otherwise offset the noise from wind turbines.2 Wind turbine noise is distinctively annoying. The reports and documents submitted on behalf of the Project do not correctly or adequately describe the impact of the proposed project on the host community, or its residents whose homes and properties are close to the footprint of the project. This distance may seem extreme but is needed based on the experiences of communities with other wind turbine projects. People living at distances up to 1 mile from wind turbines on flat land and, for turbines located on ridges above the homes at distances of up to 2 miles are experiencing adverse health effects from sleep disturbance at night from audible turbine noise. Other aspects of wind turbine sound emissions, especially amplitude modulated infra and low frequency sounds that may not be reach the threshold of audibility are currently believed to be caused by vestibular disturbances from rapid modulations of the infra and low frequency sound.
1 Backcountry Against Dumps, Donna Tisdale, President, P.O. Box 1275, Boulevard, CA 91905 2 Pedersen, E., van den Berg, F., Why is Wind Turbine Noise poorly masked by road traffic noise?, Inter‐noise 2010, Lisbon, Portugal June 13‐16, 2010 (invited paper)
Page 2 Subject: Review of Noise Studies and Related Material March 4, 2011
Second, background sound levels submitted on behalf of the Project's developers and/or operators often include sounds of short term events and 'wind noise' are reported. The measurements used to collect this information do not meet any recognized national or international standard3. Instead a novel procedure is substituted for recognized standard measurement procedures. The end result is a biased assessment of background sound levels that overstates the background sound levels of the community by as much as 10 to 15 dBA. Use of this data to evaluate the potential for negative impacts of the people living near the project as defined in the CEQA Guidelines leads to a conclusion that the wind turbine noise will not be a source of noise pollution4 at the homes and properties near the project. Had the background noise been properly measured the conclusion would be that the Project will have a significant impact on the adjacent communities and wilderness areas.
Third, computer model estimates of operational sound levels from the proposed projects understate the impact of the turbines on the community.
Fourth, information provided by representatives and experts for the Project, on topic of health risks, infra and low frequency noise, noise limits and setbacks, background sounds in rural communities and computer modeling studies are incorrect, incomplete or otherwise misleading. The assertions that there is no research supporting a concern that wind turbine sound emissions at receiving properties and homes and cannot result in adverse health effects do not reflect current understanding of independent medical and acoustical research.
Had the background studies met the procedural and protocol requirements of the American National Standards Institute's (ANSI) S12.9 and S12.18 standards for measuring environmental sounds outdoors the study would have reported much lower background sound levels. The Project would have a "significant impact" under the rules of the CEQA Guidelines (Appendix G (VII)). Had the modeling properly addressed the increased sound power emitted by wind turbines from atmospheric conditions, rough downwind topography from the large boulders and outcroppings on the sides of the ridges, and small inter-turbine spacing, the dBA and dBC sound levels predicted for the sensitive receiving locations would have been much higher. These conditions include those of:
nighttime atmosphere with a stable boundary layer (temperature inversion) and high wind shear above that boundary layer (e. g. high wind shear),
periods of atmospheric turbulence, as is likely for turbines mounted on high locations with rough terrain, and
inter-turbine wake-induced turbulence created when turbines are located in rows with inter-turbine spacing of less than 5 to 7 rotor diameters (new information indicates this may need to be more like 10 to 15 rotor diameters) to prevent inter-turbine wake turbulence. Turbines in the current layout are as close as 3 rotor diameters or less.
The specific CEQA rules that define when an impact is significant that would not be met if the background noise study and computer modeling had met the been conducted according to the practices identified in this report are:
3 ANSI‐ASA S12.9 Part 2, (R2008) Measurement Of Long‐Term, Wide‐Area Sound, ANSI‐ASA S12.9 Part 3 (1993 R 2008) Short Term Measurements with Observer Present, ANSI‐ASA_S12.9_Part_1_(R_2003) Quantities and Procedures for Description and Measurement of Env. Sound, and ANSI‐ASA_S12.18‐1994_(R2009) Procedures for Outdoor Measurement of SPL. 4 Noise pollution: the emission of sound that unreasonably interferes with the enjoyment of life or with any lawful business or activity.
Page 3 Subject: Review of Noise Studies and Related Material March 4, 2011
Exposure of persons to or generation of noise levels in excess of standards established in the local general plan or noise ordinance, or applicable standards of other agencies;
• A substantial permanent increase in ambient noise levels in the project vicinity above levels existing without the project;
The combination of the above negative factors in the reports prepared as submittals regarding the Project's wind turbine noise emissions/pollution will result in sleep disturbance for a significant fraction of those who live within a mile away. Chronic sleep disturbance results in serious health effects. For a smaller portion of the community, there will be a risk of the adverse health effects currently described as Wind Turbine Syndrome mediated through the body's organs of balance (vestibular) and proprioception. This is a different set of symptoms and causes than what would be expected of higher levels of infra and low frequency sound and are not related to the audibility of the ILFN. The reports and other documents provided by the developer's of the Project focus on the adverse health effects that occur when the sound pressure level of the noise source exceeds the Threshold of Perception. The adverse health effects of concern are not related to this set of health effects. They are a result of modulated infra and low frequency sounds at levels below the threshold of audibility.
The result of these technical flaws along with an outdated understanding of how the human body responds to acoustical energy below the threshold of perception leads to a conclusion that if the Project, as proposed, is approved, it will, with a high degree of certainty, have negative noise impacts that are "significant."
I have reviewed the Applicant's Environmental Document, Section 3.12 Noise, and the Tule Wind Project Draft Noise Analysis Report prepared for Iberdrola by HDR Engineering of Minneapolis, Minnesota. I have also had the opportunity to review similar documents prepared for other wind turbine projects by HDR and other acoustical consulting groups that work for the wind turbine project developers. My experience with industrial wind projects leads me to conclude that wind turbine utilities that produce sound levels at the properties and homes of people adjacent or within the Project will exceed the 40 dBA (L(night-outside) limit provided by the World Helath Organization (WHO) for safe and healthful sleep. It will result in a high level of community complaints of both noise pollution, sleep disturbance, and nuisance. In addition, there is mounting evidence that for the more sensitive members of the community, especially children under six, people with pre-existing medical conditions, particularly those with diseases of the vestibular system and other organs of balance and proprioception, and seniors with existing sleep problems will be likely to experience serious health risks.
The review will address a number of topics. Those topics include:
Discussion of terms and standards,
Discussion of weather and its effect on turbines
Discussion of spacing and its effects on turbine noise
San Diego County CNEL of 45 requires that one hour Leq to be 37.7. A limit of 40 dBA Leq outside a home (per WHO for nighttime noise) would just slightly exceed the CENL of 45 limit.
An Overview summarizing deficiencies in the Draft Noise Analysis Report (October 2010) by HDR Engineering Inc, Minneapolis, MN. (referred to as "HDR")
Description of wind turbine noise as a source of environmental noise exposure and noise pollution for humans
Page 4 Subject: Review of Noise Studies and Related Material March 4, 2011
Specific issues with the Noise Analysis Report produced regarding the Project
Evidence that the Project noise will exceed the permitted levels,
Comments on the potential risks to health and welfare of persons living near the footprint of the Project specifically regarding wind turbine noise.
Review of Terms and Standards
Terms
LAeq: The equivalent energy level in dBA. A measure of the acoustic energy over some interval of time that expresses the total energy of time-varying sound as a single number. Leq is very sensitive to short duration high amplitude events. A one hour Leq measurement in a quiet rural area with sound levels of 25 dBA for 59 minutes will have an Leq of 42.3 dBA if, during that hour, a short term noise, such as a vehicle pass-by on a nearby road, raises the sound level to 60 dBA for one minute. Leq is not a good descriptor for the background sound level in a quiet community where there are extremes between the residual sound (all sounds from afar that are not short term) and short term events that have high sound levels.
LAn: A statistical value determined by sampling sounds for some period of time, often 10 minutes to an hour, but it could also be longer, constructing a histogram. The LA90 would be the sound level representing the quietest 10% of the time. It is traditionally associated with the long term background sound level or residual sound level. The LA10 would be the sound level representing the noisiest 10% of the time. It is traditionally used as a descriptor of noisiness. The LA50 would be the sound level representing the median of the distribution of sound levels. The LA50 is not the same as LAeq. However, the LA50 is less sensitive to short term events and thus is often used to represent an 'average' sound level.
Ambient sound5: at a specified time. the all encompassing sound associated with a given environment, being usually a composite of sound from many sources at many directions, near and far, including the specific sound source(s) of interest.
Residual sound5: at a specified time, the all-encompassing sound, being usually a composite of sound from many sources from many directions, near and far, remaining at a given position in a given situation when all uniquely identifiable discrete sound sources are eliminated, rendered insignificant, or otherwise not included. Specified in S12.9, Part 1 the residual sound may be approximated by measuring the percentile sound level exceeded during 90 to95 percent of the measurement period (e.g. LA90).
Background sound5: all-encompassing sound associated with a given environment without the contributions from the source or sources of interest. In S12.9, Part 3, background sound is described as a combination of (one) Long-term background sound, and (two) short-term background sounds, with the durations for long and short defined according to application and situation.
Long-term background sound5: background sound measured during a measurement, after excluding the contribution of short-term background sounds in accordance with one of the methods specified in the standard S12.9, Part 3. Long-term background sound is assumed to be approximately stationary in a statistical sense6, over the measurement duration, and it is describe
5 Reference standards are S12.9 parts 1 and 3 for these definitions. 6 Seasonal and weather related sounds such as insects, birds, wind rustle in dry leaves, should also be considered short term sounds for the purpose of measuring the long term background sound level. In addition, the test instruments shall
Page 5 Subject: Review of Noise Studies and Related Material March 4, 2011
solely by its sound exposure per unit time (in each frequency-weighted or frequency-filtered band of interest).
Short-term background sound5: background sound associated with one or more sound events which occur infrequently during the basic measurement period, the measurement interval with or without the source operating, and measured in accordance with one of the methods in the standard S12.9, Part 3.
Note: the sound exposure and time of occurrence of short-term background sounds cannot be described statistically during the basic measurement period. Examples of short-term background sounds include sounds from such sources as: a nearby barking dog, accelerating motor vehicle, radio music siren and aircraft flyover etc.
Standards Used in Assessing Land‐Use Compatibility
EPA Levels Document (1973): In the 1970's the EPA operated an Office of Noise Abatement and Control (ONAC) that was tasked with promulgating standards for communities and other non-occupational environments. In 1973, the EPA published the 'Levels" document which provided a resource for communities that were developing local or state level noise ordinances. This work was primarily focused on the needs of urban and sub-urban communities with existing noise exposure. The body of the document presents information for this target audience. For communities with different soundscapes, such as rural communities the tables and graphs presented in the body of the document were not appropriate. To address the needs of
these other communities the Levels document included an Appendix that provided a method for adjusting the recommendations for noise exposed urban and suburban environments to account for differences from the urban/suburban ones. Table-7 in the Figure 1 shows the adjustment factors that are to be added to the 55/45 Ldn for the noise exposed urban/suburban environment to normalize the data to the equivalent annoyance level. For example, an urban or suburban community with prior experience with noise might find sound levels of 55 dBA during the day and 45 dBA during the night to be satisfactory. For a rural community with
not be located near roads, poles, fences, trees, walls or other reflecting surfaces or sources of local noise not representative of the larger community. This also includes streams and locations near roads.
Figure 1- Table and Figure D-7 from EPA Levels Document (1973)
Page 6 Subject: Review of Noise Studies and Related Material March 4, 2011
prior noise exposure these levels would not be appropriate. Applying the +10 dB normalizing factor to Figure-7 results in an Ldn of 65 dB. Thus, the 45 dBA night and 55 dBA day sound levels that produce little or no negative community response from an urban/suburban population with prior noise exposure will result in widespread complaints and threats of legal action if they are experienced in a rural community. To avoid complaints the rural community Ldn must not exceed 45 dBA during the day and 35 dBA at night. If the rural community had no prior experience with noise exposure then an additional 5 dB is added to the normalization process. This would result in a nighttime limit of 30 dBA and a daytime limit of 40 dBA to avoid complaints.
ANSI S12.9 Part 4 (R_2005): Noise Assessment and Prediction of Long‐term Community Response
In 1980 the ONAC was defunded by the administration and has remained unfunded since that time. To cover the loss of the EPA the Acoustical Society of America (ASA) and the American National Institute (ANSI) promulgated a standard that incorporated the same basic concepts as the EPA Levels document and the normalizing process of Table and Figure D-7. This standard can be applied to assess a community's response to a new noise source. It will result in the same recommendations for a rural community as the EPA document. For a non-noise exposed rural community ANSI S12.9 Part 4 sets the nighttime sound level at 30 dBA (Leq) and the daytime to 40 dBA (Leq).
Standards for Computer Modeling of Sound Propagation
ISO 9613‐2: Acoustics‐Attenuation of Sound during propagation outdoors, Part 2: General Method of Calculation: This standard specifies engineering methods for calculating the attenuation of sound during propagation outdoors in order to predict the levels of environmental noise at a distance from a variety of noise sources. The method is applicable, in practice, to a great variety of noise sources environments. It is applicable, directly or indirectly, to most situations concerning road or rail traffic, industrial noise sources, construction activities, and many other ground based noise sources. It does not apply to sound from aircraft in flight, or to blast waves from mining, military, or similar operations. It is validated only for noise sources that are located close to the ground (approximately 30 m difference between the source and receiver height). It is also limited to noise sources that are within 1000 m of the receiving location. Meteorological conditions are limited to wind speeds of approximately 1 m/s and 5 m/s when measured at a height of 3 m to 11 m above the ground. When all constraints, including these, are met by the situation being modeled the procedure is accurate within a +/- 3 dB range. Its use has not been validated by any independent peer-reviewed process for use in siting wind turbines. However, it became the practice in the mid-1990s to use commercial software packages for modeling a general-purpose industrial and traffic noise such as the Cadna/A software package which is based upon this iso-standard for wind turbine projects in Britain and many of its ex-colonies. This practice was promoted by the British Wind Energy Association (BWEA) and trade associations in other countries. This practice was not followed by many of the countries in the European Union because of their concern about the limitations of the method not being applicable to wind turbines. For example, there are alternate models that have been developed specifically for wind turbines in the Nordic countries. These models, have been validated by peer-reviewed independent studies and used in those countries.
The Swedish EPA has recently promoted a modeling algorithm for wind turbines that applies both for onshore and offshore turbines. This model incorporates enhancements to the iso-9613 part 2 algorithms that address the specific characteristic of wind turbine sound omissions to propagate at a decay rate of 3 dB per doubling of distance for distances of several hundred meters away from the turbine. The ISO-Standard assumes propagation occurs at the decay rate of 6 dB per doubling of
Page 7 Subject: Review of Noise Studies and Related Material March 4, 2011
distance. Later in this report the results of applying the Swedish model to the Project will be discussed and the impact of that model on sound levels both close to the turbines and at greater distances will be presented. Although it may be argued that the ISO-Standard is commonly used for wind turbine projects, it must be noted that there are many wind turbine projects where the initial models indicated there would be no problems that once operation started exhibit problems. Use of a model that understates real-world operational sound levels is a very likely cause of this problem.
IEC 61400‐Part 11: acoustic noise measurement techniques: The purpose of this standard is to provide a uniform methodology that will ensure consistency and accuracy in the measurement and analysis of acoustical emissions by wind turbine generator systems. The standard was prepared for application to wind turbine manufacturers trying to meet well-defined acoustical emission performance requirements, and the purchaser in specifying such requirements. This standard is used to determine the sound power level emitted by wind turbines under conditions defined as normal operation. Normal operation is specified as weather conditions that are not severe and represent operation with low wind shear. Such conditions are normally defined as a "neutral" or "unstable"
atmosphere where the windshear will generally be in the range of 0.15 or less and in general under 0.20. This weather condition is commonly observed during daytime of warm seasons and in particular can be described as a warm sunny afternoon in the temperate zone. Under low wind shear conditions the wind speed does not increase significantly between the height where the blade is lowest in this rotation and the top where it is at its highest peak. This allows the anemometer located on the turbine's hub to calculate the
optimum angle of attack of the blades and RPM of the hub for maximum efficiency in extracting energy. Because
inefficiency in extracting energy results in increased noise, heat, turbulence, and additional stresses on the blades the lowest noise immission condition for wind turbine is when it is most efficiently extracting energy from the wind. In a paper by William Palmer, P.ENG., Ontario Canada the effect of varying wind shears on wind turbine noise is explored7. Figure 2 shows an example of the optimal weather conditions for a windshear of 0.14 with no stability layer (temperature inversion boundary). The second best situation is a higher-level windshear such as 0.44 again without a stable boundary layer. However, because there will be a significant difference in the wind speed at the bottom and at the top of the blades rotation path the windshear of 0.44 will be more difficult for the turbine to find the optimum operating mode then for the 0.14 windshear. Both of these conditions follows a logarithmic relationship described as the Power Law which permits the estimation of a wind speed at some arbitrary height such as the hub from the wind speed at a lower height such as a 10 m meteorological tower.
7 Palmer, W. P,Eng, "A new explanation for Wind Turbine Whoosh, Wind Shear," Third International Meeting on Wind Turbine Noise, Aalborg, Denmark, June 2009.
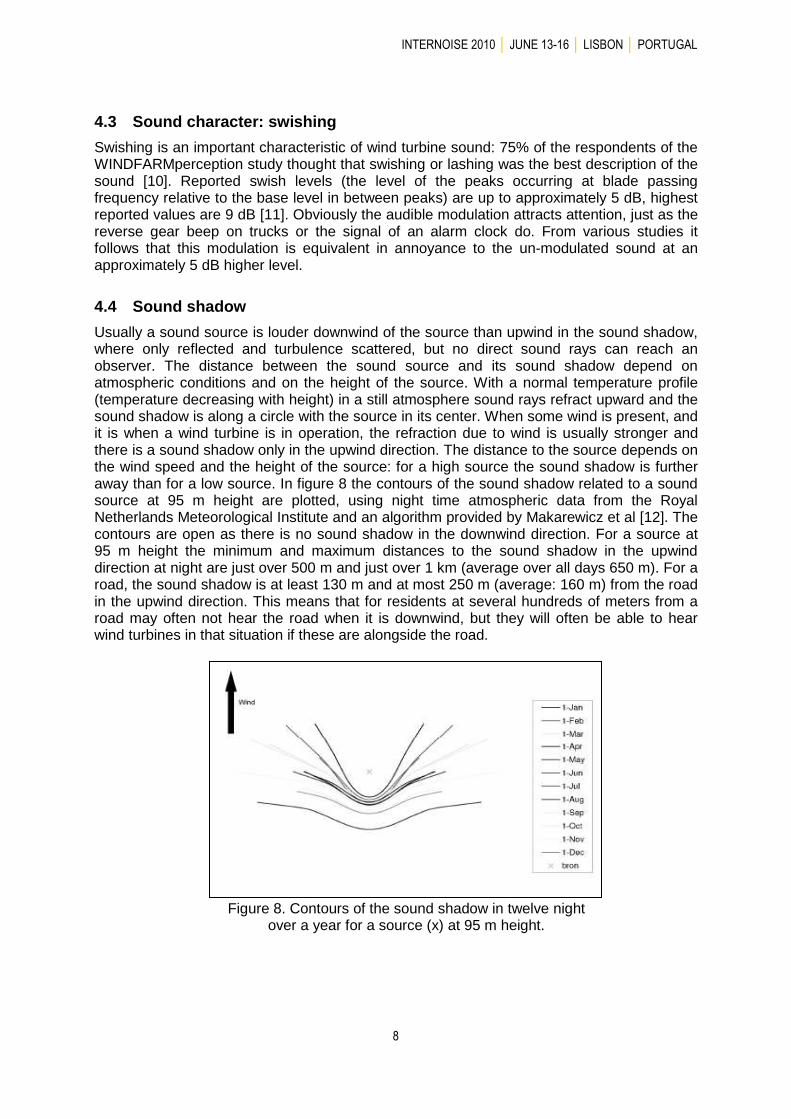
Figure 2- Example of wind shear in neutral and stable atmospheres
Page 8 Subject: Review of Noise Studies and Related Material March 4, 2011
At night, after the sun's heating of the ground stops, the ground cools. The convection currents present in the daytime that cause the warmed air next the ground to rise upwards mixing with the upper level winds in a smooth gradient also stop. A cool layer of air forms that surface and get some altitude often between 20 m 200 m above the ground a boundary layer forms where the cool air meets the warmer higher-level air. This boundary layer causes a complete disconnect between the wind speeds below it and above it. Below the boundary layer winds are often calm or even still. There is insufficient wind to cause leaf rustle or other sounds associated with surface level winds. Figure 2 which is extracted from Mr. Palmer's paper shows the stable boundary at 40 m by stopping the markers for windshear at that height. These are the two curves on the left side of the figure. It is important to understand, that when a stable boundary layer forms the winds above the boundary layer are often moving at a very high rate and that rate increases rapidly with height. It is not uncommon to see wind shear coefficients of 0.7 to 1.0 or higher when these conditions form.
To compound the situation, if the stable boundary layer forms at an elevation higher than the bottom of the blades rotation path the blade will descend into it. Under these conditions the turbine blades which are under wind load above the stable boundary layer lose that load when they enter the still air below the boundary layer. This is situation that the turbine operating system which depends upon hub level anemometers cannot detect nor can it adjust the blades to account for this change. Is this condition that Mr. Palmer believes produces the maximum sound power from the turbine blades and is responsible for the deep blade whoosh that is the source of complaints during nighttime. Measurements of turbines operating this condition have shown blade whoosh (amplitude modulation) of 8 to 15 dBA above the normal sound levels. For the situation of high wind shear without the stable boundary layer blade whoosh (amplitude modulation) normally ranges from 5 to 8 dBA.
This phenomenon has also been studied by Dr. Fritz van den Berg for his graduate thesis titled: "The Sounds of High Winds. In "The Sounds of High Winds " Dr. van den Berg presents a method for determining the increased sound power emitted by wind turbines for various mismatches between the optimum angles of attack for the blades and what occurs when the blades are not at the optimum angle due to high wind shear. He shows that increases of 10 dB can be expected for angle mismatches of 9° or more. Even slight mismatches of 4 to 7° can increased sound power by 3 to 8 dBA.
To further complicate the assessment of a wind turbines sound power under real world situations the atmospheric condition of a stable atmosphere is a very common feature of warm season nights. In temperate zone climates it can occur as often as 60% of summer evenings. In a desert environment, where the solar heating and nighttime cooling can be even more extreme a stable atmosphere maybe even more common. Since the IEC 61400 – 11 measurement procedure only provides information for the sound power under the neutral atmosphere and low windshear use of the data from that standard will consistently under predict the sound levels of wind turbines during these, nighttime conditions.
Overview
This review identified a number of deficiencies in the report and information presented by HDR regarding the potential for excessive noise exposure on adjoining properties. Most are concerned with the assumptions and methodology HDR used in constructing the computer model of sound propagation. They fall into the following three categories.
First, the HDR model included the tolerances for instrumentation error of the IEC 61400-11 test procedures of 2 dB but did not include the tolerances for the ISO 9613-2 modeling procedure of ± 3
Page 9 Subject: Review of Noise Studies and Related Material March 4, 2011
dB. If the HDR model had included this tolerance the results shown on the contour maps and tables of their report would be 3 dB higher than stated.
A second, and equally significant fault is that the predicted sound levels underestimate the sound levels that will be received on the properties and at homes adjacent to the wind turbine utility under nighttime stable atmospheric conditions. The Sound Power data used in the sound propagation models does not represent the noise produced by wind turbines during nighttime operations with high wind shear and stable atmospheric conditions. The IEC 61400.11 test standard collects data under neutral atmospheric conditions that do not cause these louder "thumping" or "whooshing" type of noise emissions.
In "Effects of the wind profile at night on wind turbine sound" G.P. van den Berg states:
"....measurements show that the wind speed at hub height at night is up to 2.6 times higher than expected, causing a higher rotational speed of the wind turbines and consequentially up to 15 dB higher sound levels, relative to the same reference wind speed in daytime. Moreover, especially at high rotational speeds the turbines produce a ‘thumping’, impulsive sound, increasing annoyance further. It is concluded that prediction of noise immission at night from (tall) wind turbines is underestimated when measurement data are used (implicitly) assuming a wind profile valid in daytime."8
The "thumping" referred to in the Van den Berg paper occurs in synchronization with blade rotation (about one "thump" or "whoosh" per second assuming the hub is rotating at 20 rpm). "Thumping" does not referring to the blade "swish" of 1-3 dBA present when the turbine is operating in a neutral atmosphere. This "swish" is included as part of the wind turbine sound power ratings provided by the manufacturer. The "thumping" of concern is the much louder noise that is not accounted for in the manufacturer's test data. This occurs typically at night under a stable atmosphere where there is high wind shear. This "thumping" can modulate by 5 to 10 dBA or more and is a result of increased sound power emissions from the wind turbine's blades.
Based on this reviewer's experience the nighttime noise is increased by at least 5 dBA over what is observed for similar hub level wind speeds during the day under a neutral atmosphere. If the increased sound power caused by the nighttime atmospheric conditions had been added to the manufacturer's sound power for neutral atmospheric conditions the predicted values would be 5 dBA or more higher than what is shown in the HDR report tables and contour map.
Third, the sound propagation modeling software used for the sound models is a general purpose model designed for modeling noise from common urban noise sources like industrial plants, roads, and railways. The ISO Standard limits use of the methods to noise sources that are no more than 30 meters above the receiving locations. A wind turbine with a hub height of 80 meters exceeds this ISO limitation by 50 meters. The HDR report did not disclose this limitation or make any effort to account for the errors that may accrue from the noise source exceeding the source height limits. Cadna/A is based on the ISO standard and thus limitations to the standard apply equally to the Cadna/A model.
The result of these three failings is that the HDR model does not address the types of audible noise from wind turbines that occurs as a result of the summer night time wind speed profile. The model does not represent the nighttime high wind shear conditions that people find most objectionable. If
8 Van den Berg, G.P., "Effects of the wind profile at night on wind turbine sound" Journal of Sound and Vibration, 2003
Page 10 Subject: Review of Noise Studies and Related Material March 4, 2011
the model had correctly addressed tolerances and the need to increase the IEC61400-11 sound power levels to account for increased sound emissions at night the contour map and tables would be at least eight (8) dBA higher. This increase would have expanded the boundary of the 40 dBA
threshold to include many of the homes around the perimeter of the Project. As a rule of thumb, assuming that the increased sound power for nighttime operation results in a 5 dBA increase and the 3 dB ISO tolerances are included, all receiving properties that have sound level projections between 32 and 40 dBA will exceed 40 dBA.
Properly modeled, this project would not comply with San Diego County's 45 dB CNEL limit at sensitive receiving properties. To remain
under the 45 CNEL criteria the wind turbine's evening and nighttime Leq would need to be
under 38 dBA Leq.
Description of wind turbine noise
It is common for people to look at wind turbines as a separate type of noise source. However, some of the problems associated with them are easier to understand if we view wind turbines as a special case of very large exposed-blade industrial fan. For example, if we take a look at the spectrum from a fan, as shown in Figure 4, there are certain characteristics that all fans have in common. There is maximum energy at the blade passage frequency, tones above the blade passage frequency, and broadband noise. The harmonics of that tone have somewhat lower energy content. The broadband spectrum starts above the range where the tones no longer dominate. The energy is highest at the blade passage frequency and drops off as frequency increases.
Page 11 Subject: Review of Noise Studies and Related Material March 4, 2011
In Figure 5, the wind turbine spectrum for a Vestas V-52 shows some of the same spectral characteristics. It does not show the tones and harmonics at the blade passage frequency (BPF) because for industrial scale upwind turbines this is usually between 1 and 2 Hz and the harmonics occur below 10 Hz. Because this is a difficult range of frequencies to measure, especially in field test situations, most information about the spectral characteristics do not show the infrasound range (0-20Hz) sound pressure levels (SPL). This is further obscured by the practice of wind industry acoustical consultants to present data using of A-weighting (dBA). The practice masks the spectrum shape by creating a visual impression of minimal low-frequency sound content. Even when octave band (1/1 or 1/3) SPLs are presented the reports normally ignore frequencies below 31.5 or 63 Hz. The wind industry and its consultants often conclude that there is little or no infra or low frequency
content. If that is true, then the customary reporting practices are understandable. But, if those assumptions are not accurate, then these practices mask a potential source of significant problems.
The graphic to the left (Figure 6) is expanded in the lower frequency range to show a wind turbine’s spectrum for the frequency range of 0-10 Hz. Now the tones and harmonics are clearer. Also, note the correlation of the frequency of the tones to rotational speed. This graph is from a study conducted by the Federal Institute for Geosciences and Natural
Resources, Hannover, Germany, titled: “The Inaudible Noise of Wind Turbines” presented at
the Infrasound work shop in 2005 (Tahiti).
The question is often asked: "Are the sound emission characteristics similar or different for different models and makes of wind turbines?" Figure 7 shows the general spectrum shape of 37 modern upwind turbines representing Turbines of the type anticipated for the Project. This graph shows the sound power data after normalizing the data for each turbine to 1 MW of power output.9 It is clear that there is little deviation in spectral shape between any of the various models that is not related to power produced. However, as seen
in the A-weighted curves of the same data, the use of A-weighting masks the low frequency energy content. All
9 DELTA, Danish Electronics, Light & Acoustics, “EFP‐06 Project, Low Frequency Noise from Large Wind Turbines, Summary and
Conclusions on Measurements and Methods,” April 30, 2008
Figure 7-Sound Power Level of 37 Turbines Normalized to 1MW
Figure 6-Wind Turbine Infrasound
Page 12 Subject: Review of Noise Studies and Related Material March 4, 2011
modern upwind industrial scale wind turbines have similar high sound pressure levels and tones in these lowest frequencies. To say that wind turbines do not have significant infra and low frequency sound is to mischaracterize it's acoustic spectrum.
Wind turbine noise is distinctively annoying
There have been several studies, primarily conducted in European countries with a long history of wind turbines, showing that at the same sound pressure (decibel) level or less, wind turbine noise is experienced as more annoying than airport, truck traffic or railroad noise10,11. There are several reasons why people respond more negatively to wind turbine noise that are directly a result of the dynamic modulations of the noise, both audible and inaudible, more than the absolute level of the sounds received. Wind turbine noise has been shown to cause the same level of annoyance at
35 Leq as road, rail and air traffic at levels or 45 to 50 Leq.
Amplitude Modulation (Audible Blade Swish)
It is not clear which characteristic of wind turbines makes them more annoying than other common sounds in the community. This is not because the sounds are hard to describe, but rather because wind turbine noise, especially at night, includes several annoying characteristics. Whether it is the distinctive rhythmic, impulsive or modulating character of wind turbine noise (all synonyms for “thump” or “whoosh” or “beating” sounds); its characteristic low frequency energy (both audible and inaudible, and also impulsive); the adverse health effects of chronic exposure to wind turbine noise (especially at night); in-phase modulation among several turbines in a wind farm (this can triple the impulse sound level when impulses of three or more turbines become synchronized); or some combination of all of these factors that best explains the increased annoyance is not fully understood. One or more of these characteristics are likely present depending on atmospheric and topographic conditions, (especially at night)12 as is the individual susceptibility of each person to them.
Nevertheless, reports based on surveys of those living near wind farms consistently find that, compared to surveys of those living near other sources of industrial noise, annoyance is significantly higher for comparable sound levels among wind utility footprint residents. In most cases, where relationships between sound level and annoyance have been determined, annoyance starts at sound
10 E. Pedersen and K. Persson Waye, “Perception and annoyance due to wind turbine noise: a dose–response relationship,” J.
Acoust. Soc. Am. 116, 3460–3470 (2004). 11 Vandenberg, G., Pedersen, E., Bouma. J., Bakker, R. “WINDFARMperception Visual and acoustic impact of wind turbine farms on
residents” Final Report, June 3, 2008. 12 G.P. Van den Berg, “The beat is getting stronger: The effect of atmospheric stability on low frequency modulated sound on wind turbines,” Noise notes 4(4), 15‐40 (2005) and “The sound of high winds: the effect of atmospheric stability on wind turbine sound and microphone noise” Thesis (2006)
Figure 8-Graph from Pedersen 2004
Page 13 Subject: Review of Noise Studies and Related Material March 4, 2011
levels 10 dBA or more below the sound level that would cause equivalent annoyance from the other common community noise sources. Whereas one would expect that people would be annoyed by 45 dBA nighttime sound levels outside their homes in an urban area, rural residents are equally annoyed by wind turbines when the sound levels are 35 dBA. Given that wind turbine utilities are often permitted to cause sound levels of 40 or higher at the outside of homes adjacent to or inside the footprint of wind utilities the negative reactions to wind turbines from many of those people is understandable. Their reactions provide objective evidence from currently operating wind utilities that a substantial number of people who live near the Kent Breeze project will complain that the noise level they experience is both causing nighttime sleep disturbance and creating other problems once operation commences.13 14
Although there remain differences in opinions about what causes the amplitude modulation of audible wind turbine noise most of the explanations involve high wind shears and/or turbulence as it moves into turbine's blades15. There are a number of explanations that have been presented to explain this noise. For example, eddies in the wind, high wind shear gradients (e.g. different wind speeds at the higher reach of the blades compared to the lower reach), slightly different wind directions across the plane of the blades, and interaction among turbines, have each been identified as causes of modulating wind turbine noise from modern upwind turbines.16
Consultants for wind utility developers often claim that wind turbine sound emissions inside and adjacent to the project footprint estimated by the sound propagation model’s represent “worst-case” conditions. The IEC 61400-11 test procedures used to derive this data states that the turbine’s reported sound power levels represent the turbine’s sound emissions at or above its nominal operating wind speeds under standardized weather and wind conditions. These weather conditions require a neutral atmosphere where the wind shear fits the assumptions of the power law for winds at 10 meters and the hub level. This condition is often associated with a warm, sunny afternoon. That is reasonable given that the purpose of these tests is to produce standardized data to permit a prospective buyer of turbines to compare the sound emissions from various makes and models. This needs to be understood as being similar to the standardized gasoline mileage tests for new vehicles. One does not get the mileage posted on the vehicle sticker since each person’s driving habits are different. The same is true for wind turbines and the environments in which they operate. The IEC test data does not account for the increased noise from turbulence or other weather conditions that cause higher sound emissions. A review of the IEC 61400-11, Wind Turbine Systems-Part 11: Acoustic Noise Measurement Techniques’ assumptions in the body and appendices (esp. Appendix A) show that the IEC test data reported to turbine manufacturers is not ‘worst case’ for real world operations. Weather can introduce additional deviations from model results along its propagation path. ANSI standards for outdoor noise caution that turbulence in the air can increase the downwind sound levels by several decibels. It should be clear that any assertions by the acoustical modeler that the models represent “worst case” sound level estimates rely on careful phrasing or ignorance of the underlying standards and methods.
13 Kamperman and James (2008); James (2009b); Minnesota Department of Health (2009), pp. 19‐20. 14 Bajdek, Christopher J. (2007). Communicating the Noise Effects of Wind Farms to Stakeholders, Proceedings of NOISE‐CON (Reno, Nevada), available at http://www.hmmh.com/cmsdocuments/ Bajdek_NC07.pdf 15 Van den Berg (2006, pp. 35‐36); Oerlemans/Schepers (2009). 16 Bowdler, "Why Turbine Noise Annoys – Amplitude Modulation and other things," Where Now with Wind Turbines, Environmental Protection U.K. Conference, Sept. 9, 2010 Birmingham, U.K.
Page 14 Subject: Review of Noise Studies and Related Material March 4, 2011
Impulsive sound was considered more problematic for older turbines that had rotors mounted downwind from the tower17. The sound was reduced by mounting the rotor upwind of the tower, common now on all modern turbines18. Initially, many presumed that the change from downwind to upwind turbine blades would eliminate amplitude modulated sounds (whooshes and thumps) being received on adjacent properties. However, in a landmark study by G. P. van den Berg19, it was shown that the impulsive swishing sound increases with size because larger modern turbines have blades located at higher elevations where they are subject to higher levels of wind shear during times of ground level “atmospheric stability.” This results in sound fluctuating 5 dBA or more between beats under moderate conditions and 10 dBA or more during periods of higher turbulence or wind shear20.
This author has confirmed night time amplitude modulation (blade thumping) at every wind project he has investigated. During periods of high turbulence or wind shear levels the sound levels produced by blade "thump" have been as high as 10-13 dBA. Figure 9’s graph shows the rise and fall of the A-weighted sound levels from blade swish measured inside a closed entry vestibule to a home. This test site is approximately 1500 feet from two (2) turbines with sound emission characteristics similar to the turbines proposed for the Project. It should be noted that other
tests measured sound levels exceeding 40 dBA inside the home in the rooms facing the turbines with a window
partly open.
17 Rogers (2006, p. 10) 18 Id., pp. 13, 16; Van den Berg (2006), p. 36. 19 Van den Berg (2006, p. 36) 20 Id.,
Figure 9-Audible Blade Swish inside home from New York Wind Utility
Page 15 Subject: Review of Noise Studies and Related Material March 4, 2011
To compensate for the added annoyance of fluctuating or impulsive sound, the sound power levels of the turbine must be increased above what is reported for neutral atmospheric conditions under IEC 61400-11. The impact of this increased annoyance from short term fluctuations in sound levels is cited in the Minnesota Department of Public Health report of 2009.21 The evidence collected by this reviewer as
demonstrated in Figure 5 shows that this increase in noise emissions is generally applicable. It is the days
and nights when the amplitude modulation is at its worst that cause complaints. It is not the 1-3 dB swishes of a summer afternoon, but the 6-9 dB whooshes of a late evening or the 10 -14 dB thumps during warm season night time weather with high turbulence or wind shear that matter. These conditions are common in warm weather months and at any time when significant vertical and horizontal turbulence and wind shear may occur.
A recent paper by Drs. Pedersen and van den Berg assessed the annoyance felt by people inside their homes for various sound levels of wind turbine noise outside the homes. Figure 10 shows the annoyance level for the situation of 45 Leq outside the home. This results in an annoyance value of about 1 out of every 3 people. The position that 45 dBA wind turbine noise outside a home is compatible with sleeping inside the home (even with the windows closed) is shown to be false.
Frequency of Conditions that Cause Blade Swish
The phenomenon of wind shear coupled with ground level atmospheric stability refers to the boundary that forms between calm air at ground level and winds above the boundary at a higher altitude. “A high wind shear at night is very common and must be regarded a standard feature of the night time atmosphere in the temperate zone and over land.”22 A paper presented at the 2009 Institute of Noise Control Engineers, Noise-Con 2009 conference in Ottawa, Canada on background noise assessment in New York’s rural areas noted: “Stable conditions occurred in 67% of nights and in 30% of those nights, wind velocities represented worst-case conditions where ground level winds were less than 2 m/s and hub-height winds were greater than wind turbine cut-in speed, 4 m/s.”23
Based on a full year of measurements every half-hour at a wind farm in Germany, Van den Berg found:
“the wind velocity at 10 m[eters] follows the popular notion that wind picks up after sunrise and abates after sundown. This is obviously a ‘near-ground’ notion as
21 Van den Berg (2006), p. 106; Minnesota Department of Public Health (2009), p. 21. See also Pedersen, "Wind turbine noise, annoyance and self‐reported health and well being in different living environments," 2007, p. 24) 22 Van den Berg (2006, p. 104). See also Cummings (2009) 23 Schneider, C. “Measuring background noise with an attended, mobile survey during nights with stable atmospheric conditions”
Noise‐Con 2009
Figure 10-Annoyance inside a home for outside wind turbine noise.
Page 16 Subject: Review of Noise Studies and Related Material March 4, 2011
the reverse is true at altitudes above 80 m. . . . after sunrise low altitude winds are coupled to high altitude winds due to the vertical air movements caused by the developing thermal turbulence. As a result low altitude winds are accelerated by high altitude winds that in turn are slowed down. At sunset this process is reversed.24”
In other words, when ground-level wind speed calms after sunset, wind speed at typical hub height for large wind turbines (80 meters, or 262 feet) commonly increases or at least stays the same. As a result, turbines can be expected to produce noise while there is no masking effect from wind-related noise at the ground where people live. “The contrast between wind turbine and ambient sound levels is therefore at night more pronounced.25” The blade angle is calculated for the average wind speed (at the hub) but the wind speeds at the top and bottom can require different settings to avoid producing noise. As the turbine’s blades sweep from top to bottom under such conditions the blade encounters different wind velocities that do not match the blade's angle of attack resulting in rhythmic swishing noise from the parts of the rotation where blade angle mismatches occur26. Such calm or stable atmosphere at near-ground altitude accompanied by wind shear near turbine hub height occurred in the Van den Berg measurements 47% of the time over the course a year on average, and most often at night27.
Infra and Low Frequency Sounds
The level of annoyance produced by wind turbine noise also increases substantially for low frequency sound, once it exceeds a person's threshold of perception. Annoyance and the sense of loudness increase more rapidly than the more readily audible mid-frequency sounds. Sound measured as dBA is biased toward 1,000 Hz, the center of the most audible frequency range of sound pressure. Low frequency sound is in the range below 200 Hz and is more appropriately measured as dBC for low frequency sound or in dBG for infrasound. Because infra and low frequency sounds from wind turbines include significant dynamic modulation in the frequency range from the Blade Passage Frequency of about 1 Hz up to about 10 Hz standard acoustical instruments such as 1/3 octave band analyzers and FFT analyzers using band filtering cannot be used to measure the short duration pulsations. Using instrumentation that can provide 1/3 octave band resolution of the spectrum sound pressure levels can only be used for assessing relatively long periods of the infrasound (minutes or hours, not seconds or milliseconds) and even then the readings may understate the total acoustic energy and the maximum sound pressure levels during those pulsations28.
Sound below 20 Hz, termed infrasound, is generally presumed to not be audible to most people. See Leventhall (2003, pp. 31-37); Minnesota Department of Public Health (2009, p. 10); Kamperman and James (2008, pp. 23-24). However, if these criteria are applied to the most sensitive people, the thresholds drop approximately 6-12 dB. But the Thresholds of Perception are for a single steady pure tone under laboratory conditions. Wind turbine sounds are a complex mix of tones, all within the same critical band. Because the auditory system integrates the energy of the various tones it is possible that for some people they will be audible at levels lower than what is required for a single
24 (Van den Berg 2006, p. 90) 25 Id., p. 60 26 Id., p. 61. Cf. also Minnesota Department of Public Health (2009), pp. 12‐13 and Fig. 5. 27 Van den Berg 2006, p. 96 28 A paper co‐written by this reviewer and Wade Bray of Head Acoustics is being prepared to present the findings of an analysis of wind turbine low and infrasonic sound that shows these micro‐time pulsations at the July 2011 Noise‐Con to be held in Portland, OR.
Page 17 Subject: Review of Noise Studies and Related Material March 4, 2011
pure tone. The combination of people with extra sensitivity and the presence of a complex set of tones in the range from 0 to 20 Hz puts the infrasound sound pressure levels measured on receiving properties and inside homes within the threshold of perception for a subset of the population. However, when someone states that wind turbine infra sound is not significant because it does not reach the amplitudes needed to exceed the Thresholds of Perception they are mischaracterizing the situation. The truth is we only know the Thresholds of Perception for single pure tones. When the sounds are more complex as for wind turbines with their multiple combinations of tones with varying types of amplitude and frequency modulation we do not know the Threshold of Perception. All we know is that it is likely to be lower than for a single pure tone.
For many years it has been presumed that only infra and low frequency sounds that reached the threshold of audibility for people posed any health risks. Many acoustical engineers were taught that if you cannot hear a sound, it cannot harm you. Recent research has shown that the human body and auditory system is more sensitive to infra and low frequency noise (ILFN) than previously believed. This perception is not one that is 'heard' but rather it is one that involves the organs of balance (vestibular systems). The vestibular portion of our auditory system can respond to levels of infra and low frequency sound at pressures significantly lower than what is needed to reach the thresholds of audibility.29
Dr. Nina Pierpont has conducted a study of the effects of infra and low frequency sound on the organs of balance that establishes the causal link between wind turbine ILFN and medical pathologies. This research is discounted by the wind industry as not meeting standards for epidemiology and that it is not 'peer-reviewed.' Neither accusation is correct. The type of epidemiological study conducted by Dr. Pierpont is termed a case-crossover study. Dr. Carl Philips, a highly respected epidemiologist not associated with the wind industry has said: 30
"In particular, my scientific analysis is based on the following points, which are expanded upon below: "1. Health effects from the turbine noise are biologically plausible based on what is known of the physics and from other exposures. "2. There is substantial evidence that suggests that some people exposed to wind turbines are suffering psychological distress and related harm from their exposure. These outcomes warrant the label “health effects” or “disease” by most accepted definitions, though arguments about this are merely a matter of semantics and cannot change the degree of harm suffered. "3. The various attempts to dismiss the evidence that supports point 2 appears to be based on a combination of misunderstanding of epidemiologic science and semantic games. Multiple components of this point appear below. " Also, "There is ample scientific evidence to conclude that wind turbines cause serious health problems for some people living nearby." And, "The reports that claim that there is no evidence of health effects are based on a very simplistic understanding of epidemiology and self-serving definitions of what does not count as evidence.
29 Alves‐Pereira, Marianna and Nuno A. A. Branco (2007a). VibroAcoustic disease: Biological effects of infrasound and low‐frequency
noise explained by mechanotransduction cellular signaling, 93 PROGRESS IN BIOPHYSICS AND MOLECULAR BIOLOGY 256–279,
available at http://www.ncbi.nlm.nih.gov/ pubmed/17014895>< and, Alves‐Pereira, Marianna and Nuno A. A. Branco (2007b). Public health and noise exposure: the importance of low frequency noise, Institute of Acoustics, Proceedings of INTER‐NOISE 2007, 30 Philips, Carl v., " An Analysis of the Epidemiology and Related Evidence on the Health Effects of Wind Turbines on Local Residents," for Public Service Commission of Wisconsin docket no. 1‐AC‐231, Wind Siting Rules, July 2010.
Page 18 Subject: Review of Noise Studies and Related Material March 4, 2011
Though those reports probably seem convincing prima facie, they do not represent proper scientific reasoning, and in some cases the conclusions of those reports do not even match their own analysis."
Further, the report was peer-reviewed by some of the top experts in the U.S. and Britain who have experience with vestibular disturbances and adverse health conditions. These reviews were included in the published final report. The criticisms leveled at Dr. Pierpont's work are not supported by the facts.
The new research is not from the traditional fields that have provided guidance for acoustical engineers and others when assessing compatibility of new noise sources and existing communities. Instead it comes from the field of research into auditory and vestibular function. A recent peer reviewed paper by NIDCD/NIH researcher Dr. Alec Salt, reported that the cochlea responds to infrasound at levels 40 dB below the threshold of audibility.31 These studies show how the body responds to extremely low levels of energy not as an auditory response, but instead as a vestibular response.
In a personal communication, this reviewer asked Dr. Salt the question: "Does infrasound from wind turbines affect the inner ear?" Dr. Salt responded:
"There is controversy whether prolonged exposure to the sounds generated by wind turbines adversely affects human health. The un-weighted spectrum of wind turbine noise slowly rises with decreasing frequency, with greatest output in the 1-2 Hz range. As human hearing is insensitive to infrasound (needing over 120 dB SPL to detect 2 Hz) it is claimed that infrasound generated by wind turbines is below threshold and therefore cannot affect people. The inner hair cells (IHC) of the cochlea, through which hearing is mediated, are velocity-sensitive and insensitive to low frequency sounds. The outer hair cells (OHC), in contrast, are displacement-sensitive and respond to infrasonic frequencies at levels up to 40 dB below those that are heard."
"A review found the G-weighted noise levels generated by wind turbines with upwind rotors to be approximately 70 dBG. This is substantially below the threshold for hearing infrasound which is 95 dB G but is above the calculated level for OHC stimulation of 60 dB G. This suggests that most wind turbines will be producing an unheard stimulation of OHC. Whether this is conveyed to the brain by type II afferent fibers or influences other aspects of sound perception is not known. Listeners find the so-called amplitude modulation of higher frequency sounds (described as blade “swish” or “thump”) highly annoying. This could represent either a modulation of audible sounds (as detected by a sound level meter) or a biological modulation caused by variation of OHC gain as operating point is biased by the infrasound. Cochlear responses to infrasound also depend on audible input, with audible tones suppressing cochlear microphonic responses to infrasound in animals. These findings demonstrate that the response of the inner ear to infrasound is complex and needs to be understood in more detail before it can be concluded that the ear cannot be affected by wind turbine noise."
During the summer of 2009, this reviewer conducted a study of homes in Ontario where people had reported adverse health effects that they associated with the operation of wind turbines in their communities32. The study involved collecting sound level data at the homes and properties of these people, many of who had abandoned their homes due to their problems. This study found that sound levels in the 1/3 octave bands below 20 Hz were often above 60 dB and in many cases above 70 dB. Since the shape of the spectrum for wind turbine sound emissions is greatest at the blade passage frequency which was below the threshold for the instruments used it can be assumed that the sound pressure levels in the range of 0 to 10 Hz exceeded 70 dBA. Given the statement by Dr. Salt that vestibular responses would start at levels of 60 dBG or higher this data supports the
31 Salt, Alec, "Responses of the ear to low frequency sounds, infrasound and wind turbines", Hearing Research, 2010. This work was supported by research grant RO1 DC01368 from NIDCD/NIH 32 James, R. R., "Comments Related to EBR‐010‐6708 and ‐010‐6516" Comment ID 123842, 2009
Page 19 Subject: Review of Noise Studies and Related Material March 4, 2011
hypothesis that there is a link between the dynamically modulated infra sound produced by wind turbines and reported adverse health effects.
Adverse health effects related to inaudible low frequency and infra sound have been encountered before. Acoustical engineers in the Heating, Cooling and Air Conditioning (ASHRAE) field have suspected since the 1980’s and confirmed in the late 1990’s that dynamically modulated, but inaudible, low frequency sound from poor HVAC designs or installations can cause a host of symptoms in workers in large open offices33. The ASHRAE handbook devotes considerable attention to the design of systems to avoid these problems and has developed methods to rate building interiors (RC Mark II) to assess them for these low frequency problems34. The report on Ontario by this reviewer includes an Appendix that provides more detail on this aspect of how inaudible infra and low frequency sound can cause adverse health effects.
When infra and low frequency sound is in the less-audible or inaudible range, it is often felt rather than heard. Unlike the A-weighted component, the low-frequency component of wind turbine noise “can penetrate the home’s walls and roof with very little low frequency noise reduction.35” Further, as discussed in the 1990 NASA study the inside of homes receiving this energy can resonate and cause an increase of the low frequency energy over and above what was outside the home. Acoustic modeling for low frequency sound emissions of ten 2.5 MW turbines indicated “that the one mile low frequency results are only 6.3 dB below the 1,000 foot one turbine example.36” This makes the infra and low frequency sound immissions from wind turbines a potential problem over an even larger area than the audible sounds, such as blade swish and other wind turbine noises in the mid to high frequency range.
The acoustical consultant that does not practice in this field may not be as aware of the problems of amplitude modulated, in-audible low frequency sound identified by the ASHRAE engineers. Many have not integrated these new understandings of how infra and low frequency sound can affect the vestibular organs into their work on community noise. These levels were only a few years ago considered too low to cause any physical response. Today, there is a renewed interest in these effects. A paper titled: Infrasound, The Hidden Annoyance of Industrial Wind Turbines, by Prof. Claude Renard of the Naval College and Military School of the Fleet (France) concludes:
"The information given above is enough to understand that it is better not to be exposed to infrasound which propagates far from its point of origin and against which it is impossible to protect oneself due to the long wavelengths. "Those most affected by exposure to infrasound are rural inhabitants living in proximity to wind turbines, and those working in air-conditioned offices. "The people in the former category are exposed to the infrasound 24 hours a day, whereas people in the latter category are only exposed to infrasound 6 hours a day. "The most important issue is therefore to know what intensity of infrasound can be tolerated without inconvenience over these periods of time. "We do not have the answer to this question."
33 Persson Waye, Kirsten, Rylander, R., Benton, S., Leventhall, H. G., Effects of Performance and Work Quality Due to Low Frequency Ventilation Noise, Journal of Sound and Vibration, (1997) 2005(4), 467‐474. 34 The study also showed that NC curves are not able to predict rumble. This use of NC curves was disproved in the 1997 Persson Waye, Leventhall study. Use of the RC Mark II procedures is more appropriate for this use. 35 Kamperman and James (2008), p. 3. 36 Id., p. 12
Page 20 Subject: Review of Noise Studies and Related Material March 4, 2011
Specific Issues with the HDR Noise Assessment Report
Problems with Cadna/A (Limitations on Use of ISO 9613‐2 Algorithms)
As discussed earlier in this review the sound propagation modeling presented by HDR and used as the basis for conclusions about the impact of the Project on nearby properties and residences underestimates the sound levels that will be received on the properties and homes adjacent to the wind turbine utility. The sound propagation modeling software used for the sound models (Cadna/A and others) are general-purpose commercial packages for use in modeling noise from noise sources like industrial plants, roads, and railways, not wind turbines. Although this does not completely preclude the use of the Cadna/A software package, it does call into question the implied assertion by HDR by representing the predicted sound levels to a tenth of a decimal precision that the predicted values can be assumed to be precise. We need to apply reasonable safety factors and give consideration to the known tolerances and limits to the accuracy of the procedures in our conclusions. Further, it must be understood that there are other computational methods and algorithms that can be used to model wind turbines other than the ISO method that produce different results. For example, the Swedish model that was mentioned in the discussion about ISO 9613-2 has been validated by independent researchers for use with wind turbines. This model was
used by this reviewer to predict the sound pressure levels in dBA and dBC for a home near a row of wind turbines and one at a distance of about 1 to 1.25 miles to demonstrate the difference in outcomes. A table comparing the outcomes is presented later in this report.
The graph shown in Figure 11 shows the decay rate for the two modeling methods. The Swedish method includes a new variable that adjusts the distance from the turbine where the sound field converts from a decay rate of 6 dB per doubling of distance (ISO 6913-2 also known as spherical spreading or point source calculations) to 3 dB decrease per doubling (known as Cylindrical spreading or line source calculations). For reflective surfaces like water, ice or hard rock this value is about 200. For ground surfaces that absorb part of the acoustic energy this may be 800 or higher. The graph shows the ISO decay rate as the bottom green trace. For a single
Figure 11-Comparison of decay rate for ISO 9613-2 and Swedish model
Page 21 Subject: Review of Noise Studies and Related Material March 4, 2011
turbine with a sound power level of 104 dBA the sound pressure at about 735 meters (a little less than the distance from turbine R12 to Home #1) would be 39 dBA. This is about the same as the Swedish model when the variable is set to 780 meters. If the ground was highly reflective as might be expected for rocky hard packed desert land the sound level would only have dropped to 45 dBA. At 2124 meters (a little less than the distance from turbine G17 to Home #31) the difference between the two models is much greater. Here the ISO model would predict 30 dBA but the Swedish model would predict 35 to 40 dBA depending on the ground absorption assumption. Based on this graph the HDR model is understating the sound levels for homes at distances of 4000 meters by 8 dBA or more. These differences do not consider the increased sound power levels due to wind shear at night. Under those conditions the sound levels predicted by both methods would be 5 to 8 dBA higher. This demonstrates why the Project cannot claim with any degree of assurance that it will not produce sound levels at sensitive properties that exceed the 45 CNEL limits set by San Diego County. In fact, it is quite likely that these exceedances will occur and they will occur most often at night when the create a serious challenge to residents for sleep disturbance.
Use of Tolerances
HDR included the 2 decibel tolerance associated with instrumentation error from the IEC 61400 – 11 test protocol for measuring the sound power produced by wind turbines. However, HDR does not include the three (3) dB tolerance associated with errors when applying the ISO-methodology (See Table 5 from the ISO standard Figure 12).
If HDR had included the three (3) dB tolerance for the ISO methodology, the results of the models for daytime and nighttime operating modes would have shown many of the homes proximate to the project being exposed to sound levels over 45 dBA CNEL (38 Leq is required for compliance if the turbines operate at night). ISO 9613-2, Table 5, Section 9, "Accuracy and limits of the method" (Figure 12), shows the tolerance as plus/minus 3 dB for predictions. This applies when the noise source is at a height greater than 5m and less than 30 m above the receiver and the receiver is within
1000 m. of the noise source.
It essential to include the three (3) dB tolerance in the predictions. Further, the predicted values should be viewed as estimates, not
precise values even with the tolerance included because the wind turbine does not fit the model's assumptions for height and spherical spreading.
Use of Sound Power Data Representing Sound Emissions in a Neutral Atmosphere
Sound power levels must represent the conditions that cause the intrusive blade swish that is commonly associated with nighttime sleep disturbance and complaints. The manufacturer’s reported power levels represents a standardized value for ‘typical’ conditions of a neutral atmosphere with a moderate wind shear gradient. The HDR report made no attempt to address this deficiency.
Evidence of wind farm noise exceeding certificate of approval levels
Figure 12-Table of Tolerances for ISO Model if all assumptions are met.
Page 22 Subject: Review of Noise Studies and Related Material March 4, 2011
A spreadsheet model was developed for two of the properties near the wind project that applies the ISO tolerances as they should be applied. In addition, a model using the Swedish algorithms was also developed. Two homes were selected as representing the sensitive receiver sites. They are home #1, which is one of the closest homes to the turbines (approx. 1/2 mile), and home #31, which is about a mile and a quarter away from the nearest turbines. They were selected as representatives of other properties for comparison to the sound levels reported by HDR. These models were constructed using spreadsheets and are attached as appendix materials for review.
Evidence of Tule Wind Exceeding 45 dBA CNEL (38 LAeq during nighttime hours)
Residence Nearest turbine
(m)
HDR Study Report (w/o
ISO tolerance)
dBA/dBC
E-CS Study ISO Model (no ground absorption) dBA/dBC
E-CS Study Swedish Model
variable of 780 for partly absorptive
ground
E-CS ISO model with 5 dBA increase in
Turbine Sound Power Level*
dBA/dBC
1 735 m. (R12)
47/58 45/58 51/62 50/63
31 2142 m. (G17)
39/51 35/50 47/58 40/55
* Adjustment for Nighttime Blade Thump under a stable atmosphere with high wind shear. This could be considered the Predictable Worst Case Condition.
The two ISO models are in general agreement with the E-CS ISO model having slightly lower dBA levels for Homes 1 and 31. This is likely because the E-CS model only considered the nearest turbines where the HDR model considered the effect of the nearby turbines as well as those at greater distances. The E-CS model based on the Swedish model that combines spherical and cylindrical sound propagation shows a large increase over either of the two ISO models. For Home #1 the increase is 3 dBA over the HDR ISO model and 6 dBA over the E-CS ISO model. As expected the E-CS Swedish model shows a much lower decrease in sound with distance than the ISO models. This is explained above in the narrative for Figure 11 as a result of the propagation decrease changing from 6 dB per doubling of distance to 3 dB per doubling of distance. For Home #31, located at a mile and a quarter from the nearest turbine the daytime sound level is projected to be as high as 47 dBA. This is only 4 dBA lower than at Home 1 whereas the ISO models show a difference of about 10 dBA. If we were to consider the increased sound power for nighttime stable atmospheric conditions with high wind shear above the stable boundary layer the nighttime sound levels at Home #1 would be approximately 50 dBA. This reviewer has measured similar high sound levels at similar distances during stable atmospheres at several wind utility projects. For the same nighttime conditions homes at a distance of a mile may experience sound levels of 40 dBA.
In the 2008 manuscript by George Kamperman, Bd. Cert. INCE, P.E. and myself we set criteria designed to protect the public health we stated that a setback of at least 1.25 miles was needed to achieve this goal37. Given that the World Health Organization's 2009 Nighttime Noise Guidelines find that the Threshold for Adverse Health Effects is 40 dBA at night outside a home the results shown in the above Table confirm the need for such distances. For specific topographies that 37 Kamperman, G.W., Bd.Cert. INCE, P.E., James, R.R. INCE, "The 'How To' Guide to Siting Wind Turbines To Prevent Health Risks Fro Sound, 2008.
Page 23 Subject: Review of Noise Studies and Related Material March 4, 2011
increase the distance that sound travels or increase sound power emissions due to in-flow turbulence from wake interference due to layout or rough terrain downwind of the turbines, or that are more susceptible to the daytime warming and nighttime cooling of the ground and atmosphere this 1.25 mile setback may not be sufficient.
Conclusion
It is the opinion of this reviewer, based on his personal experience and the review described in this document that a properly conducted study would identify many more homes in the vicinity of the wind turbines where the receiving properties will have sound levels that exceed 40 dBA. When adjusted for known tolerances of algorithms and measurements used to construct the model and the increased sound power emitted by wind turbines at night under conditions of high wind shear, a common situation during the warm season most of the homes in the areas bounding the Project will have sound levels that exceed 40 dBA at night. The San Diego County CNEL limit of 45 dBA for sensitive receivers will be exceeded at any location were the nighttime LAeq exceeds 38 dBA. This is likely to be most of the area within 1.25 miles of the perimeter of the Project. For the non-residential areas used for campgrounds and outdoor recreation the soundscape will no longer be the natural sounds of nature but instead the industrial sounds of wind turbines. The belief that the noise from the highways will somehow 'mask' the wind turbine sounds is not supported by current research. Wind turbine noise, especially at night under stable atmospheric conditions or during weather that causes increased turbulence in the in-flow air the wind turbine sounds will be characterized by large swings in sound level synchronized with turbine blade rotation of about one 'whoosh" or "thump" per second. This amplitude modulation is an additional reason that it can be expected that sleep disturbance will be a common factor for people living or camping in the area. Further, there is reason to be concerned that for a sub-set of the people in the community the infrasound and low frequency content of the wind turbine noise will pose additional health risks due to interactions with their organs of balance. These concerns are not hypothetical. There are many similar large scale wind turbine projects operating in the U.S. and around the world. A fair number of these projects result in complaints from people living near or inside the project's footprint of night time sleep disturbance and symptoms that are part of wind turbine syndrome. These projects were granted permits based on the same process of assessing background sound levels and computer modeling that were used for the Project. Given the analysis above it is reasonable to conclude that this project will join the ranks of wind utilities that cause adverse health conditions and noise pollution if it is approved.
This project should be rejected based on the concerns raised in this report. There may be other arrangements of turbines that might be compatible with the community and current land use. However, this current arrangement, with inter turbine spacing of less than three rotor diameters, hard dense reflective ground surfaces, desert heating and cooling cycles being likely to create stable nighttime atmospheric conditions, and the rough terrain which will increase the in-flow turbulence all result in increased noise levels for residents and visitors.
In the opinion of this reviewer the Project will result in the exposure of persons to or generation of noise levels in excess of standards established in the San Diego County noise ordinance, and also exceed the WHO 2009 nighttime guidelines setting 40 dBA (Leq) at night as the threshold for adverse health effects. It will also result in a substantial permanent increase in ambient noise levels in the project vicinity above levels existing without the project.
The Project, as currently proposed should be rejected.
End of Review
Page 24 Subject: Review of Noise Studies and Related Material March 4, 2011
Richard R. James, INCE
For E-Coustic Solutions
March 4, 2011
Page 25 Subject: Review of Noise Studies and Related Material March 4, 2011
Appendix Model Spreadsheets
Feb 06, 2010 Gamesa Turbine Original Turbine Layout
Predicted dBA, dBC, and dBZ Leq Average Sound Pressure Levels (Residence 31) (Swedish Model)
ISO 9613‐2 Model Tolerance
IEC 61400‐11 Meas. Tolerance
Air Absorption Coefficient (Alpha) db/m @ 20C 50%RH
GE 1.5xle 1.5 MW V10 of
10m/s or greater
Receiver Elevation to
Tower Hub (m.)
1/1 Octave Band Center Frequency (Hz) with Un‐weighted Sound Pressure Levels
(dB(Z) Leq)
From 1/1 Octave Band
SPL's
Sound Power (Lw)==>
Octave Band Center Frequency (Hz)
Turbines Only (w/o AM or Turb.):
Cummulative Effect of Listed Turbines as Long Term
Average Leq SPL's
Transition point for
Spherical to Cylindrical:
Additional Lw from conditions not
part of IEC test conditions
D:\My Documents\My Clients\Wind\California\San Diego County (Tisdale)\RRJ Work\model\Recieving Location 31 (Combination Point and Line Source model) - Copy.xlsxRecieving Location 31 (Combination Point and Line Source model) - Copy.xlsxPredicted SPL's and
1/1 Octave Band Center Frequency (Hz) with Un‐weighted Sound Pressure Levels
(dB(Z) Leq)
From 1/1 Octave Band
SPL's
Sound Power (Lw)==>
Octave Band Center Frequency (Hz)
Turbines Only (w/o AM or Turb.):
Cummulative Effect of Listed Turbines as Long Term
Average Leq SPL's
Transition point for
Spherical to Cylindrical:
Additional Lw from conditions not
part of IEC test conditions
Predicted dBA, dBC, and dBZ as Average (Leq) Sound Pressure Levels (Residence #1) (ISO Model)
Single Turbine Lw +
ISO 9613‐2 Model Tolerance
IEC 61400‐11 Meas. Tolerance
Air Absorption Coefficient (Alpha) db/m @ 20C 50%RH
GE 1.5xle 1.5 MW V10 of
10m/s or greater
Receiver Elevation to
Tower Hub (m.)
D:\My Documents\My Clients\Wind\California\San Diego County (Tisdale)\RRJ Work\model\Receiving Location 1 (Combination Point and Line Source model).xlsxReceiving Location 1 (Combination Point and Line Source model).xlsxPredicted SPL's and Over-all
5400
5200
5000
5000
5200
5400
5600
40003800
4000
2600
20001800
5600
4600
44004200
4000
56 00
36003400
3200
6200 560 0
2800
2400
2200
30002800
4800
4000
1200 1000
1600
1400
3200
4600
440042004000
4800
480 0
3400
2800
3000
5600
18 00
1600
32003000
5200
2 00 01600
3600
4200
2800
1600
500 0
360 0
3800
3400
1800
5200
22005600
3800
4200
4800
3800
4400
4200
1400
5600
1800
1600
1600
3600
4200
4000
3600
4400
1000
4200
4200
1600
200 0
1800
160050
00
1800 1600
1400
5600
1800
4800
1600
5000
160 0
1600
3400
3200
1800
4000
1800
3000
140040
00
4800
4000
4000
4200
3200
4400
4800
4000
4000
4000
5000
3600
RED SHANK LN
OLD HIGHWAY 80
HI PASS RD
TIER
RA DE
L SO
L RD
ANGE
L DR
L IL
L IE LN
CAM TRES AVES
LILA
C TL
BLACKWOOD
RD
STARSH IP STWORTHINGTON
RD
SHAS
TA TL
BLACKWOO D RD
CHURCH RD
E NCIN
A VE
RDE
QUAI
L RU
N
MILL
ER VA
LLEY
RD
H ON
EY
BEE LN
GREAT BLUE HERON WY
LILAC LN
RO SS A V
JEWEL VALLEY WY
MIL
LE
R
VALL
EY
R D
MANZAN ITA DUL
CE
CROSS RD
SOL WOOD
HUBBLE RD
OLD
MI N
E RD
SHASTA WY
FL YIN G CL OUD PL
CANE BR
AKE RDJE
WE L
VALL
EY R D
WIL
LIAM
S RD
STAG ECOA CH S PRINGS RD
LIVE
O AK
SP
RINGS RD
LOST VA LLEY RD
PINION PINE TL
GREAT EAG
L E WY
THIN
G VA
LLEY
RD
WIL
LIAM
S RD
CRES
TWOO
D /
BIA
12
RIBB
ONW
OOD
RD
MC C
AIN
VALL
EY R
D
CRES
TWOO
D RD
MC CAI
N VA
LLEY
RD
MANZ
ANIT
A CO
TTON
WO O
D RD
AB94
§̈¦8
!(
!(
!(
!(
!(
!(
!(
!(
!(
!(
!( !(!(
!(
!(
!(
!(
!(
!(
!(
!(
!(
!(
!(
!(
!(
!(
!(
!(
!(
!(
!(
!(
!(
!(
!(
!(
!(
!(
!(
!(
!(
!(
!(
!(
!(!(
!(
!(
!(
!(
!(
!(
!(
!(
!(
!(
!(
!(
!(
!(
!(
!(
!(
!(
!(
!(
!(
!(
!(
!(
!(
!(!(
!(
!(
!(
!(
!(
!(
!(
!(
!(
!(
!(
!(
!(
!(
!(
!(
!(
!(
!(
!(
!(
!(
!(
!(
!(
!(
!(
!(
!(
!(
!(
!(
!(!(
!(
!(
!(
!(
!(
!(
!(
!(
!(
!(
!(
!(!(
!(
!(
!(
!(
!(
!(
!(
!(
!(
!(
!(
!(
!(
$
$
$$$
$
$
$
$$$
$
$$ $$$
$
$$
$
$
$
ÆQ
ÆQ
1
2-2627
28
29
30
31
32
3334
35
36
37
38
3940
41
42
4344
47
LarkCanyon
Cottonwood
G-16
G-17
K-11
K-12
B-6
B-7
D-7
E-2
F-1
F-2
E-5 E-6E-7 E-8
E-11
G-1G-2
B-2
B-3
E-12
D-1D-2
D-3
B-4
G-3G-4
G-5
G-6
G-7
G-8
G-9
G-10
G-11
G-12G-13
G-14G-15
C-1
C-2
D-10
C-3
C-4
F-3
F-4
E-4
E-9E-10
D-9
G-18
R-11
D-4
D-5
A-1
A-2
A-3
B-5
A-4
D-6
D-8
A-5A-6
B-1
E-1E-3
R-12
R-1
R-2
R-3
R-4
R-5
R-6
R-8
R-9R-7
R-10
L-7
L-6
L-5
L-3L-2
L-1
L-9L-10
L-11
N-4
N-5
N-6
N-3N-2
N-1
M-2
M-1
P-1
P-2
P-3
P-4
P-5
L-4
K-8
K-5
J-3
J-4
Q-1
L-8
N-7
N-8
K-7 J-15J-14
J-13
J-10J-9
J-8J-6
J-5
K-1
J-2
J-1
K-4
J-11K-3
K-2
Q-2
K-9A-8
A-7
B-8
B-9
C-6
C-5
F-6
F-5
G-19
R-13
GE dBC Noise ContoursFIGURE 9
Iberdrola Renewables | Tule Wind Project | Applicant’s Environmental Document
| G:\GIS_Production\Projects\IberdrolaRenew_424914\TuleWindEnergy_115965\14_00_GIS_MODELS\14_03_Map_Docs\14_03_04_mxd\EIR\General_plan.mxd | Created by: AB, YL | Last Updated : 03-25-10
/ 0 1 20.5Miles
!( Proposed Turbine Location
Noise Sensitive Land Use$ Home
ÆQ BLM Land Camp Site
GE dBC Noise ContourHourly Leq, dBC
45- 46
46 - 49
49 - 52
52 - 54
54 - 57
57 - 60
60 - 62
62 - 65
65- 68
68- 71
Rick
Distance Measurement
610.11 ft
Rick
Distance Measurement
1251.91 ft
Rick
Distance Measurement
886.66 ft
Rick
Distance Measurement
922.59 ft
Rick
Distance Measurement
785.01 ft
Rick
Distance Measurement
818.92 ft
Rick
Distance Measurement
792.23 ft
Rick
Distance Measurement
758.99 ft
Rick
Distance Measurement
972.05 ft
Rick
Distance Measurement
750.82 ft
Rick
Distance Measurement
770.86 ft
Rick
Distance Measurement
1033.59 ft
Rick
Distance Measurement
886.49 ft
Rick
Distance Measurement
989.89 ft
Rick
Distance Measurement
880.72 ft
Rick
Distance Measurement
727.65 ft�
Rick
Distance Measurement
1043.30 ft
Rick
Distance Measurement
835.05 ft
A New Explanation for Wind Turbine Whoosh – Wind Shear Page 1 of 15
Third International Meeting on
Wind Turbine Noise Aalborg Denmark 17 – 19 June 2009
A New Explanation for Wind Turbine Whoosh – Wind Shear
William K.G. Palmer P. Eng. TRI-LEA-EM RR 5, Paisley, ON N0G 2N0 Canada
Abstract The cyclic “Whoosh” created by wind turbines are their most recognizable audible feature, often reported as their most annoying aspect. Many references describe that the whoosh is generated due to the interaction between the turbulent air following the trailing edge of the blades, and the downwind tower.
However, this explanation leaves unanswered questions. Why is the whoosh so different from day to night? Neither the tower nor the blades change. A simple empirical test explains part of the mystery. Hold your finger in front of your pursed lips. As you blow on your finger at greater and lesser velocity, you hear that same familiar cyclic whoosh as you do from a wind turbine.
We know that at night the atmospheric profile changes, due to the condition of wind shear, as wind speed at height become uncoupled from lower elevations. We know also from audio / photographic studies that the sound from wind turbine blades is most concentrated at the blade tips.
When the bits we know are melded, a new model develops that explains how the cyclic whoosh of wind turbines can be described by the movement of the blades through high wind speeds at the top to low speeds at the bottom of the blade rotation. The sound increases as the blades go to the top of the circle and decreases as the blades go to the bottom of the cycle.
This knowledge might be used to reduce the annoying cyclic whoosh of wind turbines by a cyclical pitch of the blades as they reach the top of their rotation. This would also decrease stresses on the blades caused by flexure, and might even reduce blade failure probability.
Introduction
People who have followed the debate over wind turbines would readily agree that they would be rich if they had a dollar (or euro) for every article written or every hearing statement by someone saying something like “I went out to the turbine site, stood under the turbine, and could carry on a normal conversation. I don’t know what all the fuss is about; there was only a gentle “swish” sound. They aren’t noisy!”
A New Explanation for Wind Turbine Whoosh – Wind Shear Page 2 of 15
However, the wealth accumulated would be quickly erased if the interested data gatherer had to give a dollar (or euro) to every distraught resident from homes surrounding wind turbines, who said, “I just cannot get used to the constant pounding “Whoosh Whoosh Whoosh” that I hear at night from those turbines. Even with my head under the pillow, it is an unwelcome intruder into our home!”
Given the assumption that regardless of their personal opinion one way or another about wind turbines, most people strive to tell the truth, how does the unbiased observer make sense of it all? The speakers cannot all be right, can they? The points of view are exactly divergent. It is too easy to fall into the trap so often set, to accuse the “other side” of not telling the truth, or of just using excuses to explain personal preferences. This paper attempts to provide an explanation to the quandary that is probably one of the greatest mysteries about wind turbines – why they are not noisy to the person who stands under them in the daytime, and yet are unwelcome noisy intruders at night for the resident who lives near them.
It turns out that the explanation may not be so difficult to understand at all, and it may arise from a well-understood climatic condition that is familiar, but which is not well recognized in the acoustical codes prepared for wind turbines.
Common Explanations for Whoosh
A number of references describe the “Whoosh” heard from wind turbines as being due to the interaction between the turbulent air following the trailing edge of the wind turbine blade as it passes the region of slowed wind speed in front of the tower. Other explanations for the Whoosh have been written to describe it as being due to the acoustical Doppler effect, which arises as the wind turbine blades rotate on their downward path approaching an observer on the ground. A paperi by Stefan Oerlemans and Gerhard Schepers presented at the Second Wind Turbine Noise Conference in Lyons in 2007 describes the use of an elliptical array of microphones mounted on a board16 metres by 18 metres placed on the ground “roughly one rotor diameter upwind of turbines to measure sound from the blades to measure the distribution of noise sources in the rotor plane and on individual blades” to show that for an observer on the ground, “most of the noise is produced by the outer part of the blades (but not the very tip) during the downward motion.” Their paper shows some pictures of the test set up and typical noise source distributions in the rotor plane.
None of the common explanations proposed to date have suggested a reason for the Whoosh to vary from day to night. As none could explain the anecdotal observations made by residents living near wind turbines, of noise being more pronounced at night, it was necessary to search further.
A New Player Enters the Field – Atmospheric Stability
During the 2007 Ontario Municipal Board hearings related to the appeal by citizens against the Municipality of Kincardine, Ontario zoning bylaws passed to permit erection of wind turbines on 105 lots by the Enbridge Ontario Wind Power development, Meteorological Consultant James W. S. Young Ph.D. P. Eng, presented a paper titled “Analysis of Boundary Layer Winds near Goderich and Their
A New Explanation for Wind Turbine Whoosh – Wind Shear Page 3 of 15
Application to Wind Farms along the Easy Coast of Lake Huron.”ii Figure 1 (adapted from Young) shows the first 1000 metres atmosphere above the surface of the earth.
1000 m
100 m
10 m
1 m
Stable Atmosphere
Outer Layer
Surface Stress Layer
30 m
300 m
3 m
Wind Direction
Buoyancy Dominated
Buoyancy Affected
Earth’s Surface Layer
Interface
Figure 1 - Structure of Lower Atmosphere - Daytime
Young notes that above about 1000 metres we are in a stable layer of unchanging wind speeds with height, while below that level wind flow is dominated by either buoyancy or surface stress. He states, “The surface stress (or friction) dominates up to about 30 metres. Modern wind turbines typically operate above the surface stress layer in the buoyancy dominated region. In this region the wind flows tend to be less affected by turbulence (instabilities in the atmosphere).”
0 m/s 5 m/s 10 m/s 0 m/s 0 m/s10 m/s 10 m/s5 m/s 5 m/s
100m
200m
300m 300m 300m
200m 200m
100m 100m
Urban Area / Mountains Small Town / Forest Open Country / Water
Figure 2 - Typical Daytime Wind Speed Profiles
A New Explanation for Wind Turbine Whoosh – Wind Shear Page 4 of 15
Figure 2 (also adapted from Young’s paper) describes the typical patterns that are exhibited by the wind velocity with height as the surface roughness varies over urban (or mountainous) areas, suburbs (or forest) and level country (or water). The figure shows higher wind speeds at lower elevations over flat smooth terrain or water which favours placement of wind turbines in such areas.
The wind velocity with height is normally explained by the power equation:
Vh / Vr = (hh / hr)
where:
Vh = wind velocity at height h
Vr = wind velocity at reference height (normally 10 metres)
hh = height in question
hr = reference height (normally 10 metres)
= the wind shear coefficient
Young goes on to note that another factor needs to be considered, the stability of the atmosphere. This can be stable, neutral, or unstable. Figure 3 below, also adapted from Young’s report, shows the conditions of a neutral atmosphere near the ground, with a stable atmosphere above, or a stable atmosphere near the ground with a neutral condition above.
TempVelocityTempVelocity
Neutral Atmosphere near the Ground with Stable Above Stable Atmosphere near the Ground with Neutral Above
Figure 3 - Stability of Atmosphere Can Influence Profile
The sketches in Figure 3 show that neither the wind velocity nor the temperature necessarily follow the power equation of a steadily increasing velocity with height, or the temperature relationship of a decreasing temperature with height. The figure shows a typical wind turbine with a hub height of about 80 metres, at the transition point between the stable and neutral atmosphere condition as might occur.
The temperature reference line shows that in a neutral atmosphere, the temperature can be expected to fall about 1C per 100 metres, but in the stable atmosphere, the temperature can rise with height. (This is alternately described as a temperature inversion).
A New Explanation for Wind Turbine Whoosh – Wind Shear Page 5 of 15
The condition of thermal stability above ground elevation can be referenced in other fields of science. The Encyclopaedia of Soil Science shows in an article on Erosion by Windiii that “atmospheric conditions with neutral buoyancy are found with cloudy skies (which reduce radiative heating) and strong winds (which promote atmospheric mixing and prevent temperature stratification.) “ It goes on to describe that “On clear and sunny days (especially in arid or semi-arid areas) strong radiative heating may result in thermal instability (with a steep temperature gradient) which increases buoyancy effects and vertically stretches turbulent eddies … Conversely, atmospheric stability (often occurring at night with radiative cooling of the surface) tends to squeeze turbulent eddies vertically resulting in a strong wind gradient with little vertical mixing.”
Similarly, the doctoral dissertation “The Sounds of High Winds” by G.P van den Bergiv discusses the subject of atmospheric stability and notes, “Atmospheric stability has a profound effect on the vertical wind profile and on atmospherical turbulence strength.” Van den Berg discusses both the power law function and the logarithmic wind profile. He notes that the power law has no real physical basis, and that it may not apply under all conditions. Similarly van den Berg notes that the logarithmic wind profile “is an approximation of the wind profile in the turbulent boundary layer of a neutral atmosphere.”
Values of the wind shear coefficient are related to stability classes as defined by the Pasquill classes by van den Berg or the Classification Company Det Norkse Veritas (DNV) as shown in the following table.
Pasquill Class Name DNV Class Shear Coefficient
A Very unstable 0.09
Unstable 0.16
B Moderately unstable 0.20
C Neutral Neutral 0.22
D Slightly stable 0.28
Stable 0.35
E Moderately stable 0.37
F (Very) stable 0.41
A slightly different Pasquill Classification was defined in the paper by F. Pasquill “The estimation of the dispersion of windborne material”v in 1961.
A New Explanation for Wind Turbine Whoosh – Wind Shear Page 6 of 15
Table 1: The Pasquill stability classes
Stability class Definition Stability class Definition
A very unstable D neutral
B unstable E slightly stable
C slightly unstable F stable
Table 2: Meteorological conditions that define the Pasquill stability classes
Surface wind speed Daytime incoming solar radiation Nighttime cloud cover
m/s mi/h Strong Moderate Slight > 50% < 50%
< 2 < 5 A A – B B E F
2 – 3 5 – 7 A – B B C E F
3 – 5 7 – 11 B B – C C D E
5 – 6 11 – 13 C C – D D D D
> 6 > 13 C D D D D
Note: Class D applies to heavily overcast skies, at any wind speed day or night
The issue of atmospheric stability is an important one for predicting the impacts of releases from chemical facilities, fires, and nuclear facilities. The “Safety Report” of Bruce Nuclear Generating Station Avi, for example, shows the prevalence of stability class E and F. The 1994 issue of the Safety Report, shows stability classes E and F occurring with the following frequency (based on 4 to 9 years of data for each):
London Ontario 28.4% of the time
Mount Forest Ontario 27.3% of the time
Muskoka Ontario 27.9% of the time
Sudbury Ontario 22.1% of the time
Flint, Michigan 28.5% of the time
Wiarton, Ontario 24.5% of the time
In the 2003 reissue of the “Safety Report”vii atmospheric stability was calculated using the Sigma Theta () method, as dictated by the US NRC and US EPA. Using this method the frequency of occurrence of Atmospheric Stability Classes E and F for Wiarton Ontario in the preceding 4 year period was E = 9.3% and F = 9.1%.
Since by definition Pasquill Class E and F can only exist at night (which is less than half of a day in Ontario), the fact that these conditions exist between 18.4 to 28.4% of the time in total in Ontario, suggest that they apply for over half of all nights.
A New Explanation for Wind Turbine Whoosh – Wind Shear Page 7 of 15
Modelling Atmospheric Stability
It is clear that neither the normal power equation (described above), nor the common logarithmic relationship for wind speed as a function of vertical elevation from International Standard IEC 61400-11 shown below provide any transition to describe the change in atmospheric conditions that occur when atmospheric stability occurs.
Figure 4 - Effect of Shear and Stability on Incident Wind Speed
Wind Speed m/s
Key:x = shear of 0.44 - no stability layer0 = shear of 0.14 - no stability layer+ = shear of 0.44 - stability layer 40mc = shear of 0.14 - stability layer 40m
0
Rick
Line
Rick
Callout
Stable Boundary Layer formed at 40 meters.
A New Explanation for Wind Turbine Whoosh – Wind Shear Page 8 of 15
Figure 4, on the previous page shows the effect of varying wind shear and on the stability level on the wind speed in metres per second at increasing heights above ground. For the case of no stable layer in the lower atmosphere, the case has been shown where for shears of 0.14 (nominally a neutral atmosphere) and for 0.44 (a stable atmosphere), plotting both cases for the same wind speed of 10 metres per second at the 80 metre hub height of a wind turbine. The curve labelled with the “o”s show that for the case of the wind shear of 0.14 (neutral atmosphere) this corresponds to a wind speed of about 7.5 metres per second at 10 metres above the ground, while for the wind shear of 0.44 (stable atmosphere) the curve labelled with the “x”s shows a wind speed of 10 metres second at 80 metres corresponds to a wind speed of 4 metres per second at 10 metres above the ground. The two shifted curves noted by the “+” and “c” symbols show the case of atmospheric stability that can occur on the majority of nights as shown above for the case of Southern Ontario.
In this case, the wind speed may be low up to the level of the top of the stable layer. This is a familiar phenomenon seen in the smoke that rises vertically from a campfire on the ground or a low chimney at night before sharply changing direction when it reaches the top of the stable layer. The power law is applied as before to calculate the wind speeds above the top of the stable layer once the atmosphere again becomes either neutral or unstable.
Sketched beside the curves of wind speed, as a function of height is a normal wind turbine, with a hub height of 80 metres and a blade diameter of 82 metres. Observation of this figure shows that during the neutral atmosphere with a shear of 0.14 and no stable layer (typical of daytime hours) the wind speed is roughly the same from the top to the bottom of the turbine rotor (varying less than 10% from the top to the bottom of the blade circle.) However, during the condition of a stable atmosphere that can exist on the majority of nights, the variation of incident wind speed across the turbine rotor varies significantly more, ranging from 33% to over 100%. Not only does this variation of wind speed cause high mechanical stresses across the rotor at night as reported by the United States National Renewable Energy Laboratoryviii it can be shown that it has an impact on the “Whoosh” noise.
Showing the Effect of Stability on Noise
In “The Sounds of High Winds” van den Berg shows the strong influence between angle of attack (the angle between the incoming air flow and the blade chord)ix and wind turbine noise in a stable atmosphere. In Figure III.2 of his paper (adapted as Figure 5 below), the local wind velocity divided by the air velocity due to rotation is seen to be the tangent of the flow angle .
flow angle . Local Wind Velocity
Air velocity due to rotation
Velocity of incoming air
Figure 5 - Air Flow Over Turbine Blade
A New Explanation for Wind Turbine Whoosh – Wind Shear Page 9 of 15
To display the result of atmospheric stability on the noise produced, an Excel spreadsheet was created to calculate the wind speed incident on the turbine blades as they rotate, in both daytime neutral cases and at night when a stable level is created in the atmosphere typical of the case shown in Figure 4. For simplicity, the turbine blades were designated as the Red, Blue and Green blade, and the elevation was calculated for the point 75% of the distance from the hub on the turbine blade (recognizing the work by Oerlemans / Schepers) for one full rotation of the turbine rotor at each 30-degree increment of the rotation. The rotation direction is clockwise with the Blue blade following the Red blade. See Photos 1 and 2 at the end of the text. The example of a turbine with an 82-metre rotor diameter was used, typical of wind turbines being installed today in Ontario – the Vestas V82, or the Enercon E82.
The wind speed at the location of each of the three turbine blades was then calculated, for the cases of a wind shear of 0.14, 0.26, and 0.44, and for a stable layer at 0 metres, 20 metres and 40 metres, to give 9 cases. The wind speed was calculated using an assumption that the wind speed is constant (and low) up to the top of the stable atmosphere layer, then to increase as given by the power law. The increase is described by the wind shear after that point. Calculations were made for wind shears from 0.14 to 0.44 (typical of shears shown to exist in the paperx presented at 2007 at the Wind Turbine Noise Conference). Actually, the work by Young, presented at the Ontario Municipal Board in 2007 showed that in a number of cases, the wind shear was greater than 1.0.
Once the local wind speed was calculated incident upon each blade, then the velocity of incoming air was calculated as the resultant vector from combining the local wind velocity and the air velocity due to rotation of the blade. This assumed the rotational speed of 14.4 revolutions per minute at the point 75% from the hub on each 41 metre blade as about 45 metres per second.
Then the “flow angle” of the airflow over the turbine blade was calculated from the tangent relationship described above (the local wind velocity divided by the air velocity due to rotation is seen to be the tangent of the flow angle ).
In Table B1 of appendix B of his paper “the Sounds of High Winds” van den Berg describes the increase of trailing edge sound with angle of attack as follows.
Since van den Berg identifies a linear relationship between the added sound pressure level SPL and the angle of attack, the spreadsheet data was then used to add the angle of attack for each of the three turbine blades for the nine cases of varying wind shear and top of the stable layer. While this would not produce an actual sound power level, the intent was to show the change in the summed flow angles as the blades rotate. Since for modern turbines, the blade pitch does not vary other than for changing power levels, changes in the angle of attack can be derived from changes in the total flow angle as the air passes over the turbine blade.
The results of the curves are discussed in the observations, below. The spreadsheet data is available from the author.
A New Explanation for Wind Turbine Whoosh – Wind Shear Page 10 of 15
Observations
Chart 1 plots the summed flow angle from all three turbine blades at each rotary position for the nine cases examined. For the assumption of the same 10 metre per second air flow at the 80 metre hub level of the turbine, the greatest summed flow angle exists for the case of the lowest wind shear, as expected since for this case the wind velocity is most constant across the entire turbine rotor. This condition results in the least variation in the summed flow angle as the rotor goes through its circular circuit, and thus a “swish” of little variation. Chart 1 shows that as a stable level in the atmosphere is created, the variation in the summed angle of flow becomes more apparent, and the “Whoosh” would become more apparent. Again, the Chart shows that the greatest summed flow angles are calculated for the smallest wind shear. This is largely a result of the method of calculation, which assumes the same 10 metres per second at the 80 metre level for the case with no stable level.
Chart 2 makes it clear that the most significant changes in the normalized sum of the Angle of Flow exists for the case with the largest wind shear and the top of the stable level at 40 metres. The high shear, coupled with a stable atmosphere produces much more variable effect in the flow angle. Since this is the predominant cause of the
turbulent flow condition, and hence the noise, it produces a cyclic nature of the sound. Chart 2 shows that the highest normalized sum for the Angle of Flow occurs when the blades pass the top of their path, and is lowest when the blades pass the bottom of the path. This is contrary to the finding of Oerlmans and Schepers, who determined that “most of the noise is produced by the outer part of the blades during the downward motion” as noted earlier. Figure 6 suggests an explanation of the discrepancy.
Field observations taken to confirm the conclusions of this report at a distance of about 400 metres from the turbine pictured did appear to indicate that the “Whoosh” was most pronounced as each blade passed the 4 o’clock position (or 120 to 150 degrees). However, when one considers that at
At 82 m from towerMeter is 146 m from top
At 600 m from towerMeter is 612 m from top
At 15 C, sound travels 340 m per sec. Bladestravel 14.4 rpm - bladetip travels 62 m/s or 1/4 of a revolution in 1 sec
ObserverDistance Rotation when Sound Arrives
82 m
200 m
400 m
600 m
0.4 sec = 0.1 revolution
0.7 sec = 0.2 rev
1.2 sec = 0.3 rev
1.8 sec = 0.4 rev
Figure 6 - Apparent rotation at distance
A New Explanation for Wind Turbine Whoosh – Wind Shear Page 11 of 15
15C sound travels at 340 metres per second, one recognizes that at a distance of 400 m the sound takes 1.2 seconds to reach the observer, and in that time, the turbine blade rotates 0.3 revolution. What certainly sounded to this observer to be a sound loudest during the downward motion with the “Whoosh” occurring about the 4 o’clock position, means that the sound was actually generated 0.3 of a revolution earlier, as the blade was just passing the top of its path. This confirms the calculation performed in this report, and supports the observation that the greatest sum of the flow angle, and thus the summed angle of attack occurs when the blades pass the top of the rotation.
One sees that an explanation of the night time “Whoosh Whoosh Whoosh” compared to the daytime gentle “swish swish swish” becomes clear. When the normalized daytime case, for the neutral or turbulent atmosphere is examined, the fluctuation in flow angle, and hence sound levels is barely evident, while the nighttime case with a stable level in the atmosphere case shows a very pronounced cyclic nature.
Conclusions
The anecdotal evidence that wind turbines are more annoying at night, and that the “Whoosh” is more pronounced at night cannot be fully explained by the normal power law, the logarithmic change in velocity with height, by Doppler effects, or by the creation of sound towards the outer limits of the turbine blade on downward motion.
The explanation of the cyclic nature of the “Whoosh Whoosh Whoosh” can be found in the cyclical change of the sound level that occurs, particularly at night, as a stable atmosphere is created. The stable atmosphere creates the greatest change in the summed angle of attack considering the contribution of each blade taken together, as is heard by an observer. This paper has shown that this condition of a stable atmosphere occurs on the majority of nights in Ontario (and likely occurs elsewhere with a similar frequency, as climatic conditions do not observe political boundaries).
The model results displayed in this paper show that when a stable atmosphere exists at night time, the cyclic nature of the sound from wind turbines is more pronounced than it is in the daytime when a stable level in the atmosphere does not exist. Human hearing is capable of resolving a wide variation of sounds, and is particularly sensitive to changes in sound level. Previous work by van den Berg, Pedersen, Bouma, and Bakker, “WINDFARMperception”xi published in 2008 showed that “in general respondents perceived wind turbines as being louder in wind blowing from the turbine to their dwelling (and less loud the other way around), in stronger wind and at night.” The report also stated, “In this survey sound was the most annoying aspect of wind turbines. From this and previous studies it appears that sound from wind turbines is relatively annoying: at the same sound level it causes more annoyance than sound from air or road traffic. A swishing characteristic is observed by three out of four respondents that can hear the sound and could have been one of the factors explaining the annoyance.”
The existence of this condition as shown in this report reinforces the need to apply a penalty to the average sound received from wind turbines at night because the cyclic “Whoosh” produced during stable atmospheres makes them particularly noticeable and annoying, compared to other noise sources.
A New Explanation for Wind Turbine Whoosh – Wind Shear Page 12 of 15
Photographs
A New Explanation for Wind Turbine Whoosh – Wind Shear Page 13 of 15
Charts
Chart 1 – Summed Angle of Flow as Turbine Rotates
Summed Angle of Flow as Turbine Rotates
24
26
28
30
32
34
36
38
1 2 3 4 5 6 7 8 9 10 11 12
Rotary Position in 30 Degree increments - First Position is Red Blade #1 at Top - 0 Degrees
B Sum 0.14 0 mB Sum 0.14 20 mB Sum 0.14 40 mB Sum 0.26 0 mB Sum 0.26 20 mB Sum 0.26 40 mB Sum 0.44 0 mB Sum 0.44 20 mB Sum 0.44 40 m
Chart 2 – Normalized Sum of Angle of Flow for All 3 Blades
Normalized Sum of Angle of Flow for All 3 Blades
0.985
0.99
0.995
1
1.005
1.01
1.015
1 2 3 4 5 6 7 8 9 10 11 12Rotary Position in 30 Degree increments - Position 1 Red Blade at Top, Position 5 Blue Blade at Top, Position 9 Green Blade at Top
Norm Sum 0.14 0mNorm Sum 0.14 20mNorm Sum 0.14 40mNorm Sum 0.26 0mNorm Sum 0.26 20mNorm Sum 0.26 40mNorm Sum 0.44 0mNorm Sum 0.44 20mNorm Sum 0.44 40m
A New Explanation for Wind Turbine Whoosh – Wind Shear Page 14 of 15
Acknowledgements
I would like to acknowledge the review of a first draft of this paper by the following experts (arranged alphabetically). I do not wish to imply that the reviewers necessarily concur with all content of the paper, but their thoughtful comments helped to clarify the final product for subsequent readers. Thank you sincerely.
John Harrison, Professor Emeritus, Physics, Queens University, Kingston ON, Canada
George Kamperman, Acoustical Consultant, Wisconsin Dells, WI, USA
Nick Kouwen, Professor Emeritus, Civil and Environmental Engineering, University of Waterloo, ON, Canada
Stefan Oerlemans, National Aerospace Laboratory, NLR, The Netherlands
Gerard Schepers, ECN Wind Energy, The Netherlands
G.P. (Frits) van den Berg, University of Groningen, The Netherlands
Jim Young, Meteorological Consultant, Kincardine ON, Canada
A New Explanation for Wind Turbine Whoosh – Wind Shear Page 15 of 15
References
i Oerlemans, Stefan and Schepers, Gerard, “Prediction of Wind Turbine Noise and Comparison to Experiment” presented at the Second international Meeting on Wind Turbine Noise, Lyon France, September 2007. ii Young, James W.S. Ph.D., P.Eng. “Analysis of Boundary Layer Winds near Goderich and Their Application to Wind Farms along the East Coast of Lake Huron” by as presented at Ontario Municipal Board Hearing PL060986, April 2007. iii Lai, R. “Encyclopaedia of Soil Science” ISBN: 0849350530, Page 618, Erosion by Wind: Micrometeorology. iv van den Berg, G.P. “The Sounds of High Winds, the effect of atmospheric stability on wind turbine sound and microphone noise” submitted as a doctoral dissertation to the University of Groningen, May 12, 2006. Chapter III from pages 27 to 38 discusses the subject of atmospheric stability. v Pasquill, F. (1961). “The estimation of the dispersion of windborne material.” The Meteorological Magazine, vol 90, No. 1063, pp 33-49. vi Bruce Generating Station A Safety Report, Chapter 1, Site Evaluation, Section 2, “Factors Affecting a Release” 1994 Edition, subsection 2.2.1.6 “Atmospheric Stability” vii Bruce Nuclear Generating Station A Safety Report, NK21-SR-01320-00001, Rev 002, July 4, 2003, predicts stability class using the Sigma Theta () method as defined by the US NRC (Nuclear Regulatory Commission) Proposed Revision 1 to Regulatory Guide 1.23: Meteorology Programs in Support of Nuclear Power Plants, 1980, and the US EPA (Environmental Protection Agency) “Guidelines on Air Quality Models” Report No, EPA-450/2-78-027R, Table 9-3, pp 9-21, 1986. viii Kelley N, Smith B, Smith K, Randall G, Malcolm D, “Evaluation of Wind Shear Patterns at Midwest Wind Energy Facilities” National Renewable Energy Laboratory, US Department of Energy, May 2002, Paper NREL/CP-500-32492. ix Van den Berg G.P. . “The Sounds of High Winds, the effect of atmospheric stability on wind turbine sound and microphone noise” submitted as a doctoral dissertation to the University of Groningen, May 12, 2006 (previously also listed as Reference iv) discusses angle of attack and stability on noise in Chapter III, Chapter V, and Appendix B. x Palmer, William K.G. “Uncloaking the Nature of Wind Turbines – Using the Science of Meteorology” presented at the Second International Meeting on Wind Turbine Noise, Lyon, France, September 2007. xi Van den Berg F, Pedersen E, Bouma J, Bakker R, “WINDFARMperception – Visual and acoustic impact of wind turbine farms on residents” University of Groningen, FP6-2005-Science-and-Society-20. Specific Support Action, Project no. 044628, Final Report, June 3, 2008.
1
WHY IS WIND TURBINE NOISE POORLY MASKED BY ROAD TRAFFIC NOISE?
Eja Pedersen1, Frits van den Berg2
1Halmstad University and University of Gothenburg {[email protected]}
Abstract The possibility of road traffic noise masking noise from wind turbines was explored among residents living close to wind turbines in the Netherlands (n = 725) with different levels of road traffic noise present. No general masking effect was found, except when levels of wind turbine sound were moderate (35 – 40 dB(A) Lden) and road traffic sound level exceeded that level with at least 20 dB(A). This low masking capacity may be due to the different time patterns of these noise sources, both on a small time scale (car passages/regular blade passing) and a larger time scale (diurnal and weekly patterns). Also, wind turbine sound is relatively easy audible and may be heard upwind more often than road traffic.
Suitable sites for wind turbines can be difficult to find due to conflicting requirements. Placing wind farms close to the electric grid and existing roads (both are usually better available in populated areas) is favourable for investment costs, but it may increase the possibility that neighbours may be visually and aurally disturbed. It is therefore not uncommon that wind turbines are planned to be erected at distances from dwellings that are unacceptable by the local residents. The individual appraisal of wind turbines planned close to one’s home is not irrational but based on considerations such as the evaluation of the wind turbines’ impact (scenic and otherwise) and feelings of equity and fairness [1]. The apprehension that for example the
Invite
d Paper
INTERNOISE 2010 │ JUNE 13-16 │ LISBON │ PORTUGAL
2
noise will be disturbing in an otherwise comparable quiet area has been confirmed by research: wind turbine noise may be louder and is apparently more annoying than was assumed before the growth in wind turbine numbers and power in the ‘90s [2, 3]. The recommended noise limits (different in different countries), and consequently a minimum distance depending on the number of wind turbines and their sound power levels, should therefore be kept or should even be more rigorous if the original level of noise protection is to be maintained. To decrease the adverse impact it has been suggested that masking sounds could create a situation where the wind turbines could not be heard and therefore not annoying. Outdoor sounds that are potential maskers are natural sounds like wind induced sounds from trees or sound from sea waves, or manmade noise, of which road traffic appears to be the most common. Models have previously suggested that natural sounds are fairly good potential maskers for wind turbine noise due to, for example, similarities between the broadband noise of vegetation and wind turbine sound [4]. Experimental listening tests have however shown that the detection thresholds for wind turbine noise in the presence of natural sounds from trees or sea waves are in the range -8 to -12 dB S/N-ratio, implying that the ambient sound must have a considerably higher level in order to completely mask the wind turbine noise [5]. Loudness tests, in the same series of experiments, indicated on the other hand that introducing natural sounds, for example the rustling of trees, of the same level as the wind turbine sound, could reduce the perceived sound level of the wind turbine sound with up to 5 dB. This hypothesis is yet to be experienced in the field; it is not obvious that this would lead to decreased risk for noise annoyance. The masking effect of road traffic on wind turbine noise has to our knowledge not been studied in listening tests. An epidemiological study carried out in the Netherlands 2007 [3] provided an opportunity to compare the perception of wind turbine noise at different levels of ambient noise, in this study mainly from road traffic. The results indicate that also for traffic noise the masking effect is low [6]. The objective of this paper is to discuss why road traffic does not decrease the risk for being annoyed by wind turbine sound.
2 Method
A field study was carried out in the Netherlands among residents in wind farm areas. A stratified sample of 1948 people living within different levels of wind turbine noise were approached with a questionnaire about environmental issues in their residential area; 725 responded satisfactory (37%; a non-response analysis showed no statistically significant differences between responders and non-responders). The questionnaire comprised two parallel parts measuring perception of sound and attitude towards the sound source; one part concerning road traffic sound and the other concerning wind turbine sound. The possibility to hear the sounds from the dwelling or the garden/balcony was measured binary with no/yes. Noise annoyance was measured with several items, referring both to outdoor and indoor situations. Two factor scores derived from five items (WT annoyance, Cronbach’s alpha 0.89) and six items (RT annoyance; Cronbach’s alpha 0.86), respectively, were used as dependent variables with mean = 0 and standard deviation = 1. Attitude towards the noise source’s impact on landscape scenery were measured with a 5-point scale from “very positive” to “very negative”. Noise sensitivity was measured on a 5-point scale. Stress was measured with 6 items and factorized (Stress; Cronbach’s alpha 0.84).
INTERNOISE 2010 │ JUNE 13-16 │ LISBON │ PORTUGAL
3
The immission levels in dB(A) of wind turbine sound outside the dwelling of each respondent were calculated as recommended by the international ISO standard [7]. The levels correspond to a situation with a neutral atmosphere and a wind speed of 8 m/s at 10 m height. The immission levels were transformed into levels of day-evening-night values (Lden) by adding 4.7 dB [8]. Levels of road traffic sound were obtained from the Dutch National Institute for Public Health (RIVM) who supplied calculated Lden immission levels due to traffic in 5 dB intervals for a 25 by 25 m grid over the entire country. The levels approximate road traffic exposure as there was no railroad or airport close to any of the respondents. The respondents were divided into sub-samples due to the levels of road traffic sound exceeding the levels of wind turbine sound. This paper explores to what extent wind turbines were heard or were annoying when the sound levels of road traffic exceeded that of wind turbines with 5-10 dB (n = 79), 10-15 dB (n = 138), 15-20 dB (n = 108) or 20-25 dB (n = 67). Noise annoyance due to wind turbines is influenced by having an economical benefit from the wind turbines or not [3]. Only respondents that did not benefit were included when the impact of road traffic noise on annoyance with wind turbine noise was explored and the sample sizes were therefore somewhat reduced in Figure 2 (below): 5-10 dB (n = 70), 10-15 dB (n = 119), 15-20 dB (n = 102) or 20-25 dB (n = 66). For more detailed description of the research methods see [3] and [6].
3 Perception of wind turbine sound in different levels of road traffic sound
3.1 Possibility to hear wind turbine sound
The proportions of respondents that reported hearing wind turbine sound outside their dwelling increased from 0-23% at the interval 30-35 Lden to 59-69% at 40-45 Lden (Figure 1). Though there are differences between the groups these are not statistically significant, i.e. no masking effect was detected.
0
10
20
30
40
50
60
70
80
90
100
30-35 35-40 40-45
WT sound, Lden
Hea
r w
ind
tu
rbin
es, %
5-10
10-15
15-20
20-25
Figure 1. Proportion of respondents that could hear wind turbine sound outdoors at their
dwelling or garden/balcony (%) related to levels of wind turbine sound (Lden) for four situations where road traffic sound levels exceeded wind turbine sound levels with 5-10, 10-
15, 15-20 or 20-25 dB(A) Lden.
INTERNOISE 2010 │ JUNE 13-16 │ LISBON │ PORTUGAL
4
3.2 Annoyance due to wind turbine sound
The mean annoyance score increased from -0.6 - -0.5 at the interval 30-35 Lden to 0.1 – 0.8 at 40-45 Lden (Figure 2). When looking at the four RT-WT level difference groups, a reduction of annoyance was found, but only for respondents in the interval 35 – 40 Lden of wind turbine noise when the road traffic noise exceeded wind turbine noise with 20 – 25 dB. This difference was statistically significant (t = -0.69; p<0.05), other differences were not.
-0.8
-0.6
-0.4
-0.2
0
0.2
0.4
0.6
0.8
1
30-35 35-40 40-45
WT sound, Lden
WT
an
no
yan
ce 5-10
10-15
15-20
20-25
Figure 2. Mean annoyance score for wind turbine noise related to levels of wind turbine
sound (Lden) for four situations where road traffic sound levels exceeded wind turbine sound levels with 5-10, 10-15, 15-20 or 20-25 dB(A) Lden.
Annoyance due to wind turbine noise was positively correlated to annoyance with road traffic noise (r = 0.26; p<0.001) suggesting that there was no masking effect but an increased risk for annoyance if both noises were present. This result was explored further in a multivariate general linear model with two dependent variables present simultaneous: annoyance with wind turbine noise and annoyance with road traffic noise (Figure 3).
WT annoyance
RT annoyance
WT visibilityno/yes
WT soundLden
WT attitude5-point scale
RT soundLden
RT visibilityno/yes
RT attitude5-point scale
StressFactor score
Noise sensitivity5-point scale
0.12
0.06
0.17
0.13
0.11
0.04
0.01
0.01
0.06
0.01
Figure 3. Conceptual figure of variables simultaneous explaining the variance of the two
dependent variables annoyance with wind turbine noise (adj. R-square 0.43) and road traffic noise (adj. R-square 0.38), respectively. Result of multivariate general linear model. Adjusted
for economical benefits from wind turbines. Partial eta-squared values; only statistically significant associations are shown.
INTERNOISE 2010 │ JUNE 13-16 │ LISBON │ PORTUGAL
5
Noise from wind turbines, together with visibility of wind turbines and attitude to their impact on the landscape, only explained the variance in annoyance due to wind turbines, but not the variance in annoyance due to road traffic. Similar, noise levels, visibility and attitude regarding road traffic were only associated to annoyance with road traffic noise. However, noise sensitivity and stress explained part of the variance of both annoyance score, which explains the correlation between them. The test indicates that there was no enhanced risk for annoyance due to double exposure: this risk is simply the sum of both separate risks.
3.3 Conditions influencing loudness of wind turbine sound
One of the questions in the WINDFARMperception study survey was about conditions when the wind farm sound was louder or less loud [10]. Figure 4 shows the results: more respondents thought the sound from the wind farm was louder when the wind blew from the wind farm towards the dwelling or when the wind was stronger. Unfortunately we do not know whether respondents were referring to the near-ground wind they were exposed to or the higher altitude wind that the blades were exposed to (which can be inferred from the rotational speed and the backwards bending of the blades). A minority of respondents (22%) thought the sound was less loud at night: 40% thought the sound was louder at night and another 38% saw no clear difference between night and day in this respect.
4 Possible acoustical explanations for the poor masking effect
In the text above WT and RT sound levels were compared based on their Lden at receiver locations. However, when the Lden values are equal this does not mean that both sounds are acoustically equal, nor that the levels are equal at all times or the sounds have the same perceptive quality–even when they are of the same level. The distributions over time and frequency, as well as the character of the sound and the altitude of the source, have an influence on their perception, and thus possibly on the annoyance they may cause. These influences will be discussed here.
Figure 4. Opinions on conditions when wind farms are perceived as being louder or less loud (based on [10])
INTERNOISE 2010 │ JUNE 13-16 │ LISBON │ PORTUGAL
6
4.1 Diurnal variations in level
Road traffic noise usually subsides at night and in early morning resumes to the morning rush hour level. Figure 5 shows the change in level for two situations: a busy motorway in the central part of the Netherlands and the city ring road of Amsterdam (figure taken from [9]). It also shows that the lowest night time levels Lmin are approximately 8 dB below the highest levels in day time for the motorway; for the ring road the difference is somewhat higher: 10 dB. When compared to Lden, the minimum levels are approximately 12 dB lower.
The diurnal variation for an 80 m hub height wind turbine is rather different as figure 6 shows for an average day in one year, where wind speed data from 1987 have been used (figure taken from [10]).
Figure 5. Hourly equivalent sound level (Leq) in dB(A) per average day in each of six years at a busy motorway (blue dots) and over
three years at the Amsterdam ring road (orange dots).
Figure 6. Hourly averaged real and estimated (log) sound power level of a Vestas V80-2MW at two power settings.
98
100
102
104
106
108
0:00 6:00 12:00 18:00 0:00clock time (GMT)
aver
age
soun
d po
wer
leve
l dB(A
) Lw 105dBA
Lw ,log 105dBA
lw 101dBA
Lw ,log 101dBA
INTERNOISE 2010 │ JUNE 13-16 │ LISBON │ PORTUGAL
7
Here the night time level is on average higher than daytime levels, as in daytime the 80 m wind is slowed down by more intense coupling to lower altitude air due to vertical movements that are stronger when the sun is up. Here the night time level is approximately 6 dB lower than the Lden due to this wind turbine, the lowest (daytime) level is 7 dB lower than Lden. Hence, when road traffic and wind turbines produce the same Lden sound level, the RT level in the quietest hour of the night is 12 dB lower whereas the WT level at that time is 6 dB lower and thus, at that time, 6 dB higher than the RT sound level. In daytime this difference is smaller (3 dB).
4.2 Spectral differences
Road traffic sound as well as wind turbine sound is relatively broad band. In figure 7 the spectral distributions of the sounds are plotted as A-weighted octave band levels where each level is given relative to the total sound power. Expressed this way, the reference total sound power is equal (viz. 0 dB) for each source. The WT spectrum is the sound power spectrum of a Vestas V80-2MW, the RT spectra are those used for light, medium and heavy vehicles in the Dutch calculation model for road traffic noise, and the average spectrum for all traffic as measured at the city ring road (taken from [9]). The figure shows that wind turbine sound, when compared to road traffic sound, is relatively loud at low frequencies up to 500 Hz and then less loud (at higher levels the wind turbine is again louder, but such high frequencies are irrelevant at distances over several hundreds of meters, and even more so when indoors). Of course at some distance from the sources the spectrum will change due to frequency dependent attenuation, but that will affect the spectra in the same way and thus not change the relative contributions. If the WT and RT sound levels are equal at the receiver, the WT will be louder at frequencies below 500 Hz, and less loud above that frequency. All spectral levels of the wind turbine will be lower then the RT spectral levels (averaged over traffic types) when the wind turbine level is reduced by at least 8 dB. The other way around, all RT spectral levels will be lower than the (average) WT levels if the wind turbine is at least 4 dB louder.
-35
-30
-25
-20
-15
-10
-5
010 100 1000 10000
octave band frequency in Hz
leve
l in
dB(A
) re
lativ
e to
tota
l sou
nd p
ower
wt
light
medium
heavy
average
Figure 7. Octave band spectra (each level relative to total sound power level) of a wind turbine (wt) and of light, medium and heavy
vehicles and the average as determined on the city ring road.
INTERNOISE 2010 │ JUNE 13-16 │ LISBON │ PORTUGAL
8
Figure 8. Contours of the sound shadow in twelve night over a year for a source (x) at 95 m height.
4.3 Sound character: swishing
Swishing is an important characteristic of wind turbine sound: 75% of the respondents of the WINDFARMperception study thought that swishing or lashing was the best description of the sound [10]. Reported swish levels (the level of the peaks occurring at blade passing frequency relative to the base level in between peaks) are up to approximately 5 dB, highest reported values are 9 dB [11]. Obviously the audible modulation attracts attention, just as the reverse gear beep on trucks or the signal of an alarm clock do. From various studies it follows that this modulation is equivalent in annoyance to the un-modulated sound at an approximately 5 dB higher level.
4.4 Sound shadow
Usually a sound source is louder downwind of the source than upwind in the sound shadow, where only reflected and turbulence scattered, but no direct sound rays can reach an observer. The distance between the sound source and its sound shadow depend on atmospheric conditions and on the height of the source. With a normal temperature profile (temperature decreasing with height) in a still atmosphere sound rays refract upward and the sound shadow is along a circle with the source in its center. When some wind is present, and it is when a wind turbine is in operation, the refraction due to wind is usually stronger and there is a sound shadow only in the upwind direction. The distance to the source depends on the wind speed and the height of the source: for a high source the sound shadow is further away than for a low source. In figure 8 the contours of the sound shadow related to a sound source at 95 m height are plotted, using night time atmospheric data from the Royal Netherlands Meteorological Institute and an algorithm provided by Makarewicz et al [12]. The contours are open as there is no sound shadow in the downwind direction. For a source at 95 m height the minimum and maximum distances to the sound shadow in the upwind direction at night are just over 500 m and just over 1 km (average over all days 650 m). For a road, the sound shadow is at least 130 m and at most 250 m (average: 160 m) from the road in the upwind direction. This means that for residents at several hundreds of meters from a road may often not hear the road when it is downwind, but they will often be able to hear wind turbines in that situation if these are alongside the road.
INTERNOISE 2010 │ JUNE 13-16 │ LISBON │ PORTUGAL
9
5 Discussion
Most respondents in the WINDFARMperception survey thought the sound from one or more modern, tall wind turbines at night is louder than or not very different from the sound in daytime, which is consistent with the actual average sound levels of these turbines. Also, most respondents thought the sound is louder in strong winds and when the wind is blowing towards their dwelling, which is consistent with the wind dependent sound power level and the directivity of the sound (higher at the downwind side). Comparing equal Lden levels of road traffic and wind turbine sound gives no information on the levels or the relative audibility of each sound at specific times. In fact, at equal Lden values wind turbine sound levels will be higher at night than road traffic sound levels because of the different diurnal patterns, the different spectral distributions and the modulation present in wind turbine sound. It can be estimated that the Lden due to modern, tall wind turbines must be 6 dB (diurnal variation) + 8 dB (spectral differences) + 5 dB (amplitude modulation) = 19 dB lower then the Lden due to road traffic in order to obtain equal hourly levels at the least busiest traffic hours at night. If the road is a provincial road and not a very busy motorway, there may be shorter or longer periods of time, especially at night, when no road traffic at all can be heard. In that case the Lden due to that road traffic is in fact irrelevant when determining the audibility of a wind turbine. It is not clear whether the greater distance of the sound shadow to a source is important in relation to annoyance. An upwind receiver may be in the sound shadow of a road but not in the sound shadow of a wind turbine along that road, but the receiver is in that case also at the front side of the turbine which emits less sound than the rear side.
Acknowledgments
We thank our co-researcher Roel Bakker and Jelte Bouma at the Medical Center in Groningen, and the RIVM for providing the road traffic sound data.
References
[1] Wolsink, A. Wind power implementation: The nature of public attitudes: Equity and fairness instead of ‘backyard motives’. Renewable & Sustainable Energy Reviews, Vol 11, 2007, pp 1188-1207.
[2] Pedersen. E.; Persson Waye, K. Wind turbines—low levels noise sources interfering with restoration?, Environmental Research Letters, Vol 3, 2008, 5 pp.
[3] Pedersen. E.; van den Berg, F.; Bakker, R.; Bouma, J. Response to noise from modern wind farms in The Netherlands, Journal of the Acoustical Society of America, Vol 126 (2), 2009, pp 634-643.
[4] Bolin, K. Masking of wind turbine noise by ambient noise. Licentiate Thesis in Technical Acoustics. KTH, Stockholm, Sweden, 2006.
[5] Bolin, K.; Nilsson, M.E.; Khan, S. The potential of natural sounds to mask wind turbine noise, Acta Acustica united with Acustica. Vol. 96, 2010, pp 131-137.
[6] Pedersen. E.; van den Berg, F.; Bakker, R.; Bouma, J. Can road traffic mask sound from wind turbines? Response to wind turbine sound at different levels of road traffic sound, Energy Policy, Vol 38, 2010, pp 2520-2527.
INTERNOISE 2010 │ JUNE 13-16 │ LISBON │ PORTUGAL
10
[7] Attenuation of sound during propagation outdoors. Part 2: general method of calculation. ISO 9613-2, Geneva, Switzerland, 1996.
[8] Van den Berg, F. Criteria for wind farm noise: Lmax and Lden. The 7th European Conference of Noise Control, Acoustics’08, Paris, June 30 – July 4, 2008.
[9] Jabben J, Potma CJM. Sound monitor 2005 – trend and validation measurements of environmental sound. Report RIVM (in Dutch), Bilthoven, 2006
[10] Van den Berg F, Pedersen E, Bakker R, Bouma J. Project WINDFARMperception – Visual and acoustic impact of wind turbine farms on residents. University of Groningen, UMCG and University of Göteborg, 2008
[11] Van den Berg F. Why is wind turbine noise noisier than other noise? Proceedings of Euronoise2009, Edinburgh, October 26-28, 2009
[12] Makarewicz R, Wojciechowska H. Noise duration for a single overflight. Journal of the Acoustical Society of America, Vol. 114 (218), 2003, 218-224
1
PREDICTING ANNOYANCE BY WIND TURBINE NOISE
Sabine A. Janssen1; Henk Vos1; Arno R. Eisses1; Eja Pedersen2
Affiliation: 1TNO Department of Environment and Health;
Abstract While wind turbines have beneficial effects for the environment, they inevitably generate environmental noise. In order to protect residents against unacceptable levels of noise, exposure-response relationships are needed to predict the expected percentage of people annoyed or highly annoyed at a given level of wind turbine noise. Exposure-response relationships for wind turbine noise were derived on the basis of available data, using the same method that was previously used to derive relationships for transportation noise and industrial noise. Data from surveys in Sweden and the Netherlands were used to achieve relationships between Lden and annoyance, both indoors and outdoors at the dwelling. It is shown that a given percentage of annoyance by wind turbine noise is expected at much lower levels of Lden than the same percentage of annoyance by for instance road traffic noise. Results were used to guide new noise regulation for wind turbines in the Netherlands.
Wind turbines have beneficial effects for the environment since they offer a clean substitute for fossil fuels. However, an inevitable side-effect is that they generate environmental noise. In order to protect residents against unacceptable levels of noise and guide noise regulation, it is important to be able to predict the expected percentage of people annoyed or highly annoyed at a given level of wind turbine noise. Recent studies investigating the community response to wind turbine noise have shown that a proportion of the residents living in the vicinity of wind turbines perceive the noise generated by them as being annoying [1-3]. Findings suggest that, at equal noise exposure levels, the expected annoyance due to wind turbine noise might be higher than annoyance due to other environmental noise sources [2,4]. The annoyance also appears to be high in comparison to exposure-response relationships for stationary sources, suggesting that wind turbines should be treated as a
Invite
d Paper
INTERNOISE 2010 │ JUNE 13-16 │ LISBON │ PORTUGAL
2
new type of source in noise regulation. However, the relationship between exposure and annoyance was previously not investigated using noise exposure measures that correspond to international standards for assessing the impact of community noise (Lden or Ldn). Furthermore, relationships were based on annoyance perceived outdoors at the dwelling, while established exposure-response relationships for other noise sources typically do not distinguish between annoyance indoors or outdoors. In the present study, exposure-response relationships between the exposure metric Lden and self-reported annoyance indoors as well as outdoors due to wind turbines were derived using the method previously used to derive the exposure-response relationships for transportation and industrial noise. The analysis was done on available data that were collected during previous studies in Sweden and the Netherlands.
2 Methods
2.1 Study design and sample
Data from two studies conducted in Sweden [1] (2000 and 2005) and one study in the Netherlands [2] (2007) were used. Both Swedish studies were conducted during the summer and had cross-sectional designs with a sample of respondents who were exposed to varying levels of wind turbine noise. The 2000 study was conducted in the south of Sweden in an area characterized primarily by agriculture in an overall flat, even landscape. The 2005 Swedish study was conducted in areas characterized by different types of terrain (i.e. even/flat vs. complex) and varying degrees of urbanization (i.e. rural vs. built-up). In both studies questionnaires were used. Of the 513 questionnaires sent to residents in the 2000 study, 351 (68%) usable questionnaires were returned. In the 2005 study 1309 questionnaires were sent to residents, of which 754 (58%) usable questionnaires were returned. The study in the Netherlands included a sample of the population living within a 2.5 km radius of a wind turbine, stratified according to: 1) wind turbine immission levels (25-30, 30-35, 35-40, 40-45 dB(A)), 2) environment type (A. Rural, quiet, B. Rural with main roads, C. Built-up). At a response rate of at least 30%, a minimum of 50 respondents per stratum (4 x 3 = 12 strata) was envisaged. A postal questionnaire, based on the Swedish questionnaire, was sent during April 2007. Of the 1948 questionnaire posted, 725 (37%) usable questionnaires were returned. All respondents received a gift voucher. A non-response analysis found no significant difference in the reported annoyance due to wind turbines between respondents and non-respondents.
2.2 Noise exposure
Annual day-evening-night A-weighted equivalent noise level (Lden) was defined in accordance with EU environmental noise guidelines. Lden was calculated from the immission levels determined in the original studies [1-2]. For each respondent, outdoor A-weighted sound power levels from the nearest wind turbine(s) were determined for a neutral atmosphere at a constant wind velocity of 8 m/s at a height of 10 meters in the direction towards the respondent, which is the reference wind velocity by convention (e.g. Swedish Environmental Protection Agency, 2001). To these data, a correction of +4.7 dB(A) was applied, calculated by van den Berg [5] as the mean difference between Lden and the immission level at a wind velocity of 8 m/s. While in principle the correction depends on the wind velocity distribution at a specific location, the type of wind turbine and the hub height, statistical wind velocity data
INTERNOISE 2010 │ JUNE 13-16 │ LISBON │ PORTUGAL
3
was not available for all study locations. Furthermore, using a variable correction factor for the situation in the Netherlands did not provide a better prediction of annoyance in comparison to Lden calculated with the fixed correction factor. Figure 1 shows the distribution of the noise exposure levels in Lden within each of the three studies. The highest wind turbine noise exposure levels (Lden) were encountered in the study in the Netherlands. The majority of Swedish respondents were exposed to levels between Lden 35 – 40 dB(A), while a relatively large proportion of respondents in the Netherlands were exposed to levels below Lden 35 dB(A) and levels over 45 dB(A). This may partly be attributed to differences in study design: in the Netherlands the stratification was based on noise exposure levels, whereas in Sweden locations were selected mainly on the basis of geographical areas.
0
20
40
60
80
100
Sweden 2000 Sweden 2005 Netherlands 2007
%
<35
35-40
40-45
45-50
50-55
55-60
Figure 1 - Distribution of wind turbine noise exposure levels (Lden) within the three studies.
2.3 Questionnaire
In all three studies, annoyance due to wind turbines and other environmental stressors were assessed with the following question: “The list below summarizes a number of aspects that you may be aware of and/or be annoyed by when inside your home. Please indicate for each aspect whether you are aware of it and whether it annoys you?” The response to each aspect was registered on a 5-point scale: 1 = “Do not notice”, 2 = “Notice, but not annoyed”, 3 = “Slightly annoyed”, 4 = “Rather annoyed” and 5 = “Very annoyed”. The same question was repeated for annoyance outside the home. To assess whether respondents benefitted economically from wind turbines, the question “Do you (partly) own one or more wind turbines?” was present in the questionnaire, to which the answers “Yes” or “No” could be given. In the present study, data of the 5-point annoyance scale were recoded and assessed as an index of self-reported annoyance indoors and outdoors. The 5-point scale was recoded to a 4-point scale: categories 1 and 2 were combined to obtain a new category 1 = “Not annoyed”. Subsequently, the annoyance response categories were converted into scales ranging from 0 to 100. This conversion is based on the assumption that a set of categories divides the range of 0 to 100 in equally spaced intervals. The general rule that gives the position of an inner category boundary on the scale of 0 to 100 is: scoreboundary i = 100 · i/m, where i is the rank number of the category boundary, starting from 1 for the upper boundary
INTERNOISE 2010 │ JUNE 13-16 │ LISBON │ PORTUGAL
4
of the lowest category, and m is the number of categories. The percentage of responses exceeding a certain cut-off point on the scale may be reported. Following convention, if the cut-off is 72 on a 0-100 scale, the result is called the percentage of “highly annoyed” persons (%HA). Likewise, a cut-off of 50 indicates the percentage of “annoyed” persons (%A).
2.4 Statistical model
The statistical model applied previously for predicting community annoyance response to other sources [6,7] was employed here to derive a model for both indoor and outdoor annoyance due to wind turbine noise. An exposure-response relationship between annoyance and Lden was derived based on the combined data from Sweden and the Netherlands. In line with van den Berg et al. [2], exposure-response relationships were derived only for respondents who did not benefit economically from wind turbines. Since respondents with economical benefit hardly reported any annoyance despite living primarily in the highest exposure categories, including this relatively small number of residents was expected to contaminate the relationship over the total range of exposure.
3 Results
At a given exposure level, the expected percentage of annoyed persons indoors by wind turbine noise is higher than that due to other stationary sources of industrial noise, and also increases faster with increasing noise levels. Furthermore, the expected percentage of annoyed or highly annoyed persons due to wind turbine noise across the exposure range is higher than the expected percentages due to each of the three modes of transportation noise at the same exposure levels. Although the comparison may be hampered by differences between sources in exposure range, and the confidence intervals at the high end of the wind turbine noise range are large, the results indicate that a given percentage of annoyance by wind turbine noise is expected at much lower levels of Lden than the same percentage of annoyance by for instance road traffic noise (see Figure 2).
indoors by wind turbine noise, with 95% confidence intervals.
INTERNOISE 2010 │ JUNE 13-16 │ LISBON │ PORTUGAL
5
4 Conclusions
In comparison to other sources of noise, annoyance due to wind turbine noise is found at relatively low noise exposure levels. The proposed exposure-response relationships for annoyance by wind turbine noise are only based on three studies and more studies are undeniably needed. Still, they may already serve as indicative for suitable regulations, or for the evaluation of existing legislation. However, it should be noted that situational factors, as well as possible cultural differences, may lead to considerable deviation from the curve in specific cases.
Acknowledgments
The authors would like to thank Dr. Frits van den Berg of the Amsterdam Public Health Service (formerly of the University of Groningen) for his much valued advice and for making his research data available to the authors. The present study was funded by the Ministry of Housing, Spatial Planning, and the Environment (VROM) of the Netherlands.
References
[1] Pedersen, E. Human response to wind turbine noise: Perception, annoyance and moderating factors. Thesis, Göteborg University (Sweden), 2007.
[2] van den Berg, F.; Pedersen, E.; Bouma, J.; Bakker, R. WINDFARMperception: Visual and acoustic impact of wind turbine of wind turbine farms on residents. Report FP6-2005-Science-and-Society-20. University of Groningen (Netherlands), Göteborg University (Sweden), 2008.
[3] Pedersen, E.; van den Berg, F.; Bakker, R. Response to noise from modern wind farms in the Netherlands, Journal of the Acoustical Society of America, Vol 126, 2009, pp 634-643.
[4] Pedersen, E.; Persson Waye, K. Perception and annoyance due to wind turbine noise – a dose-response relationship, Journal of the Acoustical Society of America, Vol 116, 2004, pp 3460-3470.
[5] van den Berg, F. Criteria for wind farm noise: Lmax and Lden. Acoustics’08, Paris, France, June 29-July 4, 2008.
[6] Miedema, H.M.E.; Oudshoorn, C.G.M. Annoyance from transportation noise: Relationships with exposure metrics DNL and DENL and their confidence intervals, Environmental Health Perspectives, Vol 109, 2001, pp 409-416.
[7] Groothuis-Oudshoorn, C. G. M.; Miedema, H. M. E. Multilevel grouped regression for analyzing self-reported health in relation to environmental factors: The model and its application, Biometrical Journal, Vol 48, 2006, pp 67-82.
"A subset of society should not be forced to bear the cost of a benefit for the larger society."1
I. Introduction A new source of community noise is spreading rapidly across the rural U.S. countryside. Industrial-scale wind turbines (WT), a common sight in many European countries, are now actively promoted by federal and state governments in the U.S. as a way to reduce coal-powered electrical generation and global warming. The presence of industrial wind projects is expected to increase dramatically over the next few years, given the tax incentives and other economic and political support currently available for renewable energy projects in the U.S.
As a part of the widespread enthusiasm for renewable energy, state and local governments are promoting ”Model Ordinances” for siting industrial wind farms which establish limits for noise and other potential hazards. These are used to determine where wind projects can be located in communities, which are predominantly rural and often extremely quiet during the evening and night. Yet, complaints about noise from residents near existing industrial wind turbine installations are common. This raises serious questions about whether current state and local government siting guidelines for noise are sufficiently protective for people living close to the wind turbine developments. Research is emerging that suggests significant health effects are associated with living too close to modern industrial wind turbines. Research into the computer modeling and other methods used to determine the layout of wind turbine developments, including the distance from nearby residences, is at the same time showing that the output of the models may not accurately predict sound propagation. The models are used to make decisions about how close a turbine can be to a home or other sensitive property. The errors in the predicted sound levels can easily result in inadequate setback distances thus exposing the property owner to noise pollution and potential health risks. Current information suggests the models should not be used for siting decisions unless known errors and tolerances are applied to the results.
Our formal presentation and paper on this topic (Simple guidelines for siting wind turbines to prevent health risks) is an abbreviated version of this essay. The formal paper was presented to the Institute of Noise Control Engineers (INCE) at its July Noise-Con 2008 conference in Detroit, MI, A copy of
1 George S. Hawkins, Esq., “One Page Takings Summary: U.S Constitution and Local Land Use,” Stony Brook‐Millstone
Watershed Association; “…nor shall private property be taken for public use, without just compensation.” Fifth Amendment, US Constitution.
Prepared for: Report on Tule Wind
Siting Wind Turbines October 28, 2008 To Prevent Health Risks From Sound Version 2.1
the paper is included at the end of this document. The formal paper covered the community noise studies performed in response to complaints, research on health issues related to wind turbine noise, critiques of noise studies performed by consultants working for the wind developer, and research/technical papers on wind turbine sound immissions and related topics. The formal paper also reviewed sound studies conducted by consultants for governments, the wind turbine owner, or the local residents for a number of sites with known health or annoyance problems. The purpose was to determine if a set of simple guidelines using dBA and dBC sound levels can serve as the ‘safe’ siting guidelines for noise and its effects on communities and people. The papers considered in our review included, but were not limited to, those listed in Tables 1-4 on pages 2 through 4 of the Noise-Con document.
This essay expands upon the Noise–Con paper and includes information to support the findings and recommended criteria. We are proposing very specific, yet reasonably simple to implement and assess criteria for audible and non-audible sound on adjacent properties and also present a sample noise ordinance and the procedures needed for pre-construction sound test, computer model requirements and follow-up tests (including those for assessing compliance).
The purpose of this expanded paper is to outline a rational, evidence-based set of criteria for industrial wind turbine siting in rural communities, using:
1) A review of the European and other wind turbine siting criteria and existing studies of the prevalence of noise problems after construction;
2) Primary review of sound studies done in a variety of locations in response to wind turbine noise complaints (Table 1);
3) Review of publications on health issues for those living in close proximity to wind turbines (Table 2);
4) Review of critiques of pre-construction developer noise impact statements (Table 3); and 5) Review of technical papers on noise propagation and qualities from wind turbines (Table 4).
The Tables are on pages 2-4 of the formal paper. We also cite standard international criteria for community noise levels and allowances for low-frequency noise.
The specific sections are:
1. Introduction (This section)
2. Results of Literature Review and Sound Studies
3. Development of Siting Criteria
4. Proposed Sound Limits
5. How to Include the Recommended Criteria in Local or State Noise Ordinances
6. Elements of a Wind Energy System Licensing Ordinance
7. Measurement Procedures (Appendix to Ordinance)
8. The Noise-Con 2008 paper “Simple guidelines for siting wind turbines to prevent health risks” with revisions not in the paper included in the conference’s Proceedings.
The construction of large WT (industrial wind turbines) projects in the U.S. is a relatively recent phenomenon, with most projects built after 2000. Other countries, especially in Europe, have been using wind energy systems (WES) since the early 1990’s or earlier. These earlier installations generally used turbines of less than 1 MW capacity with hub heights under 61 m (200 feet). Now, many of these earlier turbines reaching the end of their useful life, are being replaced with the
Prepared for: Report on Tule Wind
Siting Wind Turbines October 28, 2008 To Prevent Health Risks From Sound Version 2.1
larger 1.5 to 3 MW units. Thus, the concepts and recommendations in this article, developed for the 1.5 MW and larger turbines being build in the U.S, may also be applicable abroad.
II. Results of Literature Review and Sound Studies
In the U.K. there are currently about 133 operating WT developments. Many of these have been in operation for over 10 years. The Acoustic Ecology Institute2 (AEI) reported that a Special Report for the British government titled “Wind Energy Noise Impacts,”3 found that about 20% of the wind farms in the U.K. generated most of the noise complaints. Another study commissioned by British government, from the consulting firm Hayes, McKensie, reported that only five of 126 wind farms in the U.K. reported problems with the noise phenomenon known as aerodynamic modulation.4 Thus, experience in the U. K. shows that not all WT projects lead to community complaints. AEI posed an important question: “What are the factors in those wind farms that may be problematic, and how can we avoid replicating these situations elsewhere?”
As experienced industrial noise consultants ourselves, we would have expected the wind industry, given the U.K. experience, to have attempted to answer this question, conducting extensive research -- using credible independent research institutions -- before embarking on wind power development in the U.S. The wind industry was aware, or should have been aware, that 20% of British wind energy projects provoked complaints about noise and/or vibration, even in a country with more stringent noise limits than in the U.S.
The wind industry complies with stricter noise limits in the U.K. and other countries than it does in the U.S., for example5:
Australia: higher of 35 dBA or L90 + 5 dBA Denmark: 40 dBA France: L90 + 3 dBA (night) and L90 + 5 dBA (day) Germany: 40 dBA Holland: 40 dBA United Kingdom: 40 dBA (day) and 43 dBA or L90 + 5 dBA (night) Illinois: Octave frequency band limits of about 50 dBA (day) and about 46 dBA (night) Wisconsin: 50 dBA Michigan: 55 dBA
Industry representatives on state governmental committees have worked to establish sound limits and setbacks that are lenient and favor the industry. In Michigan, for example, the State Task Force (working under the Department of Labor and Economic Growth) recommended in its “Siting Guidelines for Wind Energy Systems” that the limits be set at 55 dBA or L90 + 5 dBA, whichever is higher. In Wisconsin, the State Task Force has recommended 50 dBA.
When Wisconsin's Town of Union wind turbine committee made an open records request to find out the scientific basis for the sound levels and setbacks in the state's draft model ordinance, it found that no scientific or medical data was used at all. Review of the meeting minutes provided
2 (http://www.acousticecology.org/srwind.html)
3 AEI is a 501(c)3 non‐profit organization based in Santa Fe, New Mexico, USA. The article is available at
http://www.acousticecology.org/srwind.html 4 Study review available at: http://www.berr.gov.uk/files/file35592.pdf 5 Ramakrishnan, Ph. D., P. Eng., Ramani, “Wind Turbine Facilities Noise Issues” Dec. 2007 Prepared for the Ontario Ministry of Environment.
Prepared for: Report on Tule Wind
Siting Wind Turbines October 28, 2008 To Prevent Health Risks From Sound Version 2.1
under the request showed that the limits had been set by Task Force members representing the wind industry.6 This may explain why state level committees or task forces have drafted ordinances with upper limits of 50 dBA or higher instead of the much lower limits applied to similar projects in other countries. There is no independent, scientific or medical support for claims that locating 400+ foot tall wind turbines as close as 1000 feet (or less) to non-participating properties will not create noise disturbances, economic losses or other risks.7 But, there is considerable independent research supporting that this will result in public health risks and other negative impacts on people and property.
To illustrate the way a typical WT developer responds to a question raised by a community committee about noise and health the following example is presented and discussed:
A serious question was asked and it deserves a responsible answer. The committee, charged with fact-finding, sought answers they presumed would be based on independent, peer-reviewed studies. Instead, the industry response was spurious and misleading, and did not address the question. It stated that the turbines will be located so as to produce maximum sound levels of 45 dBA, the tone and context implying that 45 dBA is fully compatible with the quiet rural community setting. No acknowledgement is made of the dramatic change this will be for the noise environment of nearby families. No mention is made of how the WT, once in operation, will raise evening and nighttime background sound levels from the existing background levels of 20 to 30 dBA to 45 dBA. There is no disclosure of the considerable low frequency content of the WT sound; in fact, there are often claims to the contrary. They fail to warn that the home construction techniques used for modern wood frame homes result in walls and roofs that cannot block out WT low frequencies.
There is no mention of the nighttime sound level recommendations set by the World Health Organization (WHO) in its reports, Guidelines for Community Noise 8 and “Report on the third 6 Lawton, Catharine M., Letter to Wisconsin’s “Guidelines and Model Ordinances Ad Hoc Subcommittee of the Wisconsin Wind
Power Siting Collaborative” in Response to Paul Helgeson’s 9/20/00 “Wisconsin Wind Ordinance Egroups E‐Mail Message,” Sept. 20, 2000, a Public Record obtained through Open Meetings Act request by the Town of Union, Wisconsin, Large Wind Turbine Citizens Committee.
7 It is worth noting that the 2007‐06‐29 version of the Vestas Mechanical Operating and Maintenance Manual for the model V90
– 3.0 MW VCRS 60 Hz turbine includes this warning for technicians and operators:
“2. Stay and Traffic by the Turbine
Do not stay within a radius of 400m (1300ft) from the turbine unless it is necessary. If you have to inspect an operating turbine from the ground, do not stay under the rotor plane but observe the rotor from the front.
Make sure that children do not stay by or play nearby the turbine. ….”
8 Available at http://www.who.int/docstore/peh/noise/guidelines2.html.
Q: 19. What sound standards will EcoEnergy ensure that the turbines will be within, based on the setbacks EcoEnergy plans
to implement, and what scientific and peer reviewed data do you have to ensure and support there will be no health and safety issues to persons within your setbacks?
Answer: As mentioned, turbines are sited to have maximum sound level of 45dBA. These sound levels are well below levels
causing physical harm. Medical books on sound indicate sound levels above 80‐90dBA cause physical (health) effects. The possible effects to a person's health due to "annoyance" are impossible to study in a scientific way, as these are often mostly psychosomatic, and are not caused by wind turbines as much as the individuals’ obsession with a new item in their environment.
From EcoEnergy’s “Response to the Town of Union Health & Safety Research Questionnaire” By Curt Bjurlin, M.S., Wes Slaymaker, P.E., Rick Gungel, P.E., EcoEnergy, L.L.C., submitted to Town of Union, Wisconsin and Mr. Kendall Schneider, on behalf of the Town of Union
Prepared for: Report on Tule Wind
Siting Wind Turbines October 28, 2008 To Prevent Health Risks From Sound Version 2.1
meeting on night noise guidelines.9” In these documents WHO recommends that sound levels during nighttime and late evening hours should be less than 30 dBA during sleeping periods to protect children's health. They noted that a child's autonomic nervous system is 10 to 15 dB more sensitive to noise than is an adult. Even for adults, health effects are first noted in some studies when the sound levels exceed 32 dBA Lmax. These sounds are 10-20 dBA lower than the sound levels needed to cause awakening.
For sounds that contain a strong low frequency component, which is typical of wind turbines, WHO says that the limits may need to be even lower than 30 dBA to avoid health risks. Further, they recommend that the criteria use dBC frequency weighting instead of dBA for sources with low frequency content. When WT sound levels are 45 dBA outside a home, we may find that the interior sound levels will drop to the 30 dBA level recommended for sleeping areas but low frequency noise only decreased 6-7 dBC from outside to inside. That could create a sleep problem because the low frequency content of the noise can penetrate the home’s walls and roof with little reduction. An example demonstrating how WT sound is affected by walls and windows is provided later in this document.
The wind turbine developers in the excerpt above do not disclose that the International Standards Organization (ISO) in ISO 1996-1971 recommends 25 dBA as the maximum night-time limit for rural communities. As can be seen in the table below, sound levels of 40 dBA and above are only appropriate in suburban communities during the day and urban communities during day and night. There are no communities where 45 dBA is considered acceptable at night.
Further, the wind industry claims, “These sound levels are well below levels causing physical harm. Medical books on sound indicate sound levels above 80-90dBA cause physical (health) effects.” Concern about sound levels in the 80-90 dBA range is for hearing health (your ears) and not the health-related issues of sleep disturbance and other symptoms associated with prolonged exposure to low levels of noise with low frequency and amplitude modulation such as the sound emitted by modern wind turbines. This type of response is a non-answer. It is an overt attempt to mislead while giving the appearance of providing a legitimate response.
Furthermore, the statement, “The possible effects to a person's health due to ‘annoyance’ are impossible to study in a scientific way, as these are often mostly psychosomatic, and are not caused by wind turbines as much as the individuals’ obsession with a new item in their environment,” is both inaccurate and misleading. It ignores the work of researchers such as Pedersen, Harry, Phipps, and Pierpont on wind turbine effects specifically, and the numerous medical research studies reviewed by Frey and Hadden. The studies belie the claims of the wind industry. This “failure to locate” published
9 Available at: http://www.euro.who.int/Noise/activities/20040721_1 References found in Report on third meeting at pages 13 and
others
ISO 1996‐1971 Recommendations for Community Noise Limits (dBA)
District Type Daytime Limit Evening Limit
7‐11pm Night Limit 11pm‐7am
Rural 35dB 30dB 25dB
Suburban 40dB 35dB 30dB
Urban residential 45dB 40dB 35dB
Urban mixed 50dB 45db 40dB
Prepared for: Report on Tule Wind
Siting Wind Turbines October 28, 2008 To Prevent Health Risks From Sound Version 2.1
studies that are readily available on the internet as to make some interpret the claim of “no medical research” as a conscious decision to not look for it. Those companies that do acknowledge the existence of medical research take the position that it is not credible for one or another reason and thus can be ignored.
Making statements outside their area of competence, wind industry advocates, without medical qualifications, label complaints of health effects as “psychosomatic” in a pejorative manner that implies the complaints can be discounted because they are not “really medical” conditions. Such a response cannot be considered to be based in fact. It is, at best, an opinion. It ignores the work of many researchers, including the World Health Organizations, on the effect of sounds during nighttime hours that result in sleep disturbance and other disorders with physical, not just psychological, pathologies.10,11 Many people find it difficult to articulate what has changed. They know something is different from before the wind turbines were operating and they may express it as feeling uncomfortable, uneasy, sleepless, or some other symptom, without being able to explain why it is happening.
Our review of the studies listed in Tables 1-4 of our Noise-Con paper show that some residents living as far as 3 km (1.86 mi) from a wind farm complain of sleep disturbance from the noise. Many residents living 1/10 of this distance (300 m or 984 ft) from wind farms experience major sleep disruption and other serious medical problems from nighttime wind turbine noise. The peculiar acoustic characteristics of wind turbine noise immissions12 cause the sounds at the receiving properties to be more annoying and troublesome than the more familiar noise from traffic and industrial factories. Limits used for these other community noise sources are not appropriate for siting modern industrial wind turbines. The residents who are annoyed by wind turbine noise complain of the repetitive, approximately once-per-second (1 Hz) “swoosh-boom-swoosh-boom” sound of the turbine blades and of “low frequency” noise. It is not clear to us whether the complaints about “low frequency” noise are about the audible low frequency part of the “swoosh-boom” sound, the once-per-second amplitude modulation (amplitude modulation means that the sound varies in loudness and other characteristics in a rhythmic pattern) of the “swoosh-boom” sound, or some combination of the two.
Figure 1 of our Noise Con paper, reproduced as Figure 1, below, shows the data from one of the complaint sites plotted against the sound immission spectra for a modern 2.5 MWatt wind turbine; A home in the United States at 2km distance, Young’s threshold of perception for the 10% most sensitive population (ISO 0266); and a spectrum obtained for a rural community during a three hour, 20 minute test from 11:45 pm until 3:05 am on a windless June evening near Ubly, Michigan. This is a quiet rural community located in central Huron County (also called Michigan’s Thumb). It is worth noting that this sound measurement sample demonstrates how quiet a rural community can be when located at a distance from industry, highways, and airport related noise emitters.
The line representing the threshold of perception is the focus of this graph. The remaining graphs show sound pressure levels (dB) at each of the frequency ranges from the lowest inaudible sounds at the left, to sounds that “rumble” (20Hz to about 200 Hz) and then those in the range of communication (200Hz through about 4000Hz) through high pitched sounds (up to 10,000 Hz). At 10 WHO European Centre for Environment and Health, Bonn Office, “Report on the third meeting on night noise guidelines,” April
2005. 11 According to Online Etymology Dictionary, psychosomatic means "pertaining to the relation between mind and body, … applied
from 1938 to physical disorders with psychological causes.” 12 Emissions refer to acoustic energy from the viewpoint of the sound emitter, while immissions refer to acoustic energy from the
viewpoint of the receiver.
Prepared for: Report on Tule Wind
Siting Wind Turbines October 28, 2008 To Prevent Health Risks From Sound Version 2.1
each frequency where the graphs of sound pressures are above (exceed) the graph showing perception the wind turbine sounds would be perceptible or audible. The more the wind turbine sound exceeds the perception curve the more pronounced it will be. When it exceeds the quiet rural background sound level (LA90) it will not be masked or obscured by the rural soundscape.
The over-all sounds from each of the frequency bands are summed and presented on the right hand side of the graph. These are presented with corrections for A-weighting (dBA) and C-weighting (dBC). These show that if only dBA criteria are used to assess and limit wind turbine sound the low frequency content of the wind turbines emissions are not revealed. Note that in many cases the values for dBC are almost 20 dB higher than the dBA values. This is the basis for the WHO warning that when low frequency sound content is present outside a home dBA is not an appropriate method of describing predicted noise impacts, sound limits, or criteria.
Figure 1-Graph Of Wind Turbine Sounds Vs. Rural Background And Threshold Of Perception
(Note: The lowest LAeq and LCeq shown at right are measured background LA90 and LC90 . The Leq values could be 0-5 dB higher)
Our review of the studies listed in Tables 1-4 in the Noise-Con paper at the end of this document, provided answers to a number of significant questions we had, as acoustical engineers, regarding the development of siting guidelines for industrial-scale wind turbines. They are provided below for easy of reading and continuity:
Do international, national, or local community noise standards for siting wind turbines near dwellings address the low frequency portion of the wind turbines’ sound immissions? No. State and local governments are in the process of establishing wind farm noise limits and/or wind turbine setbacks from nearby residents, but the standards incorrectly assume that limits based on dBA levels are sufficient to protect the residents.
Prepared for: Report on Tule Wind
Siting Wind Turbines October 28, 2008 To Prevent Health Risks From Sound Version 2.1
Do wind farm developers have noise limit criteria and/or wind turbine setback criteria that apply to nearby dwellings? Yes. But the industry-recommended wind turbine noise levels (typically 50-55 dBA) are too high for the quiet nature of the rural communities and may be unsafe for the nearest residents. An additional concern is that some of the methods for pre-construction computer modeling may predict sound levels that are too low. These two factors combined can lead to post-construction complaints and health risks.
An example of a condition that complies with
Are all residents living near wind farms equally likely to be affected by wind turbine noise? No. Children, people with certain pre-existing medical conditions, and the elderly are likely to be the most susceptible. Some people are unaffected while nearby neighbors develop serious health problems caused by exposure to the same wind turbine noise.
How does wind turbine noise impact nearby residents? Wind turbine-associated symptoms include sleep disturbance, headache, ringing in the ears, dizziness, nausea, irritability, and problems with memory, concentration, and problem solving, as described in the first paper in this volume.
What are the technical options for reducing wind turbine noise immission at residences? There are only two options: 1) increase the distance between the source and receiver, or 2) reduce the source sound power emission. Either solution is incompatible with the objective of the wind farm developer, which is to maximize the wind power electrical generation within the land available.
Is wind turbine noise at a residence much more annoying than traffic noise? Yes. Researchers have found that, “Wind turbine noise was … found to cause annoyance at sound pressure levels lower than those known to be annoying for other community noise sources, such as road traffic. …Living in a clearly rural area in comparison with a suburban area increases the risk of annoyance with wind turbine noise.13” In other papers by Pedersen wind turbine noise was perceived by about 85% of respondents to the study at sound levels as low as 35.0–37.5 dBA. 14 Currently, this increased sensitivity is believed to be due to the presence of amplitude modulation in the wind turbine’s sound emissions which limits the masking effect of other ambient sounds and the low frequency content which is associated with the sounds inside homes and other buildings.
Amplitude modulation is a continuing change in the sound level in synchronization with the turning of the wind turbine’s blades. An example of amplitude modulation is shown in the figure 2 below. This figure shows the constantly varying dBA sound level in the graph at the top. The sound level varies from a low of 40 dBA to a high of 45 dBA repeating every 1.3 seconds continuously when the turbine is operating. The turbine is located approximately 1200 feet from the farmhouse. The photo shows the turbine that was dominant during this test.
13 Pedersen E, Bouma J, Bakker R and Van den Berg F, “Wind Farm perception‐ A study on acoustic and visual impact of
wind turbines on residents in the Netherlands;” 2nd International Meeting on Wind Turbine Noise, Lyon France; Sept. 20‐21, 2007 (Pages 2 and 3)
14 Pedersen E and Persson Waye K. 2004. Perceptions and annoyance due to wind turbine noise ‐‐ a dose‐response relationship. J Acoust Soc Am 116(6): 3460‐3470
Prepared for: Report on Tule Wind
Siting Wind Turbines October 28, 2008 To Prevent Health Risks From Sound Version 2.1
Figure 2 Amplitude Modulation at a farmhouse (Study sponsored by CCCRE, Calumet, Wisconsin)
It is worth noting that this measurement averages about 43 dBA (Leq) which is very close to the sound level predicted for a single turbine at 1000 feet in Figure 1 (solid red line with solid triangle markers). The lower graph shows the frequency spectrum at approximately 9:49 PM at a low point in the amplitude modulation. (The frequency chart’s cursor is the vertical line at the upper graph’s midpoint.) Note the dominance of sound energy in the lower frequency range. This was also present in the model’s predictions in Figure 1.
It is not hard to understand why many people in this community feel that they have been forced to accept noise pollution as a side effect of the wind project. Even though the 40 to 45 dBA sound levels in this example may comply with the 50 dBA limits adopted by the host county from the Wisconsin Model Ordinance the impact on the people near the wind project are subjected to noise pollution. This example demonstrates why criteria set at 50 dBA or higher do not protect the health and economic welfare of people living in the host communities. Adopting criteria such as those recommended later in this essay can prevent these situations from occurring.
Low frequency noise is a problem inside buildings
When low frequency sound is present outside homes and other occupied structures, it is often more an indoor problem than an outdoor one. This is very true for wind turbine sounds.
Why do wind turbine noise immissions of only 35 dBA disturb sleep at night? Affected residents complain of the middle- to high-frequency, repetitive swooshing sounds of the rotating turbine blades at a constant rate of about 1 Hz, plus low frequency noise. The amplitude modulation of the “swooshing” sound changes continuously. Residents also describe a thump or low frequency banging sound that varies in amplitude up to 10 dBA in the short interval between the swooshing sounds. This may be a result of sounds from multiple wind turbines with similar spectral content combining to increase and decrease the sound over and above the effects of modulation. [Note: These effects (e.g. phasing and coherence effects) are not normally considered in predictive models.] It may also be a result of turbulence of the air and wind on wind turbine operations when the blades are not at an optimum angle for noise emissions and/or power generation. It is also a result of sounds penetrating homes and other buildings at night and at other times where quiet is needed. When low frequency sound is present outside homes and other occupied structures, it is
Prepared for: Report on Tule Wind
Siting Wind Turbines October 28, 2008 To Prevent Health Risks From Sound Version 2.1
often more likely to be an indoor problem than an outdoor one. This is very true for wind turbine sounds.
Figure 3-A Single Wind Turbine Sound Inside Home @ 1000 Feet
The usual assumption about wall and window attenuation being 15 dBA or more, which is valid for most sources of community noise, may not be sufficiently protective given the relatively high amplitude of the wind turbines’ low frequency immission spectra. Figures 2 and 3 demonstrate the basis for this concern.
To demonstrate the effects of outdoor low frequency content from wind turbines we prepared Figure 1 showing the effect of a single turbine (propagation model based on sound power level test data) at 1000 feet and then in Figure 4 projected the impact of ten (10) similar turbines at one (1) mile. We applied the façade sound isolation data from the Canada Research Council to the wind turbine example used in our Noise-Con 2008 paper and shown in Figure 1 above. The graphs each show the outdoor sound pressure levels predicted for the distance of 1000 feet and one mile as the upper graph line respectively. The curve showing the threshold of human perception for sounds at each 1/3 octave band center is also plotted. When the graphs representing wind turbine sound have data points above this threshold curve the sounds will be perceptible to at least 10% of the population (which includes most children).
Prepared for: Report on Tule Wind
Siting Wind Turbines October 28, 2008 To Prevent Health Risks From Sound Version 2.1
In addition to the top graph line representing the sounds outside the home there are two other graph lines for the sounds inside the home15. One curve represents the condition of no open windows and the other represents one open window.
With just one turbine at 1,000 feet there is a significant amount of low frequency noise above hearing threshold within rooms having exterior walls without windows or very well sealed windows. Even with the windows closed the sound pressure levels in the 63 Hz to 200 Hz one-octave bands still exceed the perception curve, in many cases by more than 10 dB. Note the perceptible sound between 50 and 200 Hz with a wall resonance frequency at 125 Hz (2 X 4 studs on 16 inch centers) for the “windows closed” condition. This would be perceived as a constant low rumble, which would be present inside homes whenever the turbines are operating.
Figure 4-Sound from Ten (10) Wind Turbines inside home at One Mile
When comparing the dBC values the difference between inside sounds and outside is much less. The maximum difference in this example is only 7 dBC and that is for the situation with windows closed. With windows open the sound inside the home would be 56 dBC while it is 61 dBC outside; a difference of only 5 dBC16,17,18. If we looked only at dBA it would appear that the home’s
15 The typical wood stud exterior used in modern home construction is vinyl siding over 1/2 inch OSB or rigid fiberglass board applied to 2 X 4 studs with the stud space filled with thermal and 1/2 inch gypsum board applied on the exposed interior side. This has a mass of about 3‐4 lbs/sq ft and low 26 STC. 16 The basis for these predictions includes reports on aircraft sound insulation for dwellings and façade sound isolation
data from the Canada Research Council. 17 “On the sound insulation of wood stud exterior walls” by J. S. Bradley and J. S. Birta, institute for Research in
Construction, National Research Council, Montreal Road, Ottawa K1A 0R6, Canada, published: J.Acoust. Soc. Am. 110 (6), December 2001
Prepared for: Report on Tule Wind
Siting Wind Turbines October 28, 2008 To Prevent Health Risks From Sound Version 2.1
walls and roof provide a reduction of 15 dBA or more. But, that that would be misleading because it ignores the effects of low frequency sound.
We next increased the number of 2.5 Mw turbines from one to ten and moved the receiver one mile from the closest turbine. We assumed the acoustic center for the ten turbines to be 2km (1-1/4 miles) from the receiver. These results are presented in Figure 4. We were surprised to find that the one mile low frequency results are only 6.3 dB below the 1,000 foot one turbine example.
There is one other characteristic of wind turbine sound that increases the sleep disturbance potential above that of other long-term noise sources. The amplitude modulation of the sound emissions from the wind turbines create a repetitive rise and fall in sound levels synchronized to the blade rotation speed. Many common weather conditions increase the magnitude of amplitude modulation. Most of these occur at night. The graph in Figure 5 shows this effect in the first floor bedroom of a farm home in the U.K. The home is located 930 meters (3,050 feet) from the nearest turbine. The conditions documented by an independent acoustical consultant show the sound level varying over 9 dBA range from 28 to 37 dBA. The pattern repeats approximately every second often for hours at a time. For many people, especially seniors, children and those with pre-existing medical conditions, this represents a major challenge to restful sleep.
Figure 5- Amplitude modulation in a home 930 meters (3000 feet) from the nearest turbine.19
This may explain why some residents as far as two (2) miles from a wind farm find the wind turbines sounds highly annoying. It also demonstrates the primary reason why relying on dBA
18 Dan Hoffmeyer, Birger Plovsing: “Low Frequency Noise from Large Wind Turbines, Measurements of Sound Insulation of Facades.” Journal no. AV 1097/08, Client: Danish Energy Authority, Amaliegade 44, 1256 Copenhagen 19 This chart used with permission of Mike Stigwood, MIOA, FRSH, MAS Environmental, U.K. and the Davis family.
Prepared for: Report on Tule Wind
Siting Wind Turbines October 28, 2008 To Prevent Health Risks From Sound Version 2.1
alone will not work for community noise criteria. It is the low frequency phenomena associated with wind turbine emissions that makes the dBC test criteria an important part of the proposed criteria20.
III. Development of Siting Criteria
Basis For Using LA90 To Determine Pre‐Construction Long‐Term Background Sound
We began our research into guidelines for proper siting by reviewing guidelines used in other countries to limit WT sound emissions. A recent compendium of these standards was presented in the report “Wind Turbine Facilities Noise Issues.”21 We found common ground in many of them. Some set explicit not-to-exceed sound level limits, for example, in Germany, 40 dBA nighttime in residential areas and 35 dBA nighttime in rural and other noise-sensitive areas. Other countries use the existing background sound levels for each community as the basis for establishing the sound level limits for the WES project. This second method has the advantage of adjusting the allowable limits for various background soundscapes. It makes use of a standard method for assessing background sound levels by measuring over a specified period of observation to determine the sound level exceeded 90% of the time (L90) during the night. The night is important because it is the most likely time for sleep disturbance. Then, using the background sound level as the base, the WES project is allowed to increase it by 5 dBA. It is this second method (L90 + 5 dBA) that was adopted for the criteria in this document. It has the advantage of adjusting the criteria for each community without the need for tables of allowable limits for different community types. The focus is only on the nighttime criteria. This is because the WES will operate 24 hours a day and the nighttime limits will be the controlling limits whether or not there are other limits for daytime.
Wind turbine noise is more annoying than other noises and needs lower limits Since many rural communities are very quiet, it is possible that some will have L90 values of 25 dBA or lower. This may seem extreme when compared to limits usually imposed on other sources of community noise. However, wind turbine sounds are not comparable to the more common noise sources of vehicles, aircraft, rail, and industry. Several studies have shown that annoyance to wind turbine sounds begins at levels as low as 30 dBA.22 This is especially true in quiet rural communities that have not had previous experience with industrial noise sources. This increased sensitivity may be due to the periodic ‘swoosh’ from the blades in the quiet rural soundscape, or it may be more complex. In either case, it is a legitimate response to wind turbine sound documented in peer-reviewed research.
20 Hessler Jr., George F., “Proposed criteria in residential communities for low‐frequency noise emissions from industrial sources,”
52(4), 179‐185, (July‐Aug 2004) 21 Ramani Ramakrishnan, Ph.D., P. Eng., “Wind Turbine Facilities Noise Issues,” December 2007. Prepared for the Ontario Ministry
of Environment. 22 Eja Pedersen, “Human response to wind turbine noise: perception, annoyance and moderating factors.” Dissertation,
Occupational and Environmental Medicine, Department of Public Health and Community Medicine, Goteborg University, Goteborg, Sweden, 2007, and
Van den Berg F, Pedersen E, Bouma J, and Bakker R, Wind Farm Perception, Final Report Project no. 044628, University of Gothenburg and Medical Center Groningen, Netherlands June 3, 2008
Prepared for: Report on Tule Wind
Siting Wind Turbines October 28, 2008 To Prevent Health Risks From Sound Version 2.1
The World Health Organization recognizes the special place of low frequency noise as an environmental problem. Its publication “Community Noise” (Berglund et al., 2000) makes a number of references to low frequency noise, some of which are as follows:
• “It should be noted that low frequency noise… can disturb rest and sleep even at low sound levels.
• For noise with a large proportion of low frequency sounds a still lower guideline (than 30dBA) is recommended.
• When prominent low frequency components are present, noise measures based on A‐weighting are inappropriate.
• Since A‐weighting underestimates the sound pressure level of noise with low frequency components, a better assessment of health effects would be to use C‐weighting.
• It should be noted that a large proportion of low frequency components in a noise may increase considerably the adverse effects on health.”
WHO also states: "The evidence on low frequency noise is sufficiently strong to warrant immediate concern.”
Available at http://www.who.int/docstore/peh/noise/guidelines2.html, References found at pages ix, xii through xv and others.
Noise criteria need to take into account low frequency noise In the table to the right are a series of observations and recommendations by the World Health Organization (WHO) supporting the need for stricter limits when there is substantial low frequency content in outdoor sound. Our review of other studies, and our own measurements, has demonstrated that wind turbine sound includes considerable low frequency content. We include a dBC limit in our guidelines to address the WHO recommendation that when low frequency sound may be present, criteria based on measurements using a C-weighting filter on the sound level meter (dBC) are needed in addition to dBA criteria.
IV. Proposed Sound Limits The simple fact that so many residents complain of low frequency noise from wind turbines is clear evidence that the single A-weighted (dBA) noise descriptor used in most jurisdictions for siting turbines is not adequate. The only other simple audio frequency weighting that is standardized and available on sound level meters is C-weighting or dBC. A standard sound level meter set to measure dBA is increasingly less sensitive to low frequency below 500 Hz (one octave above middle-C). The same sound level meter set to measure dBC is equally sensitive to all frequencies above 32 Hz (lowest note on grand piano). It is generally accepted that dBC readings are more predictive of perceptual loudness than dBA readings if low frequency sounds are significant.
We are proposing to use the commonly accepted dBA criteria that is based on the pre-existing background sound levels allowing the wind turbine development to increase this by 5 dB (e.g. L90A +5) by the audible sounds from wind turbines. According to the New York State Energy Research & Development Authority:
“… A change in sound level of 5 dB will typically result in a noticeable community response; and
“… A 10 dB increase is subjectively heard as an approximate doubling in loudness, and almost always causes an adverse community response.” 23
To address the lower frequencies that are not considered in A-weighted measurements we are proposing to add limits based on dBC that follow the same scheme as used for dBA limits. The Proposed Sound Limits are presented in the text box at the end of this section.
For the current industrial grade wind turbines in the 1.5 to 3 MWatt (or over) range, the addition of the dBC requirement may result in an increased distance between wind turbines and the nearby
23 (Wind Energy Development: A Guide for Local Authorities in New York; page 30; New York State Energy Research & Development Authority, Albany, NY October 2002)
Prepared for: Report on Tule Wind
Siting Wind Turbines October 28, 2008 To Prevent Health Risks From Sound Version 2.1
residents. For the conditions shown in Figure 1, the distances would need to be increased significantly. This would result in setbacks in the range of 1 km or greater for the current generation of wind turbines if they are to be located in rural areas with little or no low frequency sound from man-made noise sources and where the LA90 background sound levels are 30 dBA or lower. In areas with higher background sound levels, turbines could be located somewhat closer, but still at a distance greater than the 305 m (1000 ft.) or smaller setbacks commonly seen in U.S. based wind turbine standards set by many states and used for wind turbine developments.
Following are some additional Questions and Answers that summarize the major points of this discussion relevant to criteria.
What are the typical wind farm noise immission criteria or standards? Limits are not consistent and may vary even within a particular country. Examples are listed above in the section on Results of Literature and Sound Studies.
What is a reasonable wind farm sound immission limit to protect the health of residences? We are proposing a not-to-exceed immission limit of 35 LAeq and a site-specific limit of LA90 + 5 dBA at the closest property line, whichever is exceeded first. We also propose the use of C-weighted criteria to address complaints of wind turbine low frequency noise. For the C-weighted criteria, we propose a site-specific limit of LC90 + 5 dBC. We also require that the site-specific LCeq (dBC) sound level at a receiving property line not exceed the pre-existing LA90 dB background sound level + 5dB by more than 20 dB. In other words, the dBC operating immission limit (as LCeq) at the receiving property line should not be more than 20 dB above the measured dBA (as LA90) pre-construction long-term background sound level + 5dB.24 This criterion prevents an Immission Spectra Imbalance that often leads to complaints about rumble or other low frequency problems. We also include a not-to-exceed immission limit of 55 and 60 LCeq at the receiving property line.25 Use of the multiple metrics and weightings will address the audible and inaudible low frequency portions of wind turbine sound emissions. Exceedances of any of the limits establish non-compliance.
Why should the dBC immission limit not be permitted to be more than 20 dB above the background measured LA90+5 dB? The World Health Organization and others26 have determined that if a noise has a measured difference between dBC and dBA more than 20 dB, the noise is highly likely to create an annoyance because of the low frequency component.
Isn’t LA90 the minimum background noise level? Not exactly. This is the sound level that represents the quietest 10% of the time. It is often considered to be the sound level that represents the sounds one hears late in the evening or at night when there are no near-by or short term sounds present. It is very important to establish this “long term background” noise environment at the property line for a potentially impacted residence (LA90) during the quietest sleeping hours of the night, between 10 p.m. and 4 a.m.. Why? Because nighttime sleep disturbance has generated the majority of wind farm noise complaints throughout the world those conditions should guide the design of wind projects. ANSI standards define the “long term background sound” as excluding all short term sounds from the test sample using carefully selected sampling times and conditions using ten (10) minute long samples. This means that nature sounds not present during all seasons and wind noise are not to be included in the measurement. Following the procedures in ANSI S12.9, Part 3 for long term background sound the LA90 and LC90 can be measured with one or more 10-minute
24 Hessler Jr., George F., Proposed criteria in residential communities for low‐frequency noise emissions from industrial sources, Noise Control Engineering Journal; 52(4), pg. 180 in “2. Purpose of Proposed Criteria,” (July‐Aug 2004) 25 Ibid, pg. 180 in “3. Proposed Criteria.” 26 Ibid
Prepared for: Report on Tule Wind
Rick
Sticky Note
Accepted set by Rick
Rick
Sticky Note
MigrationConfirmed set by Rick
Siting Wind Turbines October 28, 2008 To Prevent Health Risks From Sound Version 2.1
measurements during any night when the atmosphere is classified as stable with a light wind from the area of the proposed wind farm. The basis for the immission limits for the proposed wind farm would then be the Nighttime Immission Limits, which we propose to be the minimum ten (10) minute nighttime LA90 and LC90 plus 5 dB, a test for Spectra Imbalance, and not-to-exceed limits for the period of 10 p.m. to 7 a.m. Daytime Limits (7 a.m. to 10 p.m.) could be set using daytime measurements, but unless the wind utility only operates during the day, the nighttime limit will always be the limiting sound level. Thus, daytime limits are not normally needed.
A nearby industrial scale wind utility meeting these noise immission criteria would occasionally be audible to the residents during nighttime and daytime. However, it would be unlikely for it to be an indoor problem.
The method used for establishing the background sound level at a proposed wind farm in many of the studies in Table 1, does not meet the requirements set by ANSI S12.9 Part 3 for outdoor measurements and determination of long-term background sound levels. Instead, they use unattended noise monitors to record hundreds of 10-minute or one-hour un-observed measurements that include the short term sounds from varying community and wind conditions over a period of days or weeks. The results for daytime and nighttime are usually combined to determine the average wind noise at the microphone as a function of wind velocity measured at a height of ten (10) meters. This provides an enormous amount of data, but the results have little relationship to wind turbine sound immissions or to potential for turbine noise impacts on nearby residents. They also do not comply with ANSI standards for methodology or quality and as such are not suitable for use in measurements that will be used to assess compliance with other standards and guidelines. This exhaustive exercise often only demonstrates how much ‘pseudo-noise’ is generated by instruments located in a windy environment that exceeds the capability of the instrument’s wind screen to protect the microphone. In many cases, this unqualified data is used to support a claim that the wind noise masks the turbines’ sound immissions.
The major complaints of residents living near wind farms is sleep disruption at night when there is little or no wind near ground level and the wind turbines located at a much higher elevation are turning and generating near or at maximum power and maximum noise emission. There is usually more surface wind and turbulence during daytime caused by solar radiation. Thus, the use of averaged data involving one or more 24-hour periods is of little value in predicting conditions that will result in people who cannot sleep in their homes during the night because of loud intrusive wind turbine noise.
The methodology used to predict the sound propagation from the turbines into the community also fails to represent the conditions of maximum turbine noise impact on nearby residents. This should be expected given the limitations of models based on ISO 9613-227. They also do not consider the effects of a frequent nighttime condition when winds at the ground are calm and the winds at the hub are at or above nominal operating speed. This condition is often referred to as a “stable” atmosphere. During this condition, the wind turbines can be producing the maximum or near maximum power while the wind at ground level is calm and the background noise level is low. The Michigan rural night test data in the earlier figure shows how quiet a night can be in the absence of wind at the ground. This common condition is known to directly cause chronic sleep
27 The ISO 9613‐2 sound propagation model formulas have known errors of 3 dB even when the conditions being modeled are a
perfect match to the limiting conditions specified in the standard. Wind turbines operate far outside the limits for wind speed, height of the noise source above the ground, and other factors identified in the standard thus increasing the likelihood for error above the specified 3 dB. In addition, there are known measurement errors in the IEC61400‐11 test that add another 2 dB of uncertainty to the model’s predictions.
Prepared for: Report on Tule Wind
Siting Wind Turbines October 28, 2008 To Prevent Health Risks From Sound Version 2.1
disruption. Further, the studies report average sound levels and do not disclose the effects of amplitude modulation or low frequency sound which makes the turbine’s sound more objectionable and likely to cause sleep problems.
Are there additional noise data to be recorded for a pre-wind turbine noise survey near selected dwellings? Yes. The precision measuring sound level meter(s) need to be programmed to include measurement of LAeq, LA10, LA90, LCeq, LC10, and LC90, with starting time and date for each 10-minute sample. The L10 results will be used to validate the L90 data. For example, on a quiet night one might expect L10 and L90 to show similar results within 5 to 10 dB between L10 and L90 for each weighting scale. On a windy night or one with nearby short term noise sources the difference between L10 and L90 may be more than 20 dB. There is also often a need to obtain a time-averaged, one-third octave band analysis over the frequency range from 6.3 Hz to 10 kHz during the same ten minute sample. The frequency analysis is very helpful for identifying and correcting for extraneous sounds such as interfering insect noise. An integrating averaging sound level meter meeting ANSI or IEC Type 1 standards has the capability to perform all of the above acoustic measurements simultaneously and store the results internally. There is also a requirement for measurement of the wind velocity near the sound measurement microphone continuously throughout each 10-minute recorded noise sample. The 10-minute maximum wind speed near the microphone must be less than 2 m/s (4.5 mph) during measurements of background noise (L90), and the maximum wind speed for noise measurements during turbine operation must be less than 4 m/s (9 mph). Measurements should be observed (without contaminating the data) and notes identifying short-term noises should be taken for these tests.
Is there a need to record weather data during the background noise recording survey? One weather monitor is required at the proposed wind farm on the side nearest the residents. The weather station sensors are at the standard 10 meter height above ground. It is critical that the weather be recorded every 10 minutes, synchronized with the clocks in the sound level recorders without ambiguity, at the start and end time of each 10 minute period. The weather station should record wind speed and direction, temperature, humidity and rain.
Why do Canada and some other countries base the permitted wind turbine noise immission limits on the operational wind velocity at the 10m height wind speed instead of a maximum dBA or L90 + 5 dBA immission level? First, it appears that the wind turbine industry will take advantage of every opportunity to elevate the maximum permitted noise immission level to reduce the setback distance from the nearby dwellings. Including wind as a masking source in the criteria is one method for elevating the permissible limits. The background noise level does indeed increase with surface wind speed. When this happens, it can be argued that the increased wind noise provides some masking of wind turbine noise. However, this is not true if the surface winds are calm. After sunset, when the ground cools (e.g. in the middle of the night), the lower level atmosphere can separate from the higher-level atmosphere. Then, the winds at the ground will be calm while wind at the turbine hub is very strong. Under this condition, the wind velocity at a 10-meter high wind monitoring station (such as those often used for weather reporting) may be ¼ to ½ the speed of the wind at the hub, yet drop to calm at ground level. The result is that no ground level wind noise is present to mask the sound of the wind turbines, which can be operating at or close to full capacity.
This condition is one of the major causes of wind turbine related noise complaints for residents within 3 km (1.86 miles) of a wind farm. When the turbines are producing high sound levels, it is quiet outside the surrounding homes. The PhD thesis of G.P. van den Berg, The Sounds of High
Prepared for: Report on Tule Wind
Siting Wind Turbines October 28, 2008 To Prevent Health Risks From Sound Version 2.1
Winds, is very enlightening on this issue (Table 3). See also the letter by John Harrison in Ontario “On Wind Turbine Guidelines.28”
What sound monitor measurements would be needed for enforcement of the wind turbine sound ordinance? A similar set of sound tests using the ten (10) minute series of measurements would be repeated, with and without the operation of the wind turbines, at the location where noise was measured before construction, which is closest to the resident registering the wind turbine noise complaint. If the nighttime background (L90) noise level (turbines off) was found to be slightly higher than the measured background prior to the wind farm installation, then the results with the turbines operating must be corrected using standard acoustical engineering methods to determine compliance with the pre-turbine established sound limits.
Who should conduct the sound measurements? An independent acoustics expert should be retained who reports to the County Board or other responsible governing body. This independent acoustics expert should be responsible for all the acoustic measurements including setup and calibration of instruments and interpretation of recorded results. He or she should perform all pre-turbine background noise measurements and interpretation of results to establish the nighttime (and daytime, if applicable) industrial wind turbine sound immission limits, and to monitor compliance.
At present, the acoustical consultants are retained by, and work directly for, the wind farm developers. This presents a serious problem with conflict of interest on the part of the consultants. The wind farm developer would like to show that a significant amount of wind noise is present to mask the sounds of the wind turbine immissions. The community is looking for authentic results showing that the wind turbine noise will be only barely perceptible, and then only occasionally, during the night or daytime.
Is frequency analysis required either during the pre-construction background noise survey or for compliance measurements? Normally one-third octave or narrower band analysis would only be required if there is a complaint of tones immission from the wind farm. Although only standardized dBA and dBC measurements are required to meet the proposed criteria, the addition of one-third octave band analysis is often useful to validate the dBA and dBC results.
The following summarizes the criteria necessary when siting wind turbines to minimize the risk of adverse impacts from noise on the adjacent community29. For those not familiar with acoustical annotation the table and its formulas may seem overly complex, but the criteria are defined in this manner to be as unambiguous as possible. They will be clear for those who are familiar with acoustical terminology. Definitions are provided in a later section of this essay.
28 Harrison, J., Wind Turbine Guidelines, available at http://amherstislandwindinfo.com/
29 The authors have based these criteria, procedures, and language on their current understanding of wind turbine sound emissions, land‐use compatibility, and the effects of sound on health. However, use of the following, in part or total, by any party is strictly voluntary and the user assumes all risks. Please seek professional assistance in applying the recommendations of this document to any specific community or WES development.
Prepared for: Report on Tule Wind
Siting Wind Turbines October 28, 2008 To Prevent Health Risks From Sound Version 2.1
NOISE CRITERIA FOR SITING WIND TURBINES TO PREVENT HEALTH RISKS29
1. Establishing Long‐Term Background Noise Level
a. Instrumentation: ANSI or IEC Type 1 Precision Integrating Sound Level Meter plus meteorological instruments to measure wind velocity, temperature and humidity near the sound measuring microphone. Measurement procedures must meet ANSI S12.9, Part 3 except as noted in Section 4. below.
b. Measurement location(s): Nearest property line(s) from proposed wind turbines representative of all non‐participating residential property within 2.0 miles.
c. Time of measurements and prevailing weather: The atmosphere must be classified as stable with no vertical heat flow to cause air mixing. Stable conditions occur in the evening and middle of the night with a clear sky and very little wind near the surface. Sound measurements are only valid when the measured wind speed at the microphone is less than 2 m/s (4.5 mph).
d. Long‐Term Background sound measurements: All data recording shall be a series of contiguous ten (10) minute measurements. The measurement objective is to determine the quietest ten minute period at each location of interest. Nighttime test periods are preferred unless daytime conditions are quieter. The following data shall be recorded simultaneously for each ten (10) minute measurement period: dBA data includes LA90, LA10, LAeq and dBC data includes LC90, LC10, and LCeq. Record the maximum wind speed at the microphone during the ten minutes, a single measurement of temperature and humidity at the microphone for each new location or each hour whichever is oftener shall also be recorded. A ten (10) minute measurement contains valid data provided: Both LA10 minus LA90 and LC10 minus LC90 are not greater than 10 dB and the maximum wind speed at the microphone is less than 2 m/s during the same ten (10) minute period as the acoustic data.
2. Wind Turbine Sound Immission Limits
No wind turbine or group of turbines shall be located so as to cause wind turbine sound immission at any location on non‐participating property containing a residence in excess of the limits in the following table:
Table of Not‐To‐Exceed Property Line Sound Immission Limits 1
Criteria Condition dBA dBC
A Immission above pre‐construction background:
LAeq =LA90 + 5 LCeq = LC90 +5
B Maximum immission: 35 LAeq 55 LCeq for quiet
2 rural environment 60 LCeq for rural‐suburban environment
C Immission spectra imbalance LCeq (immission) minus (LA90 (background) +5) 20 dB
D Prominent tone penalty: 5 dB 5 dB
Notes
1 Each Test is independent and exceedances of any test establishes non‐compliance. Sound “immission” is the wind turbine noise emission as received at a property.
2 A “Quiet rural environment” is a location >2 miles from a major transportation artery without high traffic volume during otherwise quiet periods of the day or night.
3 Prominent tone as defined in IEC 61400‐11. This Standard is not to be used for any other purpose.1 Procedures provided in Section 7. Measurement Procedures (ANSI 12.9 Part 3 with Amendments) of the most recent version of “The How To Guide To Siting Wind Turbines To Prevent Health Risks From Sound” by Kamperman and James and the apply to this table.
3. Wind Farm Noise Compliance Testing All of the measurements outlined above in 1. Establishing Nighttime Background Noise Level must be repeated to determine compliance with 2. Wind Turbine Sound Immission Limits. The compliance test location is to be the pre‐turbine background noise measurement location nearest to the home of the complainant in line with the wind farm and nearer to the wind farm. The time of day for the testing and the wind farm operating conditions plus wind speed and direction must replicate the conditions that generated the complaint. Procedures of ANSI S12.9‐ Part 3 apply except as noted in Section 4. The effect of instrumentation limits for wind and other factors must be recognized and followed.
Prepared for: Report on Tule Wind
Siting Wind Turbines October 28, 2008 To Prevent Health Risks From Sound Version 2.1
4. ANSI S12.9 Part 3 Selected Options and Requirement Amendments
For measurements taken to assess the preceding criteria specific options provided for in ANSI S12.9‐Part 3 (2008) shall be followed along with any additional requirements included below:
5.2 Background Sound: Use definition (1): ‘long‐term’ 5.2 long‐term background sound: The L90 excludes short term background sounds 5.3 basic measurement period: Ten (10) minutes L90(10 min) 5.6 Sound Measuring Instrument: Type 1 Precision meeting ANSI S1.43 or IEC 61672‐1. The
sound level meter shall cover the frequency range from 6.3 Hz to 20k Hz and simultaneously measure dBA LN and dBC LN. The instrument must also be capable of accurately measuring low‐level background sounds down to 20 dBA.
6.5 Windscreen: Required 6.6(a) An anemometer accurate to ± 10% at 2m/s to full‐scale accuracy. The anemometer shall be
located 1.5 to 2 meters above the ground and orientated to record maximum wind velocity. The maximum wind velocity, wind direction, temperature and humidity shall be recorded for each ten (10) minute sound measurement period observed within 5 m. of the measuring microphone.
7.1 Long‐term background sound 7.2 Data collection Methods: Second method with observed samples to avoid contamination by
short term sounds (purpose: to avoid loss of statistical data) 8. Source(s) Data Collection: All requirements in ANSI S12.18 Method #2, Precision to the
extent possible while still permitting testing of the conditions that lead to complaints. The meteorological requirements in ANSI S12.18 may not be applicable for some complaint tests. For sound measurements in response to a complaint, the compliance sound measurements should be made under conditions that replicate the conditions that caused the complaint without exceeding instrument and windscreen limits and tolerances.
8.1(b) Measuring microphone with windscreen shall be located 1.2m to 1.8m (1.5 preferred) above the ground and greater than 8 m. from large sound reflecting surface.
8.3(a) All meteorological observations required at both (not either) microphone and nearest 10 m. weather reporting station.
8.3(b) For a ten (10) minute background sound measurement to be valid the wind velocity shall be less then 2m/s (4.5 mph) measured less than 5 m. from the microphone. Compliance sound measurements shall be taken when winds are less than 4m/s at the microphone.
8.3(c) In addition to the required acoustic calibration checks, the sound measuring instrument internal noise floor, including microphone, must also be checked at the end of each series of ten minute measurements and no less frequently than once per day. Insert the microphone into the acoustic calibrator with the calibrator signal off. Record the observed dBA and dBC reading on the sound level meter to determine an approximation of the instrument self noise. Perform this test before leaving the background measurement location. The calibrator‐covered microphone must demonstrate the results of this test are at least 5 dB below the immediately previous ten (10) minute acoustic test results, for the acoustic background data to be valid. This test is necessary to detect undesired increase in the microphone and sound level meter internal self‐noise. As a precaution sound measuring instrumentation should be removed from any air conditioned space at least an hour before use. Nighttime measurements are often performed very near the meteorological dew point. Minor moisture condensation inside a microphone or sound level meter can increase the instrument self noise and void the measured background data.
8.4 The remaining sections, starting at 8.4 in ANSI S12.9 Part 3 Standard do not apply.
Prepared for: Report on Tule Wind
Siting Wind Turbines October 28, 2008 To Prevent Health Risks From Sound Version 2.1
V. How to Include the Recommended Criteria in Ordinances and/or Community Noise Limits
The following two sections present the definitions, technical requirements, and complaint resolution processes that support the recommended criteria. Following the formal elements is a section discussing the measurement procedures and requirements for enforcement of these criteria. For the purpose of the following sections the government authority will be referred to as the Local Government Authority (LGA) as a place marker for State, County, Township or other authorized authority. The abbreviation ‘WES’ is used for industrial scale wind energy system.
The authors have based these criteria, procedures, and language on their current understanding of wind turbine sound emissions, land-use compatibility, and the effects of sound on health. However, use of the following, in part or total, by any party is strictly voluntary and the user assumes all risks. Please seek professional assistance in applying the recommendations of this document to any specific community or WES development.
VI. ELEMENTS OF A WIND ENERGY SYSTEMS LICENSING ORDINANCE FOR SOUND
I. Purpose and Intent. Based upon the findings stated above, it is the intended purpose of the LGA to regulate Wind Energy Systems to promote the health, safety, and general welfare of the citizens of the Town and to establish reasonable and uniform regulations for the operation thereof so as to control potentially dangerous effects of these Systems on the community.
II. Definitions. The following terms have the meanings indicated:
“Aerodynamic Sound” means a noise that is caused by the flow of air over and past the blades of a WES.
“Ambient Sound” Ambient sound encompasses all sound present in a given environment, being usually a composite of sounds from many sources near and far. It includes intermittent noise events, such as, from aircraft flying over, dogs barking, wind gusts, mobile farm or construction machinery, and the occasional vehicle traveling along a nearby road. The ambient also includes insect and other nearby sounds from birds and animals or people. The near-by and transient events are part of the ambient sound environment but are not to be considered part of the long-term background sound.
“American National Standards Institute (ANSI)” Standardized acoustical instrumentation and sound measurement protocol shall meet all the requirements of the following ANSI Standards:
"Applicant" means the individual or business entity that seeks to secure a license under this section of the Town municipal code.
“A‐Weighted Sound Level (dBA)” A measure of over-all sound pressure level designed to reflect the response of the human ear, which does not respond equally to all frequencies. It is used to describe sound in a manner representative of the human ear’s response. It reduces the effects of the low with respect to the frequencies centered around 1000 Hz. The resultant sound level is said to be “A-weighted” and the units are “dBA.” Sound level meters have an A-weighting network for measuring A-weighted sound levels (dBA) meeting the characteristics and weighting specified in ANSI Specifications for Integrating Averaging Sound Level Meters, S1.43-1997 for Type 1 instruments and be capable of accurate readings (corrections for internal noise and microphone response permitted) at 20 dBA or lower. In this document dBA means LAeq unless specified otherwise.
“Background Sound (L90)” refers to the sound level present at least 90% of the time. Background sounds are those heard during lulls in the ambient sound environment. That is, when transient sounds from flora, fauna, and wind are not present. Background sound levels vary during different times of the day and night. Because WES operates 24/7 the background sound levels of interest are those during the quieter periods which are often the evening and night. Sounds from the WES of interest, near-by birds and animals or people must be excluded from the background sound test data. Nearby electrical noise from streetlights, transformers and cycling AC units and pumps etc must also be excluded from the background sound test data.
Background sound level (dBA and dBC (as L90)) is the sound level present 90% of the time during a period of observation that is representative of the quiet time for the soundscape under evaluation and with duration of ten (10) continuous minutes. Several contiguous ten (10) minute tests may be performed in one hour to determine the statistical stability of the sound environment. Measurement periods such as at dusk when bird and insect activity is high or the early morning hours when the ‘dawn chorus’ is present are not acceptable measurement times. Longer term sound level averaging tests, such as 24 hours or multiple days are not at all appropriate since the purpose is to define the quiet time background sound level. It is defined by the L A 90 and L C 90 descriptors. It may be considered as the quietest one (1) minute during a ten (10) minute test. L A 90 results are valid only when L A 10 results are no more than 10 dB above L A 90 for the same period. L C
10 less L C 90 are not to exceed 10 dB to be valid.
The background noise environment consists of a multitude of distant sources of sound. When a new nearby source is introduced the new background noise level would be increased. The addition of a new source with a noise level 10 below the existing background would increase the new background 0.4 dB. If the new source has the same noise level as the existing background then the new background is increased 3.0 dB. Lastly, if the new source is 3.3 dB above the existing background then the new background would have increased 5 dB. For example, to meet the requirement of L90A + 5 dB = 31 dBA if the existing quiet nighttime background sound level is 26 dBA, the maximum wind turbine noise immission contribution independent of the background cannot exceed 29.3 dBA Leq at a dwelling. When adding decibels, a 26 dBA background combined with 29.3 dBA from the turbines (without background) results in 31 dBA.
Further, background L90 sound levels documenting the pre-construction baseline conditions should be determined when the ten (10) minute maximum wind speed is less than 2 m/s (4.5 mph) near ground level/microphone location 1.5 m height.
“Blade Passage Frequency” (BPF) means the frequency at which the blades of a turbine pass a particular point during each revolution (e.g. lowest point or highest point in rotation) in terms of
Prepared for: Report on Tule Wind
Siting Wind Turbines October 28, 2008 To Prevent Health Risks From Sound Version 2.1
events per second. A three bladed turbine rotating at 28 rpm would have a BPF of 1.4 Hz. [E.g. ((3 blades times 28rpm)/60 seconds per minute = 1.4 Hz BPF)]
“C‐Weighted Sound Level (dBC)” Similar in concept to the A-Weighted sound Level (dBA) but C-weighting does not de-emphasize the frequencies below 1k Hz as A-weighting does. It is used for measurements that must include the contribution of low frequencies in a single number representing the entire frequency spectrum. Sound level meters have a C-weighting network for measuring C-weighted sound levels (dBC)meeting the characteristics and weighting specified in ANSI S1.43-1997 Specifications for Integrating Averaging Sound Level Meters for Type 1 instruments. In this document dBC means LCeq unless specified otherwise.
“Decibel (dB)” A dimensionless unit which denotes the ratio between two quantities that are proportional to power, energy or intensity. One of these quantities is a designated reference by which all other quantities of identical units are divided. The sound pressure level (Lp) in decibels is equal to 10 times the logarithm (to the base 10) of the ratio between the pressure squared divided by the reference pressure squared. The reference pressure used in acoustics is 20 MicroPascals.
“Emission” Sound energy that is emitted by a noise source (wind farm) is transmitted to a receiver (dwelling) where it is immitted (see “immission).
“Frequency” The number of oscillations or cycles per unit of time. Acoustical frequency is usually expressed in units of Hertz (Hz) where one Hz is equal to one cycle per second.
“Height” means the total distance measured from the grade of the property as existed prior to the construction of the wind energy system, facility, tower, turbine, or related facility at the base to its highest point.
“Hertz (Hz)” Frequency of sound expressed by cycles per second.
“Immission” Noise immitted at a receiver (dwelling) is transmitted from noise source (wind turbine) that emitted sound energy (see “emission”).
“Immission spectra imbalance” The spectra are not in balance when the C-weighted sound level is more than 20 dB greater than the A-weighted sound level. For the purposes of this requirement, the A-weighted sound level is defined as the long-term background sound level (LA90) +5 dBA. The C-weighted sound level is defined as the LCeq measured during the operation of the wind turbine operated so as to result in its highest sound output. A Complaint test provided later in this document is based on the immission spectra imbalance criteria.
“Infra‐Sound” sound with energy in the frequency range of 0-20 Hz is considered to be infra-sound. It is normally considered to not be audible for most people unless in relatively high amplitude. However, there is a wide range between the most sensitive and least sensitive people to perception of sound and perception is not limited to stimulus of the auditory senses. The most significant exterior noise induced dwelling vibration occurs in the frequency range between 5 Hz and 50 Hz. Moreover, levels below the threshold of audibility can still cause measurable resonances inside dwelling interiors. Conditions that support or magnify resonance may also exist in human body cavities and organs under certain conditions. Although no specific test for infrasound is provided in this document, the test for immission spectra imbalance will limit low frequency sound and thus, indirectly limit infrasound. See low-frequency noise (LFN) for more information.
“Low Frequency Noise (LFN)” refers to sounds with energy in the lower frequency range of 20 to 200 Hz. LFN is deemed to be excessive when the difference between a C-weighted sound level and an A-weighted sound level is greater than 20 decibels at any measurement point outside a residence or
Prepared for: Report on Tule Wind
Siting Wind Turbines October 28, 2008 To Prevent Health Risks From Sound Version 2.1
other occupied structure. The criteria for this condition is the “Immission Spectra Imbalance” entry in the Table of Not‐To‐Exceed Property Line Sound Immission Limits.”
“Measurement Point (MP)” means location where sound measurements are taken such that no significant obstruction blocks sound from the site. The Measurement Point should be located so as to not be near large objects such as buildings and in the line-of-sight to the nearest turbines. Proximity to large buildings or other structures should be twice the largest dimension of the structure, if possible. Measurement Points should be at quiet locations remote from street lights, transformers, street traffic, flowing water and other local noise sources.
“Measurement Wind Speed” For measurements conducted to establish the background noise levels (LA90 10 min, LC90 10 min, and etc.) the maximum wind speed, sampled within 5m of the microphone and at its height, shall be less than 2 m/s (4.5 mph) for valid background measurements. For valid wind farm noises measurements conducted to establish the post-construction sound level the maximum wind speed, sampled within 5m of the microphone and at its height, shall be less than 4m/s (9 mph). The wind speed at the WES blade height shall be at or above the nominal rated wind speed and operating in its highest sound output mode. For purposes of enforcement, the wind speed and direction at the WES blade height shall be selected to reproduce the conditions leading to the enforcement action while also restricting maximum wind speeds at the microphone to less than 4 m/s (9 mph).
For purposes of models used to predict the sound levels and sound pressure levels of the WES to be submitted with the Application, the wind speed shall be the speed that will result in the worst-case LAeq and LCeq sound levels at the nearest non-participating properties to the WES. If there may be more than one set of nearby sensitive receptors, models for each such condition shall be evaluated and the results shall be included in the Application.
“Mechanical Noise” means sound produced as a byproduct of the operation of the mechanical components of a WES(s) such as the gearbox, generator and transformers.
“Noise” means any unwanted sound. Not all noise needs to be excessively loud to represent an annoyance or interference.
“Project Boundary” means the external property boundaries of parcels owned by or leased by the WES developers. It is represented on a plot plan view by a continuous line encompassing all WES(s) and related equipment associated with the WES project.
“Property Line” means the recognized and mapped property parcel boundary line.
“Qualified Independent Acoustical Consultant” Qualifications for persons conducting baseline and other measurements and reviews related to the application for a WES or for enforcement actions against an operating WES include, at a minimum, demonstration of competence in the specialty of community noise testing. An example is a person with Full Membership in the Institute of Noise Control Engineers (INCE). There are scientists and engineers in other professional fields that have been called upon by their local community for help in the development of a WES Noise Ordinance. Many of these scientists and engineers have recently spent hundreds of hours learning many important aspects of noise related to the introduction of WES into their communities. Then with field measurement experience with background data and wind turbine noise emission, they have become qualified independent acoustical consultants for WES siting. Certifications such as Professional Engineer (P.E.) do not test for competence in acoustical principles and measurement and are thus not, without further qualification, appropriate for work under this document. The Independent Qualified Acoustical Consultant can have no financial or other connection to a WES developer or related company.
Prepared for: Report on Tule Wind
Siting Wind Turbines October 28, 2008 To Prevent Health Risks From Sound Version 2.1
“Sensitive Receptor” means places or structures intended for human habitation, whether inhabited or not, public parks, state and federal wildlife areas, the manicured areas of recreational establishments designed for public use, including but not limited to golf courses, camp grounds and other nonagricultural state or federal licensed businesses. These areas are more likely to be sensitive to the exposure of the noise, shadow or flicker, etc. generated by a WES or WESF. These areas include, but are not limited to: schools, daycare centers, elder care facilities, hospitals, places of seated assemblage, non-agricultural businesses and residences.
“Sound” A fluctuation of air pressure which is propagated as a wave through air
“Sound Power” The total sound energy radiated by a source per unit time. The unit of measurement is the watt. Abbreviated as Lw. This information is determined for the WES manufacturer under laboratory conditions specified by IEC 61400-11 and provided to the local developer for use in computer model construction. There is known measurement error in this test procedure that must be disclosed and accounted for in the computer models. Even with the measurement error correction it cannot be assumed that the reported Lw values represent the highest sound output for all operating conditions. They reflect the operating conditions required to meet the IEC 61400-11 requirements. The lowest frequency is 50 Hz for acoustic power (Lw) requirement (at present) in IEC 61400-11. This Ordinance requires wind turbine certified acoustic power (Lw) levels at rated load for the total frequency range from 6.3 Hz to 10k Hz in one-third octave frequency bands tabulated to the nearest 1 dB. The frequency range of 6.3 Hz to 10k Hz shall be used throughout this Ordinance for all sound level modeling, measuring and reporting.
“Sound Pressure” The instantaneous difference between the actual pressure produced by a sound wave and the average or barometric pressure at a given point in space.
“Sound Pressure Level (SPL)” 20 times the logarithm, to the base 10, of the ratio of the pressure of the sound measured to the reference pressure, which is 20 micronewtons per square meter. In equation form, sound pressure level in units of decibels is expressed as SPL (dB) = 20 log p/pr.
“Spectrum” The description of a sound wave's resolution into its components of frequency and amplitude. The WES manufacturer is required to supply a one-third octave band frequency spectrum of the wind turbine sound emission at 90% of rated power. The published sound spectrum is often presented as A-weighted values but C-weighted values are preferred. This information is used to construct a model of the wind farm’s sound immission levels at locations of interest in and around the WES. The frequency range of interest for wind turbine noise is approximately 6 Hz to 10k Hz.
“Statistical Noise Levels” Sounds that vary in level over time, such as road traffic noise and most community noise, are commonly described in terms of the statistical exceedance levels LNA, where LNA is the A-weighted sound level exceeded for N% of a given measurement period. For example, L10 is the noise level exceeded for 10% of the time. Of particular relevance, are: LA10 and LC10 the noise level exceed for 10% of the ten (10) minute interval. This is commonly referred to as the average maximum noise level. LA90 and LC90 are the A-weighted and C-weighted sound levels exceeded for 90% of the ten (10) minute sample period. The L90 noise level is defined by ANSI as the long-term background sound level (i.e. the sounds one hears in the absence of the noise source under consideration and without short term or near-by sounds from other sources), or simply the “background level.” Leq is the A or C-weighted equivalent noise level (the “average” noise level). It is defined as the steady sound level that contains the same amount of acoustical energy as the corresponding time-varying sound.
Prepared for: Report on Tule Wind
Siting Wind Turbines October 28, 2008 To Prevent Health Risks From Sound Version 2.1
“Tonal sound or tonality” Tonal audibility. A sound for which the sound pressure is a simple sinusoidal function of the time, and characterized by its singleness of pitch. Tonal sound can be simple or complex.
"Wind Energy Systems (WES)" means equipment that converts and then transfers energy from the wind into usable forms of electrical energy.
"Wind Turbine" or "Turbine" (WT) means an industrial scale mechanical device which captures the kinetic energy of the wind and converts it into electricity. The primary components of a wind turbine are the blade assembly, electrical generator and tower.
III. APPLICATION PROCEDURE FOR WIND ENERGY SYSTEMS
AND TECHNICAL REQUIREMENTS FOR LICENSING
This ordinance is intended to promote the safety and health of the community through criteria limiting sound emissions during operation of Wind Energy Systems. It is recognized that the requirements herein are neither exclusive, nor exhaustive. In instances where a health or safety concern is known to the wind project developer or identified by other means with regard to any application for a Wind Energy System, additional and/or more restrictive conditions may be included in the license to address such concerns. All rights are reserved to impose additional restrictions as circumstances warrant. Such additional or more restrictive conditions may include, without limitation (a) greater setbacks, (b) more restrictive noise limitations, or (c) limits restricting operation during night time periods or for any other conditions deemed reasonable to protect the community.
A. Application
Any Person desiring to secure a Wind Energy Systems license shall file an application form provided by the LGA Clerk, together with two additional copies of the application with the LGA Clerk.
B. Information to be submitted with Application
1. Information regarding the:
Make and model of all turbines potentially used in this project, Sound Power Levels (Lw) for each 1/3 octave band from 6.3 Hz to 10,000 Hz, and A sound propagation model predicting the sound levels immitted into the community
computed using at minimum 1/1 octave band sound power levels to compute the LCeq and LAeq levels to generate LAeq and LCeq contours in 5 dB increments overlaying an aerial view and property survey map from the WES property out to a distance to include all residential property within two (2) miles of the WES Property. Appropriate corrections for model algorithm error, IEC61400-11 test measurement accuracy, and directivity patterns of for each model of WT shall be disclosed and accounted for in the model(s). Predictions shall be made at all property lines within and outward for two (2) miles from the project boundary for the wind speed, direction and operating mode that would result in the worst case WT nighttime sound emissions.
The prediction model shall assume that the winds at hub height are sufficient for the highest sound emission operating mode. The projection shall include a description of all assumptions made in the model’s construction and algorithms. If the model does not consider the effects of wind direction, geography of the terrain, and/or the effects of reinforcement from coherent sounds or tones from
Prepared for: Report on Tule Wind
Siting Wind Turbines October 28, 2008 To Prevent Health Risks From Sound Version 2.1
the turbines all these items should be identified and all other means used to adjust the model’s output to account for these factors. The results shall be displayed as a contour map of the predicted levels as over-all LAeq and LCeq contours out to 2 miles from the WES property, and shall also include a table showing the 1/3 or 1/1 octave band sound pressure as LCeq levels for the nearest property line(s) for sensitive receptor sites (including residences) within the model’s boundaries. The predicted values must include the over-all sound levels and 1/1 or 1/3 octave band sound pressure levels from 6 Hz to 10k Hz in data tables that include the location of each receiving point by GPS location or other repeatable means.
C. Preconstruction Background Noise Survey
1. The Town reserves the right to require the preparation of (a) a preconstruction noise survey for each proposed Wind Turbine location conducted per procedures provided in the section on Measurement Procedures showing long-term background LA90 and LC90 sound levels. This must be completed and accepted prior to approval of the final layout and issuance of project permits.
a. If any proposed wind farm project locates a WES within two miles of a sensitive receptor these studies are mandatory. The preconstruction baseline studies shall be conducted by an Independent Qualified Acoustical Consultant selected and hired by the LGA.
b. The applicant shall be responsible for paying the consultant’s fees and costs associated with conducting the study. These fees and cost shall be negotiated with the consultant and determined prior to any work being done on the study. The applicant shall be required to set aside 100% of these fees in an escrow account managed by the LGA, before the study is commenced by the consultant. Payment for this study does not require the WES developer’s acceptance of the study’s results.
c. If the review shows that the predicted LAeq and LCeq sound levels exceed any of the criteria specified in the Table of Not‐To‐Exceed Property Line Sound Immission Limits then the application cannot be approved.
2. The LGA will refer the application to the LGA engineer (if qualified in acoustics) or an independent qualified acoustical consultant for further review and comparison of the long-term background sound levels against the predicted LAeq and LCeq sound levels reported for the model using the criteria in the Table of Not‐To‐Exceed Property Line Sound Immission Limits. The reasonably necessary costs associated with such a review shall be the responsibility of the applicant, in accord with the terms of this ordinance.
D. Post Construction Noise Measurement Requirements 1. Sound Regulations Compliance: A WES shall be considered in violation of the conditional use
permit unless the applicant demonstrates that the project complies with all sound level limits using the procedures specified in this ordinance. Sound levels in excess of the limits established in this ordinance shall be grounds for the LGA to order immediate shut down of all non-compliant WT units.
2. Post-Construction Sound Measurements: Within twelve months of the date when the project is fully operational, and within four weeks of the anniversary date of the pre-construction background noise measurements, repeat the existing sound environment measurements taken before the project approval. Post-construction sound level measurements shall be taken both with all WES’s running and with all WES’s off. At the discretion of the Town, the Pre-construction background sound levels (LA90 and LC90) can be substituted for the “all WES off’ tests if a random sampling of 10% of the pre-construction study sites shows that background L90A and L90C conditions have increased less than 3 dB from those measured under the pre-
Prepared for: Report on Tule Wind
Siting Wind Turbines October 28, 2008 To Prevent Health Risks From Sound Version 2.1
construction nighttime conditions. The post-construction measurements will be reported to the LGA (available for public review) using the same format as used for the preconstruction sound studies. Post-construction noise studies shall be conducted by a firm chosen and hired by the LGA. Costs of these studies are to be reimbursed by the Licensee in a similar manner to that described above. The wind farm developer’s may ask to have its own consultant observe the publicly retained consultant at the convenience of the latter. The WES Licensee shall provide all technical information and wind farm data required by the qualified independent acoustical consultant before, during, and/or after any acoustical studies required by this document and for acoustical measurements.
3. Sound Limits
1. Establishing Long‐Term Background Sound Level
a. Instrumentation: ANSI or IEC Type 1 Precision Integrating Sound Level Meter plus meteorological instruments to measure wind velocity, temperature and humidity near the sound measuring microphone. Measurement procedures must meet ANSI S12.9, Part 3 and Measurement Procedures Appendix to Ordinance following next Section.
.
b. Measurement location(s): Nearest property line(s) from proposed wind turbines representative of all non-participating residential property within 2.0 miles.
c. Time of measurements and prevailing weather: The atmosphere must be classified as stable with no vertical heat flow to cause air mixing. Stable conditions occur in the evening and middle of the night with a clear sky and very little wind near the surface. Sound measurements are only valid when the measured maximum wind speed at the microphone must be less than 2 m/s (4.5 mph).
d. Long-Term Background sound measurements: All data recording shall be a series of contiguous ten (10) minute measurements. The measurement objective is to determine the quietest ten minute period at each location of interest. Nighttime test periods are preferred unless daytime conditions are quieter. The following data shall be recorded simultaneously for each ten (10) minute measurement period: dBA data includes LA90, LA10, LAeq and dBC data includes LC90, LC10, and LCeq. The maximum wind speed at the microphone during the ten minutes, a single measurement of temperature and humidity at the microphone for each new location or each hour whichever is oftener shall also be recorded. A ten (10) minute measurement contains valid data provided: Both LA10 minus LA90 and LC10 minus LC90 are not greater than 10 dB and the maximum wind speed at the microphone is less than 2 m/s during the same ten (10) minute period as the acoustic data.
2. Wind Turbine Sound Immission Limits
No wind turbine or group of turbines shall be located so as to cause wind turbine sound immission at any location on non-participating property containing a residence in excess of the limits in the following table:
Prepared for: Report on Tule Wind
Siting Wind Turbines October 28, 2008 To Prevent Health Risks From Sound Version 2.1
Table of Not‐To‐Exceed Property Line Sound Immission Limits 1 Criteria Condition dBA dBC
A Immission above pre‐construction background:
LAeq =LA90 + 5 LCeq = LC90 +5
B Maximum immission: 35 LAeq 55 LCeq for quiet
2 rural environment60 LCeq for rural‐suburban environment
C Immission spectra imbalance (C ‐ A < 20dB)
LCeq (immission) minus (LA90 (background) +5 dB) 20 dB
D Prominent tone penalty: 5 dB 5 dB
Notes
1 Each Test is independent and exceedances of any test establishes non‐compliance Sound “immission” is the wind turbine sound emission as received at a property.
2 A “quiet rural environment” is a location 2 miles from a major transportation artery without high traffic volume during otherwise quiet periods of the day or night.
3 Prominent tone as defined in IEC 61400‐11. This Standard is not to be used for any other purpose.
1 Required Procedures provided in VIII Reference Standards including ANSI 12.9 Part 3 as Amended
3. Wind Farm Noise Compliance Testing All of the measurements outlined above in 1. Establishing Long Term Background Noise
Level must be repeated to determine compliance with 2. Wind Turbine Sound Immission Limits. The compliance test location is to be the pre-turbine background noise measurement location nearest to the home of the complainant in line with the wind farm and nearer to the wind farm. The time of day for the testing and the wind farm operating conditions plus wind speed and direction must replicate the conditions that generated the complaint. Procedures of ANSI S12.9- Part 3 apply as amended in the Appendix to Ordinance. The effect of instrumentation limits for wind and other factors must be recognized and followed.
3. Operations
The WES/WT is non-compliant and must be shut down immediately if it exceeds any of the limits in the Table of Not‐To‐Exceed Property Line Sound Immission Limits.
4. Complaint Resolution
1. The owner/operator of the WES shall respond within five (5) business days after notified of a noise complaint by any property owner within the project boundary and a one-mile radius beyond the project boundary.
2. The tests shall be performed by a qualified independent acoustical consultant acceptable to the complainant and the local agency charged with enforcement of this ordinance.
3. Testing shall commence within ten (10) working days of the request. If testing cannot be initiated within ten (10) days, the WES(s) in question shall be shut down until the testing can be started.
4. A copy of the test results shall be sent to the property owner, and the LGA’s Planning or Zoning department within thirty (30) days of test completion.
5. If a Complaint is made, the presumption shall be that it is reasonable. The LGA shall undertake an investigation of the alleged operational violation by a qualified individual mutually acceptable to the LGA.
Prepared for: Report on Tule Wind
Siting Wind Turbines October 28, 2008 To Prevent Health Risks From Sound Version 2.1
a) The reasonable cost and fees incurred by the LGA in retaining said qualified individual shall be reimbursed by the owner of the WESF.
b) Funds for this assessment shall be paid or put into an escrow account prior to the study and payment shall be independent of the study findings.
6. After the investigation, if the LGA reasonably concludes that operational violations are shown to be caused by the WESF, the licensee/operator/owner shall use reasonable efforts to mitigate such problems on a case-by-case basis including such measures as not operating during the nighttime or other noise sensitive period if such operation was the cause of the complaints.
5. Reimbursement of Fees and Costs.
Licensee/operator/owner agrees to reimburse the LGA 's reasonable fees and costs incurred in the preparation, negotiation, administration and enforcement of this Ordinance, including, without limitation, the LGA 's attorneys' fees, engineering and/or consultant fees, LGA meeting and hearing fees and the costs of public notices. If requested by the LGA the funds shall be placed in an escrow account under the management of the LGA. The preceding fees are payable within thirty (30) days of invoice. Unpaid invoices shall bear interest at the rate of 1% per month until paid. The LGA may recover all reasonable costs of collection, including attorneys' fees.
VII. MEASUREMENT PROCEDURES
SUPPLEMENT TO WIND ENERGY SYSTEMS LICENSING ORDINANCE FOR SOUND
I. Introduction
The potential impact of sound and sound induced building vibration associated with the operation of wind powered electric generators is often a primary concern for citizens living near proposed wind energy systems (WES(s)). This is especially true of projects located near homes, residential neighborhoods, businesses, schools, and hospitals in quiet residential and rural communities. Determining the likely sound and vibration impacts is a highly technical undertaking and requires a serious effort in order to collect reliable and meaningful data for both the public and decision makers.
This protocol is based in part on criteria published in American National Standards S12.9 –Part 3 Quantities and Procedures for Description and Measurement of Environmental Sound, and S12.18 and for the measurement of sound pressure level outdoors.
The purpose is to first, establish a consistent and scientifically sound procedure for evaluating existing background levels of audible and low frequency sound in a WES project area, and second to use the information provided by the Applicant in its Application showing the predicted over-all sound levels in terms of LAeq and LCeq and 1/3 or 1/1 octave bands as part of the required information submitted with the application.
The over-all values shall be presented as overlays to the applicant’s iso-level plot plan graphics and, for 1/1 or 1/3 octave data, in tabular form with location information sufficient to permit comparison of the baseline results to the predicted levels. This comparison will use the level limits of the ordinance to determine the likely impact operation of a new wind energy system project will have on the existing community soundscape. If the comparison demonstrates that the WES project will not exceed any of the level limits the project will be considered to be within allowable limits for safety and health. If the Applicant submits only partial information required for this comparison
Prepared for: Report on Tule Wind
Siting Wind Turbines October 28, 2008 To Prevent Health Risks From Sound Version 2.1
the application cannot be approved. In all cases the burden to establish the operation as meeting safety and health limits will be on the Applicant.
Next, it covers requirements for the sound propagation model to be supplied with the application.
Finally, if the project is approved, this section covers the study needed to compare the post-build sound levels to the predictions and the baseline study. The level limits in the ordinance apply to the post-build study. In addition, if there have been any complaints about WES sound or low frequency noise emissions or wind turbine noise induced dwelling vibration by any resident of an occupied dwelling that property will be included in the post-build study for evaluation against the rules for sound level limits and compliance.
The characteristics of the proposed WES project and the features of the surrounding environment will influence the design of the sound and vibration study. Site layout, types of WES(s) selected and the existence of other significant local audible and low frequency sound sources and sensitive receptors should be taken into consideration when designing a sound study. The work will be performed by a qualified independent acoustical consultant for both the pre-construction background and post-construction sound studies as described in the body of the ordinance.
II. Instrumentation
All instruments and other tools used to measure audible, inaudible and low frequency sound shall meet the requirements for ANSI or IEC Type 1 Integrating Averaging Sound Level Meter Standards The principle standard reference for this document is ANSI 12.9/Part 3 with important additional specific requirements for the measuring instrumentation and measurement protocol.
III. Measurement of Pre‐Construction Sound Environment (Base‐line)
An assessment of the proposed WES project areas existing sound environment is necessary in order to predict the likely impact resulting from a proposed project. The following guidelines must be used in developing a reasonable estimate of an area's existing background sound environment. All testing is to be performed by an independent qualified acoustical consultant approved by the LGA as provided in the body of the ordinance. The WES applicant may file objections detailing any concerns it may have with the LGA’s selection. These concerns will be addressed in the study. Objections must be filed prior to the start of the noise study. All measurements are to be conducted with ANSI or IEC Type 1 certified and calibrated test equipment per reference specification at the end of this section. Test results will be reported to the LGA or its appointed representative.
Sites with No Existing Wind Energy Systems (Base‐line Sound Study)
Sound level measurements shall be taken as follows:
The results of the model showing the predicted worst case LAeq and LCeq sound emissions of the proposed WES project will be overlaid on a map (or separate LAeq and LCeq maps) of the project area. An example (right) shows an approximately two (2) mile square section with iso-level contour lines prepared by the
Prepared for: Report on Tule Wind
Siting Wind Turbines October 28, 2008 To Prevent Health Risks From Sound Version 2.1
applicant, sensitive receptors (homes) and locations selected for the baseline sound tests whichever are the controlling metric. The test points shall be located at the property line bounding the property of the turbine’s host closest to the wind turbine. Additional sites may be added if appropriate. A grid comprised of one (1) mile boundaries (each grid cell is one (1) square mile) should be used to assist in identifying between two (2) to ten (10) measurement points per cell. The grid shall extend to a minimum of two (2) miles beyond the perimeter of the project boundary. This may be extended to more than two (2) miles at the discretion of the LGA. The measurement points shall be selected to represent the noise sensitive receptor sites based on the anticipated sound propagation from the combined WT in the project. Usually, this will be the closest WT. If there is more than one WT near-by then more than one test site may be required.
The intent is to anticipate the locations along the bounding property line that will receive the highest sound immissions. The site that will most likely be negatively affected by the WES project’s sound emissions should be given first priority in testing. These sites may include sites adjacent to occupied dwellings or other noise sensitive receptor sites. Sites shall be selected to represent the locations where the background soundscapes reflect the quietest locations of the sensitive receptor sites. Background sound levels (and 1/3 octave band sound pressure levels if required) shall be obtained according to the definitions and procedures provided in the ordinance and recognized acoustical testing practice and standards.
All properties within the proposed WES project boundaries will be considered for this study.
One test shall be conducted during the period defined by the months of April through November with the preferred time being the months of June through August. These months are normally associated with more contact with the outdoors and when homes may have open windows during the evening and night. Unless directed otherwise by the LGA the season chosen for testing will represent the background soundscape for other seasons. At the discretion of the LGA, tests may be scheduled for other seasons.
All measurement points (MPs) shall be located with assistance from the LGA staff and property owner(s) and positioned such that no significant obstruction (building, trees, etc.) blocks sound and vibration from the nearest proposed WES site.
Duration of measurements shall be a minimum of ten (10) continuous minutes for all criteria at each location. The duration must include at least six (6) minutes that are not affected by transient sounds from near-by and non-nature sources. Multiple ten (10) minute samples over longer periods such as 30 minutes or one (1) hour may be used to improve the reliability of the LA90 and LC90
values. The ten (10) minute sample with the lowest valid L90 values will be used to define the background sound.
The tests at each site selected for this study shall be taken during the expected ‘quietest period of the day or night’ as appropriate for the site. For the purpose of determining background sound characteristics the preferred testing time is from 10pm until 4 am. If circumstances indicated that a different time of the day should be sampled the test may be conducted at the alternate time if approved by the Town.
Sound level measurements shall be made on a weekday of a non-holiday week. Weekend measurements may also be taken at selected sites where there are weekend activities that may be affected by WT sound.
Measurements must be taken with the microphone at 1.2 to 1.5 meters above the ground and at least 15 feet from any reflective surface following ANSI 12.9 Part 3 protocol including selected options and other requirements outlined later in this Section.
Prepared for: Report on Tule Wind
Siting Wind Turbines October 28, 2008 To Prevent Health Risks From Sound Version 2.1
1. For each Measurement Point and for each qualified measurement period, provide each of the following measurements:
a. LAeq, LA10, and LA90, and
b. LCeq , LC10, and LC90
2. A narrative description of any intermittent sounds registered during each measurement. This may be augmented with video and audio recordings.
3. A narrative description of the steady sounds that form the background soundscape. This may be augmented with video and audio recordings.
4. Wind speed and direction at the microphone (Measurement Point), humidity and temperature at time of measurement will be included in the documentation. Corresponding information from the nearest 10 meter weather reporting station shall also be obtained.
Measurements taken only when wind speeds are less than 2m/s (4.5 mph) at the microphone location will be considered valid for this study. A windscreen of the type recommended by the monitoring instrument’s manufacturer must be used for all data collection.
5. Provide a map and/or diagram clearly showing (Using plot plan provided by LGA or Applicant):
The layout of the project area, including topography, the project boundary lines, and property lines.
The locations of the Measurement Points. The distance between any Measurement Points and the nearest WT(s). The location of significant local non-WES sound and vibration sources. The distance between all MPs and significant local sound sources. And, The location of all sensitive receptors including but not limited to: schools, day-care centers,
hospitals, residences, residential neighborhoods, places of worship, and elderly care facilities.
Sites with Existing Wind Energy Systems
Two complete sets of sound level measurements must be taken as defined below:
1. One set of measurements with the wind generator(s) off unless the LGA elects to substitute the sound data collected for the background sound study. Wind speeds must be suitable for background sound tests as specified elsewhere in this ordinance.
2. One set of measurements with the wind generator(s) running with wind speed at hub height sufficient to meet nominal rated power output or higher and less than 2 m/s below at the microphone location. Conditions should reflect the worst case sound emissions from the WES project. This will normally involve tests taken during the evening or night when winds are calm (less than 2m/sec) at the ground surface yet, at hub height, sufficient to power the turbines.
Sound level measurements and meteorological conditions at the microphone shall be taken and documented as discussed above.
Sound level Estimate for Proposed Wind Energy Systems (when adding more WT to existing project)
In order to estimate the sound impact of the proposed WES project on the existing environment an estimate of the sound produced by the proposed WES(s) under worst-case conditions for
Prepared for: Report on Tule Wind
Siting Wind Turbines October 28, 2008 To Prevent Health Risks From Sound Version 2.1
producing sound emissions must be provided. This study may be conducted by a firm chosen by the WES operator with oversight provided by the LGA.
The qualifications of the firm should be presented along with details of the procedure that will be used, software applications, and any limitations to the software or prediction methods as required elsewhere in this ordinance for models.
Provide the manufacturer's sound power level (LAw) and (LCw) characteristics for the proposed WES(s) operating at full load utilizing the methodology in IEC 61400-11 Wind Turbine Noise Standard. Provide one-third octave band sound power level information from 6.3 Hz to 10k Hz. Furnish the data using no frequency weighting. A-weighted data is optional. Provide sound pressure levels predicted for the WES(s) in combination and at full operation and at maximum sound power output for all areas where the predictions indicate LAeq levels of 30 dBA and above. The same area shall be used for reporting the predicted LCeq levels. Contour lines shall be in increments of 5 dB.
Present tables with the predicted sound levels for the proposed WES(s) as LAeq and LCeq and at all octave band centers (8 Hz to 10k Hz) for distances of 500, 1000, 1500, 2000, 2500 and 5000 feet from the center of the area with the highest density of WES(s). For projects with multiple WES(s), the combined sound level impact for all WES(s) operating at full load must be estimated.
The above tables must include the impact (increased dBA and dBC (Leq) above baseline L90 background sound levels) of the WES operations on all residential and other noise sensitive receiving locations within the project boundary. To the extent possible, the tables should include the sites tested (or likely to be tested) in the background study.
Provide a contour map of the expected sound level from the new WES(s), using 5dB LAeq and LCeq increments created by the proposed WES(s) extending out to a distance of two (2) miles from the project boundary, or other distance necessary, to show the 25 LAeq and 50 LCeq boundaries.
Provide a description of the impact of the proposed sound from the WES project on the existing environment. The results should anticipate the receptor sites that will be most negatively impacted by the WES project and to the extent possible provide data for each MP that are likely to be selected in the background sound study (note the sensitive receptor MPs):
1. Report expected changes to existing sound levels for LAeq and LA90
2. Report expected changes to existing sound levels for LCeq and LC90
3. Report the expected changes to existing sound pressure levels for each of the 1/1 or 1/3 octave bands in tabular form from 8 Hz to 10k Hz.
4. Report all assumptions made in arriving at the estimate of impact, any limitations that might cause the sound levels to exceed the values of the estimate, and any conclusions reached regarding the potential effects on people living near the project area. If the effects of coherence, worst case weather, or operating conditions are not reflected in the model a discussion of how these factors could increase the predicted values is required.
5. Include an estimate of the number of hours of operation expected from the proposed WES(s) and under what conditions the WES(s) would be expected to run. Any differences from the information filed with the Application should be addressed.
Prepared for: Report on Tule Wind
Siting Wind Turbines October 28, 2008 To Prevent Health Risks From Sound Version 2.1
Post Construction Measurements should be conducted by a qualified noise consultant selected by and under the direction of the LGA. The requirements of this Appendix for Sites with Existing Wind Energy Systems shall apply
1. Within twelve months of the date when the project is fully operational, preferably within two weeks of the anniversary date of the pre-construction background sound measurements, repeat the measurements. Post-construction sound level measurements shall be taken both with all WES(s) running and with all WES(s) off except as provided in this ordinance.
2. Report post-construction measurements to the LGA using the same format as used for the background sound study.
VIII. REFERENCE Standards and ANSI S12.9 Part 3 with Required Amendments ANSI/ASA S12.9‐1993/Part 3 (R2008) ‐ American National Standard Quantities and Procedures for Description and Measurement of Environmental Sound, Part 3: Short‐Term Measurements with an Observer Present.
This standard is the second in a series of parts concerning description and measurement of outdoor environmental sound. The standard describes recommended procedures for measurement of short-term, time-average environmental sound outdoors at one or more locations in a community for environmental assessment or planning for compatible land uses and for other purposes such as demonstrating compliance with a regulation. These measurements are distinguished by the requirement to have an observer present. Sound may be produced by one or more separate, distributed sources of sound such as a highway, factory, or airport. Methods are given to correct the measured levels for the influence of background sound.
Wind Turbine Siting Acoustical Measurements ANSI S12.9 Part 3 Selected Options and Requirement Amendments
For the purposes of this ordinance specific options provided in ANSI S12.9-Part 3 (2008) shall apply with the additional following requirements to Sections in ANSI S12.9/Part 3:
5.2 background sound: Use definition (1) ‘long-term’ 5.2 long-term background sound: The L90 excludes short term background sounds 5.3 basic measurement period: Ten (10) minutes L90(10 min) 5.6 Sound Measuring Instrument: Type 1 Integrating Meter meeting ANSI S1.43 or IEC 61672-1.
The sound level meter shall cover the frequency range from 6.3 Hz to 20k Hz and simultaneously measure dBA LN and dBC LN. The instrument must also be capable of accurately measuring low-level background sounds down to 20 dBA.
6.5 Windscreen: Required 6.6(a) An anemometer accurate to ± 10% at 2m/s. to full scale accuracy. The anemometer shall be
located 1.5 to 2m above the ground and orientated to record maximum wind velocity. The maximum wind velocity, wind direction, temperature and humidity shall be recorded for each ten (10) minute sound measurement period observed within 5 m. of the measuring microphone..
7.1 Long-term background sound 7.2 Data collection Methods: Second method with observed samples to avoid contamination by
short term sounds (purpose: to avoid loss of statistical data) 8 Source(s) Data Collection: All requirements in ANSI S12.18 Method #2 precision to the extent
possible while still permitting testing of the conditions that lead to complaints. The
Prepared for: Report on Tule Wind
Siting Wind Turbines October 28, 2008 To Prevent Health Risks From Sound Version 2.1
meteorological requirements in ANSI S12.18 may not be applicable for some complaints. For sound measurements in response to a complaint, the compliance sound measurements should be made under conditions that replicate the conditions that caused the complaint without exceeding instrument and windscreen limits and tolerances.
8.1(b) Measuring microphone with windscreen shall be located 1.2m to 1.8m (1.5m preferred) above the ground and greater than 8m from large sound reflecting surface.
8.3(a) All meteorological observations required at both (not either) microphone and nearest 10m weather reporting station.
8.3(b) For a 10 minute background sound measurement to be valid the wind velocity shall be less then 2m/s (4.5 mph) measured less than 5m from the microphone. Compliance sound measurements shall be taken when winds shall be less than 4m/s at the microphone.
8.3(c) In addition to the required acoustic calibration checks, the sound measuring instrument internal noise floor, including microphone, must also be checked at the end of each series of ten minute measurements and no less frequently than once per day. Insert the microphone into the acoustic calibrator with the calibrator signal off. Record the observed dBA and dBC reading on the sound level meter to determine an approximation of the instrument self noise. Perform this test before leaving the background measurement location. This calibrator-covered microphone must demonstrate the results of this test are at least 5 dB below the immediately previous ten-minute acoustic test results, for the acoustic background data to be valid. This test is necessary to detect undesired increase in the microphone and sound level meter internal self-noise. As a precaution sound measuring instrumentation should be removed from any air-conditioned space at least an hour before use. Nighttime measurements are often performed very near the meteorological dew point. Minor moisture condensation inside a microphone or sound level meter can increase the instrument self noise and void the measured background data.
8.4 The remaining sections starting at 8.4 in ANSI S12.9 Part 3 Standard do not apply.
ANSI S12.18‐1994 (R2004) American National Standard Procedures for Outdoor Measurement of Sound Pressure Level
This American National Standard describes procedures for the measurement of sound pressure levels in the outdoor environment, considering the effects of the ground, the effects of refraction due to wind and temperature gradients, and the effects due to turbulence. This standard is focused on measurement of sound pressure levels produced by specific sources outdoors. The measured sound pressure levels can be used to calculate sound pressure levels at other distances from the source or to extrapolate to other environmental conditions or to assess compliance with regulation. This standard describes two methods to measure sound pressure levels outdoors. METHOD No. 1: general method; outlines conditions for routine measurements. METHOD No. 2: precision method; describes strict conditions for more accurate measurements. This standard assumes the measurement of A-weighted sound pressure level or time-averaged sound pressure level or octave, 1/3-octave or narrow-band sound pressure level, but does not preclude determination of other sound descriptors.
ANSI S1.43‐1997(R2007) American National Standard Specifications for Integrating Averaging Sound Level Meters
This Standard describes instruments for the measurement of frequency-weighted and time-average sound pressure levels. Optionally, sound exposure levels may be measured. This standard is consistent with the relevant requirements of ANSI S1.4-1983(R 1997) American National Standard Specification for Sound Level Meters, but specifies additional characteristics that are necessary to
Prepared for: Report on Tule Wind
Siting Wind Turbines October 28, 2008 To Prevent Health Risks From Sound Version 2.1
measure the time-average sound pressure level of steady, intermittent, fluctuating, and impulsive sounds.
ANSI S1.11‐2004 American National Standard 'Specification for Octave‐Band and Fractional‐Octave‐Band Analog and Digital Filters'
This standard provides performance requirements for analog, sampled-data, and digital implementations of band-pass filters that comprise a filter set or spectrum analyzer for acoustical measurements. It supersedes ANSI S1.11-1986 (R1998) American National Standard Specification for Octave-Band and Fractional-Octave-Band Analog and Digital Filters, and is a counterpart to International Standard IEC 61260:1995 Electroacoustics - Octave-Band and Fractional-Octave-Band Filters. Significant changes from ANSI S1.11-1986 have been adopted in order to conform to most of the specifications of IEC 61260:1995. This standard differs from IEC 61260:1995 in three ways: (1) the test methods of IEC 61260 clauses 5 is moved to an informative annex, (2) the term 'band number,' not present in IEC 61260, is used as in ANSI S1.11-1986, (3) references to American National Standards are incorporated, and (4) minor editorial and style differences are incorporated.
ANSI S1.40‐2006 American National Standard Specifications and Verification Procedures for Sound Calibrators
IEC 61400‐11
Second edition 2002-12, Amendment 1 2006-05
IEC 61400‐11
Second edition 2002-12, Amendment 1 2006-0
Wind turbine generator systems –Part 11: Acoustic noise measurement techniques
The purpose of this part of IEC 61400 is to provide a uniform methodology that will ensure consistency and accuracy in the measurement and analysis of acoustical emissions by wind turbine generator systems. The standard has been prepared with the anticipation that it would be applied by:
the wind turbine manufacturer striving to meet well defined acoustic emission performance requirements and/or a possible declaration system;
the wind turbine purchaser in specifying such performance requirements; the wind turbine operator who may be required to verify that stated, or required, acoustic
performance specifications are met for new or refurbished units; the wind turbine planner or regulator who must be able to accurately and fairly define
acoustical emission characteristics of a wind turbine in response to environmental regulations or permit requirements for new or modified installations.
This standard provides guidance in the measurement, analysis and reporting of complex acoustic emissions from wind turbine generator systems. The standard will benefit those parties involved in the manufacture, installation, planning and permitting, operation, utilization, and regulation of wind turbines. The measurement and analysis techniques recommended in this document should be applied by all parties to insure that continuing development and operation of wind turbines is carried out in an atmosphere of consistent and accurate communication relative to environmental concerns. This standard presents measurement and reporting procedures expected to provide accurate results that can be replicated by others.
End of Measurement Procedure
Prepared for: Report on Tule Wind
1
VIII. Noise‐Con 2008 Paper
Dearborn, Michigan
NOISE‐CON 2008
2008 July 28‐31
Simple guidelines for siting wind turbines to prevent health risks30 By:
Richard R. James, INCEE‐Coustic Solutions rickjames@e‐coustic.com
Revision: 2.131
Industrial scale wind turbines are a familiar part of the landscape in Europe, U.K. and other parts of the world. In the U.S., however, similar industrial scale wind energy developments are just beginning operation. The presence of industrial wind projects will increase dramatically over the next few years given the push by the Federal and state governments to promote renewable energy sources through tax incentives and other forms of economic and political support. States and local governments in the U.S. are promoting what appear to be lenient rules for how industrial wind farms can be located in communities, which are predominantly rural and often very quiet. Studies already completed and currently in progress describe significant health effects associated with living in the vicinity of industrial grade wind turbines. This paper reviews sound studies conducted by consultants for governments, the wind turbine owner, or the local residents for a number of sites with known health or annoyance problems. The purpose is to determine if a set of simple guidelines using dBA and dBC sound levels can serve as the ‘safe’ siting guidelines. Findings of the review and recommendations for sound limits will be presented. A discussion of how the proposed limits would have affected the existing sites where people have demonstrated pathologies apparently related to wind turbine sound will also be presented.
Background A relatively new source of community noise is spreading rapidly across the rural U.S. countryside. Industrial grade wind turbines, a common sight in many European countries, are now being promoted by Federal and state governments as the way to minimize coal powered electrical energy and its effects on global warming. But, the initial developments using the newer 1.5 to 3 MWatt wind turbines here in the U.S. has also led to numerous complaints from
Permission is hereby granted for any person to reproduce a fractional part of any paper herein provided that permission is obtained from its author(s) and credit is given to the author(s) and the INCE Noise‐con 2008 Proceedings. Notification to INCE/USA is also required.
31 The criteria table at the end of this paper and portions of the narrative have been revised to reflect our current understanding of how to specify the sound limits with less ambiguity and to use the new format for presenting them.
Prepared for: Report on Tule Wind
SIMPLE GUIDELINES FOR SITING WIND TURBINES TO PREVENT HEALTH RISKS VER: 2.1
2
residents who find themselves no longer in the quiet rural communities they were living in before the wind turbine developments went on-line. Questions have been raised about whether the current siting guidelines being used in the U.S. are sufficiently protective for the people living closest to the developments. Research being conducted into the health issues using data from established wind turbine developments is beginning to appear that supports the possibility there is a basis for the health concerns. Other research into the computer modeling and other methods used for determining the layout of the industrial wind turbine developments and the distances from residents in the adjacent communities are showing that the output of the models should not be considered accurate enough to be used as the sole basis for making the siting decisions.
The authors have reviewed a number of noise studies conducted in response to community complaints for wind energy systems sited in Europe, Canada, and the U.S. to determine if additional criteria are needed for establishing safe limits for industrial wind turbine sound immissions in rural communities. In several cases, the residents who filed the complaints have been included in studies by medical researchers who are investigating the potential health risks associated with living near industrial grade wind turbines 365 days a year. These studies were also reviewed by the authors to help in identifying what factors need to be considered in setting criteria for ‘safe’ sound limits at receiving properties. Due to concerns about medical privacy, details of these studies are not discussed in this paper. Current standards used in the U.S. and in most other parts of the world rely on not-to-exceed dBA sound levels, such as 50 dBA, or on not-to-exceed limits based on the pre-construction background sound level plus an adder (e.g. L90A + 5 dBA).
Our review covered the community noise studies performed in response to complaints, research on health issues related to wind turbine noise, critiques of noise studies performed by consultants working for the wind developer, and research/technical papers on wind turbine sound immissions and related topics. The papers are listed in Tables 1-4.
Table 1-List of Studies Related to Complaints
Resource Systems Engineering, Sound Level Study – Ambient & Operations Sound Level Monitoring, Maine Department of Environmental Protection Order No. L-21635-26-A-N, June 2007
ESS Group, Inc., Draft Environmental Impact Statement For The Dutch Hill Wind Power Project – Town of Cohocton, NY, November 2006
David M. Hessler, Environmental Sound Survey and Noise Impact Assessment – Noble Wethersfield Wind park – Towns of Wethersfield and Eagle NY For: Noble Environmental Power, LLC January 2007
George Hessler, “Report Number 101006-1, Noise Assessment Jordanville Wind Power Project,” October 2006
HGC Engineering, “Environmental Noise Assessment Pubnico Point Wind Farm, Nova Scotia, Natural Resources Canada Contract NRCAN-06-0046,” August 23, 2006
John I. Walker, Sound Quality Monitoring, East Point, Prince Edward Island” by Jacques Whitford, Consultants for Prince Edward Island Energy Corporation, May 28, 2007
Prepared for: Report on Tule Wind
SIMPLE GUIDELINES FOR SITING WIND TURBINES TO PREVENT HEALTH RISKS VER: 2.1
3
Table 2- List of Studies related to Health
Nina Pierpont, “Wind Turbine Syndrome – Abstract” from draft article and personal conversations. www.ninapierpont.com
Nina Pierpont, “Letter from Dr. Pierpont to a resident of Ontario, Canada, re: Wind Turbine Syndrome,” Autumn 2007
Amanda Harry, “Wind Turbine Noise and Health” (2007)
Barbara J. Frey and Peter J. Hadden, “Noise Radiation from Wind Turbines Installed Near Homes, Effects on Health” (2007)
Eja Pedersen, “Human response to wind turbine noise – Perception, annoyance and moderating factors, Occupational and Environmental Medicine,” The Sahlgrenska Academy, Gotenborg 2007
Robin Phipps, “In the Matter of Moturimu Wind Farm Application, Palmerston North, Australia,” March 2007
WHO European Centre for Environment and Health, Bonn Office, “Report on the third meeting on night noise guidelines,” April 2005
Table 3-List of Studies that review Siting Impact Statements
Richard H. Bolton, “Evaluation of Environmental Noise Analysis for ‘Jordanville Wind Power Project,’” December 14, 2006 Rev 3.
Clifford P. Schneider, “Accuracy of Model Predictions and the Effects of Atmospheric Stability on Wind Turbine Noise at the Maple Ridge Wind Power Facility,” Lowville, NY – 2007
Table 4-List of Research and Technical papers included in review process
Anthony L. Rogers, James F. Manwell, Sally Wright, “Wind Turbine Acoustic Noise,” Renewable Energy Research Laboratory, Dept. of ME and IE, U of Mass, Amherst, amended June 2006
ISO. 1996. Acoustics - Attenuation of sound during propagation outdoors - Part 2: General method of calculation. International Organization of Standardization. ISO 9613-2. p. 18.
G.P. van den Berg, “The Sounds of High Winds – the effect of atmospheric stability on wind turbine sound and microphone noise,” Ph.D. thesis, 2006
Fritz van den Berg, “Wind Profiles over Complex Terrain,” Proceedings of Second International Meeting on Wind Turbine Noise, Lyons, France, Sept. 2007
William K. G. Palmer, “Uncloaking the Nature of Wind Turbines-Using the Science of Meteorology,” Proceedings of Second International Meeting on Wind Turbine Noise, Lyons, France, Sept. 2007
Soren Vase Legarth, “Auralization and Assessment of Annoyance from Wind Turbines,” Proceedings of Second International Meeting on Wind Turbine Noise, Lyons, France, Sept. 2007
Julian T. and Jane Davis, “Living with aerodynamic modulation, low frequency vibration
Prepared for: Report on Tule Wind
SIMPLE GUIDELINES FOR SITING WIND TURBINES TO PREVENT HEALTH RISKS VER: 2.1
4
and sleep deprivation - how wind turbines inappropriately placed can act collectively and destroy rural quietitude,” Proceedings of Second International Meeting on Wind Turbine Noise, Lyons, France, Sept. 2007
James D. Barnes, “A Variety of Wind Turbine Noise Regulations in the United States - 2007,” Proceedings of Second International Meeting on Wind Turbine Noise, Lyons, France, Sept. 2007
M. Schwartz and D. Elliott, Wind Shear Characteristics at Central Plains Tall Towers, NREL 2006
Discussion After reviewing the materials in the tables; we have arrived at our current understanding of wind turbine noise and its impact on the host community and its residents. The review showed that some residents living as far as 3 km (two (2) miles) from a wind farm complain of sleep disturbance from the noise. Many residents living one-tenth this distance (300 m. or 1000 feet) from a wind farm are experiencing major sleep disruption and other serious medical problems from nighttime wind turbine noise. The peculiar acoustic characteristics of wind turbine noise immissions cause the sounds heard at the receiving properties to be more annoying and troublesome than the more familiar noise from traffic and industrial factories. Limits used for these other community noise sources do not appear to be appropriate for siting industrial wind turbines. The residents who are annoyed by wind turbine noise complain of the approximately one (1) second repetitive swoosh-boom-swoosh-boom sound of the turbine blades and “low frequency” noise. It is not apparent to these authors whether the complaints that refer to “low frequency” noise are about the audible low frequency part of the swoosh-boom sound, the one hertz amplitude modulation of the swoosh-boom sound, or some combination of both acoustic phenomena.
To assist in understanding the issues at hand, the authors developed the ‘conceptual’ graph for industrial wind turbine sound shown in Figure 1. This graph shows the data from one of the complaint sites plotted against the sound immission spectra for a modern 2.5 MWatt wind turbine; Young’s threshold of perception for the 10% most sensitive population (ISO 0266); and a spectrum obtained for a rural community during a three hour, 20 minute test from 11:45 pm until 3:05 am on a windless June evening in near Ubly, Michigan a quiet rural community located in central Huron County. (Also called: Michigan’s “Thumb.”) It is worth noting that this rural community demonstrates how quiet a rural community can be when located at a distance from industry, highways, and airport related noise emitters.
During our review we posed a number of questions to ourselves related to what we were learning. The questions (italics) and our answers are:
Do National or International or local community Noise Standards for siting wind turbines near dwellings address the low frequency portion of the wind turbine’s sound immissions?32 No! State and Local governments are in the process of establishing wind farm noise limits and/or wind turbine
32 Emissions refer to acoustic energy from the ‘viewpoint’ of the sound emitter, while immissions refer to
acoustic energy from the viewpoint of the receiver.
Prepared for: Report on Tule Wind
SIMPLE GUIDELINES FOR SITING WIND TURBINES TO PREVENT HEALTH RISKS VER: 2.1
5
setbacks from nearby residents, but the standards incorrectly presume that limits based on dBA levels are sufficient to protect the residents.
Do wind farm developers have noise limit criteria and/or wind turbine setback criteria that apply to nearby residents? Yes! But the Wind Industry recommended residential wind turbine noise levels (typically 50-55 dBA) are too high for the quiet nature of the rural communities and may be unsafe for the nearest residents. An additional concern is that some of the methods for implementing pre-construction computer models may predict sound levels that are too low. These two factors combined can lead to post-construction complaints and health risks.
Are all residents living near wind farms equally affected by wind turbine noise? No, children, people with pre-existing medical conditions, especially sleep disorders, and the elderly are generally the most susceptible. Some people are unaffected while some nearby neighbors develop serious health effects caused by exposure to the same wind turbine noise.
How does wind turbine noise impact nearby residents? Initially, the most common problem is chronic sleep deprivation during nighttime. According to the medical research documents, this may develop into far more serious physical and psychological problems
What are the technical options for reducing wind turbine noise immission at residences? There are only two options: 1) increase the distance between source and receiver, and/or 2) reduce the source sound power immission. Either solution is incompatible with the objective of the wind farm developer to maximize the wind power electrical generation within the land available.
Figure 1‐Generalized Sound Spectra vs. perception and rural community L90A background 1/3 octave SPL
Is wind turbine noise at a residence much more annoying than traffic noise? Yes, researchers have found that “Wind turbine noise was perceived by about 85% of the respondents even when the calculated A-weighted SPL were as low as 35.0–37.5 dB. This could be due to the presence of
Prepared for: Report on Tule Wind
SIMPLE GUIDELINES FOR SITING WIND TURBINES TO PREVENT HEALTH RISKS VER: 2.1
6
amplitude modulation in the noise, making it easy to detect and difficult to mask by ambient noise.” [JASA 116(6), December 2004, pgs 3460-3470, “Perception and annoyance due to wind turbine noise-a dose-relationship” Eja Pedersen and Kerstin Persson Waye, Dept of Environmental Medicine, Goteborg University, Sweden]
Why do wind turbine noise immissions of only 35 dBA disturb sleep at night? This issue is now being studied by the medical profession. The affected residents complain of the middle to high frequency swooshing sounds of the rotating turbine blades at a constant repetitive rate of about 1 hertz plus low frequency noise. The amplitude modulation of the swooshing sound changes continuously. The short time interval between the blade’s swooshing sounds described by residents as sometimes having a thump or low frequency banging sound that varies in amplitude up to 10 dBA. This may be a result of phase changes between turbine emissions, turbulence, or an operational mode.. The assumptions about wall and window attenuation being 15 dBA or more may not be sufficiently protective considering the relatively high amplitude of the wind turbine’s low frequency immission spectra.
What are the typical wind farm noise immission criteria or standards? Limits are not consistent and may vary even within a particular country. Example criteria include: Australia-the lower of 35 dBA or L90 + 5 dBA, Denmark-40 dBA, France L90 + 3 (night) and L90 + 5 (day), Germany-40 dBA, Holland-40 dBA, United Kingdom-40 dBA (day) and 43 dBA (night) or L90 + 5 dBA, Illinois-55 dBA (day) and 51 dBA (night), Wisconsin-50 dBA and Michigan-55 dBA. Note: Illinois statewide limits are expressed only in nine contiguous octave frequency bands and no mention of A-weighting for the hourly leq limits. Typically, wind turbine noise just meeting the octave band limits would read 5 dB below the energy sum of the nine octave bands after applying A-weighting. So the Illinois limits are approximately 50 dBA (daytime 7 AM to 10 PM) and 46 dBA at night, assuming a wind farm is a Class C Property Line Noise Source.
What is a reasonable wind farm sound immission limit to protect the health of residences? We are proposing an immission limit of 35 dBA or L90A + 5 dBA whichever is lower and also a C-weighted criteria to address the impacted resident’s complaints of wind turbine low frequency noise: For the proposed criteria the dBC sound level at a receiving property shall not exceed L90A + 20dB. In other words, the dBC operating immission limit shall not be more than 20 dB above the measured dBA (L90A) pre-construction nighttime background sound level. A maximum not-to-exceed limit of 50 dBC is also proposed.
Why should the dBC immission limit not be permitted to be more than 20 dB above the background measured L90A? The World Health Organization and others have determined a sound emitter’s noise that results in a difference between the dBC and dBA value greater than 20 dB will be an annoying low frequency issue.
Is not L90A the minimum dBA background noise level? This is not exactly correct. The L90 is the statistical descriptor representing the quietest 10% of the time. It may be understood as the sounds one hears when there are no nearby or short-term sounds from man-made or natural sources. It excludes sounds that are not part of the soundscape during all seasons. It is very important to establish the statistical average background noise environment outside a potentially impacted residence during the quietest (10 pm to 4 am) sleeping hours of the night. This nighttime sleep disturbance has generated the majority of the wind farm noise complaints throughout the world. The basis for a community’s wind turbine sound immission limits would be the minimum 10 minute nighttime L90A plus 5 dB for the time period of 10 pm to 7 am. This would become the Nighttime Immission Limits for the proposed wind farm. This can be accomplished with one or several ten (10) minute measurements during any night when the
Prepared for: Report on Tule Wind
SIMPLE GUIDELINES FOR SITING WIND TURBINES TO PREVENT HEALTH RISKS VER: 2.1
7
atmosphere is classified stable with a light wind from the area of the proposed wind farm. The Daytime Limits (7 am to 7 pm) could be set 10 dB above the minimum nighttime L90A measured noise, but the nighttime criteria will always be the limiting sound levels.
A nearby wind farm meeting these noise immission criteria will be clearly audible to the residents occasionally during nighttime and daytime. Compliance with this noise standard would be determined by repeating the initial nighttime minimum nighttime L90A tests and adding the dBC (LeqC) noise measurement with the turbines on and off. If the nighttime background noise level (turbines off) was found to be slightly higher than the measured background prior to the wind farm installation, then the results with the turbines on must be corrected to determine compliance with the pre-turbine established sound limits.
The common method used for establishing the background sound level at a proposed wind farm used in many of the studies in Table 1 was to use unattended noise monitors to record hundreds of ten (10) minute measurements to obtain a statistically significant sample over varying wind conditions or a period of weeks. The measured results for daytime and nighttime are combined to determine the statically average wind noise as a function of wind velocity measured at a height of ten (10) meters. This provides an enormous amount of data but the results have little relationship to the wind turbine sound immission or turbine noise impact in nearby residents. The purpose of this exhaustive exercise often only demonstrates how much noise is generated by the wind. In some cases it appears that the data is used to ‘prove’ that the wind noise masks the turbine’s sound immissions.
The most glaring failure of this argument occurs during the frequent nighttime condition of a stable atmosphere. Then, the wind turbines operate at full or near full power and noise output while the wind at ground level is calm and the background noise level is low. This is the condition of maximum turbine noise impact on nearby residents. It is the condition which most directly causes chronic sleep disruption. Furthermore, the measurement methodology is usually faulty, as much of the wind noise measured by unattended sound monitors is the pseudo-wind noise generated by failure of the microphone’s windscreen. This results in totally erroneous background sound levels being used for permitting and siting decisions. (See studies in Table 3, esp. Van den Berg)
Are there additional noise data to be recorded for a pre-wind turbine noise survey near selected dwellings? Yes, The measuring sound level meter(s) need document the LAeq , LA10, LA90 and LCeq , LC10, LC90 sound levels plus start time & date for each 10 minute sample. The L10 results will be utilized to help validate that conditions were appropriate for measuring the L90 long term background sound levels. For example, on a quiet night one would expect LA10 to be less than 10 dB higher than the LA90 long-term background sound level. On a windy night or day the difference may be more than 20 dB. There is a requirement for measurement of the wind velocity near the sound measurement microphone continuously throughout each ten (10) minute recorded noise sample. The ten (10) minute average of the wind speed near the microphone shall not exceed 2 m/s (4.5 mph) and the maximum wind speed for operational tests shall not exceed 4 m/s (9 mph). It is strongly recommended that observed samples be used for these tests.
Is there a need to record weather data during the background noise recording survey? One weather monitor is required at the proposed wind farm on the side nearest the residents. The weather station sensors are at standard ten (10) meter height above ground. It is critical the weather be recorded every ten (10) minutes synchronized with the clocks in the sound level recorders without ambiguity in the start and end time of each ten (10) minute period. The weather station should record wind speed and direction, temperature, humidity and rain.
Prepared for: Report on Tule Wind
SIMPLE GUIDELINES FOR SITING WIND TURBINES TO PREVENT HEALTH RISKS VER: 2.1
8
Why do Canada and some other countries base the permitted wind turbine noise immission limits on the operational wind velocity at the 10m height wind speed instead of a maximum dBA or LA90 + 5 dBA immission level? First, it appears that the wind turbine industry will take advantage of every opportunity to elevate the maximum permitted noise immission level to reduce the setback distance from the nearby dwellings. Including wind as a masking source in the criteria is one method for elevating the permissible limits. Indeed the background noise level does increase with surface wind speed. When it does occur, it can be argued that the increased wind noise provides some masking of the wind farm turbine noise emission. However, in the middle of the night when the atmosphere is defined as stable (no vertical flow from surface heat radiation) the layers of the lower atmosphere can separate and permit wind velocities at the turbine hubs to be 2 to 4 times the wind velocity at the 10m high wind monitor but remain near calm at ground level. The result is the wind turbines can be operating at or close to full capacity while it is very quiet outside the nearby dwellings.
This is the heart of the wind turbine noise “problem” for residents within 3 km (approx. two miles) of a wind farm. When the turbines are producing the sound from operation it is quietest outside the surrounding homes. The PhD thesis of P.G. van den Berg “The Sounds of High Winds” is very enlightening on this issue. See also the letter by John Harrison in Ontario “On Wind Turbine Guidelines.”
What sound monitor measurements would be needed for enforcement of the wind turbine sound ordinance? A similar sound and wind 10 minute series of measurements would be repeated at the pre-wind farm location nearest the resident registering the wind turbine noise complaint, with and without the operation of the wind turbines. An independent acoustics expert should be retained who reports to the County Board or other responsible governing body. This independent acoustics expert shall be responsible for all the acoustic measurements including instrumentation setup, calibration and interpretation of recorded results. An independent acoustical consultant shall also perform all pre-turbine background noise measurements and interpretation of results to establish the Nighttime (and Daytime if applicable) industrial wind turbine sound immission limits. At present the acoustical consultants are retained by, and work directly for, the wind farm developer.
This presents a serious problem with conflict of interest on the part of the consultant. The wind farm developer would like to show the significant amount of wind noise that is present to mask the sounds of the wind turbine immissions. The wind farm impacted community would like to know that wind turbine noise will be only barely perceptible and then only occasionally during the night or daytime.
Is frequency analysis required either during pre-wind farm background survey or for compliance measurements? Normally one-third octave or narrower band analysis would only be required if there is a complaint of tones immission from the wind farm.
Proposed Sound Limits The simple fact that so many residents complain of low frequency noise from wind turbines is clear evidence that the single A-weighted (dBA) noise descriptor used in most jurisdictions for siting turbines is not adequate. The only other simple audio frequency weighting that is standardized and available on all sound level meters is C-weighting or dBC. A standard sound level meter set to measure dBA is increasingly less sensitive to low frequency below 500 Hz (one octave above middle-C). The same sound level meter set to measure dBC is equally sensitive to all frequencies above 32 Hz (lowest note on grand piano). It is well accepted that dBC readings
Prepared for: Report on Tule Wind
SIMPLE GUIDELINES FOR SITING WIND TURBINES TO PREVENT HEALTH RISKS VER: 2.1
9
are more predictive of perceptual loudness than dBA readings if low frequency sounds are significant.
We are proposing to use the commonly accepted dBA criteria that is based on the pre-existing background sound levels plus a 5 dB allowance for the wind turbine’s immissions (e.g. L90A +5) for the audible sounds from wind turbines. In addition, to address the lower frequencies that are not considered in A-weighted measurements we are proposing to add limits based on dBC. The Proposed Sound Limits are presented in the text box at the end of this paper.
For the current industrial grade wind turbines in the 1.5 to 3 MWatt range, the addition of the dBC requirement will result in an increased distance between wind turbines and the nearby residents. For the generalized graphs shown in Figure 1, the distances would need to be approximately double the current distance. This will result in setbacks in the range of 1 km or greater for the current generation of wind turbines if they are to be located in rural areas where the L90A background sound levels are 30 dBA or lower. When no man-made sounds are audible they can even be under 20 dBA. In areas with higher background sound levels, turbines could be located somewhat closer, but still at a distance greater than the 305 m (1000 ft.) or less setbacks commonly seen in U.S. based wind turbine standards set by many states and used for wind turbine developments.
Prepared for: Report on Tule Wind
SIMPLE GUIDELINES FOR SITING WIND TURBINES TO PREVENT HEALTH RISKS VER: 2.1
10
1. Establishing Long-Term Background Noise Level a. Instrumentation: ANSI or IEC Type 1 Precision Integrating Sound Level Meter plus meteorological
instruments to measure wind velocity, temperature and humidity near the sound measuring microphone. Measurement procedures must meet ANSI S12.9, Part 3.
b. Measurement location(s): Nearest property line(s) from proposed wind turbines representative of all non‐participating residential property within 2.0 miles.
c. Time of measurements and prevailing weather: The atmosphere must be classified as stable with no vertical heat flow to cause air mixing. Stable conditions occur in the evening and middle of the night with a clear sky and very little wind near the surface. Sound measurements are only valid when the measured wind speed at the microphone does not exceed 2 m/s (4.5 mph).
d. Long‐Term Background sound measurements: All data recording shall be a series of contiguous ten (10) minute measurements. The measurement objective is to determine the quietest ten minute period at each location of interest. Nighttime test periods are preferred unless daytime conditions are quieter. The following data shall be recorded simultaneously for each ten (10) minute measurement period: dBA data includes LA90, LA10, LAeq and dBC data includes LC90, LC10, and LCeq. The maximum wind speed at the microphone during the ten minutes, a single measurement of temperature and humidity at the microphone for each new location or each hour whichever is oftener shall also be recorded. A ten (10) minute measurement contains valid data provided: Both LA10 minus LA90 and LC10 minus LC90 are not greater than 10 dB and the maximum wind speed at the microphone did not exceed 2 m/s during the same ten (10) minute period as the acoustic data.
2. Wind Turbine Sound Immission Limits
No wind turbine or group of turbines shall be located so as to cause wind turbine sound immission at any location on non‐participating property containing a residence in excess of the limits in the following table:
Table of Not‐To‐Exceed Property Line Sound Immission Limits 1
Criteria Condition dBA dBC
A Immission above pre‐construction background:
LAeq =LA90 + 5 LCeq = LC90 +5
B Maximum immission: 35 LAeq 55 LCeq for quiet
2 rural environment60 LCeq for rural‐suburban environment
C Immission spectra imbalance LCeq (immission) minus (LA90 (background)+5) 20 dB
D Prominent tone penalty: 5 dB 5 dB
Notes
1 Each Test is independent and exceedances of any test establishes non‐compliance Sound “immission” is the wind turbine noise emission as received at a property
2 A “Quiet rural environment” is a location 2 miles from a state road or other major transportation artery without high traffic volume during otherwise quiet periods of the day or night.
3 Prominent tone as defined in IEC 61400‐11. This Standard is not to be used for any other purpose.
1 Procedures provided in Section 7. Measurement Procedures (Appendix to Ordinance) of the most recent version of “The How To Guide To Siting Wind Turbines To Prevent Health Risks From Sound” by Kamperman and James apply to this table.
3. Wind Farm Noise Compliance Testing All of the measurements outlined above in 1. Establishing the Long‐Term Background Noise Level must be repeated to determine compliance with 2. Wind Turbine Sound Immission Limits. The compliance test location is to be the pre‐turbine background noise measurement location nearest to the home of the complainant in line with the wind farm and nearer to the wind farm. The time of day for the testing and the wind farm operating conditions plus wind speed and direction must replicate the conditions that generated the complaint. Procedures of ANSI S12.9‐ Part 3 apply as amended. Instrumentation limits for wind and other factors must be recognized and followed. The authors have based these criteria, procedures, and language on their current understanding of wind turbine sound emissions, land‐use compatibility, and the effects of sound on health. However, use of the following, in part or total, by any party is strictly voluntary and the user assumes all risks. Please seek professional assistance in applying the recommendations of this document to any specific community or WES development. Prepared for: Report on Tule Wind
Infrasound The Hidden Annoyance of Industrial Wind Turbines
BY
PROFESSOR CLAUDE RENARD*
NAVAL COLLEGE & MILITARY SCHOOL OF THE FLEET (FRANCE)
*Specialist in submarine acoustics & “acoustic quieting”
(NO DATE)
English trans. by Elizabeth Chafer (2/28/11)
Edited by Calvin Luther Martin, PhD (2/28/11)
Introduction This article is an updated summary of a lecture given by the author in 1997, entitled "Infrasound: Quiet, Pernicious Pollution." At that time, it was given in response to concerns arising from the marketing in Sweden of a non-lethal infrasound weapon designed for riot control, the recognition of “Sick Building Syndrome” (SBS) caused by infrasound emitted by air conditioning systems, and the increase in the number of wind turbine installations in Brittany. The rural areas of this region have a high population density, and the nuisances caused by infrasound would be as great or even greater than that of the visual pollution or radio interference preventing television reception! In the weeks that followed, several points of information came to light, revealing that, in the first Airbus 340 planes, the setting of the pressurisation was such that it caused infrasound that affected the passengers. It was also disclosed that a "Euralille" high-rise block in Lille (France) had been evacuated due to vibrations on the 5th floor. Reports revealed that 644 agents of the new "Archet" hospital in Nice (France) had suffered from nausea and headaches. Some had even had to be admitted to the hospital. In 2005, there were accounts of similar health problems at the "Nord" hospital in Marseille.
C. Renard Infrasound: The hidden annoyance of Industrial Wind Turbines Page 1 of 7
This article has now been published in response to some good news: The (French) Académie de Médecine has recommended to the (French) government that the construction of wind turbines exceeding 2.5 MW at less than 1500 m from dwellings should from now be suspended. This is good news, but not very good news. The writer is concerned that this venerable institution has only taken into account the ”annoyance” caused by audible noise (hissing of the blades, the noise from the gearings in the multiplier), and not the annoyance caused by infrasound. In view of this omission, the aim of this article is to inform the public about these inaudible but harmful noises. In this article, the word “decibel” (dB) is not used, as it can lead to confusion. In fact, acoustic engineers use a different decibel than underwater acoustic engineers, because it relates to a different power reference level. In addition, they use decibels with an “A” weighting (dBA) as well as weighting for average sound levels over a given period of time: Leq dBA. (Infrasound is not included [in A-weighting].)
Longitudinal Waves Humans are sensitive to longitudinal waves. These waves have their point of origin in a homogenous medium (air or water) as soon as there is a variation in pressure at any point in this medium. The wave is therefore characterised by its frequency N in Hertz (Hz), which corresponds to the number of times per second the pressure oscillates at any given point. The amplitude of this wave corresponds to the value of the increase or decrease in pressure expressed in Pascals (Pa). The wave has the effect of compressing and then expanding the medium gradually in the direction of propagation. The molecules of the medium vibrate on the spot and gradually, through elasticity, induce vibration of the adjacent molecules in the direction of propagation of the wave. This is why these waves are also described as elastic waves. The speed of the propagation of energy C in metres per second (m/s) (proportional to the square of the amplitude) is about 340 m/s in ambient air, and does not vary as a function of the static atmospheric pressure. In water, the speed is about 1500 m/s. The amplitude of a longitudinal wave decreases as it gets farther away from its source, inversely to the distance D (in metres) travelled. This is divergence attenuation (the wave is spherical). A decay exponential for fading must be added to this attenuation, with the distance D multiplied by a coefficient specific to the medium and proportional to the square of the frequency N. Another property of these waves is that they can be reflected at the point of change of medium, for example when moving from air to water. They can also be refracted if the medium changes the speed C of the waves during their propagation, for example where there is a localised change in air temperature. The ray paths can be curved where there are temperature gradients. In addition, if there is a current in the medium of propagation, such as wind in the atmosphere, for example, ray paths propagating in an upwind direction will be lifted from the ground and curved up towards the zenith, and those propagated downwind will be driven towards the ground and curved down towards the nadir. When longitudinal waves reach a human body and are able to cause the eardrums to vibrate significantly, they can be heard if the frequency N is between 20 and 20,000 Hz.
C. Renard Infrasound: The hidden annoyance of Industrial Wind Turbines Page 2 of 7
Audible Sound Waves It follows that audible sound waves are longitudinal waves that have frequencies between 20 Hz and 20 kHz. The human ear starts to perceive them over and above a threshold of hearing. This threshold depends on the frequency of the wave. The ear is surprisingly sensitive between 1 kHz and 3 kHz, as it can hear sounds of 2 / 100,000ths Pascal, whereas normal atmospheric pressure is 101,500 Pa. On the other hand, at 50 Hz the threshold is only 2 / 1,000ths Pascal. The ear is therefore 100 times less sensitive at this frequency. During a conversation, the sound level is about 1 / 100ths to 2 / 100ths Pascal between 100 Hz and 4 kHz. In addition, if the amplitude of the sound intensifies, over and above a certain level known as the threshold of pain, people suffer very sharp pain in the head and nausea. If a person stays in this environment, lesions to the cochlea in the ear will appear. This threshold is around 60 Pa. It is possible to stay in a noisy environment without ear protection for a certain period of time a day without getting lesions, provided the intensity of the sound is lower than the threshold of pain. For example, at 2 Pa, it would be for 2 hours a day, and at 1 Pa for 4 hours a day. In less noisy environments, people can suffer from noise annoyance which prevents them from sleeping, from thinking, or concentrating on a task, etc. In practice, it is not believed there is annoyance under 5 / 1,000ths Pascal. (This is the field of psychoacoustic studies.) Just as humans are almost blind, in that they don't see ultraviolet or infrared light, they are also nearly deaf, as they do not hear ultrasounds (N > 20 kHz)—unlike dogs and bats, for example—or infrasound (N < 20 Hz), which is used by certain animals such as elephants and giraffes for communicating. As we have seen, the attenuation of sounds is proportional to the square of their frequency N. Ultrasounds will not be dealt with in the rest of this article, since they are very quickly absorbed or reflected. However, this is not the case in respect to infrasound, which is also perceived by humans, though in a different way.
The Propagation of Infrasound An audible wave of 1 kHz will be attenuated 10,000 times more than an infrasonic wave of 10 Hz under the same conditions of emission and reception, and following the same propagation path. The wave length L in metres (m), being the distance separating two successive peaks during the propagation of a wave, is equal to the ratio of the speed C in m/s to the frequency N in Hz, ( L = C / N). For infrasound having a frequency N of less than 20 Hz, this wavelength is much longer than that of audible sounds, and diffraction by obstacles such as trees and bushes is greatly reduced. The same applies to additional attenuation due to atmospheric turbulence. For this reason, infrasound propagates over considerable distances and will therefore be affected by slow variations in the physical parameters of the medium. For example, in an adiabatic atmosphere where the temperature drops by 9.8° Celsius for every 1,000 m of altitude, an infrasonic ray emitted
C. Renard Infrasound: The hidden annoyance of Industrial Wind Turbines Page 3 of 7
horizontally will curve up towards the zenith and will be capable of going over an obstacle of one metre at a distance of 316 m from its source, or an obstacle 10 m high at a distance of 1,000 m. It could also go over a hill 100 m high situated at a distance of 3.16 km. Generally speaking, infrasonic rays move upwards until they reach an altitude where they encounter either a temperature gradient which inverts (inversion zone) or a wind gradient. In both instances, as we have already seen, the ray path will curve downwards towards the ground (or the sea), where it can be reflected very easily despite the vegetation (or the waves), and gradually rebound. In this way, infrasound is guided far away from its source, which explains why, for example, the explosion of Mount St. Helens (USA) on 19th May 1980 was felt all over the world. It is also the way in which elephants are able to communicate with each other over tens of kilometres thanks to the temperature inversion zone that forms from sunset to sunrise. Knowing that infrasound can be perceived at great intensity even when it is far from the source that produced it, we are now going to look at the perturbations they can cause to humans who cannot hear them.
The Physiological Effects of Infrasound It was a Frenchman, V. Gavreau, who, during the Sixties, first reported human health problems caused by exposure to infrasound. The symptoms resembled seasickness, accompanied by headache, nausea, and dizziness which led to “deep nervous fatigue.” He was also the first to mention eye problems and the impossibility of concentrating on a task. In the Seventies, a Dane, P.V. Brüel, manufacturer of acoustic metrology equipment, showed that symptoms were felt after only 5 minutes of exposure to infrasound of an amplitude of 1 Pa and a frequency of 12 Hz. He also demonstrated by measurements taken in an estate car travelling at a speed of 100 km/h that the level of infrasound which was almost constantly at 1 Pa between 4 and 16 Hz contributed to “car sickness.” In addition, P.V. Brüel carried out some very interesting measurements of the level of infrasound on the top floor of a sixteen-floor high-rise block when there was a fairly strong wind blowing. The infrasound reached 6 Pa at 1 Hz and dropped to 0.2 Pa at 16 Hz. The signal spectrum showed resonances at 4 Hz (2 Pa), 8 Hz (1 Pa) and 12 Hz (0.4 Pa). In the USA in 1975, D.L. Johnson defined the threshold levels above which people feel unwell : 0.2 Pa at 20 Hz, 0.6 Pa at 10 Hz, 2 Pa at 5 Hz, 20 Pa at 2 Hz, and 60 Pa at 1 Hz. In Japan in 1991, H.Takigawa reported that infrasound of 1 Pa between 3 and 7 Hz had an influence on the vestibule of the ear and lead to ocular reflexes (nystagmus), spinal reflexes (tremors), and autonomic reflexes (dyspnoea). In 1991, the Russian, B. Fraiman, noted the effect of infrasound of 2 Pa on blood pressure, which confirmed the problems of diastolic pressure mentioned in 1974 by Borredon (1 Pa = the pressure of a column of water 10 cm high).
C. Renard Infrasound: The hidden annoyance of Industrial Wind Turbines Page 4 of 7
Sources of Infrasound Other than infrasound emitted by animals, the sources of infrasound are either natural or manmade. Periodic natural sources are caused by the volcanic eruption, supersonic booms, storms and fractures such as during earthquakes, avalanches and calving of icebergs from glaciers. Other transient sources are caused by tornadoes (whirlwinds), the flow of wind over natural (mountains) or man-made obstacles (wind turbines, bridges, towers, churches, houses). Oceans and waterfalls are continual natural sources. There are other man-made sources, such as internal combustion engines and ventilation or air conditioning installations. The remainder of this article deals with sources which are mainly due to noises of turbulent flow of air on obstacles. This causes the formation of Von Karman swirling paths (called Von Karman vortices), which are made up of a series of eddies swirling alternately in one direction and then the other. They emit both audible and inaudible sound, which is either jet sounds for which the frequency N (in Hz) is given by the Krüger and Marsherer formula: N = (0.055), V/E, where V is the wind speed (in m/s) and E the distance (in m) between the two obstacles limiting the jet, or trail sounds on an obstacle having a thickness or diameter E, for which the emission frequency is given by the Strouhal and Krüger formula: N = (0.2), V/E. In the latter case, the eddies are alternately emitted by one edge and then the other of this long obstacle. Depending on the speed of the wind, these phenomena can become audible and cause the whistling emitted by windows that are badly closed, or by electric wires or cables. The infrasound produced by wind turbines (the tower and the rotor blades) falls under this category. M.L. Legerton's team (Inter-Noise 96) showed that, at 100 m from a wind turbine, the infrasound had peaks of 1.4 Pa emitted every 0.65 sec. as the rotor blades passed the wind turbine tower. Today, the audible sound produced by the blade tips is considerably less, due to improved blade design. The infrasound produced by centrifugal or axial fans is caused by the “flow separation” (pumping) phenomenon. This causes pressure variations which are amplified by the pipe work.
Conclusion The information given above is enough to understand that it is better not to be exposed to infrasound which propagates far from its point of origin and against which it is impossible to protect oneself due to the long wavelengths. Those most affected by exposure to infrasound are rural inhabitants living in proximity to wind turbines, and those working in air-conditioned offices.
C. Renard Infrasound: The hidden annoyance of Industrial Wind Turbines Page 5 of 7
The people in the former category are exposed to the infrasound 24 hours a day, whereas people in the latter category are only exposed to infrasound 6 hours a day. The most important issue is therefore to know what intensity of infrasound can be tolerated without inconvenience over these periods of time. We do not have the answer to this question. During the Seventies, many studies were carried out by army physiologists to find out how long it was possible to stay in a tank where the level of infrasound is in the region of 20 Pa, in the engine room of a ship where there can be levels exceeding 100 Pa at 5 to 20 Hz, and in a space capsule where the level is between 400 and 600 Pa at 1 to 20 Hz. Their problem was in fact to know how long military personnel could carry out their duties under these conditions. The results were kept secret. In 1976, Von Gierke put forward a limit of 20 Pa between 1 and 20 Hz below which a human being could be exposed for 24 hours without harmful effects. In fact, those who live near waterfalls or by the sea, where levels of infrasound can vary from 1 to several Pascals, can confirm this. It would seem that infrasonic noise that does not contain particular frequencies (white noise) is easier to tolerate. It is therefore better to concentrate attention on the power spectral density expressed in Pascals squared per Hertz. In 1993, B.J. Fraimann measured on the Pacific coast a power density G varying 1/N with the frequency signature of the atmospheric turbulence. It is clear that there is wide scope for further research, which we would like the appropriate government ministries to initiate. In addition, research on the effects of infrasound on animals needs to be carried out. In the meantime, the application of the Precautionary Principle would be appropriate, in particular with respect to the decision to install wind turbines.
Bibliography F. Cordier «Le mystère de l’hôpital Nord de Marseille» Le Quotidien du Medecin du 1er Septembre 2005. M. Rossi «Electro-acoustique» Dunod éditeur 1986 p 34 et p 115 à 148. «Lemonde des sons» Dossier hors série de pour la Science, Juillet/Octobre 2001. V. Gavreau, R. Condrat & H. Saul «Infra-sons: Générateurs, détecteurs, propriétés physiques, effets biologiques» Acoustica vol 17, no. 1, 1966, p 1 à 10. V. Bruel & H.P. Olensen «Mesures infrasonores» Technical Review Brüel & Kjaer No. 3, 1973, p 14 à 26. D.L. JOHNSON «Auditory and physiological effects of infrasound» Internoise 75 , 1975, p 475 à 482. H. Takigawa, H. Sakamoto & M. Murata «Effects of infrasound on vestibular function» Journal of Sound and Vibration, vol 151 (3), 1991, p 455 à 460.
C. Renard Infrasound: The hidden annoyance of Industrial Wind Turbines Page 6 of 7
B.J. Fraiman, A.N. Ivannikov, V.I. Pavlov «The experimental investigations of low frequency noises in the everyday life» Internoise 93 , 1993, p 1157 à 1160. P. Borredon, J. Nathie «Effets physiologiques observés chez l’homme exposé à des niveaux infrasonores de 130 dB» In L. Pimonov, ed., Colloque international sur les Infrasons, C.N.R.S. Paris 1974, p 59 à 84. A. Foch «Acoustique» Collection Armand Colin, 1947, p 184 à 187. M.L. Legerton et al. «Low frequency noise & vibration levels at modern wind farms» Internoise 96, 1996, p 460 à 462. William T.D. Cory «Le décollement tournant et le choix des ventilateurs pour les unités de traitement d’air» Acoustique & Techniques No. 8, Janvier 1997, p 11 à 15. H.E. von Gierke, C.W. Nixon «Effects of intense infrasound on man» in Infrasound and Low Frequency Vibration, ed. W. Tempest, Londres et New-York: Academic Press, 1976.
C. Renard Infrasound: The hidden annoyance of Industrial Wind Turbines Page 7 of 7
4. The reported effects of being subjected to long and frequent periods of pulsating low-frequency noise, particularly at night, are not difficult to imagine, they include: depression, chronic stress, migraines, nausea, exhaustion, anger, dizziness, memory loss and cognitive difficulties - children and the elderly are especially affected by the latter. This constellation of symptoms has been given the clinical term, “wind-turbine syndrome”. Measured physiologic consequences of exposure to noise during sleep include cardiac arrhythmias, increased heart rate and blood pressure (WHO, 1999, Guidelines for Community Noise, pp 42-44). The WHO guidelines also note that noise with low-frequency components is particularly bothersome in areas with low background noise (p.46), i.e. the countryside, where large wind-turbine plants are multiplying in Ontario. 5. By far the most complete, accurate and sobering summary of the public-health concerns surrounding the negligent siting of wind turbines is contained in a report by Frey and Hadden - ” Noise Radiation from Wind Turbines Installed near Homes: Effects on Health” (Feb., 2007 - available at www.windturbinenoisehealthhumanrights.com), which should be mandatory reading for all involved in the regulation of wind turbines. 6. “The Darmstadt Manifesto” (1998), endorsed by over 100 German university professors, described the health concerns that were emerging with wind turbines in Germany ten years ago: “More and more people are describing their lives as unbearable when they are directly exposed to the acoustic and optical effects of wind farms. There are reports of people being signed off sick and unfit for work, there are a growing number of complaints about symptoms such as pulse irregularities and states of anxiety which are known from the effects of infrasound.” 7. The situation has not improved. Nina Pierpont, M.D, PhD, has studied the health effects of wind turbines and treated patients suffering from them in New York State, where she practices. In a letter to Kim Isles of Chatham, Ontario, dated February 16, 2008, Dr. Pierpont had this to say: “Yes, there are indeed medical problems caused by noise and vibration from current, upwind, three-bladed industrial wind turbines. I am in the process of preparing a paper for publication in a medical journal documenting the consistency of these problems from family to family, the study subjects being a collection of families in several countries who have been driven from their homes by problems with sleep, headaches, tinnitus, equilibrium, concentration, memory, learning, mood, and child behavior - problems which started when the turbines went into operation and which resolved when the family is away from the turbines. These problems all occur in proximity to recently built industrial turbines, put into operation in 2005, 2006, and 2007……Based on my 3½ years of researching Wind Turbine Syndrome (WTS), including interviews with scores of people around the world who clearly suffer from WTS, it is my strong clinical recommendation (in line with the French National Academy of Medicine) that industrial wind turbines be