Tule Wind Project Draft Noise Analysis Report Log No. 09‐21‐001 Lead Agency: County of San Diego, Department of Planning and Land Use Contact: Patrick Brown 5201 Ruffin Road, Suite B San Diego, CA 92123 (800) 411‐0017 Preparer: HDR Engineering, Inc. 701 Xenia Avenue, Suite 600 Minneapolis, MN 55416 (763) 591‐5400 Reviewed by: Ldn Consulting, Inc. 446 Crestcourt Lane Fallbrook, CA 92028 Project Proponent: Iberdrola Renewables, Inc. 1125 NW Couch St., Suite 700 Portland, OR 97209 Contact: Jeffrey Durocher October 2010
Transcript
Tule Wind Project
Draft Noise Analysis Report
Log No. 09‐21‐001
Lead Agency:
County of San Diego, Department of Planning and Land Use Contact: Patrick Brown 5201 Ruffin Road, Suite B San Diego, CA 92123
(800) 411‐0017
Preparer:
HDR Engineering, Inc. 701 Xenia Avenue, Suite 600 Minneapolis, MN 55416
(763) 591‐5400
Reviewed by:
Ldn Consulting, Inc. 446 Crestcourt Lane Fallbrook, CA 92028
Project Proponent:
Iberdrola Renewables, Inc. 1125 NW Couch St., Suite 700
Portland, OR 97209 Contact: Jeffrey Durocher
October 2010
Noise Analysis
Tule Wind Project Page i October 2010 Iberdrola Renewables, Inc.
Appendices Appendix A Noise Monitoring Results by Location Appendix B Cadna‐A Input/Output Data Appendix C Transformer Noise Source Calculation Appendix D Cadna‐A Model Validation Appendix E Vehicular Classification Counts Appendix F San Diego County Noise Ordinance
Noise Analysis
Tule Wind Project Page ii October 2010 Iberdrola Renewables, Inc.
List of Figures Figure 1. Project Location .................................................................................................... 41 Figure 2. Ambient Noise Monitoring Locations ................................................................... 43 Figure 3. Average Daytime Leq(h) Noise Levels for Residential Environments ................... 45 Figure 4. Average Nighttime Leq(h) Noise Levels for Residential Environments ................ 45 Figure 5. Roadways and Noise Sensitive Land Uses ............................................................ 47 Figure 6. Turbine Layout and Property Boundary Identification ......................................... 49 Figure 7. San Diego County Noise Ordinance Zones............................................................ 51 Figure 8. GE 1.5 XLE Noise Contours .................................................................................... 53 Figure 9. GE dBC Noise Contours ......................................................................................... 55 Figure 10. 138 kV Transmission Line Corona Noise ............................................................... 57 Figure 11. Rough Grading and Turbine Tower Base Construction Limits .............................. 59 Figure 12. Underground Utility Construction Limits .............................................................. 61 Figure 13. Turbine Tower Construction Limits ...................................................................... 63 Figure 14. Transmission Construction Limits ......................................................................... 65 Figure 15. Roadway Construction Temporary Noise Impacts Limits ..................................... 67 Figure 16. Transmission Line Construction Temporary Noise Impacts ................................. 69
List of Tables Table 1. Existing Noise Level Summary ................................................................................ 6 Table 2. Comparison of Hand Calculations and Cadna‐A Results......................................... 8 Table 3. Existing Traffic Volumes ........................................................................................ 10 Table 4. Project Construction‐Related Traffic Volumes ..................................................... 10 Table 5. Construction Traffic Noise Summary .................................................................... 11 Table 6. Spectral Noise Emissions Data–GE 1.5XLE ............................................................ 13 Table 7. Wind Turbine Noise Analysis ................................................................................ 14 Table 8. Summary of the Wind Turbine Noise Analysis ..................................................... 14 Table 9. Proposed Substation Airborne Noise Analysis ...................................................... 16 Table 10. Alternate Substation Airborne Noise Analysis ...................................................... 17 Table 11. Proposed Action ‐ Property Line Airborne Noise Analysis .................................... 19 Table 12. Summary of the Cumulative Noise Analysis – Proposed Action .......................... 19 Table 13. Alternate Substation ‐ Property Line Airborne Noise Analysis ............................. 20 Table 14. Summary of the Cumulative Noise Analysis – Alternate Substation .................... 21 Table 15. Equipment Typically Used for Wind Facility Construction ................................... 22 Table 16. Equipment–Rough Grading and Tower Base Construction .................................. 23 Table 17. Equipment–Underground Utility Construction .................................................... 24 Table 18. Equipment–Tower Construction ........................................................................... 24 Table 19. Equipment–138 kV Transmission Line Construction ............................................ 25 Table 20. Equipment–Batch Plant Operation ....................................................................... 25 Table 21. Construction Noise Level Results .......................................................................... 27 Table 22. Vibration Induced Damage Impact Threshold ...................................................... 33 Table 23. Vibration Levels at a Distance of 15 Feet ............................................................. 34
Noise Analysis
Tule Wind Project Page iii October 2010 Iberdrola Renewables, Inc.
CADNA‐A MODEL VALIDATION ................................................................................................ 1
APPENDIX D 1
CADNA‐A MODEL VALIDATION ................................................................................................ 1
APPENDIX F 1
SAN DIEGO COUNTY NOISE ORDINANCE .................................................................................. 1
APPENDIX F 1
SAN DIEGO COUNTY NOISE ORDINANCE .................................................................................. 1
CHAPTER 4. NOISE ABATEMENT AND CONTROL* .................................................................... 1
Noise Analysis
Tule Wind Project Page v October 2010 Iberdrola Renewables, Inc.
Acronyms and Abbreviations BLM Bureau of Land Management BMP Best Management Practice CA/T Central Artery Tunnel CNEL Community noise equivalent level CSLC California State Lands Commission dB Decibels dBA A‐weighted decibels dBC Decibels related to the carrier HDR HDR Engineering, Inc. HVTL High Voltage Transmission Line I‐8 Interstate 8 ISO International Standards Organization kV kilovolt Leq Equivalent‐continuous sound level Leq(h) Hourly equivalent noise levels Lmax Maximum level during a single noise event MW megawatt NSLU Noise sensitive land uses O&M Operations and maintenance OEM Original equipment manufacturer RCNM Roadway Construction Noise Model ROW Right‐of‐way RTA Real‐time analyzer SDG&E San Diego Gas and Electric STC Sound Transmission Coefficient TL Transmission loss U.F. Usage Factor VdB Velocity in decibels
Noise Analysis
Tule Wind Project Page vi October 2010 Iberdrola Renewables, Inc.
This page intentionally left blank.
Noise Analysis
Tule Wind Project Page 1 October 2010 Iberdrola Renewables, Inc.
EXECUTIVE SUMMARY (REPORT SUMMARY)
Pacific Wind Development LLC, a wholly owned subsidiary of Iberdrola Renewables, Inc. (Iberdrola Renewables) is proposing to construct and operate the Tule Wind Project located near Boulevard, California. The proposed project will consist of wind turbines, an overhead and underground electrical collection system and transmission line, a project collector substation, an operations and maintenance building, transportation haul routes and access roads, a concrete batch plant , a parking area, laydown (staging) areas, and meteorological towers. The majority of the project would be built on federal Bureau of Land Management (BLM) lands although turbines and other project components are also proposed on lands owned by the Ewiiaapaayp Reservation, Manzanita and Campo Reservation (access only), as well as lands owned by the California State Land Commission (CSLC) and privately‐owned lands under the jurisdiction of the County of San Diego. The Tule Wind Project will consist of the following project components:
• Up to 134 wind turbines, ranging in size between 328 and 492 feet in height, to produce 200 megawatts (MW) of electricity;
• A 34.5 kilovolt (kV) overhead and underground collector cable system linking each turbine to the next and to the project collector substation.
• A 138 kV overhead transmission line will run south from the project collector substation to be interconnected with the San Diego Gas and Electric (SDG&E) proposed Rebuilt Boulevard Substation;
• A 5‐acre collector substation site and 5‐acre operation and maintenance (O&M) building site;
• Access roads between turbines, as well as improvements to existing roadways and new roadways to accommodate construction and delivery of equipment;
• A temporary batch plant for construction located on a 5 acre area;
• A 10‐acre parking area;
• Nineteen 2‐acre temporary laydown areas; and
• Two permanent meteorological towers. The maximum build‐out of the project allows for up to 134 1.5 MW turbines or a minimum of 67 3.0 MW turbines. Turbines with a smaller output can be spaced closer together, whereas turbines with a larger output require larger spacing. The current turbine locations analyzed in the noise report include 97 wind turbines on BLM land, 17 turbines on Tribal lands, 7 turbines on State lands, and 13 turbines on private land. HDR Engineering, Inc. (HDR) performed a noise analysis in support of the proposed project. HDR performed six, 24‐hour noise measurements at locations that are representative of the rural
Noise Analysis
Tule Wind Project Page 2 October 2010 Iberdrola Renewables, Inc.
portions of the project area. Operations project‐related noise was evaluated using the Cadna‐A model. Additional noise analyses include vehicular traffic noise, construction‐related noise and construction related vibration. Results of all noise and vibration analysis were used to determine compliance with the San Diego County Code of Regulatory Ordinances and the San Diego County Noise Element. Results of the noise and vibration analysis are as follows:
• Based on 24‐hour monitoring data, the existing community noise equivalent level (CNEL) within the project area ranged from 45 to 54 A‐weighted decibels (dBA). Ambient hourly equivalent noise levels (Leq(h)) in the project area ranged from 32 dBA Leq to 58 dBA equivalent‐continuous sound level (Leq). The quietest hours typically took place during evening and nighttime. Peak noise levels in the project area typically occurred during early morning rush‐hour.
• Project‐related construction traffic noise is not predicted to cause any significant airborne‐noise impacts at any noise sensitive land uses (NSLU) near the project‐area.
• Wind turbine project‐related noise levels varied from 33 dBA to 49 dBA Leq(h) at adjacent property boundaries.
• Transmission line noise will comply with the County’s noise ordinance requirements at the 100‐foot right‐of‐way.
• Cumulative operational noise levels utilizing the proposed substation varied from 33 dBA to 49 dBA Leq(h) at adjacent property boundaries.
Determination of impact for operation project‐related noise was performed in compliance with San Diego County Code of Regulatory Ordinances Section 36.404. Cumulative operational project‐related noise utilizing the proposed substation, without mitigation, is predicted to exceed nighttime allowable noise limits at two noise‐sensitive receptors in the project‐area. Project‐related noise is not predicted to cause significant daytime airborne‐noise impacts. Operational noise will be mitigated to comply with the San Diego County Code of Regulatory Ordinances Section 36.404 prior to construction. Mitigation of operational noise that may be considered in final design include revising turbine layout, nighttime curtailment of select turbines, utilizing an alternate turbine manufacturer and implementation of noise reduction technology. Upon final design, approval of project layout, and prior to construction, a noise report will be finalized to demonstrate compliance with the San Diego County Code of Regulatory Ordinances Section 36.404. Construction noise levels for turbine staging and placement will be within acceptable noise generation levels established by the County Noise Ordinance Sections 36.409 and 36.410. Construction noise for new haul roads and the construction of the 138 kV transmission line are expected to produce short term noise impacts at residences closest to these construction rights‐of‐way (ROWs). Implementation of Best Management Practices (BMPs) will help reduce
Noise Analysis
Tule Wind Project Page 3 October 2010 Iberdrola Renewables, Inc.
and in some cases eliminate temporary construction‐related noise impacts. The BMPs include but are not limited to the following: maintaining original equipment manufacturer (OEM) mufflers or better, ensuring all equipment is in good operating condition, and limiting hours of operation. Where temporary noise impacts cannot be reduced or eliminated utilizing BMPs, appropriate mitigation and noise reduction techniques will be identified and a site specific mitigation plan will be prepared. Mitigation measures may include the use of temporary noise barriers. Construction could include activities that may temporarily expose people to ground‐borne vibration or ground‐borne noise. Blasting may be required in some areas for the construction of the turbine foundations. If required, construction blasting will be managed with the preparation of a blasting plan for each site. The blasting plan will include identification of planned blasting locations, a description of the planned blasting methods, an inventory of vulnerable structures potentially affected by the planned blasting, and calculations to determine the area affected by the planned blasting.
Noise Analysis
Tule Wind Project Page 4 October 2010 Iberdrola Renewables, Inc.
1.0 INTRODUCTION
HDR Engineering, Inc. (HDR) performed a noise analysis in support of the proposed project. HDR performed six, 24‐hour noise measurements at locations that are representative of the rural portions of the project area. Operations project‐related noise was evaluated using the Cadna‐A model. Additional noise analyses include vehicular traffic noise, construction‐related noise and construction related vibration. Results of all noise and vibration analysis were used to determine compliance with the San Diego County Code of Regulatory Ordinances and the San Diego County Noise Element.
1.1 Project Description
Pacific Wind Development LLC, a wholly owned subsidiary of Iberdrola Renewables, Inc. (Iberdrola Renewables) is proposing to construct and operate the Tule Wind Project located north of Boulevard, California. The proposed wind generation project will consist of up to 134 wind turbines, consisting of 1.5 to 3.0 megawatt (MW) turbines between 328 and 492 feet in height, and will produce 200 MW of electricity. The project will include turbines, access roads between turbines, new access roadways and improvements to existing roadways to accommodate construction delivery equipment, a 138 kV overhead transmission line, 34.5 kV overhead and underground collector cable system linking the turbines to the project collector substation, an operation and maintenance (O&M) facility, and two meteorological towers. From the project collector substation, an overhead 138 kV transmission line will run south to be interconnected with the proposed San Diego Gas and Electric (SDG&E) Rebuilt Boulevard Substation. Iberdrola Renewables will construct and operate the portion of the transmission line from the project collector substation to the Rebuilt Boulevard Substation. Upon initiation of the project, it is anticipated that the construction phase will be completed over a period of 18 to 24 months.
1.2 Environmental Settings and Existing Conditions
Settings and Locations
The Tule Wind Project is located in the eastern portion of San Diego County, approximately 50 miles east of the City of San Diego and 90 miles west of Arizona. The project area lies in the In‐Ko Pah Mountains adjacent to the Tecate Divide and south of Cleveland National Forest. The topography of the area varies from gently to moderately sloping. Elevations range from 3,600 feet above sea level to 5,600 feet above sea level. The project is located on lands administered by the Bureau of Land Management (BLM), Tribal lands, lands owned by the California State Lands Commission (CSLC), and private lands under the jurisdiction of San Diego County. Figure 1 displays the general location and project area.
Noise Analysis
Tule Wind Project Page 5 October 2010 Iberdrola Renewables, Inc.
Existing Noise Conditions
HDR performed unattended measurements to determine existing noise levels at six sites throughout the project area. Monitoring locations were selected by reviewing digital aerial photographs of the project area and identifying areas whose ambient acoustical environment appeared to be representative of the project area. The noise monitoring data represents the ambient acoustic environment of rural areas in San Diego County that were generally expected to have quiet ambient daytime and nighttime noise levels. The noise monitoring locations are shown in Figure 2. A Real‐Time Analyzer (RTA) was used to collect noise monitoring data every hour for a continuous 24‐hour period at each monitoring location. Six unattended 24‐hour measurements were taken in the project area during the week of January 11, 2010. Each hour, the RTAs stored the hourly noise level, peak noise level and minimum noise level on an A‐weighted scale. The ambient acoustic environment in the project area is dominated by noise from traffic on Interstate 8 (I‐8), vehicular traffic on local roads, wind, and occasional aircraft overflights. Ambient sound level surveys throughout the project area demonstrated an acoustical environment comparable with a typical rural setting. The measured sound levels varied from 45 to 54 A‐weighted decibels (dBA) on a CNEL basis. Typical daytime noise levels, as stated in the Handbook of Noise Control by Cyril Harris, for various residential areas are represented on Figure 3. Figure 3 demonstrates that daytime outdoor noise levels throughout the project area are comparable to small town or secluded residential environment. Measured daytime sound levels for the project area averaged 48 dBA. Typical nighttime noise levels, for various residential areas are represented in Figure 4. Figure 4 demonstrates that outdoor noise levels throughout the project area are comparable to a suburban environmental setting. Measured nighttime sound levels for the project area averaged 42 dBA on an hourly Leq basis. Table 1 summarizes the average daytime and nighttime sound levels measured at noise‐sensitive receptors in the Tule Wind Project area. Appendix A presents detailed noise monitoring results for all monitoring sites. Ambient noise levels in the project area ranged from 32 dBA Leq to 58 dBA Leq. The quietest hours typically took place during the evening and nighttime. Peak noise levels in the project area typically occurred during early morning rush‐hour.
Noise Analysis
Tule Wind Project Page 6 October 2010 Iberdrola Renewables, Inc.
Average Lowest Highest Average Lowest Highest Cottonwood Campground 42 32 49 45 32 55 Lark Canyon Campground 44 33 49 34 33 35 Home #28 51 45 55 45 39 51 Home #42 50 34 56 44 34 49 Home #47 49 35 54 43 32 53 Rough Acres Ranch 52 33 58 43 33 49 Average Ambient Noise Level for Tule Project Area
48 37 54 42 34 49
1.3 Methodology and Equipment
Noise Measuring Methodology and Procedures
HDR performed 24‐hour noise measurements at six locations in the project area using Type I, Larson‐Davis Model 824 RTAs. The analyzers were configured to store data every hour. Noise Modeling Software
HDR used Cadna‐A, an acoustical analysis software package designed for evaluating environmental noise from stationary and mobile sources, was used to evaluate project‐related noise. Cadna‐A is a three‐dimensional noise model based on International Standards Organization (ISO) 9613, “Attenuation of Sound during Propagation Outdoors,” adopted by the ISO in 1996. This standard provides a widely‐accepted engineering method for the calculation of outdoor environmental noise levels from sources of known sound emission. HDR modeled project collector substation noise and wind turbine generated noise using Cadna‐A. In the assessment of wind turbine generated noise HDR modeled 134 GE 1.5 XLE turbines (the noise sources) and calculated project‐related noise levels at 47 NSLUs in the project area. Coordinates for the turbine and residence locations were obtained from the geographic information system (GIS) database created for this project. The entire project area including terrain data was modeled in this analysis. All ground was modeled as acoustically reflective and wind conditions were treated as moderately downwind in all directions. Detailed Cadna‐A data inputs and outputs are presented in Appendix B. HDR modeled transformer noise from the proposed and alternate substations using Cadna‐A. Project substation project‐related noise levels were calculated at 47 NSLUs in the project area. Similar to wind turbine generated noise all ground was modeled as acoustically reflective and wind conditions were treated as moderately downwind in all directions. The reference sound power level for transformer noise was calculated based on the typical surface area and rating of
Noise Analysis
Tule Wind Project Page 7 October 2010 Iberdrola Renewables, Inc.
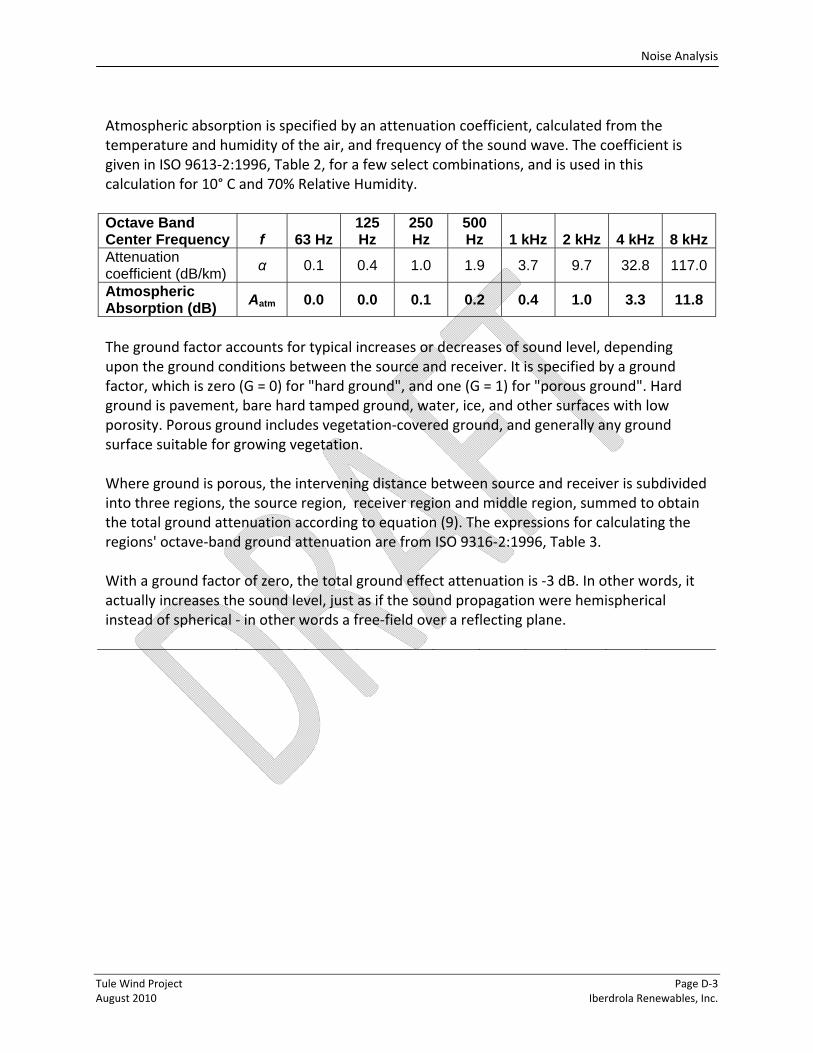
the transformer. Detailed calculations used to identify the transformer sound power level are presented in Appendix C. Detailed Cadna‐A data inputs and outputs are presented in Appendix B. Cadna‐A uses as the basis for its models the ISO standard 9613‐2, "Acoustics ‐ Attenuation of sound during propagation outdoors ‐ Part 2: General method of calculation." This standard describes methods and formulae for predicting sound levels at a distance from sound sources. This is based on certain definable variables which describe the sound propagation characteristics between the source and receiver. Appendix D includes a spreadsheet/hand‐calculation according to the 1996 First Edition of ISO 9613‐2, and compares it to the results of a Cadna‐A model with the same parameters. Results are discussed here. The result of the model calculation is the equivalent continuous downwind octave‐band sound pressure level at the receiver location. The independent variables are the source sound power emission level and several propagation attenuation terms, including geometric divergence, atmospheric absorption, and ground effect. The source sound power emission level is determined by measurement or other calculation. In this case it is the same input sound power spectrum as was used in the Cadna‐A model. Geometric divergence is the spreading of sound energy from the source – in other words, the further away from the noise source the more spread out spherically the sound energy becomes. Atmospheric absorption is specified by an attenuation coefficient, determined from the temperature and humidity of the air, and frequency of the sound wave. Typically higher frequencies are more impacted by higher humidity and therefore attenuated in those conditions. The ground factor accounts for typical increases or decreases of sound level, depending upon the ground conditions, between the source and receiver. "Hard ground" has a ground factor of “0” and is pavement, bare hard tamped ground, water, ice, and other surfaces with low porosity. Higher ground factor values define porous ground which includes vegetation‐covered ground, and generally any ground surface suitable for growing vegetation. For this analysis and in the modeling all ground factors were set at “0” for the most conservative results. Comparing the levels from this spreadsheet/hand calculation to a congruent Cadna‐A model shows a difference of one‐tenth of a dB in most bands, and not more than two‐tenths of a dB in any band as shown in Table 2.
Noise Analysis
Tule Wind Project Page 8 October 2010 Iberdrola Renewables, Inc.
Table 2. Comparison of Hand Calculations and Cadna‐A Results
Octave Band Center Frequency 63 Hz 125 Hz 250 Hz 500 Hz 1 kHz 2 kHz 4 kHz 8 kHz
Spreadsheet Calculation Levels at Receiver
35.3 44.1 49.6 51.2 49.3 44.4 35.2 25.0
Cadna‐A Model Levels at Receiver
35.4 44.2 49.7 51.3 49.4 44.5 35.4 24.8
Spreadsheet Calculation Overall A‐weighted Level, at Receiver
55.7 dBA
Cadna‐A Model Overall A‐weighted Level at Receiver 55.8 dBA
Noise Formulas and Calculations Refer to Table 2. Comparison of Hand Calculations and Cadna‐A Results, for detailed calculations and Cadna‐A model validation.
Noise Analysis
Tule Wind Project Page 9 October 2010 Iberdrola Renewables, Inc.
2.0 NOISE SENSITIVE LAND USES AFFECTED BY AIRBORNE NOISE
2.1 Guidelines for Determination of Significance
Determination of significance, for airborne noise caused by construction‐related vehicular traffic, was performed in compliance with Section 4b of the San Diego County Noise Element. Significant noise impacts would occur if project implementation would result in noise levels in excess of any of the following:
• Exterior noise levels above 60 dBA, on a CNEL basis, at any noise sensitive land use. • An increase in noise level of 10 dB, on a CNEL basis, over pre‐existing noise conditions.
2.2 Potential Noise Impacts
The proposed Tule Wind Project is located in the eastern portion of San Diego County, approximately 50 miles east of the City of San Diego. The project is proposing existing roadway improvement and new roadways to facilitate the delivery of large equipment and cranes during project construction. The roadways and access roads that will carry project‐related traffic span across federal, state and private lands. HDR modeled project‐related noise from four roadway segments and access roads in the project area. Predicted noise levels at NSLUs are compared with Section 4b of the San Diego County Noise Element and the Guidelines for Determining Significance for Noise to determine compliance. Figure 5 depicts access roads and roadway improvements associated with the Tule Wind Project. Primary access to the western portion of the project area will be provided from the I‐8 Crestwood Road exit and will run north‐south through the Campo and Manzanita Indian Reservations. Primary access to the eastern portion of the project area will be provided from the I‐8 Ribbonwood Road exit and McCain Valley Road. Crestwood Road, Ribbonwood Road, McCain Valley Road, and Old Highway 80 are anticipated to carry the majority of construction‐related traffic. Only those NSLUs that are on privately owned lands, under the County jurisdiction are being considered in the traffic noise analysis. Potential Build‐out Noise Conditions and Impacts
Determination of significance, for project‐related airborne noise caused by vehicular traffic, was performed in compliance with Section 4b of the San Diego County Noise Element. Existing and project‐related construction traffic was modeled using the TNM Lookup Program Version 2.5. Existing noise sources in the area include traffic noise from I‐8, local vehicular traffic, and occasional aircraft overflights. Table 3 lists the existing average daily traffic volumes and vehicular mix of the primary roadways in the project area.
Noise Analysis
Tule Wind Project Page 10 October 2010 Iberdrola Renewables, Inc.
Table 3. Existing Traffic Volumes
Roadway ADT
Speed Limit (mph)
Vehicular Mix (%)
Auto Medium Truck
Heavy Truck Bus Motorcycle
Crestwood Road 1060 35 93 4 3 0 0 McCain Valley Road 110 35 73 25 1 1 0 Old Highway 80 990 35 84 15 1 0 0 Ribbonwood Road (north of I‐8)
270 35 86 10 2 0 2
Ribbonwood Road (I‐8 to Old Highway 80)
1230 55 83 13 3 0 1
Source: “Full Traffic Impact Study: Tule Wind Project.” LLG Ref. 3‐09‐1935. March 26 2010.
The existing vehicular mix on Ribbonwood Road, McCain Valley Road, and Old Highway 80 are based on vehicular classification counts taken on December 15, 2009. On roadway segments where vehicular classification counts were unavailable a conservative mix of 93 percent cars, 4 percent medium trucks and 3 percent heavy trucks was assumed. Detailed vehicular classification counts are provided in Appendix E. Table 4 lists the construction project‐related average daily traffic on the primary construction haul roads.
Crestwood Road 390 35 148 242 Ribbonwood Road (north of I‐8) 195 351 74 121 Ribbonwood Road (I‐8 to Old Highway 80) 65 55 25 40 McCain Valley Road 65 35 25 40 Old Highway 80 65 351 25 40
Source: “Full Traffic Impact Study: Tule Wind Project”. LLG Ref. 3‐09‐1935. March 26 2010. 1 Based on maximum anticipated travel speed.
Modeled vehicular mixes for all project‐related traffic are based on a traffic distribution of 62 percent heavy trucks and 38 percent cars. HDR modeled existing, construction project‐related, and existing + project‐related average daily traffic volumes and calculated the community noise exposure levels at the nearest NSLUs within 1/2 mile of the project area. Table 5 summarizes the results of the traffic noise analysis.
Noise Analysis
Tule Wind Project Page 11 October 2010 Iberdrola Renewables, Inc.
Table 5. Construction Traffic Noise Summary
Receiver
Distance to Nearest NSLU,
feet
Existing Exterior CNEL,
dBA
Project Exterior CNEL,
dBA Existing + Project
Increase Over
Existing Crestwood Road 4,000 No Noise Sensitive Receptors within 1/2 Mile McCain Valley Road 100 52.9 56.3 58.0 5.1 Old Highway 80 45 64.7 60.1 66.0 1.3 Ribbonwood Road (North of I‐8)
250 51.1 57.0 58.0 6.9
Ribbonwood Road (South of I‐8)
80 68.3 60.7 69 0.7
Existing traffic related noise levels in the area range from 51 to 68 dBA on a CNEL basis. Project‐related noise levels, during the peak of project construction, range from 56 to 61 dBA on a CNEL basis. Predicted increases in noise level, due to project‐related traffic, ranges from less than 1 dBA to 7 dBA on a CNEL basis at NSLUs. Direct roadway noise impacts would be considered significant if the project increases noise levels for a noise sensitive land use above the County of San Diego 60 dBA CNEL standard, except if the existing noise level without the project is 58 dBA or greater, a 3 dBA increase is allowed up to the maximum permitted by the Federal Highway Administration Standards or if the project permanently increase the noise levels by 10 dBA CNEL. The project creates an increase of more than 3.0 dBA CNEL along a segment of McCain Valley Road and Ribbonwood Road as can be seen in Table 5, but does not increase the existing noise levels above the 60 dBA CNEL County threshold to noise sensitive areas. Based on the modeled results shown in Table 5 above, no traffic‐related roadway impacts are anticipated due to construction project‐related traffic. NSLUs currently approaching or exceeding the 60 dBA CNEL benchmark such as Old Highway 80 and Ribbonwood Road south of I‐8, were assessed to determine if the project created a 3 dBA increase over existing noise levels. As shown in Table 5 above, project‐related increases over existing noise levels along Old Highway 80 and Ribbonwood Road south of I‐8 were 1 dBA and less than 1 dBA, respectively. During normal operations the Tule Project is expected to generate minimal traffic on access roads; therefore, only vehicular trips during the construction phase were modeled. Post‐construction the project is expected to be supported by up to 12 permanent full‐time employees. It is anticipated that operational traffic would occur during normal business hours. Design Considerations and Mitigation Measures
Construction project‐related transportation noise is not predicted to cause any significant airborne‐noise impacts at any NSLU near the project‐area thus no mitigation is required.
Noise Analysis
Tule Wind Project Page 12 October 2010 Iberdrola Renewables, Inc.
3.0 PROJECT‐GENERATED AIRBORNE NOISE
3.1 Guidelines for the Determination of Significance
Determination of significance of airborne noise at property boundaries was performed in compliance with San Diego County Code of Regulatory Ordinances Section 36.404. The portion of the project site under San Diego County land use jurisdiction is zoned as general agriculture, open space and general rural. Significant noise impacts would occur if project implementation would result in noise levels in excess of any of the following:
• 50 dBA Leq during the hours of 7 a.m. to 10 p.m. • 45 dBA Leq during the hours of 10 p.m. to 7 a.m.
Determination of significance of construction noise at property boundaries was performed in compliance with San Diego County Code of Regulatory Ordinances Section 36.409 and 36.410. The portion of the project site under San Diego County land use jurisdiction is zoned as general agriculture, open space and general rural. Significant noise impacts would occur if project implementation would result in noise levels in excess of any of the following:
• 75 dBA Leq averaged over an 8‐hour period between the hours of 7 a.m. and 7 p.m.
• 1‐minute maximum sound level of 82 dBA for 25 percent of the minutes within in a measurement period
The proposed Tule Wind Project is located in the eastern portion of San Diego County, approximately 50 miles east of the City of San Diego. The project area spans across federal, state and private lands. The majority of the Project is located on lands administered by the BLM; therefore, only those NSLUs that are on privately owned lands, under the County jurisdiction are being considered in the noise analysis. Potential Build‐Out Noise Conditions without Mitigation
The project proposes to construct up to 134 wind turbines, ranging in size between 328 and 492 feet in height, to produce 200 MW of electricity. Wind turbine generators are the primary source of operational noise. Additional noise sources include vehicular noise from access roads, substation noise and coronal discharge noise from transmission lines. Wind Turbine Generators When in motion wind turbines emit a perceptible sound. This sound is generated from the wind turbine at points near the hub or nacelle, 80 meters in the air, from the blade tips as they rotate, and transformers near ground level. The analysis accounted for all noise generating elements associated with wind turbines.
Noise Analysis
Tule Wind Project Page 13 October 2010 Iberdrola Renewables, Inc.
The level of this noise varies with the speed of the turbine blades, meteorological conditions, terrain and the distance of the listener from the turbine. Due to technological advancements, (i.e., upwind versus downwind rotor placement, low‐noise gearboxes, insulated nacelles, pitch‐control rotors, vibration‐isolated mechanical equipment, and variable‐speed operation) noise levels for today’s generation of wind turbines are lower than that of their predecessors. Furthermore, the character of noise produced is more broadband in nature and therefore largely absent of tones (whines, whirrs, buzzes, or hums), as well as impulsive (or thumping) qualities. All residences within 1 mile of the project area were modeled in the wind turbine noise analysis. NSLUs in the area, under the County jurisdiction, include 45 residential structures. Figure 6 depicts the current turbine layout and the location of adjacent property boundaries. In the analysis of wind turbine noise, HDR modeled noise from 134 GE 1.5XLE turbines using Cadna‐A. The turbine locations include 97 wind turbines on BLM land, 17 turbines on Tribal lands, 7 turbines on State lands, and 13 wind turbines on private parcels (Rough Acres Ranch). The sound power level used in the analysis is based on maximum operating conditions at 10 meters per second. Additionally 2 decibels were added to each octave band to account for uncertainty. Table 6 presents the spectral sound power level data provided by GE the modeled turbine manufacturer.
Table 7 presents the results of the wind turbine airborne noise analysis with respect to operational turbine noise intrusion onto adjacent property lines. Noise levels are presented in A‐weighted and C‐weighted hourly equivalent noise levels at property lines adjacent to the project area. Wind turbine project‐related noise levels range from 33 to 49 dBA at property boundaries within the noise study area. C‐weighted project‐related noise levels are comparable with existing conditions, ranging from 48 to 59 decibels related to the carrier (dBC) Leq(h) at adjacent property boundaries. Table 8 presents the maximum predicted noise level in comparison to the significance criteria defined in San Diego County Code of Regulatory Ordinances Section 36.404.
Noise Analysis
Tule Wind Project Page 14 October 2010 Iberdrola Renewables, Inc.
Without mitigation project‐related wind turbine noise levels exceed maximum allowable noise limits for nighttime noise at two property boundaries, Home 1 and Home 2 by 2 and 4 dBA, respectively. Figure 7 and Figure 8 depict the noise contours, on an A‐weighted and C‐weighted hourly Leq basis for the project area. Infrasound and Low Frequency Noise Recent studies focusing on infrasound have found that infrasound emitted from wind turbines are below the threshold of audibility. A recent white paper by the American Wind Energy
Noise Analysis
Tule Wind Project Page 15 October 2010 Iberdrola Renewables, Inc.
Association (AWEA) found that “there is a consensus among acoustic experts that the infrasound from wind turbines is of no consequence to health.”1 Current acoustical standards provide a means by which to assess interior and exterior noise levels based on both overall noise level and noise spectrum. ANSI S12.9 Part 4 provides criteria by which to assess environmental sounds and predict the potential for annoyance based on the Schultz curve. Other current acoustical standards, such as ANSI S12.2 (2008), provide criteria by which to evaluate interior noise levels and the likelihood of perceptible vibrations. A recent field study performed by Epsilon Associates measured low frequency noise associated with two modern turbines, the GE 1.5sle and the Siemens 2.3‐93. Using existing ANSI criteria for the evaluation of interior noise levels, Epsilon Associates determined that noise generated by wind farms at distances beyond 1,000 feet were below the low frequency noise criteria for bedrooms, classrooms and hospitals. In addition to meeting ANSI background noise criteria the measured interior noise levels also demonstrate that wind turbine setbacks of 1,000 feet will not cause “more than minimal annoyance (if any) from low frequency noise, and there should be no wind rattles or perceptible vibration of light‐weight walls or ceilings within homes.”2 The overall noise level and spectrum of the GE 1.5‐sle turbine is similar to the noise emissions of the GE 1.5 XLE used in the noise analysis. Current setbacks for the Tule Wind Project are more than 1,500 feet from the nearest non‐participating land owner. Based on the Epsilon noise study, low frequency noise at a distance of 1,500 feet will have no audible infrasound and will meet ANSI S12.2 criteria for acceptable indoor levels for low frequency sound. Project Electrical System The project’s electrical system will consist of three primary elements: an overhead and underground collector system; the project substation; and a 138 kV transmission line which will deliver the electricity to the SDG&E proposed Rebuilt Boulevard Substation located off‐site on Old Highway 80. Substation There are two project collector substation locations proposed on BLM land, the “proposed” collector substation and the “deviant” collector substation. Both substation locations are south of McCain Valley Road, with the deviant substation located 0.6 miles southwest of the proposed substation. The deviant substation location is a potential alternate to the proposed, and as part of the proposed project is not a separate alternative. The deviant substation is
1 “Wind Turbine Sound and Health Effects An Expert Panel Review.” American Wind Energy Association, Canadian Wind Energy Association. December 2009. 2 “Summary of Findings on Wind Turbine Low Frequency Noise and Infrasound.” Epsilon Associates. 20 March 2009.
Noise Analysis
Tule Wind Project Page 16 October 2010 Iberdrola Renewables, Inc.
included in the project to provide flexibility in the project design to minimize impacts to view sheds and natural resources due to topography. For each of the two proposed substation locations, the collector lines, transmission lines, and roadway land disturbance impacts alter slightly. However; the deviant collector substation yields a higher potential impact for the entire project, with all project components considered. Therefore, the proposed project utilizing the deviant substation as the “proposed” substation is used to show the maximum impact potential for the project. An alternative substation is also proposed and located 0.4 miles west of McCain Valley Road on Rough Acres Ranch property, in southern portion of the project area. Substation noise was modeled for the proposed and alternate substation locations. The substation equipment is the same for all proposed locations and includes two (138 kV and 34.5 kV) 100 megavolt ampere (MVA) power transformers that are connected through 138 kV circuit breakers to a common 138 kV transmission line within the substation. In the analysis of potential substation build‐out noise conditions HDR modeled noise from two 100 MVA transformers using Cadna‐A. Each transformer was modeled assuming a maximum sound power level of 97 dBA, which is conservatively high for a 100 MVA transformer. Table 9 presents the results of the proposed substation noise analysis with respect to noise intrusion onto adjacent property lines. Noise attributable to the proposed substation is below the calculation threshold. Substation noise at property boundaries are approximately 0 dBA and therefore will not increase the cumulative project related noise level.
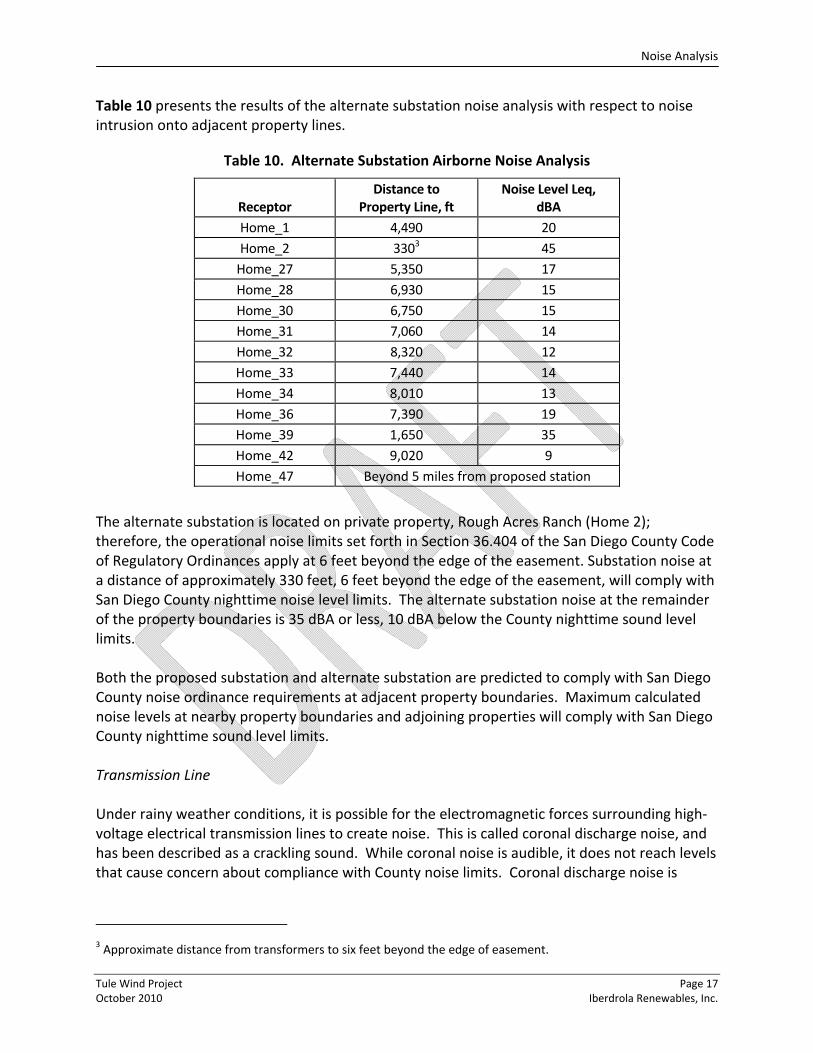
The alternate substation is located on private property, Rough Acres Ranch (Home 2); therefore, the operational noise limits set forth in Section 36.404 of the San Diego County Code of Regulatory Ordinances apply at 6 feet beyond the edge of the easement. Substation noise at a distance of approximately 330 feet, 6 feet beyond the edge of the easement, will comply with San Diego County nighttime noise level limits. The alternate substation noise at the remainder of the property boundaries is 35 dBA or less, 10 dBA below the County nighttime sound level limits. Both the proposed substation and alternate substation are predicted to comply with San Diego County noise ordinance requirements at adjacent property boundaries. Maximum calculated noise levels at nearby property boundaries and adjoining properties will comply with San Diego County nighttime sound level limits. Transmission Line Under rainy weather conditions, it is possible for the electromagnetic forces surrounding high‐voltage electrical transmission lines to create noise. This is called coronal discharge noise, and has been described as a crackling sound. While coronal noise is audible, it does not reach levels that cause concern about compliance with County noise limits. Coronal discharge noise is
3 Approximate distance from transformers to six feet beyond the edge of easement.
Noise Analysis
Tule Wind Project Page 18 October 2010 Iberdrola Renewables, Inc.
typically not audible due to the high voltage transmission line (HVTL) set‐back distances to residences. The 138 kV project transmission line and poles will be located within a 100‐foot right‐of‐way easement. The proposed transmission line will have three conductors supported by insulators on single‐shaft steel poles that will either be galvanized or coated with a weathered steel finish to resemble wood. Tule corona noise was assessed using the Bonneville model assuming wet weather conditions and maximum sag conditions. Based on the corona noise model, using typical 138 kV single‐circuit transmission line configuration, transmission line noise will comply with the County’s noise ordinance requirements at the 100‐foot right‐of‐way. Figure 9 depicts predicted corona noise levels at various lateral distances from the line. At 50 feet, the right‐of‐way corona noise levels are predicted to be 26 dBA below the County nighttime noise level limits; therefore, no noise impacts are predicted to occur due to corona noise. Vehicular Noise Vehicular noise associated with the project operations includes vehicular traffic on access roads due to occasional post‐construction operation and maintenance trips. Post‐construction, the project is expected to be supported by up to 12 permanent full‐time employees. Operational roadway noise associated with the project may result in a temporary increase in noise level in areas directly adjacent to access roads; the increase in noise due to operational traffic will be less than significant. Cumulative Project‐Related Operational Noise All residences within 1 mile of the project area were modeled in the analysis of cumulative project‐related noise. Cumulative operational noise includes both wind turbines and project substation noise. HDR modeled noise from 134 GE 1.5XLE turbines and the proposed and alternative substations using Cadna‐A. Corona noise from the project transmission line is more than 10 decibels below substation and wind turbine generated noise and will not increase overall noise levels and therefore was not included in the cumulative project‐related operational noise analysis. Table 11 summarizes the cumulative project‐related operational noise utilizing the proposed substation location. Cumulative operational project‐related noise levels, for the proposed action, are dominated by wind turbine generated noise. Noise attributable to the proposed substation is below the calculation threshold. Project substation noise at property boundaries are approximately 0 dBA and therefore will not increase the cumulative operational project related noise level. Cumulative operational project‐related noise levels, utilizing the proposed substation location, range from 33 to 49 dBA at property boundaries within the noise study area.
Noise Analysis
Tule Wind Project Page 19 October 2010 Iberdrola Renewables, Inc.
Table 11. Proposed Action ‐ Property Line Airborne Noise Analysis
Note: Receptor locations are based on the maximum calculated sound pressure level at an adjacent property boundary.
As displayed in Table 11, noise levels at adjacent property lines are anticipated to increase 0‐6 dB due to project related noise, on an hourly Leq basis, when utilizing the proposed substation. The County of San Diego standard is 50 dBA during the daytime and 45 dBA during the nighttime unless the ambient exceeds the threshold then the standard is ambient plus three decibels. The project will comply with the daytime standards at all sensitive uses but without mitigation will exceed the nighttime standard at two receptors (Home 1 and 2).
Table 12 presents the maximum predicted cumulative operational noise level, utilizing the proposed substation location, in comparison to the significance criteria defined in San Diego County Code of Regulatory Ordinances Section 36.404.
Table 12. Summary of the Cumulative Noise Analysis – Proposed Action
Tule Wind Project Page 20 October 2010 Iberdrola Renewables, Inc.
Without mitigation cumulative operational project‐related noise levels, under the proposed project configuration, exceed maximum allowable noise limits for nighttime noise at two property boundaries, Home 1 and Home 2, by 2 and 4 dBA, respectively. Table 13 summarizes the cumulative project‐related operational noise, utilizing the alternate substation location.
Table 13. Alternate Substation ‐ Property Line Airborne Noise Analysis
Note: Receptor locations are based the maximum calculated sound pressure level at an adjacent property boundary.
Cumulative project‐related noise levels under the proposed configuration, utilizing the alternate substation, are dominated by wind turbine generated noise. Project substation noise at adjacent property boundaries are typically 10 dBA below wind turbine generated noise levels and therefore will not increase the cumulative project related noise level, with the exception of Homes 2, 36 and 39. Project‐related noise levels as Homes 2, 36, and 39 are influenced by both wind turbine noise and project substation noise as depicted in Table 13. Cumulative project‐related noise levels, utilizing the alternative substation location, range from 34 to 50 dBA at property boundaries within the noise study area. Table 14 presents the maximum predicted cumulative noise level, utilizing the alternate substation location, in comparison to the significance criteria defined in the San Diego County Code of Regulatory Ordinances Section 36.404.
Noise Analysis
Tule Wind Project Page 21 October 2010 Iberdrola Renewables, Inc.
Table 14. Summary of the Cumulative Noise Analysis – Alternate Substation
Without mitigation cumulative operational project‐related noise levels, utilizing the alternate substation location, exceed maximum allowable noise limits for nighttime noise at two property boundaries, Home 1 and Home 2, by 2 and 5 dBA, respectively. Design Considerations and Mitigation Measures Project‐related operational noise without mitigation, using the current turbine layout, is predicted to exceed nighttime allowable noise limits at two property boundaries in the project‐area. Project‐related operational noise is not predicted to cause significant daytime airborne‐noise impacts. Operational noise will be mitigated to comply with the San Diego County Code of Regulatory Ordinances Section 36.404 prior to construction. Mitigation options that may be considered in final design include revising turbine layout, nighttime curtailment of select turbines, utilizing an alternate turbine manufacturer and implementation of noise reduction technology. Upon approval of the final design and project layout, and prior to construction, the noise report will be finalized to demonstrate compliance with the San Diego County Code of Regulatory Ordinances Section 36.404. 3.3 Potential General Construction Noise Impacts Activities associated with construction of access roads, foundations, excavation for and assembly of turbines, and equipment deliveries are likely to be the loudest sources of construction noise. Like most major projects, construction activities increase outdoor noise levels for a limited period of time. Noise levels would vary widely, depending on the phase of construction and specific tasks being performed. Construction of the project would involve the operation of many short‐term uses of heavy equipment which may temporarily increase ambient noise levels existing over a period of 18 to 24 months. Noise associated with the construction phase of the project would include transport of workers and equipment to and from the construction site, and noise generated by construction activities. Construction of the project would consist of the following tasks:
• Constructing roads, parking and equipment laydown areas
• Conducting ongoing dust and erosion control
Noise Analysis
Tule Wind Project Page 22 October 2010 Iberdrola Renewables, Inc.
• Excavating for turbine transformer foundations
• Leveling areas for setting the erection crane
• Mixing of cement and pouring foundations for the wind turbines and meteorological towers
• Transporting tower sections to the site and erecting the towers
• Installing the nacelle and rotor on the wind turbine tower
• Trenching for underground utilities and 34.5 kV collection system power cables
• Building the substation and switching station
• Constructing the maintenance building
• Commissioning and testing the wind turbines
• Conducting final road grading, final erosion control, and site cleanup
• Installing 34.5 kV and 138 kV transmission poles and conductors Table 15 lists the type of equipment that is generally used during construction of a wind facility project.
Table 15. Equipment Typically Used for Wind Facility Construction
Bulldozer Road and pad construction
Grader Road and pad construction
Water trucks Compaction, erosion and dust control
Roller/compactor Road and pad compaction
Backhoe/trenching machine Digging trenches for underground utilities
Excavator Foundation excavation
Heavy duty rock trencher Underground trenching
Truck‐mounted drilling rig Drilling power pole holes
Concrete trucks/concrete pumps Pouring tower and other structure foundations
Cranes Tower/turbine erection
Dump trucks Hauling road and pad material
Flatbed and Low‐bed trucks Hauling turbine towers, turbines/components, construction equipment
Pickup trucks General use and hauling of minor equipment
Small hydraulic cranes/forklifts Loading and unloading equipment
4‐wheel‐drive all‐terrain vehicles Rough grade access and underground cable installation
Rough‐terrain cranes/forklifts Lifting equipment and pre‐erection assembly
Source: Tule Wind Project Plan of Development
Noise Analysis
Tule Wind Project Page 23 October 2010 Iberdrola Renewables, Inc.
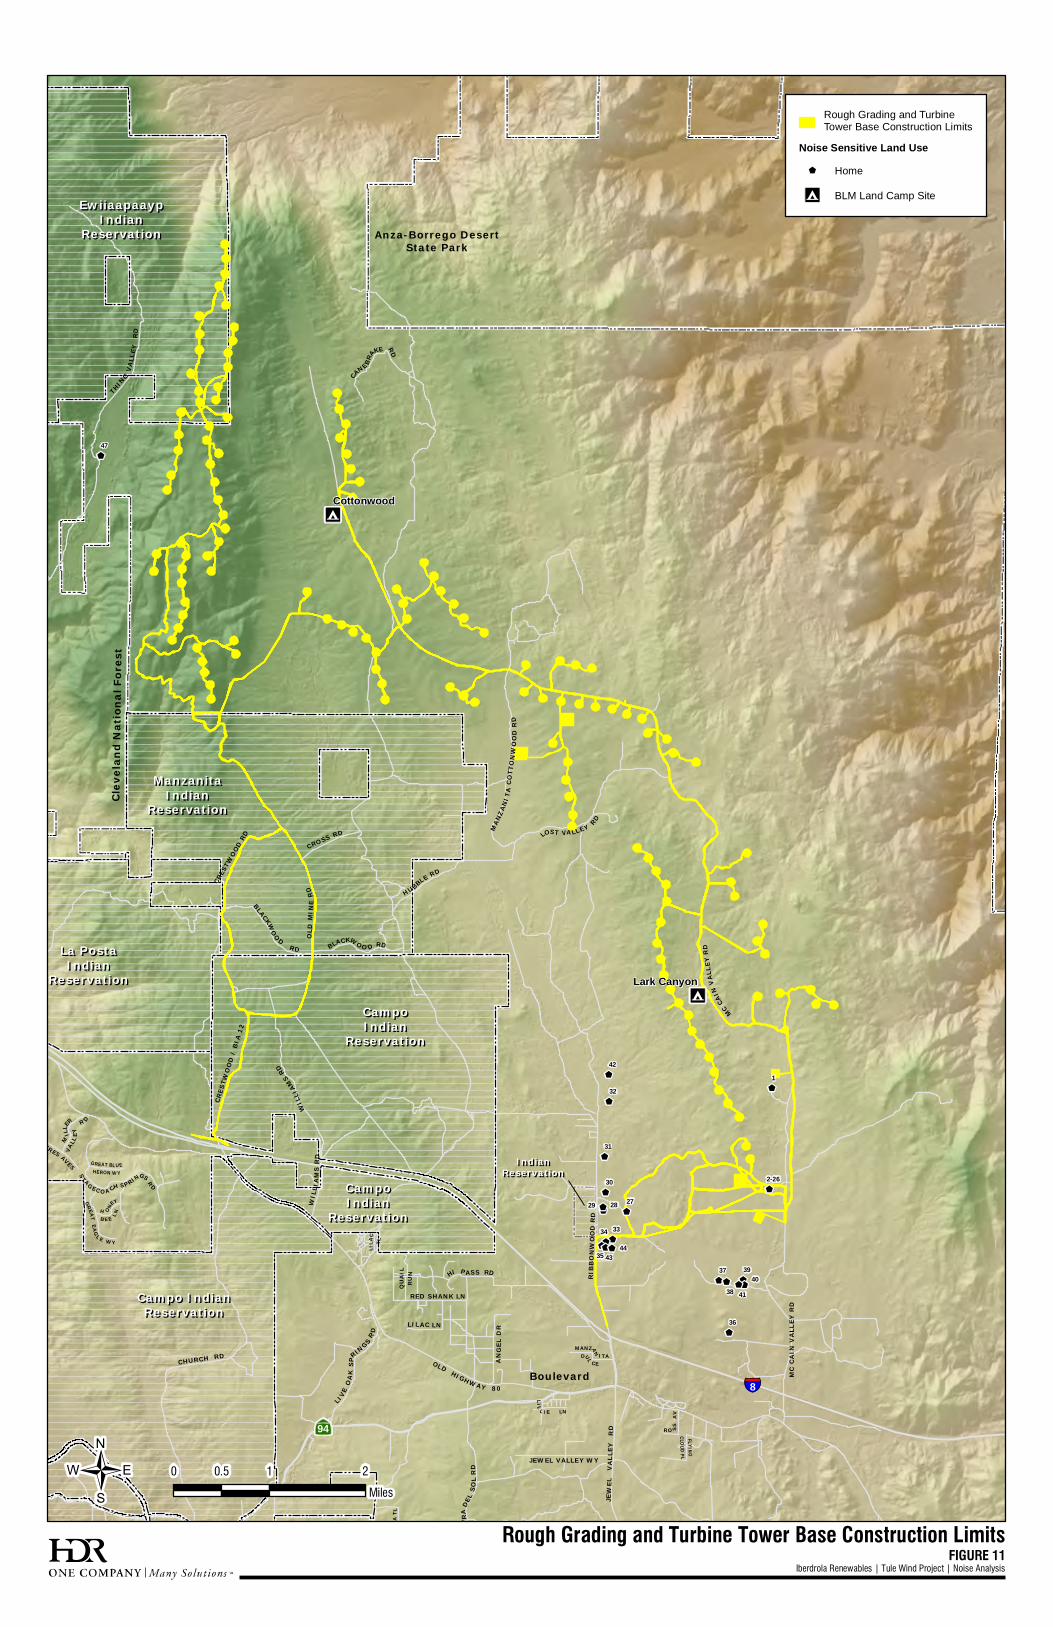
The Federal Highway Administration Roadway Construction Noise Model (RCNM) was used to assess noise from construction equipment. Use of this model is appropriate due to the similarity of equipment used when building roadways and the more refined analytical capabilities of RCNM in c decibels related to the carrier decibels related to the carrier comparison to spreadsheet methods. RCNM was developed during Boston’s Big Dig project (Central Artery Tunnel (CA/T), Boston, MA) and has become the standard model when assessing construction noise. The model expressed calculated noise levels to adjacent property boundaries using the Leq descriptor specified by the San Diego noise ordinances. The model calculates the Leq by taking the measured Lmax (maximum level during a single noise event) of equipment types at 50 feet, and converting it within the model to a Leq dependent upon the duration during each 8‐hour day the equipment is used. The calculation for this conversion is: Leq = Lmax + 10log (U.F.%/100) where “U.F” is the Usage Factor or duration in percentage the equipment is used over an 8‐hour work cycle. The analysis used aerial photographs and GIS data to determine the distance between receptors and construction area buffer zones and included 57 residential parcels and two campgrounds. Equipment types and percentile usage factors were broken into five distinct phases of work. These were “Rough Grading and Tower Base Construction,” the construction of access roads to the turbine locations; “Underground Utilities Construction,” the underground placement of utilities and supporting network of energy transport; and “Tower Construction,” the actual construction of the tower and turbine systems, cement batch plant operations, and transmission line construction activities. Rough grading and tower base construction limits are depicted in Figure 10. Table 16 describes the noise producing equipment associated with the rough grading and tower base construction activities.
Table 16. Equipment – Rough Grading and Tower Base Construction
Equipment Type1 Quantity Utilization (hours/day)
Actual Measured Noise Level2, Lmax at 50 feet
(dBA) Dozer–Cat D6 2 6 82 Dozer–Cat D8 2 8 82 Loader/Trencher 2 8 79 Water Truck 2 4 75 Mini Excavator 1 4 81 Dump/Haul & Drills 4 4 79 Scraper 1 4 84 1 Equipment Types Derived from Like Machinery Used Within the RCNM 2 Actual Measured Noise Levels Derived During the CA/T Project in Boston, MA.
Noise Analysis
Tule Wind Project Page 24 October 2010 Iberdrola Renewables, Inc.
The primary noise producing elements that will be used during rough grading and tower base construction are dozers and trenchers used for earth moving and tower base preparation. These will most likely be a continuous noise source during this stage of construction and is expected to be the most noise producing stage of the three phases. Underground utility construction limits are depicted in Figure 11. Table 17 describes the noise producing equipment associated with the underground utility construction activities.
Table 17. Equipment–Underground Utility Construction
Equipment Type1 QuantityUtilization (hours/day)
Actual Measured Noise Level2, Lmax at 50 feet
(dBA) Track Backhoe 2 6 78 Dozer–Cat D4 2 6 82 Loader 1 6 79 Water Truck 1 4 75 Concrete Truck 16 0.5 78 Dump/Haul Truck 2 4 77 1 Equipment types derived from like machinery used within the RCNM. 2 Actual measured noise levels derived during the CA/T Project in Boston, MA.
The primary noise producing elements that will be used during underground utility construction will be backhoes, loaders and dozers for earth moving. However, these noise sources should only be apparent to receptors in the initial stages of underground construction. As progress is made, more of these activities will proceed below grade and will naturally shield noise to receptors for the finishing work and utilities installation. Tower construction limits are depicted in Figure 12. Table 18 describes the noise producing equipment associated with tower construction activities.
Table 18. Equipment–Tower Construction
Equipment Type1 QuantityUtilization (hours/day)
Actual Measured Noise Level2, Lmax at 50 feet
(dBA) Skid Steer Cat 1 6 82 Hydraulic Crane 1 4 81 Water Truck 1 4 75 Welding Rig 1 4 74 Dump/Haul Truck 6 0.5 77 Paver/Compactor 1 8 83 Roller 1 8 80 1 Equipment types derived from like machinery used within the RCNM. 2 Actual measured noise levels derived during the CA/T Project in Boston, MA.
Noise Analysis
Tule Wind Project Page 25 October 2010 Iberdrola Renewables, Inc.
The primary noise producing elements that will be used during tower construction are the skid cat and the hydraulic crane. Due to the height at which the crane will be operating it is predicted that this will be the most noticeable noise source to receptors. However, the duration of the installation at these heights are predicted to be short term (2 to 3 days) and cause no long term noise impact. The 138 kV transmission line construction limits are depicted in Figure 13. Table 19 describes the noise producing equipment associated with the transmission line construction activities.
Table 19. Equipment–138 kV Transmission Line Construction
Equipment Type1 QuantityUtilization (hours/day)
Actual Measured Noise Level2, Lmax at 50 feet
(dBA) Skid Steer Cat 1 6 82 Hydraulic Crane 1 4 81 Water Truck 1 4 75 Welding Rig 1 4 74 Dump/Haul Truck 6 0.5 77 Paver/Compactor 1 8 83 Roller 1 8 80 1 Equipment types derived from like machinery used within the RCNM. 2 Actual measured noise levels derived during the CA/T Project in Boston, MA.
The primary noise producing elements that will be used during transmission line pole construction are the skid cat and the hydraulic crane. Due to the height at which the crane will be operating it is predicted that this will be the most noticeable noise source to receptors. However, the duration of the installation at these heights are predicted to be short‐term (2 to 3 days) and cause no long term noise impact. Table 20 describes the noise producing equipment associated with batch plant operations.
Table 20. Equipment–Batch Plant Operation
Equipment Type1 Quantity Utilization (hours/day)
Actual Measured Noise Level2, Lmax at 50 feet
(dBA) Concrete Batch Plant 1 8 73 1 Equipment types derived from like machinery used within the RCNM. 2 Actual measured noise levels derived during the CA/T Project in Boston, MA.
A temporary cement batch plant is predicted to be in operation for full duty cycles‐ or full 8‐hour work days during construction. However, due to the distances to receptors, no noise impacts are predicted to occur.
Noise Analysis
Tule Wind Project Page 26 October 2010 Iberdrola Renewables, Inc.
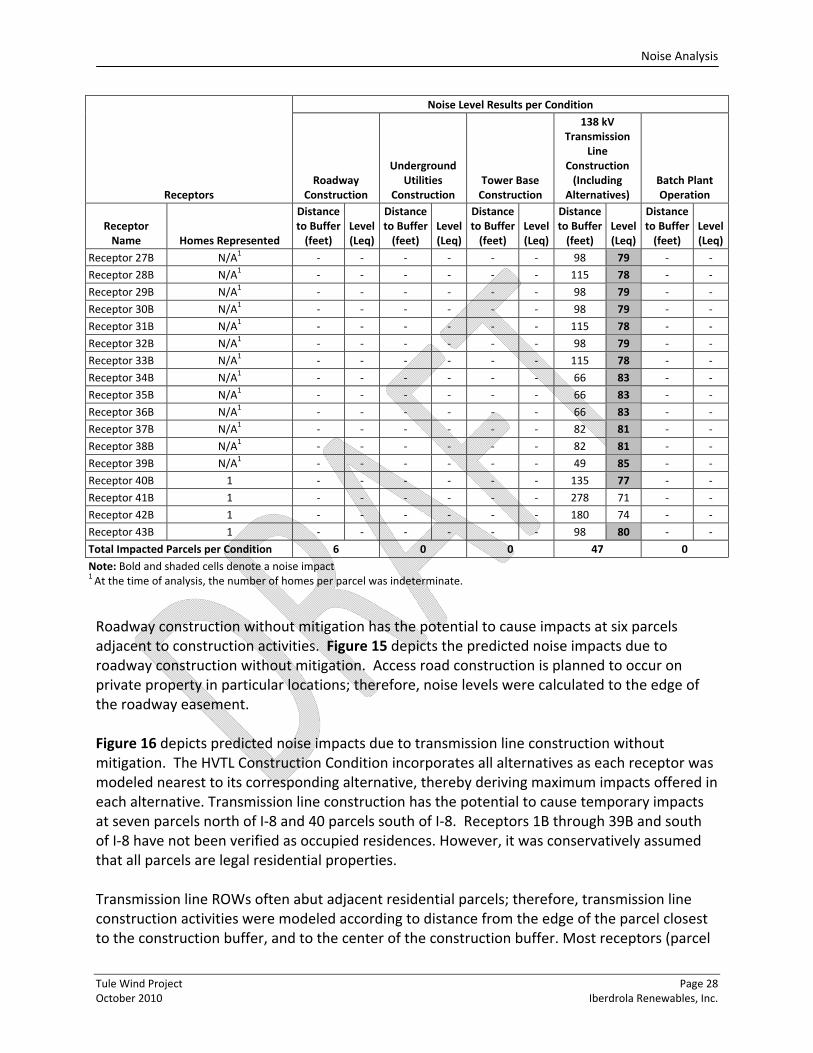
Blasting There is potential for blasting in some places during construction to remove rock. Blasting will create an impulse sound, a very short‐duration sound with a sharp peak in magnitude. The effect of blasting impulsive noise is discussed in Section 3.4, Potential Impulsive Noise Impacts. Impulsive noise will also contribute to the general construction noise level. Construction blasting will be planned, in part, where it will cause less noise and vibration than non‐blasting construction methods. General areas or exact locations for blasting will be identified by results of a geotechnical investigation. Some construction blasting can be planned to occur infrequently enough that it does not increase the average construction noise above the eight‐hour average sound level limit of 75 dBA. Other construction blasting may need to be coordinated with building occupants to occur in their absence, or at other acceptable times, to avoid nuisance or annoyance complaints. Supplemental construction equipment, such as drill rigs may be used to support blasting and geotechnical activities. At a distance of 80 feet drill rig noise emissions is approximately 75 dBA Leq. Drill rigs, without mitigation, have the potential to cause temporary noise impacts if used less than 80 feet from the property line of an occupied residence. Noise mitigation measures may include temporary noise barriers or limited hours of operation. Should blasting be required construction blasting will be managed with the preparation of a blasting plan for each site. The blasting plan will include identification of planned blasting locations, a description of the planned blasting methods, an inventory of receptors potentially affected by the planned blasting, and calculations to determine the area affected by the planned blasting. Noise calculations in the blasting plan will account for blasting activities and all supplemental construction equipment. Construction Noise Analysis (Non‐Impulsive) The construction noise analysis used RCNM to calculate project‐related construction noise levels at parcels adjacent to construction activities. Calculated noise levels reflect phase specific equipment and equipment utilization. Several homes may be located on a single parcel. Residences located on the same parcel were grouped by receptor location. Table 21 details the three phase of work, the distance to each construction buffer area and their associated noise levels. The Underground Utilities Condition, the Tower Base Construction Condition and the Batch Plant Operation Conditions exhibit no noise impacts at any receptor or home.
Noise Analysis
Tule Wind Project Page 27 October 2010 Iberdrola Renewables, Inc.
Note: Bold and shaded cells denote a noise impact 1 At the time of analysis, the number of homes per parcel was indeterminate.
Roadway construction without mitigation has the potential to cause impacts at six parcels adjacent to construction activities. Figure 15 depicts the predicted noise impacts due to roadway construction without mitigation. Access road construction is planned to occur on private property in particular locations; therefore, noise levels were calculated to the edge of the roadway easement. Figure 16 depicts predicted noise impacts due to transmission line construction without mitigation. The HVTL Construction Condition incorporates all alternatives as each receptor was modeled nearest to its corresponding alternative, thereby deriving maximum impacts offered in each alternative. Transmission line construction has the potential to cause temporary impacts at seven parcels north of I‐8 and 40 parcels south of I‐8. Receptors 1B through 39B and south of I‐8 have not been verified as occupied residences. However, it was conservatively assumed that all parcels are legal residential properties. Transmission line ROWs often abut adjacent residential parcels; therefore, transmission line construction activities were modeled according to distance from the edge of the parcel closest to the construction buffer, and to the center of the construction buffer. Most receptors (parcel
Noise Analysis
Tule Wind Project Page 29 October 2010 Iberdrola Renewables, Inc.
property lines) south of I‐8 are within 150 feet of the transmission line construction buffer zone with the exception of 41B and 42B and therefore exhibit a noise impact. For the sake of analysis, modeling determined that at a distance of 167 feet from the centerline of the construction buffer, transmission line construction noise levels will comply with County noise regulations. However, because no structures could be identified at the time of this analysis and at receptors 1B‐39B, and because San Diego County prefers noise levels be gauged at the property line, most of the property lines within this analysis and south of I‐8 fall within 150 feet and therefore exhibit 138 kV transmission line construction noise impacts regardless of where a structure is on a parcel. Design Considerations and Temporary Mitigation Measures Underground utility construction, tower base construction and batch plant operations are not predicted to cause construction noise impacts at adjacent parcels; therefore, no mitigation is necessary during these construction activities. Roadway construction activities, without mitigation, have the potential to cause six temporary impacts to adjacent parcels. The adjacent property boundaries are in some instances as close as 10 feet from the construction buffer zone and will experience the highest noise levels from road construction and grading activities. Transmission line construction activities, without mitigation, have the potential to cause temporary impacts at 6 parcels north of I‐8 and 39 parcels south of I‐8. Transmission line right‐of‐way often abuts adjacent residential parcels; therefore, all receptors (parcels) south of I‐8 are within 150 feet of the construction buffer zone and exhibit a noise impact. Design considerations that will be implemented to minimize the potential for temporary construction noise impacts include the implementation of BMPs. Although no detailed construction documents or excavation plans are available which may detail times and usage of machinery, best management practices will be in place to decrease the amount of noise generated during construction. These may include but are not limited to:
• Requiring OEM or higher‐performing mufflers on equipment.
• Requiring the regular maintenance and inspection of construction machinery to allow for quieter operation.
• Augmented back up alarms coupled with contractor observation to minimize alarm noise, a consistent area of concern and complaint on most construction projects.
• Specifying the proper usage and power for the particular construction procedure‐ no machinery overkill.
• Utilizing noise barriers and machinery enclosures where feasible.
• Ban the use of “jake braking” or engine compression braking on all trucks.
Noise Analysis
Tule Wind Project Page 30 October 2010 Iberdrola Renewables, Inc.
While it is unlikely that work can commence without the use of some equipment listed, it is imperative that contractors coordinate the usage times and duration of noisy equipment outside of the recommended usage. All stationary construction equipment will be located as far as practicable from nearby residences and other human recreational activities. To further reduce the potential impact of construction equipment, stationary equipment not actively being used will idle no more than 5 minutes. Mitigation that will be implemented to reduce temporary construction related noise impacts to less than significant include a site specific mitigation plan. A site specific noise mitigation plan will be developed and construction noise levels will be reduced to comply with San Diego County Code of Regulations Section 46.309. Mitigation of construction noise can be implemented through a number of different options. The most significant impact during roadway construction is 99 dBA Leq at Receptor 11A. Reduction of these high levels to 75 dBA Leq is most likely going to take the form of a movable barrier, along with modifications to exhaust systems, and time constraints on the loudest pieces of machinery. Considering a 12‐foot high exhaust stack on a typical dump truck, achieving a 20 dB reduction could require a barrier of up to 24 feet high. A barrier must also incorporate sufficient mass in order to mitigate noise passing through. While Transmission Loss (TL) has been discussed in the specification of a barrier, TL is not a metric that can be associated with a barrier which is open at the top. A high Sound Transmission Coefficient, or STC, can be specified for both hard and soft flexible barriers which will increase the amount of noise the barrier rejects. It is HDR’s recommendation that any barrier specified for the use of shielding residents from noise incorporate an STC rating of no less than 30. Minimum 1‐inch thick acoustical blankets may also be needed based on the type of construction, distance, and noise levels. Perhaps beneficial to the project and the receptors, all properties which show noise exceedances do so because of their close proximity to the construction buffer zone. Noise walls are most effective when the receiver is within the noise walls “shadow zone.” The shadow zone is the area immediately on the other side of the noise source. As a receiver moves further from the noise barrier, “diffracted” noise becomes a more significant portion of the noise. Diffraction is the name given to noise which wraps over and around noise walls. Within the noise wall’s shadow zone, diffraction is minimized and a noise barrier is at its most effectiveness. It is anticipated that a 20 dB reduction could be achieved by placing a barrier of appropriate height as close as possible to construction activities at the nearest and most impacted receptors. A 10 dB reduction is considered a 50 percent reduction in noise to the human ear. A 20 dB reduction may be perceived as a four‐fold reduction in apparent noise.
Exhaust silencers used on machinery during construction will reduce noise further. These are commonplace and affixed aftermarket to most construction machinery. Typical reductions for
Noise Analysis
Tule Wind Project Page 31 October 2010 Iberdrola Renewables, Inc.
these types of systems can vary from 5‐7 dB for each type of equipment, resulting in a noticeable reduction of noise to the human ear. Additional mitigation options may include limited equipment use. A utilization of 50 percent or less (4 hours per day) for the loudest pieces of construction equipment can be imposed between the hours of 10 a.m. and 2 p.m. This will lessen the duration of noise impact. All machinery must also undergo weekly inspections which focus on noise reduction. Leaky exhaust systems, loose metal sheeting and poor condition of muffler systems need to be addressed immediately. With the incorporation of BMPs and mitigation measures, the highest predicted construction noise level at an adjacent property boundary is reduced from 99 dBA to 74 dBA Leq. On‐site noise monitoring and documentation by a County‐approved acoustical consultant will ensure that any noise impacts to potentially affected receptors will be reduced to comply with the San Diego Noise Ordinance.
3.4 Potential Impulsive Noise Impacts
There is potential for blasting in some locations during construction to remove rock. Blasting will create an impulse sound, a very short‐duration sound with a sharp peak in magnitude. Generally impulsive sounds are less than 1 second in duration, rise and decay 20 dB in less than 250 milliseconds. Blasting impulsive noise generally rises more quickly. In the event that blasting is required, up to two rock drills may be utilized to bore the charge stems needed and a mounted impact hammer utilized to break the excess material to a manageable size. These types of machines also cause impulsive noise in excess of 90 dBA at 50 feet. A minimum set back of 150 feet from these impact devices should bring the impulsive noise induced below 82 dBA at sensitive receptors. General areas or exact locations for blasting will be identified by results of a geotechnical investigation. Construction blasting will be planned, in part, where it will cause less noise and vibration than non‐blasting construction methods. The effect of blasting impulsive noise to the overall construction noise level is discussed in Section 3.3, Potential General Construction Noise Impacts. San Diego Code Section 36.410, “Sound Level Limitations on Impulsive Noise,” regulates impulsive noise. The code limit for residential, village zoning or civic use is a 1‐minute maximum sound level of 82 dBA for 75 percent of the minutes within a measurement period (one‐hour minimum period), but exceedances are allowed for 25 percent of the minutes. Construction blasting may exceed the limit at certain locations, but blasting can be planned to occur infrequently enough that it does not exceed the limit for more than 15 minutes of any hour or 25 percent of any hour.
Noise Analysis
Tule Wind Project Page 32 October 2010 Iberdrola Renewables, Inc.
Construction blasting will be managed with the preparation of a blasting plan for each site. The blasting plan will include identification of planned blasting locations, a description of the planned blasting methods, an inventory of receptors potentially affected by the planned blasting, and calculations to determine the area affected by the planned blasting. The actual peak sound pressure level, as well as the duration, rise time and decay time, depend upon the magnitude of the blast, the local environment and propagation characteristics. As will any other sound pressure level, the magnitude falls as distance from the blast increases. Design Considerations and Mitigation Measures Given these design considerations, mitigation measures will not be necessary. However, nuisance or annoyance complaints could still occur and potentially be addressed by coordinating blasting times with building occupants to occur in their absence, or at other acceptable times.
Noise Analysis
Tule Wind Project Page 33 October 2010 Iberdrola Renewables, Inc.
4.0 GROUND‐BORNE VIBRATION AND NOISE IMPACTS
Project‐related construction activities may cause ground‐borne noise or ground‐borne vibration to nearby NSLUs. The construction activity that is most commonly associated with building damage is blasting during excavation. Other vibration inducing equipment includes dozers and heavy trucks. Construction Related Vibration Most limits on construction vibration are based on minimizing the potential for damage to nearby structures. Table 22 presents CALTRANs construction vibration damage thresholds. Other vibration‐producing construction equipment proposed for use on the Tule Wind Project includes loaded trucks, roe hams, drill rigs and bull dozers.
Extremely fragile historic buildings, ruins, ancient monuments 0.12 0.08 Fragile buildings 0.2 0.1 Historic and some old buildings 0.5 0.25 Older residential structures 0.5 0.3 Newer residential structures 1.0 0.5 Modern industrial/commercial buildings 2.0 0.5 Source: Jones & Stokes. 2004. Transportation and Construction‐Induced Vibration Guidance Manual. June.
(J&S 02‐039.) Sacramento, CA. Prepared for California Department of Transportation, Noise, Vibration, and Hazardous Waste Management Office, Sacramento, CA.
Notes: 1 Transient sources create a single, isolated vibration even, such as blasting or drop balls. 2 Continuous/frequent intermittent sources include impact pile drivers, pogo‐stick compactors, crack‐
and‐seat equipment, vibratory pile drivers and vibratory compaction equipment.
Table 23 presents vibration levels for typical construction equipment at a distance of 15 feet. At a distance of 15 feet construction related vibration, with the exception of blasting, will comply with the impact criteria for older residential structures. There are no vibration sensitive residential structures located within 15 of the transmission line construction limits.
Noise Analysis
Tule Wind Project Page 34 October 2010 Iberdrola Renewables, Inc.
Table 23. Vibration Levels at a Distance of 15 Feet
Equipment Type Peak Particle Velocity
at 15 feet
Hydromill
in soil 0.02
in rock 0.04
Hoe Ram 0.19
Large bulldozer 0.19
Caisson drilling 0.19
Loaded trucks 0.16
Jackhammer 0. 08
Small bulldozer 0.01
RMS velocity in decibels (VdB) re 1 micro‐inch/second
Blasting There is potential for blasting in some locations during construction to remove rock. General areas or exact locations will be identified by results of a geotechnical investigation. Construction blasting will be planned, in part, where it will cause less noise and vibration than non‐blasting construction methods. Construction blasting will be managed with the preparation of a blasting plan for each site. The blasting plan will include identification of planned blasting locations, a description of the planned blasting methods, an inventory of vulnerable structures potentially affected by the planned blasting, and calculations to determine the area affected by the planned blasting. Construction blasting will create unavoidable groundborne vibration. Vibration propagation is highly dependent on soil conditions between the blast and the receptor. In some soil conditions, groundborne vibration dissipates quickly. Design Considerations and Mitigation Measures As part of the project design, a blasting plan will be prepared for each potentially impacted site. The plan will consider location, planned blasting methods and potentially affected receptors. Physical damage to potentially vulnerable structures will be addressed by avoiding construction blasting near the structures wherever possible, and non‐blasting construction methods will be evaluated. Depending upon the results of the blasting plan, mitigation measures may include coordination with building occupants so that blasting occurs in their absence, or at other acceptable times, to avoid nuisance or annoyance complaints. A rock anchoring or mini‐pile system may be used to reduce the risk of damage to structures. Structures shall be restored if adversely affected by construction vibration, to an equivalent condition as that prior to the construction. Fair compensation for lost use will be provided to the owner.
Noise Analysis
Tule Wind Project Page 35 October 2010 Iberdrola Renewables, Inc.
5.0 SUMMARY OF PROJECT IMPACTS, DESIGN CONSIDERATIONS, MITIGATION AND CONCLUSIONS
Determination of significance of construction‐related traffic airborne noise upon NSLU was performed in compliance with Section 4b of the San Diego County Noise Element. Project‐related vehicular noise, due to construction activities, is not predicted to cause any significant airborne‐noise impacts due to an increase over existing noise levels. NSLUs with existing noise levels currently approaching the 60 dBA CNEL benchmark such as Old Highway 80 and Ribbonwood Road south of I‐8, were assessed to determine if the project created a 3 dBA increase over existing noise levels. Increases over existing noise levels for Old Highway 80 and Ribbonwood Road south of I‐8 were 1 dBA and less than 1 dBA, respectively. Project construction‐related vehicular noise creates an increase of more than 3.0 dBA CNEL along a segment of McCain Valley Road and Ribbonwood Road but does not increase the cumulative noise levels above the 60 dBA CNEL County threshold to noise sensitive areas. Project construction‐related vehicular noise at NSLU is not predicted to cause any significant airborne‐noise impacts due to an increase over existing noise levels. Determination of impact for project‐related noise including wind turbine generated noise, corona noise and substation noise was performed in compliance with San Diego County Code of Regulatory Ordinances Section 36.404. Project‐related noise without mitigation, using the current turbine layout, is predicted to exceed nighttime allowable noise limits at two property boundaries in the project‐area. Project‐related noise is not predicted to cause significant daytime airborne‐noise impacts. Operational noise will be mitigated to comply with the San Diego County Code of Regulatory Ordinances Section 36.404 prior to construction. Mitigation options, for wind turbine generated noise, may be considered in final design include revising turbine layout, nighttime curtailment of select turbines, utilizing an alternate turbine manufacturer and implementation of noise reduction technology. Upon final design, project approval and prior to construction a noise report will be finalized to demonstrate compliance with the San Diego County Code of Regulatory Ordinances Section 36.404. Construction noise levels for turbine staging and placement will be within acceptable noise generation levels established by the County Noise Ordinance Sections 36.409 and 36.410. Construction noise for haul roads and the construction of the 138 kV transmission line are expected to produce short term noise impacts at residences closest to these construction ROWs. Implementation of BMP’s will reduce these temporary impacts. The BMPs include but are not limited to the following: maintaining OEM mufflers or better, ensuring all equipment is in good operating condition, and limiting hours of operation. However, prescribed BMPs will not reduce impacts to less than significant thus mitigation of temporary noise impacts with the use of temporary noise barriers will be necessary.
Noise Analysis
Tule Wind Project Page 36 October 2010 Iberdrola Renewables, Inc.
Construction could include activities that may temporarily expose people to ground‐borne vibration or ground‐borne noise. Ground‐borne vibration caused by construction equipment was compared to CALTRANs construction vibration damage to determine the likelihood of vibration induced damage to structures. At a distance of 15 feet construction related vibration, with the exception of blasting, will comply with the impact criteria for older residential structures. There are no vibration‐sensitive structures located within the 15‐foot damage zone therefore there are no predicted construction‐related vibration impacts. Blasting may be required in some areas for the construction of the turbine foundations. Construction blasting will be managed with the preparation of a blasting plan for each site. The blasting plan will include identification of planned blasting locations, a description of the planned blasting methods, an inventory of vulnerable structures potentially affected by the planned blasting, and calculations to determine the area affected by the planned blasting. Physical damage to the structures will be addressed by avoiding construction blasting near vulnerable structures wherever possible. Alternative non‐blasting construction methods will be evaluated. A rock anchoring or mini‐pile system may be used to reduce the risk of damage to structures. Structures shall be restored if adversely affected by construction vibration to an equivalent condition as that prior to the construction or fair compensation, as appropriate, will be provided to the owner.
Noise Analysis
6.0 CERTIFICATION
I hereby certify that the statements furnished above and in the attached exhibits/appendices present the data and information required for this noise analysis, and that the facts, statements, and information presented are true and correct to the best of my knowledge and belief. This report was reviewed by Jeremy Louden; a County-approved CEQA Consultant for Acoustics.
Date: October 4, 2010
Prepared by HDR Engineering:
Gina Ramirez HDR Engineering, Inc. 701 Xenia Avenue, Suite 600 Minneapolis, MN 55416 (763) 591-6609
Reviewed by Ldn Consulting Inc:
Jeremy Louden, Principal Ldn Consulting, Inc. 446 Crestcourt Lane Fallbrook, CA 92028 (760) 473-1253
Tule Wind Project October 2010
Signed: __ ~~~~.,....-_____ _ Jeremy Lo
Page 37 Iberdrola Renewables, Inc.
Noise Analysis
Tule Wind Project Page 38 October 2010 Iberdrola Renewables, Inc.
This page intentionally left blank.
FIGURES, EXHIBITS & ILLUSTRATIONS
!(
!(
!(
!(
!(
!(
!(
!(
!(
!(
!( !(!(
!(
!(
!(
!(
!(
!(
!(
!(
!(
!(
!(
!(
!(
!(
!(
!(
!(
!(
!(
!(
!(
!(
!(
!(
!(
!(
!(
!(
!(
!(
!(
!(
!(!(
!(
!(
!(
!(
!(
!(
!(
!(
!(
!(
!(
!(
!(
!(
!(
!(!(
!(
!(
!(
!(
!(
!(
!(
!(
!(!(
!(
!(
!(
!(
!(
!(
!(
!(
!(
!(
!(
!(
!(
!(
!(
!(
!(
!(
!(
!(
!(
!(
!(
!(
!(
!(
!(
!(
!(
!(
!(
!(
!(!(
!(
!(
!(
!(
!(
!(
!(
!(
!(
!(
!(
!(!(
!(
!(
!(
!(
!(
!(
!(
!(
!(
!(
!(
!(
!(
Clev
elan
d Na
tiona
l For
est
Anza-Borrego DesertState Park
RED SHANK LN
OLD HIGHWAY 80
HI PASS RD
TIER
RA DE
L S O
L RD
ANGE
L D R
LI L
L IE LN
CAM TRES AVES
LILA
C TL
BLACKWOOD
RD
SHAS
TA TL
BLACKWOO D RD
CHURCH RD
E NCIN
A VE
R DE
QUAI
L RU
N
MIL
LER
VALL
EY R D
H ON
EY
BEE LN
GREAT BLUE HERON WY
LILAC LN
RO SS AV
JEWEL VALLEY WY
MIL
LE
R
VALL
EY
R D
MANZAN ITA DUL
CE
CROSS RD
HUBBLE RD
OLD
M INE
RD
SHASTA WY
FLY ING CLO UD PL
CANE BR
AKE RD
JEW
EL V A
LLE Y
R D
WIL
LIA M
S R D
STAG ECOA CH S PRINGS RD
LIVE
OAK
SP
RINGS RD
LOST VALLEY RD
GREAT EAG
L E WY
THIN
G VA
LLEY
RD
WIL
LIAM
S RD
CRES
TWOO
D /
BIA
12
RIBB
ONW
OOD
RD
MC C
AIN
VALL
EY R
D
CRES
TWOO
D RD
MC CAI
N VA
LLEY
RD
MANZ
ANIT
A CO
TTON
WOO
D RD
IndianIndianReservationReservation
Campo IndianCampo IndianReservationReservation
CampoCampoIndianIndian
ReservationReservation
CampoCampoIndianIndian
ReservationReservation
EwiiaapaaypEwiiaapaaypIndianIndian
ReservationReservation
La PostaLa PostaIndianIndian
ReservationReservation
ManzanitaManzanitaIndianIndian
ReservationReservationG-1
G-16
G-17
K-11
K-12
B-6
B-7
D-7
E-2
F-1
F-2
E-5 E-6E-7 E-8
E-11
G-10
G-2
B-2
B-3
E-12
D-1
D-2
D-3
B-4
G-3G-4
G-5
G-6
G-7
G-8
G-9
R-13G-11
G-12
G-13G-14
G-15
C-1
C-2
D-10
C-3
C-4
F-3
F-4
E-4
E-9E-10
D-9
G-18
R-11
D-4
D-5
A-1
A-2
A-3
B-5
A-4
D-6
D-8
A-5A-6
B-1
E-1E-3
R-12
R-1
R-2
R-3
R-4
R-5R-6
R-8
R-9R-7
R-10
L-7
L-6
L-5
L-3L-2
L-1
L-9
L-10
L-11N-4
N-5
N-6
N-3
N-2N-1
M-2
M-1
P-1
P-2
P-3P-4
P-5
L-4
K-8
K-5
J-3
J-4
Q-1
L-8
N-7N-8
K-7 J-15J-14
J-13
J-10J-9
J-8J-6
J-5
K-1
J-2
J-1
K-4
J-11K-3
K-2
Q-2
K-9A-8
A-7
B-8
B-9
C-6
C-5
F-6
F-5
G-19
Boulevard
Project LocationFIGURE 1
Iberdrola | Tule Wind Project | Noise Analysis
/ 0 1 20.5Miles
MEXICO
PACIFIC OCEAN
ALPINE
OCEANSIDEESCONDIDO
CORONADO
CARLSBAD
POWAY
SANMARCOS
CHULAVISTA
TEMECULADANAPOINT
BORREGOSPRINGS
§̈¦15
§̈¦15
§̈¦8
§̈¦8
§̈¦5
§̈¦5
§̈¦805
§̈¦5
§̈¦15
AB15
AB195
AB86
AB163
AB75
AB52
AB74AB79
AB371
AB79AB67
AB94AB94
AB79
AB78AB78
AB76
RIVERSIDE
SAN DIEGO
Cleveland NF
Anza-BorregoDesert State
Park
MapExtent
!( Proposed Turbine
Proposed New Roads
Existing Roads to be Improved
AB94
§̈¦8
!(
!(
!(
!(
!(
!(
!(
!(
!(
!(
!( !(!(
!(
!(
!(
!(
!(
!(
!(
!(
!(
!(
!(
!(
!(
!(
!(
!(
!(
!(
!(
!(
!(
!(
!(
!(
!(
!(
!(
!(
!(
!(
!(
!(
!(!(
!(
!(
!(
!(
!(
!(
!(
!(
!(
!(
!(
!(
!(
!(
!(
!(
!(
!(
!(
!(
!(
!(
!(
!(
!(
!(!(
!(
!(
!(
!(
!(
!(
!(
!(
!(
!(
!(
!(
!(
!(
!(
!(
!(
!(
!(
!(
!(
!(
!(
!(
!(
!(
!(
!(
!(
!(
!(
!(
!(!(
!(
!(
!(
!(
!(
!(
!(
!(
!(
!(
!(
!(!(
!(
!(
!(
!(
!(
!(
!(
!(
!(
!(
!(
!(
!(
!?
!?
!?
!?
!?
!?
Clev
elan
d Na
tiona
l For
est
Anza-Borrego DesertState Park
RED SHANK LN
OLD HIGHWAY 80
HI PASS RD
TIER
RA DE
L S O
L RD
ANGE
L D R
LI L
L IE LN
CAM TRES AVES
LILA
C TL
BLACKWOOD
RD
STARSH IP STWORTHINGTON
RD
SHAS
TA TL
BLACKWOO D RD
CHURCH RD
E NCIN
A VE
R DE
QUAI
L RU
N
MIL
LER
VALL
EY R D
H ON
EY
BEE LN
GREAT BLUE HERON WY
LILAC LN
RO SS AV
JEWEL VALLEY WY
MIL
LE
R
VALL
EY
R D
MANZAN ITA DUL
CE
CROSS RD
SOL WOOD
HUBBLE RD
OLD
M INE
RD
SHASTA WY
FLY ING CLO UD PL
CANE BR
AKE RD
JEW
EL V A
LLE Y
R D
WIL
LIA M
S R D
STAG ECOA CH S PRINGS RD
LIVE
OAK
SP
RINGS RD
LOST VALLEY RD
GREAT EAG
L E WY
THIN
G VA
LLEY
RD
LA POST
A TRUCK TR
AIL
WIL
LIAM
S RD
CRES
TWOO
D /
BIA
12
RIBB
ONW
OOD
RD
MC C
AIN
VALL
EY R
D
CRES
TWOO
D RD
MC CAI
N VA
LLEY
RD
MANZ
ANIT
A CO
TTON
WOO
D RD
IndianIndianReservationReservation
Campo IndianCampo IndianReservationReservation
CampoCampoIndianIndian
ReservationReservation
CampoCampoIndianIndian
ReservationReservation
EwiiaapaaypEwiiaapaaypIndianIndian
ReservationReservation
La PostaLa PostaIndianIndian
ReservationReservation
ManzanitaManzanitaIndianIndian
ReservationReservation
CottonwoodCampground
RoughAcresRanch
Home #42
Home #47
Home #28
Lark Canyon Campground
B-6
B-7
D-7
E-2
F-1
F-2
E-5 E-6E-7 E-8
E-11
G-1
G-12
B-2
B-3
E-12
D-1
D-2
D-3
B-4
G-3G-4
G-5
G-6
G-7
G-8
G-9
G-10G-11
G-13G-14
G-15
C-1
C-2
D-10
C-3
C-4
F-3
F-4
E-4
E-9E-10
D-9
G-18
R-11
D-4
D-5
A-1
A-2
A-3
B-5
A-4
D-6
D-8
A-5A-6
B-1
E-1E-3
R-12
R-1
R-2
R-3
R-4
R-5R-6
R-8
R-9R-7
R-10
L-7
L-6
L-5
L-3L-2
L-1
L-9
L-10
L-11
N-4N-5
N-6
N-3
N-2
N-1
M-2
M-1
P-1
P-2
P-3P-4
P-5
L-4
K-8
K-5
J-3
J-4
Q-1
L-8
N-7
K-7 J-15J-14
J-13
J-10J-9
J-8J-6
J-5
K-1
J-2
J-1
K-4
J-11K-3
K-2
N-8
K-9A-8
A-7
B-8
B-9
C-6
C-5
F-6
F-5
G-19
R-13
G-2
G-16
G-17
K-11
K-12
Q-2
Boulevard
Ambient Noise Monitoring LocationsFIGURE 2
Iberdrola | Tule Wind Project | Noise Analysis
/ 0 1 20.5Miles
!? Noise Monitoring Location
!( Proposed Turbine
Proposed New Roads
Existing Roads to be Improved
Figure 3. Average Daytime Leq(h) Noise Levels for Residential Environments
Figure 4. Average Nighttime Leq(h) Noise Levels for Residential Environments
0
10
20
30
40
50
60
70
Urban Residential
Area Near an Airport
Urban Residential
Area
Suburban Residential
Small Town Residential on a Cul de
Sac
Farm in Valley
Tule Wind Farm Project
Area (Average)
Soun
d Pr
essu
re L
evel
, dB
A
Noise Environment Type
0
10
20
30
40
50
60
Urban Residential Area Near an Airport
Urban Residential
Area
Suburban Residential
Small Town Residential on a Cul de
Sac
Farm in Valley
Tule Wind Farm
Project Area (Average)
Soun
d Pr
essu
re L
evel
, dB
A
Noise Environment Type
AB94
§̈¦8
!(
!(
!(
!(
!(
!(
!(
!(
!(
!(
!( !(!(
!(
!(
!(
!(
!(
!(
!(
!(
!(
!(
!(
!(
!(
!(
!(
!(
!(
!(
!(
!(
!(
!(
!(
!(
!(
!(
!(
!(
!(
!(
!(
!(
!(!(
!(
!(
!(
!(
!(
!(
!(
!(
!(
!(
!(
!(
!(
!(
!(
!(
!(
!(
!(
!(
!(
!(
!(
!(
!(
!(!(
!(
!(
!(
!(
!(
!(
!(
!(
!(
!(
!(
!(
!(
!(
!(
!(
!(
!(
!(
!(
!(
!(
!(
!(
!(
!(
!(
!(
!(
!(
!(
!(
!(!(
!(
!(
!(
!(
!(
!(
!(
!(
!(
!(
!(
!(!(
!(
!(
!(
!(
!(
!(
!(
!(
!(
!(
!(
!(
!(
$
$
$$$
$
$
$
$$$
$
$$ $$$
$
$$
$
$
$
$$
$$
ÆQ
ÆQ
Clev
elan
d Na
tiona
l For
est
Anza-Borrego DesertState Park
RED SHANK LN
OLD HIGHWAY 80
HI PASS RD
TIER
RA DE
L SO
L RD
ANGE
L DR
LI L
L IE LN
CAM TRES AVES
LILA
C TL
BLACKWOOD
RD
STARSH IP STWORTHINGTON
RD
SHAS
TA TL
BLACKWOO D RD
CHURCH RD
E NCIN
A V E
RDE
QUAI
L RU
N
MI L
LER
VALL
EY R D
H ONEY
BEE LN
GREAT BLUE HERON WY
LILAC LN
RO SS AV
JEWEL VALLEY WY
MIL
LE
R
VALL
EY
R D
MANZAN ITA DUL
CE
CROSS RD
SOL WOOD
HUBBLE RD
OLD
MINE
RD
SHASTA WY
FLYIN G C LOU D P L
CANE BR
AKE RD
JEW
EL V A
L LE Y
RD
WIL
L IA M
S R D
STAG ECOA CH SPRINGS RD
LIVE
OAK
SP
RINGS RD
LOST VA LLEY RD
PINION PINE TL
GREAT EAG
L E WY
THIN
G VA
LLE Y
RD
LA PO
STA TR
UCK TRAIL
WIL
LIAM
S RD
CRES
TWOO
D /
BIA
12
RIBB
ONW
OOD
RD
MC C
AIN
VALL
EY R
D
CRES
TWOO
D RD
MC CAI
N VA
LLEY
RD
MANZ
ANIT
A CO
TTON
WOO
D RD
IndianIndianReservationReservation
Campo IndianCampo IndianReservationReservation
CampoCampoIndianIndian
ReservationReservation
CampoCampoIndianIndian
ReservationReservation
EwiiaapaaypEwiiaapaaypIndianIndian
ReservationReservation
La PostaLa PostaIndianIndian
ReservationReservation
ManzanitaManzanitaIndianIndian
ReservationReservation
1
2-26
272829
30
31
32
3334
35
36
37
38
3940
41
42
4344
47
40B 41B
42B43B
E-11
F-5
G-19
G-16
G-17
K-11
K-12
B-6
B-7
D-7
E-2
F-1
F-2
E-5 E-6E-7 E-8
G-10
G-1G-2
B-2
B-3
E-12
D-1
D-2
D-3
B-4
G-3G-4
G-5
G-6
G-7
G-8
G-9
R-13
G-11G-12G-13
G-14G-15
C-1
C-2
D-10
C-3
C-4
F-3
F-4
E-4
E-9E-10
D-9
G-18
R-11
D-4
D-5
A-1
A-2
A-3
B-5
A-4
D-6
D-8
A-5A-6
B-1
E-1E-3
R-12
R-1
R-2
R-3
R-4
R-5R-6
R-8
R-9R-7
R-10
L-7
L-6
L-5
L-3L-2
L-1
L-9
L-10
L-11
N-4N-5
N-6
N-3
N-2N-1
M-2
M-1
P-1
P-2
P-3P-4
P-5
L-4
K-8
K-5
J-3
J-4
Q-1
L-8
N-7N-8
K-7 J-15J-14
J-13
J-10J-9
J-8J-6
J-5
K-1
J-2
J-1
K-4
J-11K-3
K-2
Q-2
K-9A-8
A-7
B-8
B-9
C-6
C-5
F-6
Boulevard
Cottonwood
Lark Canyon
Roadways and Noise Sensitive Land UsesFIGURE 5
Iberdrola | Tule Wind Project | Noise Analysis
/ 0 1 20.5Miles
!( Proposed Turbine
Proposed New Roads
Existing Roads to be Improved
Noise Sensitive Land Use$ Home
ÆQ BLM Land Camp Site
!(
!(
!(
!(
!(
!(
!(
!(
!(
!(
!( !(!(
!(
!(
!(
!(
!(
!(
!(
!(
!(
!(
!(
!(
!(
!(
!(
!(
!(
!(
!(
!(
!(
!(
!(
!(
!(
!(
!(
!(
!(
!(
!(
!(
!(!(
!(
!(
!(
!(
!(
!(
!(
!(
!(
!(
!(
!(
!(
!(
!(
!(!(
!(
!(
!(
!(
!(
!(
!(
!(
!(!(
!(
!(
!(
!(
!(
!(
!(
!(
!(
!(
!(
!(
!(
!(
!(
!(
!(
!(
!(
!(
!(
!(
!(
!(
!(
!(
!(
!(
!(
!(
!(
!(
!(!(
!(
!(
!(
!(
!(
!(
!(
!(
!(
!(
!(
!(!(
!(
!(
!(
!(
!(
!(
!(
!(
!(
!(
!(
!(
!(
$
$
$$$
$
$
$
$$$
$
$$ $$$
$
$$
$
$
$
ÆQ
ÆQ
Clev
elan
d Na
tiona
l For
est
Anza-Borrego DesertState Park
RED SHANK LN
OLD HIGHWAY 80
HI PASS RD
TIER
RA DE
L SO
L RD
ANGE
L DR
LI L
L IE LN
CAM TRES AVES
LILA
C TL
BLACKWOOD
RD
STARSH IP STWORTHINGTON
RD
SHAS
TA TL
BLACKWOO D RD
CHURCH RD
E NCIN
A V E
RDE
QUAI
L RU
N
MI L
LER
VALL
EY R D
H ONEY
BEE LN
GREAT BLUE HERON WY
LILAC LN
RO SS AV
JEWEL VALLEY WY
MIL
LE
R
VALL
EY
R D
MANZAN ITA DUL
CE
CROSS RD
SOL WOOD
HUBBLE RD
OLD
MINE
RD
SHASTA WY
FLYIN G C LOU D P L
CANE BR
AKE RD
JEW
EL V A
L LE Y
RD
WIL
L IA M
S R D
STAG ECOA CH SPRINGS RD
LIVE
OAK
SP
RINGS RD
LOST VA LLEY RD
PINION PINE TL
GREAT EAG
L E WY
THIN
G VA
LLE Y
RD
LA PO
STA TR
UCK TR
AIL
WIL
LIAM
S RD
CRES
TWOO
D /
BIA
12
RIBB
ONW
OOD
RD
MC C
AIN
VALL
EY R
D
CRES
TWOO
D RD
MC CAI
N VA
LLEY
RD
MANZ
ANIT
A CO
TTO N
WOO
D RD
IndianIndianReservationReservation
Campo IndianCampo IndianReservationReservation
CampoCampoIndianIndian
ReservationReservation
CampoCampoIndianIndian
ReservationReservation
EwiiaapaaypEwiiaapaaypIndianIndian
ReservationReservation
La PostaLa PostaIndianIndian
ReservationReservation
ManzanitaManzanitaIndianIndian
ReservationReservation
1
2-26
272829
30
31
32
3334
35
36
37
38
3940
41
42
4344
47
E-11
F-5
G-19
G-16
G-17
K-11
K-12
B-6
B-7
D-7
E-2
F-1
F-2
E-5 E-6E-7 E-8
G-10
G-1G-2
B-2
B-3
E-12
D-1
D-2
D-3
B-4
G-3G-4
G-5
G-6
G-7
G-8
G-9
R-13
G-11G-12G-13
G-14G-15
C-1
C-2
D-10
C-3
C-4
F-3
F-4
E-4
E-9E-10
D-9
G-18
R-11
D-4
D-5
A-1
A-2
A-3
B-5
A-4
D-6
D-8
A-5A-6
B-1
E-1E-3
R-12
R-1
R-2
R-3
R-4
R-5R-6
R-8
R-9R-7
R-10
L-7
L-6
L-5
L-3L-2
L-1
L-9
L-10
L-11
N-4N-5
N-6
N-3
N-2N-1
M-2
M-1
P-1
P-2
P-3P-4
P-5
L-4
K-8
K-5
J-3
J-4
Q-1
L-8
N-7N-8
K-7 J-15J-14
J-13
J-10J-9
J-8J-6
J-5
K-1
J-2
J-1
K-4
J-11K-3
K-2
Q-2
K-9A-8
A-7
B-8
B-9
C-6
C-5
F-6
Boulevard
Cottonwood
Lark Canyon
Turbine Layout and Property Boundary IdentificationFIGURE 6
Iberdrola | Tule Wind Project | Noise Analysis
/ 0 1 20.5Miles
!( Proposed Turbine
Noise Sensitive Land Use$ Home
ÆQ BLM Land Camp Site
Project Transmission LineProposed
Alternate
Deviant
FacTypProposed Substation
Proposed O&M Building
Alternate Substation
Alternate O&M Building
Deviant Substation
Deviant O&M Building
Proposed New Roads
Existing Roads to be Improved
OwnershipIndian Reservation
Private Parcel
RED SHANK LN
OLD HIGHWAY 80
HI PASS RD
TIER
RA DE
L SO
L RD
ANGE
L DR
L IL
L IE LN
CAM TRES AVES
LILA
C TL
BLACKWOOD
RD
STARSH IP STWORTHINGTON
RD
SHAS
TA TL
BLACKWOO D RD
CHURCH RD
E NCIN
A VE
RDE
QUAI
L RU
N
MILL
ER VA
LLEY
RD
H ON
EY
BEE LN
GREAT BLUE HERON WY
LILAC LN
RO SS A V
JEWEL VALLEY WY
MIL
LE
R
VALL
EY
R D
MANZAN ITA DUL
CE
CROSS RD
SOL WOOD
HUBBLE RD
OLD
MI N
E RD
SHASTA WY
FL YIN G CL OUD PL
CANE BR
AKE RDJE
WE L
VALL
EY R D
WIL
LIAM
S RD
STAG ECOA CH S PRINGS RD
LIVE
O AK
SP
RINGS RD
LOST VA LLEY RD
PINION PINE TL
GREAT EAG
L E WY
THIN
G VA
LLEY
RD
WIL
LIAM
S RD
CRES
TWOO
D /
BIA
12
RIBB
ONW
OOD
RD
MC C
AIN
VALL
EY R
D
CRES
TWOO
D RD
MC CAI
N VA
LLEY
RD
MANZ
ANIT
A CO
TTON
WO O
D RD
AB94
§̈¦8
!(
!(
!(
!(
!(
!(
!(
!(
!(
!(
!( !(!(
!(
!(
!(
!(
!(
!(
!(
!(
!(
!(
!(
!(
!(
!(
!(
!(
!(
!(
!(
!(
!(
!(
!(
!(
!(
!(
!(
!(
!(
!(
!(
!(
!(!(
!(
!(
!(
!(
!(
!(
!(
!(
!(
!(
!(
!(
!(
!(
!(
!(
!(
!(
!(
!(
!(
!(
!(
!(
!(
!(!(
!(
!(
!(
!(
!(
!(
!(
!(
!(
!(
!(
!(
!(
!(
!(
!(
!(
!(
!(
!(
!(
!(
!(
!(
!(
!(
!(
!(
!(
!(
!(
!(
!(!(
!(
!(
!(
!(
!(
!(
!(
!(
!(
!(
!(
!(!(
!(
!(
!(
!(
!(
!(
!(
!(
!(
!(
!(
!(
!(
$
$
$$$
$
$
$
$$$
$
$$ $$$
$
$$
$
$
$
ÆQ
ÆQ
StateStateof Californiaof California
LandsLandsCommissionCommission
BLMBLMLandLand
BLM LandBLM Land
IndianIndianReservationReservation
Campo IndianCampo IndianReservationReservation
CampoCampoIndianIndian
ReservationReservation
CampoCampoIndianIndian
ReservationReservation
EwiiaapaaypEwiiaapaaypIndianIndian
ReservationReservation
State ofState ofCaliforniaCalifornia
(Conservation)(Conservation)
BLM LandBLM Land
BLM LandBLM Land
La PostaLa PostaIndianIndian
ReservationReservation
ManzanitaManzanitaIndianIndian
ReservationReservation
1
2-2627
28
29
30
31
32
3334
35
36
37
38
3940
41
42
4344
47
LarkCanyon
Cottonwood
G-16
G-17
K-11
K-12
B-6
B-7
D-7
E-2
F-1
F-2
E-5 E-6
E-7E-8
E-11
G-1G-2
B-2
B-3
E-12
D-1D-2
D-3
B-4
G-3G-4
G-5
G-6
G-7
G-8
G-9
G-10
G-11G-12G-13
G-14G-15
C-1
C-2
D-10
C-3
C-4
F-3
F-4
E-4
E-9E-10
D-9
G-18
R-11
D-4
D-5
A-1
A-2
A-3
B-5
A-4
D-6
D-8
A-5A-6
B-1
E-1E-3
R-12
R-1
R-2
R-3
R-4
R-5R-6
R-8
R-9R-7
R-10
L-7
L-6
L-5
L-3L-2
L-1
L-9L-10
L-11N-4
N-5
N-6
N-3
N-2N-1
M-2
M-1
P-1
P-2
P-3P-4
P-5
L-4
K-8
K-5
J-3
J-4
Q-1
L-8
N-7N-8
K-7 J-15
J-14
J-13
J-10J-9
J-8J-6
J-5
K-1
J-2
J-1
K-4
J-11K-3
K-2
Q-2
K-9A-8
A-7
B-8
B-9
C-6
C-5
F-6
F-5
G-19
R-13
San Diego County Noise Ordinance ZonesFIGURE 7
Iberdrola Renewables | Tule Wind Project | Applicant’s Environmental Document
| G:\GIS_Production\Projects\IberdrolaRenew_424914\TuleWindEnergy_115965\14_00_GIS_MODELS\14_03_Map_Docs\14_03_04_mxd\EIR\General_plan.mxd | Created by: AB, YL | Last Updated : 03-25-10
/ 0 1 20.5Miles
!( Proposed Turbine Location
Noise Sensitive Land Use$ Home
ÆQ BLM Land Camp Site
Noise Ordinance ClassificationZone 1
Zone 2
Zone 3
Zone 7
Residence Occupied Parcel
OwnershipBLM Land
Indian Reservation
State of California (Conservation)
State of California Lands Commission
RED SHANK LN
OLD HIGHWAY 80
HI PASS RD
TIER
RA DE
L SO
L RD
ANGE
L DR
L IL
L IE LN
CAM TRES AVES
LILA
C TL
BLACKWOOD
RD
STARSH IP STWORTHINGTON
RD
SHAS
TA TL
BLACKWOO D RD
CHURCH RD
E NCIN
A VE
RDE
QUAI
L RU
N
MILL
ER VA
LLEY
RD
H ON
EY
BEE LN
GREAT BLUE HERON WY
LILAC LN
RO SS A V
JEWEL VALLEY WY
MIL
LE
R
VALL
EY
R D
MANZAN ITA DUL
CE
CROSS RD
SOL WOOD
HUBBLE RD
OLD
MI N
E RD
SHASTA WY
FL YIN G CL OUD PL
CANE BR
AKE RDJE
WE L
VALL
EY R D
WIL
LIAM
S RD
STAG ECOA CH S PRINGS RD
LIVE
O AK
SP
RINGS RD
LOST VA LLEY RD
PINION PINE TL
GREAT EAG
L E WY
THIN
G VA
LLEY
RD
WIL
LIAM
S RD
CRES
TWOO
D /
BIA
12
RIBB
ONW
OOD
RD
MC C
AIN
VALL
EY R
D
CRES
TWOO
D RD
MC CAI
N VA
LLEY
RD
MANZ
ANIT
A CO
TTON
WO O
D RD
AB94
§̈¦8
!(
!(
!(
!(
!(
!(
!(
!(
!(
!(
!( !(!(
!(
!(
!(
!(
!(
!(
!(
!(
!(
!(
!(
!(
!(
!(
!(
!(
!(
!(
!(
!(
!(
!(
!(
!(
!(
!(
!(
!(
!(
!(
!(
!(
!(!(
!(
!(
!(
!(
!(
!(
!(
!(
!(
!(
!(
!(
!(
!(
!(
!(
!(
!(
!(
!(
!(
!(
!(
!(
!(
!(!(
!(
!(
!(
!(
!(
!(
!(
!(
!(
!(
!(
!(
!(
!(
!(
!(
!(
!(
!(
!(
!(
!(
!(
!(
!(
!(
!(
!(
!(
!(
!(
!(
!(!(
!(
!(
!(
!(
!(
!(
!(
!(
!(
!(
!(
!(!(
!(
!(
!(
!(
!(
!(
!(
!(
!(
!(
!(
!(
!(
$
$
$$$
$
$
$
$$$
$
$$ $$$
$
$$
$
$
$
ÆQ
ÆQ
1
2-2627
28
29
30
31
32
3334
35
36
37
38
3940
41
42
4344
47
LarkCanyon
Cottonwood
G-16
G-17
K-11
K-12
B-6
B-7
D-7
E-2
F-1
F-2
E-5 E-6E-7 E-8
E-11
G-1G-2
B-2
B-3
E-12
D-1D-2
D-3
B-4
G-3G-4
G-5
G-6
G-7
G-8
G-9
G-10
G-11
G-12G-13
G-14G-15
C-1
C-2
D-10
C-3
C-4
F-3
F-4
E-4
E-9E-10
D-9
G-18
R-11
D-4
D-5
A-1
A-2
A-3
B-5
A-4
D-6
D-8
A-5A-6
B-1
E-1E-3
R-12
R-1
R-2
R-3
R-4
R-5R-6
R-8
R-9R-7
R-10
L-7
L-6
L-5
L-3L-2
L-1
L-9
L-10L-11
N-4
N-5
N-6
N-3
N-2N-1
M-2
M-1
P-1
P-2P-3P-4
P-5
L-4
K-8
K-5
J-3
J-4
Q-1
L-8
N-7N-8
K-7 J-15
J-14
J-13
J-10J-9
J-8J-6
J-5
K-1
J-2
J-1
K-4
J-11K-3
K-2
Q-2
K-9A-8
A-7
B-8
B-9
C-6
C-5
F-6
F-5
G-19
R-13
GE 1.5 XLE Noise ContoursFIGURE 8
Iberdrola Renewables| Tule Wind Project | Applicant’s Environmental Document
| G:\GIS_Production\Projects\IberdrolaRenew_424914\TuleWindEnergy_115965\14_00_GIS_MODELS\14_03_Map_Docs\14_03_04_mxd\EIR\General_plan.mxd | Created by: AB, YL | Last Updated : 03-25-10
/ 0 1 20.5Miles
!( Proposed Turbine Location
Noise Sensitive Land Use$ Home
ÆQ BLM Land Camp Site
GE 1.5 XLE Noise ContourHourly Leq, dBA
31 - 33
33 - 36
36- 39
39 - 42
42 - 46
46 - 49
49- 52
52 - 55
55 - 58
58 - 62
5400
5200
5000
5000
5200
5400
5600
40003800
4000
2600
20001800
5600
4600
44004200
4000
56 00
36003400
3200
6200 560 0
2800
2400
2200
30002800
4800
4000
1200 1000
1600
1400
3200
4600
440042004000
4800
480 0
3400
2800
3000
5600
18 00
1600
32003000
5200
2 00 01600
3600
4200
2800
1600
500 0
360 0
3800
3400
1800
5200
22005600
3800
4200
4800
3800
4400
4200
1400
5600
1800
1600
1600
3600
4200
4000
3600
4400
1000
4200
4200
1600
200 0
1800
160050
00
1800 1600
1400
5600
1800
4800
1600
5000
160 0
1600
3400
3200
1800
4000
1800
3000
140040
00
4800
4000
4000
4200
3200
4400
4800
4000
4000
4000
5000
3600
RED SHANK LN
OLD HIGHWAY 80
HI PASS RD
TIER
RA DE
L SO
L RD
ANGE
L DR
L IL
L IE LN
CAM TRES AVES
LILA
C TL
BLACKWOOD
RD
STARSH IP STWORTHINGTON
RD
SHAS
TA TL
BLACKWOO D RD
CHURCH RD
E NCIN
A VE
RDE
QUAI
L RU
N
MILL
ER VA
LLEY
RD
H ON
EY
BEE LN
GREAT BLUE HERON WY
LILAC LN
RO SS A V
JEWEL VALLEY WY
MIL
LE
R
VALL
EY
R D
MANZAN ITA DUL
CE
CROSS RD
SOL WOOD
HUBBLE RD
OLD
MI N
E RD
SHASTA WY
FL YIN G CL OUD PL
CANE BR
AKE RDJE
WE L
VALL
EY R D
WIL
LIAM
S RD
STAG ECOA CH S PRINGS RD
LIVE
O AK
SP
RINGS RD
LOST VA LLEY RD
PINION PINE TL
GREAT EAG
L E WY
THIN
G VA
LLEY
RD
WIL
LIAM
S RD
CRES
TWOO
D /
BIA
12
RIBB
ONW
OOD
RD
MC C
AIN
VALL
EY R
D
CRES
TWOO
D RD
MC CAI
N VA
LLEY
RD
MANZ
ANIT
A CO
TTON
WO O
D RD
AB94
§̈¦8
!(
!(
!(
!(
!(
!(
!(
!(
!(
!(
!( !(!(
!(
!(
!(
!(
!(
!(
!(
!(
!(
!(
!(
!(
!(
!(
!(
!(
!(
!(
!(
!(
!(
!(
!(
!(
!(
!(
!(
!(
!(
!(
!(
!(
!(!(
!(
!(
!(
!(
!(
!(
!(
!(
!(
!(
!(
!(
!(
!(
!(
!(
!(
!(
!(
!(
!(
!(
!(
!(
!(
!(!(
!(
!(
!(
!(
!(
!(
!(
!(
!(
!(
!(
!(
!(
!(
!(
!(
!(
!(
!(
!(
!(
!(
!(
!(
!(
!(
!(
!(
!(
!(
!(
!(
!(!(
!(
!(
!(
!(
!(
!(
!(
!(
!(
!(
!(
!(!(
!(
!(
!(
!(
!(
!(
!(
!(
!(
!(
!(
!(
!(
$
$
$$$
$
$
$
$$$
$
$$ $$$
$
$$
$
$
$
ÆQ
ÆQ
1
2-2627
28
29
30
31
32
3334
35
36
37
38
3940
41
42
4344
47
LarkCanyon
Cottonwood
G-16
G-17
K-11
K-12
B-6
B-7
D-7
E-2
F-1
F-2
E-5 E-6E-7 E-8
E-11
G-1G-2
B-2
B-3
E-12
D-1D-2
D-3
B-4
G-3G-4
G-5
G-6
G-7
G-8
G-9
G-10
G-11
G-12G-13
G-14G-15
C-1
C-2
D-10
C-3
C-4
F-3
F-4
E-4
E-9E-10
D-9
G-18
R-11
D-4
D-5
A-1
A-2
A-3
B-5
A-4
D-6
D-8
A-5A-6
B-1
E-1E-3
R-12
R-1
R-2
R-3
R-4
R-5
R-6
R-8
R-9R-7
R-10
L-7
L-6
L-5
L-3L-2
L-1
L-9L-10
L-11
N-4
N-5
N-6
N-3N-2
N-1
M-2
M-1
P-1
P-2
P-3
P-4
P-5
L-4
K-8
K-5
J-3
J-4
Q-1
L-8
N-7
N-8
K-7 J-15J-14
J-13
J-10J-9
J-8J-6
J-5
K-1
J-2
J-1
K-4
J-11K-3
K-2
Q-2
K-9A-8
A-7
B-8
B-9
C-6
C-5
F-6
F-5
G-19
R-13
GE dBC Noise ContoursFIGURE 9
Iberdrola Renewables | Tule Wind Project | Applicant’s Environmental Document
| G:\GIS_Production\Projects\IberdrolaRenew_424914\TuleWindEnergy_115965\14_00_GIS_MODELS\14_03_Map_Docs\14_03_04_mxd\EIR\General_plan.mxd | Created by: AB, YL | Last Updated : 03-25-10
/ 0 1 20.5Miles
!( Proposed Turbine Location
Noise Sensitive Land Use$ Home
ÆQ BLM Land Camp Site
GE dBC Noise ContourHourly Leq, dBC
45- 46
46 - 49
49 - 52
52 - 54
54 - 57
57 - 60
60 - 62
62 - 65
65- 68
68- 71
Figure 10. 138 kV Transmission Line Corona Noise
0
5
10
15
20
25
-400 -300 -200 -100 0 100 200 300 400
Cor
ona
Noi
se, d
BA
Distance from Center Pole, feet
138 kV Transmission Line Corona Noise
AB94
§̈¦8
$
$
$$$
$
$
$
$$$
$
$$ $$$
$
$$
$
$
$
ÆQ
ÆQ
Clev
elan
d Na
tiona
l For
est
Anza-Borrego DesertState Park
RED SHANK LN
OLD HIGHWAY 80
HI PASS RD
TIER
RA DE
L SO
L RD
ANGE
L DR
LI L
L IE LN
CAM TRES AVES
LILA
C TL
BLACKWOOD
RD
STARSH IP STWORTHINGTON
RD
SHAS
TA TL
BLACKWOO D RD
CHURCH RD
E NCIN
A V E
RDE
QUAI
L RU
N
MI L
LER
VALL
EY R D
H ONEY
BEE LN
GREAT BLUE HERON WY
LILAC LN
RO SS AV
JEWEL VALLEY WY
MIL
LE
R
VALL
EY
R D
MANZAN ITA DUL
CE
CROSS RD
SOL WOOD
HUBBLE RD
OLD
MINE
RD
SHASTA WY
FLYIN G C LOU D P L
CANE BR
AKE RD
JEW
EL V A
L LE Y
RD
WIL
L IA M
S R D
STAG ECOA CH SPRINGS RD
LIVE
OAK
SP
RINGS RD
LOST VA LLEY RD
PINION PINE TL
GREAT EAG
L E WY
THIN
G VA
LLE Y
RD
LA PO
STA TR
UCK TRAIL
WIL
LIAM
S RD
CRES
TWOO
D /
BIA
12
RIBB
ONW
OOD
RD
MC C
AIN
VALL
EY R
D
CRES
TWOO
D RD
MC CAI
N VA
LLEY
RD
MANZ
ANIT
A CO
TTON
WOO
D RD
IndianIndianReservationReservation
Campo IndianCampo IndianReservationReservation
CampoCampoIndianIndian
ReservationReservation
CampoCampoIndianIndian
ReservationReservation
EwiiaapaaypEwiiaapaaypIndianIndian
ReservationReservation
La PostaLa PostaIndianIndian
ReservationReservation
ManzanitaManzanitaIndianIndian
ReservationReservation
1
2-26
272829
30
31
32
3334
35
36
37
38
3940
41
42
4344
47
Boulevard
Lark Canyon
Cottonwood
Rough Grading and Turbine Tower Base Construction LimitsFIGURE 11
Iberdrola Renewables | Tule Wind Project | Noise Analysis
/ 0 1 20.5Miles
Rough Grading and TurbineTower Base Construction Limits
Noise Sensitive Land Use$ Home
ÆQ BLM Land Camp Site
AB94
§̈¦8
$
$
$$$
$
$
$
$$$
$
$$ $$$
$
$$
$
$
$
ÆQ
ÆQ
Clev
elan
d Na
tiona
l For
est
Anza-Borrego DesertState Park
RED SHANK LN
OLD HIGHWAY 80
HI PASS RD
TIER
RA DE
L SO
L RD
ANGE
L DR
L IL
L IE LN
CAM TRES AVES
LILA
C TL
BLACKWOOD
RD
STARSH IP STWORTHINGTON
RD
SHAS
TA TL
BLACKWOO D RD
CHURCH RD
E NCIN
A VE
R DE
QUAI
L RU
N
M ILL
ER VA
LLEY
R D
H ON
EY
BEE LN
GREAT BLUE HERON WY
LILAC LN
RO SS A V
JEWEL VALLEY WY
MIL
LE
R
VALL
EY
R D
MANZAN ITA DUL
CE
CROSS RD
SOL WOOD
HUBBLE RD
OLD
MI N
E RD
SHASTA WY
FLY ING CLO UD PL
CANE BR
AKE RD
JEW
EL VA
LLEY
R D
WIL
LIA M
S RD
STAG ECOA CH S PRINGS RD
LIVE
OAK
SP
RINGS RD
LOST VA LLEY RD
PINION PINE TL
GREAT EAG
L E WY
THIN
G VA
LLEY
RD
WIL
LIAM
S RD
CRES
TWOO
D /
BIA
12
RIBB
ONW
OOD
RD
MC C
AIN
VALL
EY R
D
CRES
TWOO
D RD
MC CAI
N VA
LLEY
RD
MANZ
ANIT
A CO
TTON
WOO
D RD
IndianIndianReservationReservation
Campo IndianCampo IndianReservationReservation
CampoCampoIndianIndian
ReservationReservation
CampoCampoIndianIndian
ReservationReservation
EwiiaapaaypEwiiaapaaypIndianIndian
ReservationReservation
La PostaLa PostaIndianIndian
ReservationReservation
ManzanitaManzanitaIndianIndian
ReservationReservation
1
2-26
272829
30
31
32
3334
35
36
37
38
3940
41
42
4344
46
47
Boulevard
Lark Canyon
Cottonwood
Underground Utility Construction LimitsFIGURE 12
Iberdrola Renewables | Tule Wind Project | Noise Analysis
/ 0 1 20.5Miles
Underground Utility Construction Limits
Noise Sensitive Land Use$ Home
ÆQ BLM Land Camp Site
AB94
§̈¦8
$
$
$$$
$
$
$
$$$
$
$$ $$$
$
$$
$
$
$
ÆQ
ÆQ
Clev
elan
d Na
tiona
l For
est
Anza-Borrego DesertState Park
RED SHANK LN
OLD HIGHWAY 80
HI PASS RD
TIER
RA DE
L S O
L RD
ANGE
L D R
LI L
L IE LN
CAM TRES AVES
LILA
C TL
BLACKWOOD
RD
STARSH IP STWORTHINGTON
RD
SHAS
TA TL
BLACKWOO D RD
CHURCH RD
E NCIN
A VE
R DE
Q UAI
L RU
N
M ILL
ER VA
LLEY
R D
H ON
EY
BEE LN
GREAT BLUE HERON WY
LILAC LN
RO SS AV
JEWEL VALLEY WY
MIL
LE
R
VALL
EY
R D
MANZAN ITA DUL
CE
CROSS RD
SOL WOOD
HUBBLE RD
OLD
MIN
E RD
SHASTA WY
FLYI NG C LO UD PL
CANE BR
AKE RD
JEW
EL V A
L LE Y
R D
WIL
LIA M
S R D
STAGECOA CH S PRINGS RD
LIVE
OAK
SP
RINGS RD
LOST VALLEY RD
PINION PINE TL
GREAT E AG
L E WY
THIN
G VA
LLEY
RD
LA POST
A TRUCK TR
AIL
WIL
LIAM
S RD
CRES
TWOO
D /
BIA
12
RIBB
ONW
OOD
RD
MC C
AIN
VALL
EY R
D
CRES
TWOO
D RD
MC CAI
N VA
LLEY
RD
MANZ
ANIT
A CO
TTON
WOO
D RD
IndianIndianReservationReservation
Campo IndianCampo IndianReservationReservation
CampoCampoIndianIndian
ReservationReservation
CampoCampoIndianIndian
ReservationReservation
EwiiaapaaypEwiiaapaaypIndianIndian
ReservationReservation
La PostaLa PostaIndianIndian
ReservationReservation
ManzanitaManzanitaIndianIndian
ReservationReservation
1
2-26
272829
30
31
32
3334
35
36
37
38
3940
41
42
4344
47
Boulevard
Lark Canyon
Cottonwood
Turbine Tower Construction LimitsFIGURE 13
Iberdrola Renewables | Tule Wind Project | Noise Analysis
/ 0 1 20.5Miles
Turbine Tower BaseConstruction Limits
Noise Sensitive Land Use$ Home
ÆQ BLM Land Camp Site
AB94
§̈¦8
$$$$
$$
$$$
$$$$$$$$$$$$$$$$$$$$$$$$ $
$$
$$$
$$
$$
$
$
$$$
$
$
$
$$$
$
$$ $$$
$
$$
$
$
$
ÆQ
ÆQ
Clev
elan
d Na
tiona
l For
est
Anza-Borrego DesertState Park
RED SHANK LN
OLD HIGHWAY 80
HI PASS RD
TIER
RA DE
L SO
L RD
ANGE
L DR
LI L
L IE LN
CAM TRES AVES
LILA
C TL
BLACKWOOD
RD
STARSH IP STWORTHINGTON
RD
SHAS
TA TL
BLACKWOO D RD
CHURCH RD
E NCIN
A V E
RDE
QUAI
L RU
N
MILL
ER VA
LLEY
R D
H ONEY
BEE LN
GREAT BLUE HERON WY
LILAC LN
RO SS AV
JEWEL VALLEY WY
MIL
LE
R
VALL
EY
R D
MANZAN ITA DUL
CE
CROSS RD
SOL WOOD
HUBBLE RD
OLD
MI N
E RD
SHASTA WY
FLYIN G C LOU D P L
CANE BR
AKE RD
JEW
EL V A
L LE Y
RD
WIL
L IA M
S R D
STAG ECOA CH SPRINGS RD
LIVE
OAK
SP
RINGS RD
LOST VA LLEY RD
PINION PINE TL
GREAT EAG
L E WY
THIN
G VA
LLE Y
RD
LA PO
STA TR
UCK TRAIL
WIL
LIAM
S RD
CRES
TWOO
D /
BIA
12
RIBB
ONW
OOD
RD
MC C
AIN
VALL
EY R
D
CRES
TWOO
D RD
MC CAI
N VA
LLEY
RD
MANZ
ANIT
A CO
TTO N
WOO
D RD
IndianIndianReservationReservation
Campo IndianCampo IndianReservationReservation
CampoCampoIndianIndian
ReservationReservation
CampoCampoIndianIndian
ReservationReservation
EwiiaapaaypEwiiaapaaypIndianIndian
ReservationReservation
La PostaLa PostaIndianIndian
ReservationReservation
ManzanitaManzanitaIndianIndian
ReservationReservation
1
2-26
272829
30
31
32
3334
35
36
37
38
3940
41
42
4344
47
Boulevard
Lark Canyon
Cottonwood
Transmission Construction LimitsFIGURE 14
Iberdrola Renewables | Tule Wind Project | Noise Analysis
/ 0 1 20.5Miles
$
$
$
$
$ $
$
$$
$$$$$$
$$
$
$$$$$
$$$
$$
$ $ $$ $ $
$
$
$$
$
$
$
$
$
$
1B
2B3B
4B
5B 6B
7B
8B 9B
10B11B
12B13B
14B15B
16B17B
18B
19B20B
21B22B
23B
24B
25B26B27B
28B
29B30B
31B
32B
33B
34B
35B36B
37B
38B
39B40B
41B
42B
43B
36
MANZ
ANIT
A W
Y
OLD HIGHWAY 80
JEW
EL VA
L LEY
RD
EADY LN
PUBLIC RD
AVNDA DE
ROBLES VERD
TULE
J IM
LNMOONRI SE
TL
JEWEL VALLEY WY
ROCKY KNOLL RD
MAN
Z ANITA DULCE
ROSS
AV
FL YI NG CL OU D
P L
RIBBONWOOD
RD
M C CA
IN VA
LLEY
RD
EVENING SHADOW LN
Transmission LineConstruction Limits
Noise Sensitive Land Use$ Home
ÆQ BLM Land Camp Site
$Transmission Line ConstructionNoise Sensitive Land Use
Inset A Map Area
Inset A
0 2,000 4,0001,000Feet
AB94
§̈¦8
$
$
$
$$$$$
Clev
elan
d Na
tiona
l For
est
Anza-Borrego DesertState Park
RED SHANK LN
OLD HIGHWAY 80
HI PASS RD
TIER
RA DE
L SO
L RD
ANGE
L DR
LI L
L IE LN
CAM TRES AVES
LILA
C TL
BLACKWOOD
RD
STARSH IP STWORTHINGTON
RD
SHAS
TA TL
BLACKWOO D RD
CHURCH RD
E NCIN
A V E
RDE
QUAI
L RU
N
MI L
LER
VALL
EY R D
H ONEY
BEE LN
GREAT BLUE HERON WY
LILAC LN
RO SS AV
JEWEL VALLEY WY
MIL
LE
R
VALL
EY
R D
MANZAN ITA DUL
CE
CROSS RD
SOL WOOD
HUBBLE RD
OLD
MINE
RD
SHASTA WY
FLYIN G C LOU D P L
CANE BR
AKE RD
JEW
EL V A
L LE Y
RD
WIL
L IA M
S R D
STAG ECOA CH SPRINGS RD
LIVE
OAK
SP
RINGS RD
LOST VA LLEY RD
GREAT EAG
L E WY
THIN
G VA
LLE Y
RD
WIL
LIAM
S RD
CRES
TWOO
D /
BIA
12
RIBB
ONW
OOD
RD
MC C
AIN
VALL
EY R
D
CRES
TWOO
D RD
MC CAI
N VA
LLEY
RD
MANZ
ANIT
A CO
TTON
WOO
D RD
IndianIndianReservationReservation
Campo IndianCampo IndianReservationReservation
CampoCampoIndianIndian
ReservationReservation
CampoCampoIndianIndian
ReservationReservation
EwiiaapaaypEwiiaapaaypIndianIndian
ReservationReservation
La PostaLa PostaIndianIndian
ReservationReservation
ManzanitaManzanitaIndianIndian
ReservationReservation
2-26
27
30
3334
35 4344
Boulevard
Roadway Construction Temporary Noise Impacts LimitsFIGURE 15
Iberdrola Renewables | Tule Wind Project | Noise Analysis
/ 0 1 20.5Miles
Rough Grading for Roadway Construction
$ Impacted Home
AB94
§̈¦8
$$$$
$$
$$$
$$$$$$$$$$$$$$$$$$$$$$$$ $
$$
$$$
$
$$
$
$
$$ $$$
$
$
Clev
elan
d Na
tiona
l For
est
Anza-Borrego DesertState Park
RED SHANK LN
OLD HIGHWAY 80
HI PASS RD
TIER
RA DE
L SO
L RD
ANGE
L DR
LI L
L IE LN
CAM TRES AVES
LILA
C TL
BLACKWOOD
RD
STARSH IP STWORTHINGTON
RD
SHAS
TA TL
BLACKWOO D RD
CHURCH RD
E NCIN
A V E
RDE
QUAI
L RU
N
MILL
ER VA
LLEY
R D
H ONEY
BEE LN
GREAT BLUE HERON WY
LILAC LN
RO SS AV
JEWEL VALLEY WY
MIL
LE
R
VALL
EY
R D
MANZAN ITA DUL
CE
CROSS RD
SOL WOOD
HUBBLE RD
OLD
MI N
E RD
SHASTA WY
FLYIN G C LOU D P L
CANE BR
AKE RD
JEW
EL V A
L LE Y
RD
WIL
L IA M
S R D
STAG ECOA CH SPRINGS RD
LIVE
OAK
SP
RINGS RD
LOST VA LLEY RD
PINION PINE TL
GREAT EAG
L E WY
THIN
G VA
LLE Y
RD
LA PO
STA TR
UCK TRAIL
WIL
LIAM
S RD
CRES
TWOO
D /
BIA
12
RIBB
ONW
OOD
RD
MC C
AIN
VALL
EY R
D
CRES
TWOO
D RD
MC CAI
N VA
LLEY
RD
MANZ
ANIT
A CO
TTO N
WOO
D RD
IndianIndianReservationReservation
Campo IndianCampo IndianReservationReservation
CampoCampoIndianIndian
ReservationReservation
CampoCampoIndianIndian
ReservationReservation
EwiiaapaaypEwiiaapaaypIndianIndian
ReservationReservation
La PostaLa PostaIndianIndian
ReservationReservation
ManzanitaManzanitaIndianIndian
ReservationReservation
2-26
2829
30
31
37
38
3940
41
47
Boulevard
Transmission Line Construction Temporary Noise ImpactsFIGURE 16
Iberdrola Renewables | Tule Wind Project | Noise Analysis
/ 0 1 20.5Miles
$
$
$
$
$ $
$
$$
$$$$$$
$$
$
$$$$$
$$$
$$
$ $ $$ $ $
$
$
$$
$
$
$
1B
2B3B
4B
5B 6B
7B
8B 9B
10B11B
12B13B
14B15B
16B17B
18B
19B20B
21B22B
23B
24B
25B26B27B
28B
29B30B
31B
32B
33B
34B
35B36B
37B
38B
39B40B
43B
MANZ
ANIT
A W
Y
OLD HIGHWAY 80
JEW
EL VA
L LEY
RD
EADY LN
PUBLIC RD
AVNDA DE
ROBLES VERD
TULE
J IM
LNMOONRI SE
TL
JEWEL VALLEY WY
ROCKY KNOLL RD
MAN
Z ANITA DULCE
ROSS
AV
FL YI NG CL OU D
P L
RIBBONWOOD
RD
M C CA
IN VA
LLEY
RD
EVENING SHADOW LN
Transmission LineConstruction Limits
$Transmission Line ConstructionImpacts without Mitigation
Inset A Map Area
Inset A
0 2,000 4,0001,000Feet
APPENDIX A
NOISE MONITORING RESULTS BY LOCATION
Noise Analysis
Tule Wind Project Page A‐1 August 2010 Iberdrola Renewables, Inc.
APPENDIX A NOISE MONITORING RESULTS BY LOCATION
Project: Tule Subject: Monitoring Location - Cottonwood Campground
Tule Wind Project Page C‐1 August 2010 Iberdrola Renewables, Inc.
Appendix C Transformer Noise Source Calculation
Project: Tule Computed GR Date 5/11/2010 Subject: Tule Substation Noise Checked Date Task: Substation Noise Calc Sheet 1 Of 1
Calculate the Transformer Side Wall Area 10*Log (S) = 14 + 2.5 * Log (MVA) ref. Electric Power Plant Environmental Noise Guide Volume 1Chapter 4.2.5 eq. 5
Transformer Rating 100 MVA Surface area of four side walls, S 79 m2
Approximate NEMA Sound Rating for Standard (unquieted) Transformer NEMA sound rating ≈ 55 + 12 * Log (MVA) ref. Electric Power Plant Environmental Noise Guide Volume 1Chapter 4.2.5 eq. 2
Transformer Rating 100 MVA NEMA Rating 79
Calculate A-weighted Sound Power Level Lw = NEMA Sound Rating + 10 * LOG (S) ref. Electric Power Plant Environmental Noise Guide Volume 1Chapter 4.2.5 eq. 4
NEMA Sound Rating 79 Lw(A) 98 dBA
Tule Wind Project Page C‐2 August 2010 Iberdrola Renewables, Inc.
This page intentionally left blank.
APPENDIX D
CADNA-A MODEL VALIDATION
Noise Analysis
Tule Wind Project Page D‐1 August 2010 Iberdrola Renewables, Inc.
APPENDIX D CADNA-A MODEL VALIDATION
Project: Tule Wind Computed: EBD Date: 1/13/2010 Subject: Hand Calculation Checked: Date: Task: Noise Analysis Page No: 1 of: 1 Job#: Cadna‐A uses as the basis for its models, the ISO standard 9613‐2, "Acoustics ‐ Attenuation of sound during propagation outdoors ‐ Part 2: General method of calculation." This standard describes methods and formulae for predicting sound levels at a distance from sound sources. This is based on certain definable variables which describe the sound propagation characteristics between the source and receiver. This section has a spreadsheet/hand‐calculation according to the 1996 First Edition of ISO 9613‐2, and compares it to the results of a Cadna‐A model with the same parameters. The following table shows the parameters used in the calculation.
Source Height hs 80.0 m Receiver Height hr 1.5 m Diagonal Source-Receiver Distance d 100.6 m
Ambient Temperature 10.0 °C
Relative Humidity 70.0 % Ground Factor G 0.0
The result of the model calculation is the equivalent continuous downwind octave‐band sound pressure level at the receiver location. This is formula (3) in ISO 9613‐2:1996. The independent variables are the source sound power emission level, the directivity correction, and the propagation attenuation. The source sound power emission level is determined by measurement or other calculation. In this case it is the same input sound power spectrum as was used in the Cadna‐A model. The wind turbines are modeled omnidirectional, so the directivity correction is zero. The ground plane effect on directivity is accounted for in the propagation attenuation term for the ground‐effect, so it is to be disregarded in the directivity correction here. The propagation attenuation is the sum of several influencing propagation conditions, summarized below. The following table shows the values for these variables, by octave‐bands.
Noise Analysis
Tule Wind Project Page D‐2 August 2010 Iberdrola Renewables, Inc.
The octave‐band sound pressure levels can be expressed as an overall A‐weighted sound level, according to ANSI S1.4, which defines the A frequency weighting network. The octave‐band sound power emission levels are pre‐weighted, so the resulting octave‐band receiver sound pressure levels is also A‐weighted, which only requires a simple logarithmic summation of the band levels. Equivalent continuous downwind A-weighted sound pressure level (dBA)
55.7
Propagation attenuation includes several attenuation terms, including geometric divergence, atmospheric absorption, and ground effect. The following table shows the calculated propagation attenuation, based on these attenuation terms. Barriers and miscellaneous other effects are not attenuation factors in this model, so their values are zero.
Geometric divergence is the spreading of sound energy from the source ‐ the further away the more spread out the sound energy. It is based upon the diagonal distance of the receiver from the source, and is calculated according to ISO 9613‐2:1996, formula (7). It is not frequency‐dependent, so the same value applies to all frequency bands. Geometric Divergence Adiv 51.1
Noise Analysis
Tule Wind Project Page D‐3 August 2010 Iberdrola Renewables, Inc.
Atmospheric absorption is specified by an attenuation coefficient, calculated from the temperature and humidity of the air, and frequency of the sound wave. The coefficient is given in ISO 9613‐2:1996, Table 2, for a few select combinations, and is used in this calculation for 10° C and 70% Relative Humidity.
The ground factor accounts for typical increases or decreases of sound level, depending upon the ground conditions between the source and receiver. It is specified by a ground factor, which is zero (G = 0) for "hard ground", and one (G = 1) for "porous ground". Hard ground is pavement, bare hard tamped ground, water, ice, and other surfaces with low porosity. Porous ground includes vegetation‐covered ground, and generally any ground surface suitable for growing vegetation. Where ground is porous, the intervening distance between source and receiver is subdivided into three regions, the source region, receiver region and middle region, summed to obtain the total ground attenuation according to equation (9). The expressions for calculating the regions' octave‐band ground attenuation are from ISO 9316‐2:1996, Table 3. With a ground factor of zero, the total ground effect attenuation is ‐3 dB. In other words, it actually increases the sound level, just as if the sound propagation were hemispherical instead of spherical ‐ in other words a free‐field over a reflecting plane.
Noise Analysis
Tule Wind Project Page D‐4 August 2010 Iberdrola Renewables, Inc.
Octave Band Center Frequency f
63 Hz
125 Hz
250 Hz
500 Hz
1 kHz
2 kHz
4 kHz
8 kHz
Source Region Attenuation As -1.5 -1.5 -1.5 -1.5 -1.5 -1.5 -1.5 -1.5 Receiver Region Attenuation Ar -1.5 -1.5 -1.5 -1.5 -1.5 -1.5 -1.5 -1.5 Middle Region Attenuation Am 0.0 0.0 0.0 0.0 0.0 0.0 0.0 0.0 Ground Effect Attenuation Agr -3.0 -3.0 -3.0 -3.0 -3.0 -3.0 -3.0 -3.0
Comparing the levels from this spreadsheet/hand calculation to a congruent Cadna‐A model shows a difference of one‐tenth of a decibel in most bands, and not more than two‐tenths of a decibel in any band.
Octave Band Center Frequency 63 Hz 125 Hz 250 Hz
500 Hz
1 kHz
2 kHz
4 kHz
8 kHz
Spreadsheet Calculation Levels at Receiver 35.3 44.1 49.6 51.2 49.3 44.4 35.2 25.0Cadna‐A Model Levels at Receiver 35.4 44.2 49.7 51.3 49.4 44.5 35.4 24.8
Spreadsheet Calculation Overall A‐weighted Level at Receiver
55.7 dBA
Cadna‐A Model Overall A‐weighted Level at Receiver
55.8 dBA
APPENDIX E
VEHICULAR CLASSIFICATION COUNTS
Noise Analysis
Tule Wind Project Page E‐1 August 2010 Iberdrola Renewables, Inc.
Noise Analysis
Tule Wind Project Page E‐2 August 2010 Iberdrola Renewables, Inc.
Noise Analysis
Tule Wind Project Page E‐3 August 2010 Iberdrola Renewables, Inc.
Noise Analysis
Tule Wind Project Page E‐4 August 2010 Iberdrola Renewables, Inc.
Noise Analysis
Tule Wind Project Page E‐5 August 2010 Iberdrola Renewables, Inc.
Noise Analysis
Tule Wind Project Page E‐6 August 2010 Iberdrola Renewables, Inc.
Noise Analysis
Tule Wind Project Page E‐7 August 2010 Iberdrola Renewables, Inc.
Noise Analysis
Tule Wind Project Page E‐8 August 2010 Iberdrola Renewables, Inc.
APPENDIX F
SAN DIEGO COUNTY NOISE ORDINANCE
Noise Analysis
Tule Wind Project Page F‐1 August 2010 Iberdrola Renewables, Inc.
APPENDIX F SAN DIEGO COUNTY NOISE ORDINANCE
CHAPTER 4. NOISE ABATEMENT AND CONTROL*
----------
*Note--Added by Ord. No. 3075 (N.S.), effective 6-15-67. Repealed and new Chapter 4 added by Ord. No. 4487 (N.S.), effective 10-17-74. Repealed and new Chapter 4 added by Ord. No. 6212 (N.S.), effective 2-4-82; amended by Ord. No. 9962 (N.S.), effective 1-9-09.
Disturbing, excessive or offensive noise interferes with a person's right to enjoy life and property and is detrimental to the public health and safety. Every person is entitled to an environment free of annoying and harmful noise. The purpose of this chapter is to regulate noise in the unincorporated area of the County to promote the public health, comfort and convenience of the County's inhabitants and its visitors.
(Amended by Ord. No. 9962 (N.S.), effective 1-9-09)
SEC. 36.402. DEFINITIONS.
The following definitions shall apply to this chapter:
(a) "Ambient noise level" means the composite of existing noise from all sources at a given location and time. Ambient noise is sometimes referred to as background noise.
(b) "Average sound level" means the level in decibels of the mean-square A-weighted sound pressure during a stated time period, with reference to the square of the standard reference sound pressure of 20 micropascals. The "average sound level" is equivalent to the industry standard LEQ.
(c) "A-weighted sound level" means the sound level in decibels as measured on a sound level meter using the A-weighted network. The A-weighted network is the network for measuring sound that most closely resembles what the human ear hears. Sound measured using the A-weighted network is designated dBA.
(d) "Construction equipment" means tools, machinery or equipment including "special construction equipment" defined in the Vehicle Code, used in a construction operation on any construction site.
Noise Analysis
Tule Wind Project Page F‐2 August 2010 Iberdrola Renewables, Inc.
(e) "Container" means any receptacle, regardless of contents, manufactured from wood, metal, plastic, paper or any other material including but not limited to any barrel, basket, box, crate, tub, bottle, can or refuse container.
(f) "Decibel" means a unit for measuring the amplitude of sound, equal to 20 times the logarithm to the base 10 of the ratio of the pressure of the sound measured to the reference pressure, which is 20 micropascals.
(g) "Disturbing, excessive or offensive noise" means any sound or noise that:
(1) Endangers the health or safety of any person.
(2) Causes discomfort or annoyance to a person of normal sensitivity.
(h) "Emergency work" means work: (1) necessary to restore property to a safe condition following a public calamity, (2) required to protect a person or property from injury or damage or (3) by a public or private utility to restore utility service.
(i) "Impulsive noise" means a single noise event or a series of single noise events, which causes a high peak noise level of short duration (one second or less), measured at a specific location. Examples include, but are not limited to, a gun shot, an explosion or a noise generated by construction equipment.
(j) "Maximum sound level" means the highest sound level reached when measuring noise with a sound level meter using the A-weighted network and slow time weighting. The "maximum sound level" is equivalent to the industry standard known as LMAX.
(k) "Motor vehicle" means any self-propelled vehicle as defined in the Vehicle Code and includes a mini-bike and a go-cart.
(l) "Noise control officer" means the County Director of the Department of Planning and Land Use or a person appointed or retained by the Director to perform this function.
(m) "Occupied property" means property on which there is a building for which a certificate of occupancy has been issued.
(n) "Off-road recreational vehicle" means a motor vehicle that is being operated other than on a public or private roadway, whether or not the vehicle was designed or intended for off-road use and may include but is not limited to a motorcycle, go-cart, camper, dune buggy, ATV, racecar, automobile, SUV, pick-up truck or truck. A piece of farm equipment or a motor vehicle being used for an agricultural, military, fire, emergency or law enforcement use or by a public or private utility for work on utilities is not an "off-road recreational vehicle."
(o) "Plainly audible" means any sound that can be detected by a person using his or her unaided hearing faculties. As an example, if the sound source under investigation is a portable or personal vehicular sound amplification or reproduction device, the detection of the rhythmic base
Noise Analysis
Tule Wind Project Page F‐3 August 2010 Iberdrola Renewables, Inc.
component of music is sufficient to verify plainly audible sound. The noise control officer need not determine the title, specific words or the artist performing the music.
(p) "Powered model vehicle" means a model airplane, model boat or model vehicle of any type or size not designed for carrying persons or property and which may be propelled other than by manpower or wind power.
(q) "Sound amplifying equipment" means any machine or device used to amplify music, the human voice or any sound and does not include a standard automobile radio when used and heard only by the occupants of the vehicle in which it is installed.
(r) "Sound level" means the weighted sound pressure level obtained using a sound level meter and frequency weighting network as provided in the American National Standards Institute (ANSI) specifications for sound level meters. As used in this chapter, "sound level" means the same as "noise level."
(s) "Sound level meter" means an instrument for the measurement of sound levels, which meets or exceeds the requirements pertinent for a type 1 or type 2 meter in the ANSI specifications for sound level meters, ANSI S1.4-1983 or its latest revision.
(t) "Sound truck" means a "vehicle," as that term is defined in the Vehicle Code that has or uses sound amplifying equipment.
(Amended by Ord. No. 7428 (N.S.), effective 2-4-88; amended by Ord. No. 8477 (N.S.), adopted 11-8-94, operative 1-1-95; amended by Ord. No. 8975 (N.S.), adopted 12-8-98, operative 1-2-99; amended by Ord. No. 9962 (N.S.), effective 1-9-09)
Cross reference(s)--Definitions, § 12.101 et seq.
SEC. 36.403. SOUND LEVEL MEASUREMENT.
(a) A sound level measurement made pursuant to this chapter shall be measured with a sound level meter using A-weighting and a "slow" response time, as these terms are used in ANSI S1.1-1994 or its latest revision.
(b) Each measurement shall be conducted at the boundary line of the property on which the noise source is located or any place on the affected property, but no closer than five feet from the noise source.
(c) The sound level meter shall be calibrated and adjusted by means of an acoustical calibrator of the coupler-type to assure meter accuracy within the tolerances in the ANSI specifications for sound level meters, ANSI S1.4-1983 or its latest revision. The sound level meter shall be used as provided in the manufacturer's instructions.
(Amended by Ord. No. 9962 (N.S.), effective 1-9-09)
Noise Analysis
Tule Wind Project Page F‐4 August 2010 Iberdrola Renewables, Inc.
SEC. 36.404. GENERAL SOUND LEVEL LIMITS.
(a) Except as provided in Section 36.409 of this chapter, it shall be unlawful for any person to cause or allow the creation of any noise, which exceeds the one-hour average sound level limits in Table 36.404, when the one-hour average sound level is measured at the property line of the property on which the noise is produced or at any location on a property that is receiving the noise.
TABLE 36.404 SOUND LEVEL LIMITS IN DECIBELS (dBA)
ZONE TIME ONE-HOUR AVERAGE SOUND LEVEL LIMITS (dBA)
(1) RS, RD, RR, RMH, A70, A72, S80, S81, S87, S90, S92, RV, and RU with a density of less than 11 dwelling units per acre.
7 a.m. to 10 p.m. 50
10 p.m. to 7 a.m. 45
(2) RRO, RC, RM, S86, V5, RV and RU with a density of 11 or more dwelling units per acre.
7 a.m. to 10 p.m. 55
10 p.m. to 7 a.m. 50
(3) S94, V4, and all commercial zones.
7 a.m. to 10 p.m. 60
10 p.m. to 7 a.m. 55
(4) V1, V2 7 a.m. to 7 p.m. 60
V1, V2 7 p.m. to 10 p.m. 55
V1 10 p.m. to 7 a.m. 55
V2 10 p.m. to 7 a.m. 50
V3 7 a.m. to 10 p.m. 70
10 p.m. to 7 a.m. 65
(5) M50, M52, and M54 Anytime 70
(6) S82, M56, and M58. Anytime 75
(7) S88 (see subsection (c) below)
(b) Where a noise study has been conducted and the noise mitigation measures recommended by that study have been made conditions of approval of a Major Use Permit, which authorizes the noise-generating use or activity and the decision making body approving the Major Use Permit determined that those mitigation measures reduce potential noise impacts
Noise Analysis
Tule Wind Project Page F‐5 August 2010 Iberdrola Renewables, Inc.
to a level below significance, implementation and compliance with those noise mitigation measures shall constitute compliance with subsection (a) above.
(c) S88 zones are Specific Planning Areas which allow different uses. The sound level limits in Table 36.404 above that apply in an S88 zone depend on the use being made of the property. The limits in Table 36.404, subsection (1) apply to property with a residential, agricultural or civic use. The limits in subsection (3) apply to property with a commercial use. The limits in subsection (5) apply to property with an industrial use that would only be allowed in an M50, M52 or M54 zone. The limits in subsection (6) apply to all property with an extractive use or a use that would only be allowed in an M56 or M58 zone.
(d) If the measured ambient noise level exceeds the applicable limit in Table 36.404, the allowable one-hour average sound level shall be the one-hour average ambient noise level, plus three decibels. The ambient noise level shall be measured when the alleged noise violation source is not operating.
(e) The sound level limit at a location on a boundary between two zones is the arithmetic mean of the respective limits for the two zones. The one-hour average sound level limit applicable to extractive industries; however, including but not limited to borrow pits and mines, shall be 75 decibels at the property line regardless of the zone in which the extractive industry is located.
(f) A fixed-location public utility distribution or transmission facility located on or adjacent to a property line shall be subject to the sound level limits of this section measured at or beyond six feet from the boundary of the easement upon which the facility is located.
(Amended by Ord. No. 7094 (N.S.), effective 3-25-86; amended by Ord. No. 9478 (N.S.), effective 7-19-02; amended by Ord. No. 9621 (N.S.), effective 1-9-04; amended by Ord. No. 9962 (N.S.), effective 1-9-09)
SEC. 36.405. REPAIRING, REBUILDING OR TESTING MOTOR VEHICLES.
It shall be unlawful for any person to repair, rebuild or test any motor vehicle in such a manner as to cause a disturbing, excessive or offensive noise as defined in section 36.402 of this chapter.
(Amended by Ord. No. 9962 (N.S.), effective 1-9-09)
SEC. 36.406. POWERED MODEL VEHICLES.
It shall be unlawful for any person to operate a powered model vehicle between 9 p.m. and 7 a.m. A powered model vehicle operated in a County park shall meet the daytime sound level standards for an RS zone measured at a point 100 feet from the park property line or 100 feet from where the model vehicle is being operated, whichever is less.
(Amended by Ord. No. 9962 (N.S.), effective 1-9-09)
Noise Analysis
Tule Wind Project Page F‐6 August 2010 Iberdrola Renewables, Inc.
SEC. 36.407. REFUSE VEHICLES & PARKING LOT SWEEPERS.
No person shall operate or allow to be operated, a refuse compacting, processing, or collection vehicle or a parking lot sweeper between the hours of 10 p.m. to 6 a.m., in or within 100 feet of a residential zone.
(Amended by Ord. No. 7428 (N.S.), effective 2-4-88; amended by Ord. No. 9962 (N.S.), effective 1-9-09)
SEC. 36.408. HOURS OF OPERATION OF CONSTRUCTION EQUIPMENT.
Except for emergency work, it shall be unlawful for any person to operate or cause to be operated, construction equipment:
(a) Between 7 p.m. and 7 a.m.
(b) On a Sunday or a holiday. For purposes of this section, a holiday means January 1st, the last Monday in May, July 4th, the first Monday in September, December 25th and any day appointed by the President as a special national holiday or the Governor of the State as a special State holiday. A person may, however, operate construction equipment on a Sunday or holiday between the hours of 10 a.m. and 5 p.m. at the person's residence or for the purpose of constructing a residence for himself or herself, provided that the operation of construction equipment is not carried out for financial consideration or other consideration of any kind and does not violate the limitations in sections 36.409 and 36.410.
(Amended by Ord. No. 9962 (N.S.), effective 1-9-09)
SEC. 36.409. SOUND LEVEL LIMITATIONS ON CONSTRUCTION EQUIPMENT.
Except for emergency work, it shall be unlawful for any person to operate construction equipment or cause construction equipment to be operated, that exceeds an average sound level of 75 decibels for an eight-hour period, between 7 a.m. and 7 p.m., when measured at the boundary line of the property where the noise source is located or on any occupied property where the noise is being received.
(Amended by Ord. No. 9700 (N.S.), effective 2-4-05; amended by Ord. No. 9962 (N.S.), effective 1-9-09)
SEC. 36.410. SOUND LEVEL LIMITATIONS ON IMPULSIVE NOISE.
In addition to the general limitations on sound levels in section 36.404 and the limitations on construction equipment in section 36.409, the following additional sound level limitations shall apply:
(a) Except for emergency work or work on a public road project, no person shall produce or cause to be produced an impulsive noise that exceeds the maximum sound level shown in
Noise Analysis
Tule Wind Project Page F‐7 August 2010 Iberdrola Renewables, Inc.
Table 36.410A, when measured at the boundary line of the property where the noise source is located or on any occupied property where the noise is received, for 25 percent of the minutes in the measurement period, as described in subsection (c) below. The maximum sound level depends on the use being made of the occupied property. The uses in Table 36.410A are as described in the County Zoning Ordinance.
TABLE 36.410A. MAXIMUM SOUND LEVEL (IMPULSIVE) MEASURED AT OCCUPIED PROPERTY IN DECIBELS (dBA)
OCCUPIED PROPERTY USE DECIBELS (dBA)
Residential, village zoning or civic use 82
Agricultural, commercial or industrial use 85
(b) Except for emergency work, no person working on a public road project shall produce or cause to be produced an impulsive noise that exceeds the maximum sound level shown in Table 36.410B, when measured at the boundary line of the property where the noise source is located or on any occupied property where the noise is received, for 25 percent of the minutes in the measurement period, as described in subsection (c) below. The maximum sound level depends on the use being made of the occupied property. The uses in Table 36.410B are as described in the County Zoning Ordinance.
TABLE 36.410B. MAXIMUM SOUND LEVEL (IMPULSIVE) MEASURED AT OCCUPIED PROPERTY IN DECIBELS (dBA) FOR PUBLIC ROAD PROJECTS
OCCUPIED PROPERTY USE dB(A)
Residential, village zoning or civic use 85
Agricultural, commercial or industrial use 90
(c) The minimum measurement period for any measurements conducted under this section shall be one hour. During the measurement period a measurement shall be conducted every minute from a fixed location on an occupied property. The measurements shall measure the maximum sound level during each minute of the measurement period. If the sound level caused by construction equipment or the producer of the impulsive noise exceeds the maximum sound level for any portion of any minute, it will be deemed that the maximum sound level was exceeded during that minute.
(Added by Ord. No. 9962 (N.S.), effective 1-9-09)
Noise Analysis
Tule Wind Project Page F‐8 August 2010 Iberdrola Renewables, Inc.
SEC. 36.411. CONTAINERS AND CONSTRUCTION MATERIAL.
It shall be unlawful for any person to handle, transport, or cause to be handled or transported in any public place, any container or any construction material in such a way as to create a disturbing, excessive, or offensive noise as defined in section 36.402 of this chapter.
(Amended by Ord. No. 9962 (N.S.), effective 1-9-09)
SEC. 36.412. SIGNAL DEVICE FOR FOOD TRUCKS.
No person shall operate or cause to have operated or used any sound signal device other than sound-amplification equipment attached to a motor vehicle wagon or manually propelled cart from which food or any other items are sold which emits a sound signal more frequently than once every ten minutes in any one street block and with a duration of more than ten seconds for any single emission. The sound level of this sound signal shall not exceed 90 decibels at 50 feet from the point of the noise source.
(Amended by Ord. No. 9962 (N.S.), effective 1-9-09)
SEC. 36.413. MULTIPLE FAMILY DWELLING UNITS.
Notwithstanding any other provision of this chapter it shall be unlawful for any person to create, maintain or cause to be maintained any sound within the interior of any multiple family dwelling unit which causes the noises level to exceed those limits set forth below in another dwelling unit:
TABLE 36.413 ALLOWABLE INTERIOR NOISE LEVEL
Type of Land Use Hours Allowable Interior Noise Level (dBA)
No Time 1 min in 1 hour 5 min in 1 hour
Multifamily 10 pm- 7 am > 45 40 35
Residential 7 am-10 pm > 55 50 35
( > greater than)
( less than or equal to)
(Amended by Ord. No. 9962 (N.S.), effective 1-9-09)
SEC. 36.414. GENERAL NOISE PROHIBITIONS.
In addition to the general limitations on sound levels in section 36.404, the following additional prohibitions shall apply:
Noise Analysis
Tule Wind Project Page F‐9 August 2010 Iberdrola Renewables, Inc.
(a) It shall be unlawful for a person to make, continue or cause to be made or continued a disturbing, excessive or offensive noise.
(b) The characteristics and conditions which should be considered in determining whether a violation of this section has been committed include, but are not limited to, the following:
(1) The level of noise.
(2) Whether the nature of the noise is usual or unusual.
(3) Whether the origin of the noise is natural or unnatural.
(4) The ambient noise level.
(5) The proximity of the noise to a place where someone sleeps.
(6) The nature and zoning of the area within which the noise emanates and where it is received.
(7) The time of day the noise occurs.
(8) The duration of the noise.
(9) Whether the noise is recurrent, intermittent or constant.
(10) Whether the noise is produced by a commercial or noncommercial activity.
(c) The following acts, among others, are declared to be disturbing, excessive and offensive noises that violate this chapter and are unlawful:
(1) Unnecessarily using or operating or allowing another person to use or operate a vehicle horn, signaling device or other similar device, other than as regulated by the Vehicle Code.
(2) Using, operating, playing or allowing another person to use, operate or play a radio, musical instrument, phonograph, television set or other device for the production or reproduction of sound:
(A) That disturbs the peace, quiet and comfort of persons of normal sensitivity residing in the area.
(B) That exceeds the levels in section 36.404 when measured at a distance of 25 feet from a device operating in a public right-of-way.
(C) That exceeds the levels in section 36.404 when measured at a distance of 25 feet from a device for the production or reproduction of sound operated in a County park unless a
Noise Analysis
Tule Wind Project Page F‐10 August 2010 Iberdrola Renewables, Inc.
permit has been obtained from the County Parks and Recreation Department specifying the time, location and other conditions under which amplified sound may be allowed within a County park. A person using, operating or playing a device for the production or reproduction of sound in a County park, however, shall not exceed a level of 90 decibels when measured 50 feet from the source or exceed the levels in section 36.404 when measured at the park boundary. Subsection 36.414 (c)(2)(C) shall be enforced by the Parks and Recreation Department.
(3) It shall be a prima facie violation of section 36.414(c)(2)(A) if a device for the production or reproduction of sound that is being operated, used or played is plainly audible at a distance of 50 feet or more from the building, structure or vehicle in which it is located.
(4) Playing, using, operating or allowing to be played, used or operated any sound production or reproduction device or machine including but not limited to radio receiving sets, phonographs, musical instruments, loudspeakers and sound amplifiers, for commercial or business advertising purposes in, on, over or across any street, alley, sidewalk, park or public property in a manner as to violate the provisions of this ordinance is prohibited. This subsection shall not apply to sound amplifying equipment mounted on a sound truck where the operator complies with the following requirements:
(A) The only sound emitted is music or human speech and the music or speech emitted is not obscene, lewd, profane or slanderous.
(B) The sound truck is only operated between the hours of 8:00 a.m. and 9:00 p.m. or after 9:00 p.m. during public events and affairs of general public interest.
(C) The sound amplifying equipment is not being operated unless the sound truck is traveling at a speed of at least 10 miles per hour, except when the truck is stopped or impeded by traffic. If the sound truck is stopped by traffic the sound amplifying equipment shall not be operated for longer than one minute at each stop.
(D) Sound is not emitted within 100 yards of a hospital, school, church or courthouse.
(E) The volume of sound does not exceed a sound level of 65 decibels (on the "A" scale) at a distance of 50 feet from the sound amplifying equipment as measured by a sound level meter.
(F) No sound amplifying equipment is operated unless the axis of the center of the sound reproducing equipment is parallel to the direction of travel of the sound truck. Any sound reproducing equipment, however, may be placed upon the sound truck as to not vary more than 15º either side of the axis of the center of the direction of travel.
(G) No sound truck with its amplifying device in operation shall be driven on the same street past the same point more than twice in one hour.
(5) Causing or allowing unreasonably loud or disturbing verbal noise that is offensive or annoying to a person of normal sensitivity.
Noise Analysis
Tule Wind Project Page F‐11 August 2010 Iberdrola Renewables, Inc.
(6) Owning, possessing or harboring an animal which by any frequent or long continued noise causes annoyance or discomfort to a person of normal sensitivity in the vicinity. The written affirmation by two persons having separate residences that an animal has caused frequent or long continued noise, that has caused them annoyance or discomfort shall be prima facie evidence of a violation of this section. This subsection does not apply to animal noise emanating from a legally operated animal hospital, humane society, County Department of Animal Services facility, farm or other agricultural facility where keeping animals is allowed.
(7) Operating or causing to be operated or used any steam whistle attached to a stationary boiler, except to give notice of the time to start or stop work or as a signal of imminent danger.
(8) Using or allowing the use of a motor vehicle to knowingly produce a noise that causes annoyance or discomfort to a person of normal sensitivity in the vicinity of the noise by backfiring the engine, screeching the tires, operating without a muffler, altering the muffler or any other action that causes a disturbing, excessive or offensive noise.
(Amended by Ord. No. 9962 (N.S.), effective 1-9-09)
SEC. 36.415. BURGLAR ALARMS.
(a) No person shall install or operate a burglar alarm in a residence or any other building that is not equipped with a functioning automatic cutoff device that terminates any noise emanating from the alarm within 15 minutes from the time the alarm is activated.
(b) No motor vehicle owner shall install or have in his or her possession a motor vehicle that is not equipped with a functioning automatic cutoff device that terminates any noise emanating from the alarm within 15 minutes from the time the alarm is activated.
(c) Notwithstanding the requirements of this section, a law enforcement officer may deactivate a building or motor vehicle alarm after the alarm is activated.
(Amended by Ord. No. 9962 (N.S.), effective 1-9-09)
SEC. 36.416. NOISE FROM OFF-ROAD RECREATIONAL VEHICLES.
In addition to the general limitations on sound levels in section 36.404, no person shall operate or allow the operation of an off-road recreational vehicle on private property that produces a noise when measured at the boundary line of the property where the noise source is located or on any occupied property where the noise is received, that at any time exceeds the following maximum sound levels: 82 decibels between the hours of 7 a.m. and 7 p.m., 77 decibels between the hours of 7 p.m. and 10 p.m. and 55 decibels between the hours of 10 p.m. and 7 a.m.
(Added by Ord. No. 9962 (N.S.), effective 1-9-09)
Noise Analysis
Tule Wind Project Page F‐12 August 2010 Iberdrola Renewables, Inc.
SEC. 36.417. EXEMPTIONS.
(a) This chapter shall not apply to:
(1) Emergency work, as defined in this chapter, provided that (A) the person performing the work notifies noise control officer in advance, or as soon as practicable after the emergency and (B) any vehicle, device, apparatus or equipment used, related to or connected with the emergency work is designed, modified or equipped to reduce noise produced to the lowest possible level consistent with effective operation of the vehicle, device, apparatus or equipment.
(2) Noise reasonably related to authorized school: (A) bands, (B) athletic activities and (C) entertainments events.
(3) Sporting, entertainment and public events which are conducted pursuant to a license or permit issued by the County, within the scope of the license or permit. This section is not intended to excuse the act of an individual not participating in the event who violates this chapter.
(4) The operation of an emergency generator after a power failure, by an employee or agent of a law enforcement agency, fire department, hospital or other medical or surgical facility that is providing emergency medical services.
(5) The reasonable testing of an emergency generator by any person provided that the testing is conducted between the hours of 7 a.m. and 7 p.m.
(6) Any activity preempted by State or federal law.
(b) Section 36.404 shall not apply to:
(1) Noise associated with routine property maintenance used either in part or in whole for residential purposes, provided activity takes place between 7 a.m. and 8 p.m. on any day except Sunday or between 10 a.m. and 8 p.m. on Sunday.
(2) Equipment associated with agricultural operations, provided that each piece of equipment and machinery powered by an internal-combustion engine is equipped with an appropriate muffler and air intake silencer in good working order and one of the following applies:
(A) Operations do not take place between 7 p.m. and 7 a.m. of the following day.
(B) The operations and equipment are utilized for the preparation, planting, harvesting, protection or salvage of agricultural crops during periods of potential or actual frost damage or other adverse weather conditions.
Noise Analysis
Tule Wind Project Page F‐13 August 2010 Iberdrola Renewables, Inc.
(C) The operations and equipment are used for agricultural pest control in accordance with regulations and procedures administered by the County Department of Agriculture.
(Amended by Ord. No. 7428 (N.S.), effective 2-4-88; amended by Ord. No. 9962 (N.S.), effective 1-9-09)
SEC. 36.418. RESPONSIBILITY FOR ENFORCEMENT.
The Sheriff shall have primary responsibility for enforcing sections 36.405, 36.407, 36.411, 36.412, 36.413, 36.414 and 36.415. When this chapter requires measurements to enforce these sections, the noise control officer shall assist the Sheriff. The noise control officer shall have primary responsibility for enforcing all other sections of this chapter. Pursuant to Penal Code section 836.5, a person authorized to enforce this chapter may arrest a person without a warrant if he or she has reasonable cause to believe that the person has committed a misdemeanor in his or her presence that violates this chapter.
(Amended by Ord. No. 9962 (N.S.), effective 1-9-09)
State law reference(s)--Arrest without warrant, Penal Code, § 836.5.
SEC. 36.419. ADDITIONAL REMEDIES.
The noise control officer may order a person to cease violating any section of this chapter that the noise control officer enforces. The noise control officer may, in addition to using any remedy provided in section 11.121 of this code, summarily abate a public nuisance caused by any act that violates this chapter if the noise control officer determines there is an immediate threat to the health or safety of any person.
(Amended by Ord. No. 7141 (N.S.), effective 6-26-86; amended by Ord. No. 9962 (N.S.), effective 1-9-09)
SEC. 36.420. FALSE STATEMENT.
No person shall knowingly provide false information, either orally or in writing, to the noise control officer related to any matter within the noise control officer's jurisdiction.
(Amended by Ord. No. 9962 (N.S.), effective 1-9-09)
SEC. 36.421. REPRODUCTION OR ALTERATION OF DOCUMENTS.
No person shall reproduce or alter any document issued by the noise control officer or required by this chapter, for the purpose of evading, attempting to evade or violating any requirement of this chapter.
(Amended by Ord. No. 9962 (N.S.), effective 1-9-09)
Noise Analysis
Tule Wind Project Page F‐14 August 2010 Iberdrola Renewables, Inc.
SEC. 36.422. DISPLAY OF PERMIT, VARIANCE OR OTHER DOCUMENT.
Any permit, variance or other document that authorizes any activity regulated by this chapter shall be displayed or maintained on the property or at the location where the activity is occurring.
(Amended by Ord. No. 9962 (N.S.), effective 1-9-09)
SEC. 36.423. VARIANCES.
(a) A person who proposes to perform non- emergency work on a public right-of-way, public utility facility, public transportation facility or some other project for the benefit of the general public, who is unable to conform to the requirements of this chapter may apply to the County for a variance authorizing the person to temporarily deviate from the requirements of this chapter.
(b) The noise control officer shall only grant a variance if the officer makes findings that the applicant's proposed activity cannot feasibly be done in a manner that would comply with this chapter and the applicant has no other reasonable alternative available.
(c) When evaluating a request for a variance the noise control officer shall determine the impact any noise that does not comply with the limits of this chapter will have on each property likely to be affected by the noise. The evaluation shall include the uses on each property on which the non-complying noise will be received, what activities will be impacted on the property and the duration of each impact. The evaluation shall also include the value to the community of the work being done by the applicant, the cost to the community if the applicant is unable to perform the work, the cost to the applicant for mitigating the non-complying noise and any cost to the occupant of the impacted property during the time the period of the impacted property will be subject to the non-complying noise.
(d) If the noise control officer grants a variance under this section the variance may impose time limitations on the non-complying activity and may include mitigation measures that the applicant is required to adopt.
(Amended by Ord. No. 9962 (N.S.), effective 1-9-09)
SEC. 36.424. APPLICATION FOR VARIANCE.
An applicant for a variance shall file an application with the noise control officer on a form provided by the officer. The application shall not be deemed complete until the applicant provides all information required by the application and any supplemental information requested by the noise control officer.
(Amended by Ord. No. 9962 (N.S.), effective 1-9-09)
Noise Analysis
Tule Wind Project Page F‐15 August 2010 Iberdrola Renewables, Inc.
SEC. 36.425. REQUEST FOR DUPLICATE VARIANCE CERTIFICATE.
A person who loses the certificate issued by the noise control officer that grants a variance shall request a duplicate certificate from the noise control officer within 10 days after the certificate is destroyed, lost or defaced.
(Amended by Ord. No. 9689, operative 2-4-05, effective 2-13-05; amended by Ord. No. 9962 (N.S.), effective 1-9-09)
SEC. 36.426. ACTION ON APPLICATION.
(a) The noise control officer shall review an application for a variance to determine if the applicant has provided all information necessary to render a decision on the application. If the application is not complete, the noise control officer shall notify the applicant within 15 days from the date the application was submitted what additional information the applicant needs to provide to make the application complete. If the applicant does not provide the additional information within 15 days of the notice the noise control officer shall deny the application. Within 30 days after receiving a completed application the noise control officer shall deny, approve or grant conditional approval of the request for a variance and notify the applicant in writing of the action taken.
(b) If the noise control officer denies the request for a variance the notice of denial shall state the reasons for the denial. If the noise control officer conditionally approves the variance request the notice of conditional approval shall clearly state the conditions and the reasons for the conditional approval.
(c) An applicant may deem a variance denied if the application has not been acted on within 30 days after the application was submitted or within 15 days after providing additional information requested by the noise control officer, whichever is later.
(Amended by Ord. No. 9962 (N.S.), effective 1-9-09)
SEC. 36.427. FAILURE TO COMPLY WITH CONDITIONS.
If a person granted a variance fails to comply with a condition of the variance or this chapter the noise control officer may suspend the variance until the person complies or may revoke the variance.
(Amended by Ord. No. 9962 (N.S.), effective 1-9-09)
SEC. 36.428. APPEALS.
A person may appeal a decision of the noise control officer by filing a notice of appeal with the Clerk of the Board of Supervisors (Clerk) and paying the appeal fee for the appeal of an administrative decision, as provided in section 362.1 of the County Administrative Code, within 15 days after the noise control officer:
Noise Analysis
Tule Wind Project Page F‐16 August 2010 Iberdrola Renewables, Inc.
(a) Serves a notice of denial or conditional approval of a variance or the date a variance request is deemed denied.
(b) Serves a notice of suspension or revocation of a variance.
(Amended by Ord. No. 9962 (N.S.), effective 1-9-09)
SEC. 36.429. CONTENTS OF NOTICE OF APPEAL.
A notice of appeal to review a denial or conditional approval of a variance shall include a copy of the variance application, a copy of the notice of denial or conditional approval and the reasons for the appeal. A notice of appeal of a suspension or revocation of a variance shall include a copy of the variance, a copy of the noise control officer's notice of suspension or revocation and the reasons for the appeal. The appellant shall not be allowed to raise any grounds for appeal not contained in the notice of appeal.
(Amended by Ord. No. 9962 (N.S.), effective 1-9-09)
SEC. 36.430. DISMISSAL OF APPEAL.
The appellant may dismiss an appeal at any time before the appeal hearing by filing a written notice of dismissal with the Clerk with a copy to the noise control officer.
(Amended by Ord. No. 9962 (N.S.), effective 1-9-09)
SEC. 36.431. HEARING OFFICER.
All appeals filed under this chapter shall be heard by a County hearing officer appointed pursuant to sections 650 et seq. of the County Administrative Code. The Clerk shall assign the matter to a hearing officer on a rotating basis from the list of appointed hearing officers.
(Amended by Ord. No. 9962 (N.S.), effective 1-9-09)
SEC. 36.432. SCHEDULING HEARINGS.
The Clerk shall schedule a hearing within 20 days after receipt of the notice of appeal and serve the notice of hearing on the appellant and the noise control officer. The notice shall provide the date, time and location of the hearing.
(Amended by Ord. No. 9962 (N.S.), effective 1-9-09)
SEC. 36.433. HEARING PROCEDURES.
An appeal hearing authorized by this chapter shall be conducted as follows:
(a) Every witness before testifying shall take an oath or make an affirmation.
Noise Analysis
Tule Wind Project Page F‐17 August 2010 Iberdrola Renewables, Inc.
(b) The noise control officer shall present evidence that explains why the variance was denied, approved conditionally, suspended or revoked.
(c) The appellant shall present evidence that supports his/her contention that the noise control officer's determination denying, conditionally approving, suspending or revoking the variance was erroneous.
(d) Each party shall have the right to: call and examine witnesses, introduce exhibits, cross-examine opposing witnesses on any matter relevant to the issues, impeach any witness regardless of which party first called the witness to testify and to rebut the evidence against the party. The noise control officer may call and examine the appellant or any employee or agent of the appellant as a witness during the noise control officer's case in chief or during the rebuttal case. The hearing officer may examine the appellant or any of the appellant's employees or agents as if under cross-examination.
(e) Strict rules of evidence shall not apply. Evidence that might otherwise be excluded under the Evidence Code may be admissible if the hearing officer determines that it is relevant and of the kind that reasonably prudent persons rely on in making decisions. All rules of privilege recognized by the Evidence Code, however, shall apply to the hearing. The hearing officer shall exclude irrelevant and cumulative evidence.
(f) The hearing shall be conducted in English. If the appellant or any of appellant's witnesses require an interpreter the appellant is responsible to provide a State certified interpreter at appellant's expense.
(Amended by Ord. No. 9962 (N.S.), effective 1-9-09)
SEC. 36.434. CONTINUANCES.
The hearing officer may grant a continuance requested by either party for good cause.
(Amended by Ord. No. 9962 (N.S.), effective 1-9-09)
SEC. 36.435. DECISION.
The hearing officer shall issue a written decision within five days after the hearing is concluded and file it with the Clerk. The decision shall affirm, modify or overrule the noise control officer's decision that was appealed. The decision shall state the reasons for the hearing officer's decision. The Clerk shall serve a copy of the decision on the appellant and provide a copy to the noise control officer. The decision shall be effective after it has been served by the Clerk.
(Amended by Ord. No. 9962 (N.S.), effective 1-9-09)
Disclaimer: This Code of Ordinances and/or any other documents that appear on this site may not reflect the most current legislation adopted by the Municipality. American Legal Publishing Corporation provides these documents for
Noise Analysis
Tule Wind Project Page F‐18 August 2010 Iberdrola Renewables, Inc.
informational purposes only. These documents should not be relied upon as the definitive authority for local legislation. Additionally, the formatting and pagination of the posted documents varies from the formatting and pagination of the official copy. The official printed copy of a Code of Ordinances should be consulted prior to any action being taken.
For further information regarding the official version of any of this Code of Ordinances or other documents posted on this site, please contact the Municipality directly or contact American Legal Publishing toll-free at 800-445-5588.