14
COMPENSATING LOCAL GOVERNMENTS FOR ECOLOGICAL SERVICES: A PROPOSED NATURALNESS INDEX Ilda Dreoni University of Turin
| Date post: | 14-Jul-2015 |
| Category: |
Technology |
| Upload: | input-2012 |
| View: | 217 times |
| Download: | 1 times |

COMPENSATING LOCAL GOVERNMENTS FOR ECOLOGICAL
SERVICES: A PROPOSED NATURALNESS INDEX
Ilda Dreoni
University of Turin
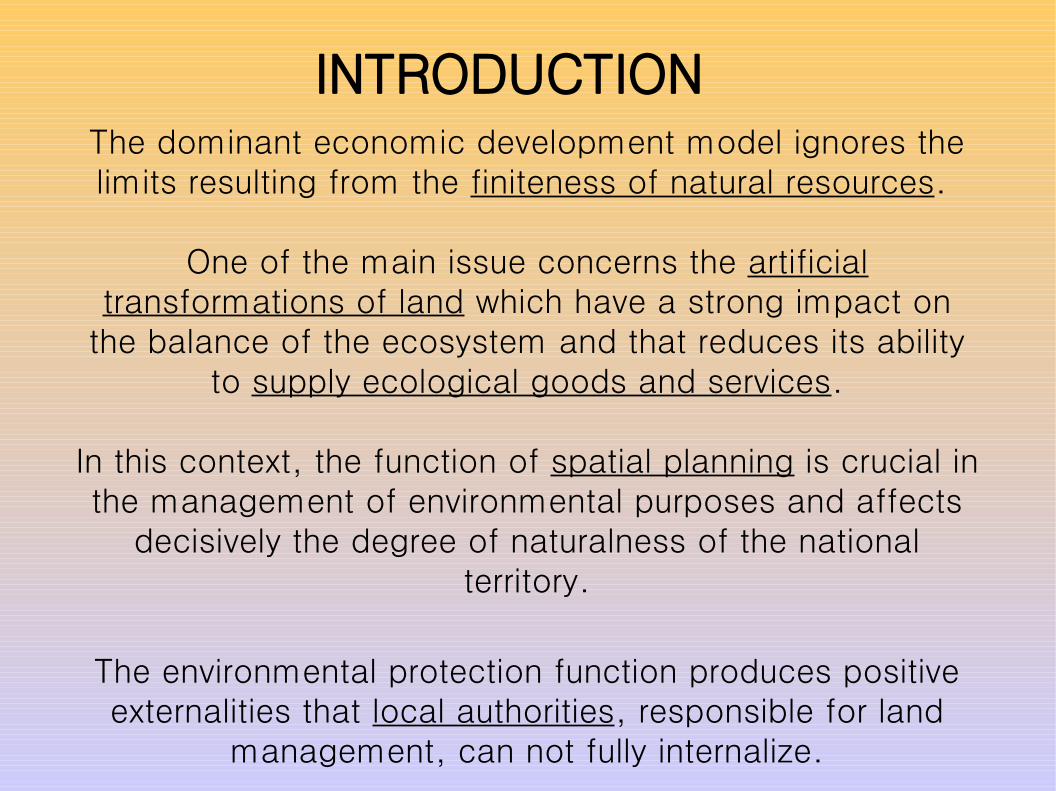
The dominant economic development model ignores the limits resulting from the finiteness of natural resources.
One of the main issue concerns the artificial transformations of land which have a strong impact on
the balance of the ecosystem and that reduces its ability to supply ecological goods and services.
In this context, the function of spatial planning is crucial in the management of environmental purposes and affects
decisively the degree of naturalness of the national territory.
The environmental protection function produces positive externalities that local authorities, responsible for land
management, can not fully internalize.
INTRODUCTION

Develop new policies to reverse the perverse economic incentives that lead to degradation of the Italian territories.
For this purpose it is necessary to develop new methods to integrate environmental benefits into market
mechanisms.
The proposed naturalness index, based on land cover datas, may be used for the development of market-based
instruments that permit the internalization of environmental externalities.
The final purpose is to orient the land-use planning towards environmental sustainability and to strengthen
environmental policies implemented at sub-national levels of government.
OBJECTIVE

The degree of naturalness of the land is directly connected to the existing biodiversity.
However, this assessment requires knowledge, acquisition and processing of a large number of information and data
given the complex set of relationships that characterize natural ecosystems.
The development of a synthetic index, which involves modest costs in its elaboration, is essential to promote a real integration of environmental issues within the policies
implemented at all levels of government.
NATURALNESS MEASUREMENT

Three indicators were analyzed to develop a representative naturalness index:
- the Net Landscape Ecological Potential Index proposed by the European Environmental Agency;
- the Landscape Conservation Index proposed by Pizzolotto and Brandymar (1996);
- the Naturalness Land Index proposed by Osservatorio Città Sostenibili (2002).
NATURALNESS INDEX

The index proposed is based on cardinal rating techniques of classes of indicators corresponding to the ecological
value of existing biotopes.
According to the reclassification proposed for the calculation of Naturalness Land Index an ecomosaic map
was created and for each category of biotope was assigned values ranging from 0 (maximum level of artificiality) to 1 (maximum level of naturalness).
The indicator proposed by Osservatorio Città Sostenibili was further improved introducing considerations related to the designated areas for nature protection and to the land
fragmentation.
NATURALNESS INDEX

Fig. 1 Naturalness map of Emilia Romagna

Fig. 2 Naturalness map of Sardegna
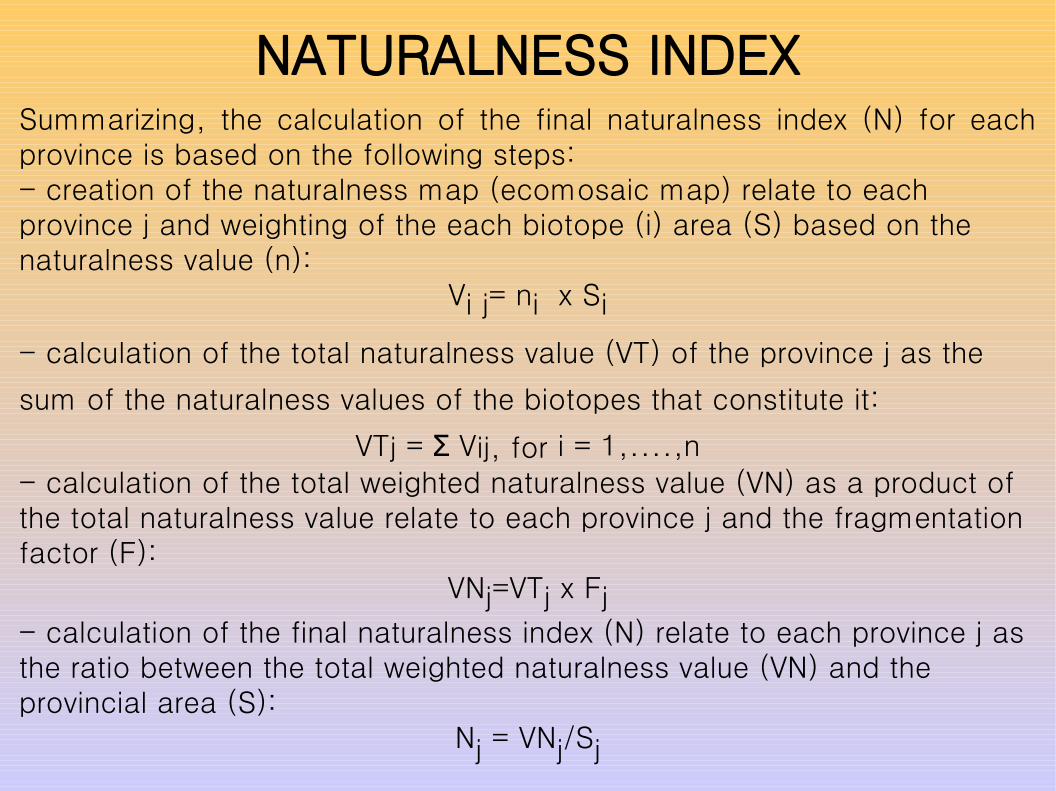
Summarizing, the calculation of the final naturalness index (N) for each province is based on the following steps:- creation of the naturalness map (ecomosaic map) relate to each province j and weighting of the each biotope (i) area (S) based on the naturalness value (n):
Vi j= ni x Si
- calculation of the total naturalness value (VT) of the province j as the
sum of the naturalness values of the biotopes that constitute it:
VTj = VƩ ij, for i = 1,....,n- calculation of the total weighted naturalness value (VN) as a product of the total naturalness value relate to each province j and the fragmentation factor (F):
VNj=VTj x Fj- calculation of the final naturalness index (N) relate to each province j as the ratio between the total weighted naturalness value (VN) and the provincial area (S):
Nj = VNj/Sj
NATURALNESS INDEX

Tab. 1 Calculation of the final naturalness index for the provinces of Emilia Romagna and Sardegna
Bologna 363,946 133,399 0.94 125,813 0.35255,434 68,787 1 68,787 0.27235,036 114,240 0.95 108,762 0.46263,589 91,809 0.96 88,283 0.33336,658 172,213 0.96 164,570 0.49252,470 107,930 0.97 104,282 0.41181,422 43,315 0.94 40,574 0.22224,829 82,488 0.95 78,772 0.35
51,535 8,013 0.85 6,829 0.132,164,920 822,195 786,673 0.36
452,031 257,163 0.96 248,083 0.55148,801 90,823 1 90,823 0.61151,343 64,868 0.99 64,535 0.43391,985 279,659 0.97 269,911 0.69
O gliastra 184,377 142,631 0.97 137,713 0.75337,791 216,246 0.98 212,497 0.63302,096 152,218 0.95 145,157 0.48425,897 216,560 0.98 212,770 0.50
2,394,321 1,420,168 1,381,489 0.58
Area (Sj) Ha
Total naturalne ss
value (VTj) Ha
Fragme ntation factor
(Fj)
Total naturalne ss we ighte d value
(VNj) Ha
Naturalne ss inde x (Nj)
Fe rraraForl ì -C e se naMode naParmaPiace nzaRave nnaRe ggio ne l l 'Emil iaRiminiTotale
C agliariC arbonia-Igle siasMe dio C ampidanoNuoro
O lbia-Te mpioO ristanoSassariTotale

Fig. 3 Final naturalness index of the provinces of Emilia Romagna

Fig. 4 Final naturalness index of the provinces of Sardegna

- Exclusion from the assessment of the aquatic ecosystems.
- Influences on the degree of naturalness of each biotope depending on the context in which it is inserted.
- Influences on the degree of naturalness of the designated areas for nature protection depending on the intensity of protection.
- Availability of thematic maps related to cover and land use at a level of detail suitable for local applications (1:25.000).
LIMITS

The methodology presented represents a first stage of research for the implementation of biodiversity conservation policies based on market-based
instruments.
The implementation of funding mechanisms for environmental services offered by local authorities within
the Italian local finance system would allow a better integration between economic development and
environmental policies improving the efficiency and effectiveness of biodiversity conservation policies.
CONCLUSION


![Public Input No. 22-NFPA 2001-2012 [ Global Input ] Statement of ...](https://static.documents.pub/doc/80x56/5875f5761a28ab42028b5adf/public-input-no-22-nfpa-2001-2012-global-input-statement-of-.jpg)


![Public Input No. 4-NFPA 11-2012 [ Global Input ] Statement of ...](https://static.documents.pub/doc/80x56/584972451a28aba93a8f22ed/public-input-no-4-nfpa-11-2012-global-input-statement-of-.jpg)


