Full Terms & Conditions of access and use can be found at http://www.tandfonline.com/action/journalInformation?journalCode=cije20 Download by: [Vanderbilt University Library], [Jonathan Gilligan] Date: 19 July 2016, At: 13:49 International Journal of Environmental Health Research ISSN: 0960-3123 (Print) 1369-1619 (Online) Journal homepage: http://www.tandfonline.com/loi/cije20 Drinking water insecurity: water quality and access in coastal south-western Bangladesh Laura Benneyworth, Jonathan Gilligan, John C. Ayers, Steven Goodbred, Gregory George, Amanda Carrico, Md. Rezaul Karim, Farjana Akter, David Fry, Katherine Donato & Bhumika Piya To cite this article: Laura Benneyworth, Jonathan Gilligan, John C. Ayers, Steven Goodbred, Gregory George, Amanda Carrico, Md. Rezaul Karim, Farjana Akter, David Fry, Katherine Donato & Bhumika Piya (2016): Drinking water insecurity: water quality and access in coastal south-western Bangladesh, International Journal of Environmental Health Research, DOI: 10.1080/09603123.2016.1194383 To link to this article: http://dx.doi.org/10.1080/09603123.2016.1194383 Published online: 08 Jun 2016. Submit your article to this journal Article views: 17 View related articles View Crossmark data
Transcript
Full Terms & Conditions of access and use can be found athttp://www.tandfonline.com/action/journalInformation?journalCode=cije20
Download by: [Vanderbilt University Library], [ Jonathan Gilligan] Date: 19 July 2016, At: 13:49
International Journal of Environmental Health Research
Drinking water insecurity: water quality andaccess in coastal south-western Bangladesh
Laura Benneyworth, Jonathan Gilligan, John C. Ayers, Steven Goodbred,Gregory George, Amanda Carrico, Md. Rezaul Karim, Farjana Akter, DavidFry, Katherine Donato & Bhumika Piya
To cite this article: Laura Benneyworth, Jonathan Gilligan, John C. Ayers, Steven Goodbred,Gregory George, Amanda Carrico, Md. Rezaul Karim, Farjana Akter, David Fry, KatherineDonato & Bhumika Piya (2016): Drinking water insecurity: water quality and access in coastalsouth-western Bangladesh, International Journal of Environmental Health Research, DOI:10.1080/09603123.2016.1194383
To link to this article: http://dx.doi.org/10.1080/09603123.2016.1194383
InternatIonal Journal of envIronmental HealtH researcH, 2016http://dx.doi.org/10.1080/09603123.2016.1194383
Drinking water insecurity: water quality and access in coastal south-western Bangladesh
Laura Benneywortha , Jonathan Gilligana, John C. Ayersa, Steven Goodbreda, Gregory Georgea, Amanda Carricob, Md. Rezaul Karimc, Farjana Akterc, David Frya, Katherine Donatod and Bhumika Piyad
aDepartment of earth and environmental sciences, vanderbilt university, nashville, tn, usa; benvironmental studies, university of colorado at Boulder, Boulder, co, usa; cenvironmental science Discipline, Khulna university, Khulna, Bangladesh; dDepartment of sociology, vanderbilt university, nashville, tn, usa
ABSTRACTNational drinking water assessments for Bangladesh do not reflect local variability, or temporal differences. This paper reports on the findings of an interdisciplinary investigation of drinking water insecurity in a rural coastal south-western Bangladesh. Drinking water quality is assessed by comparison of locally measured concentrations to national levels and water quality criteria; resident’s access to potable water and their perceptions are based on local social surveys. Residents in the study area use groundwater far less than the national average; salinity and local rainwater scarcity necessitates the use of multiple water sources throughout the year. Groundwater concentrations of arsenic and specific conductivity (SpC) were greater than surface water (pond) concentrations; there was no statistically significant seasonal difference in mean concentrations in groundwater, but there was for ponds, with arsenic higher in the dry season. Average arsenic concentrations in local water drinking were 2–4 times times the national average. All of the local groundwater samples exceeded the Bangladesh guidance for SpC, although the majority of residents surveyed did not perceive their water as having a ‘bad’ or ‘salty’ taste.
Introduction
Water is essential to life and human health, economic development, food security, poverty reduc-tion and sustainable ecological functions (UN Water 2013). Given that the world’s population is expected to reach eight billion by 2025, growing demands on drinking water supplies and water for food production are evident, and competing uses of limited resources are inevitable (UNDP 2006). Anticipated anthropogenic climate change impacts of higher temperatures, drought, more erratic precipitation patterns and more intense storms are expected to intensify water demands (IPCC 2007). There are myriad terms that describe human social and environmental relationships with water. One of the most comprehensive terms currently being used is ‘water security’, which UN Water defines as follows:
The capacity of a population to safeguard sustainable access to adequate quantities of acceptable quality water for sustaining livelihoods, human well-being, and socio-economic development, for ensuring protection against water-borne pollution and water-related disasters, and for preserving ecosystems in a climate of peace and political stability. (UN Water 2013, p. 1).
Many drinking water assessments for Bangladesh have focused at the national level which does not reflect local variability, nor illustrates temporal differences due to the seasonality of water supplies. The objective of this paper is to report on the findings of an interdisciplinary investigation of the state of drinking water security in a small area of coastal south-western Bangladesh to illustrate the impor-tance of scale in assessing water security. The assessment of local water security is focused on water quality and the issues that affect access to potable water. The types of local water sources and uses are described, and spatial and temporal trends in local water quality are identified. Drinking water quality is assessed by comparison of locally measured concentrations to national concentrations and to water quality criteria, and resident’s access to potable water are described based on local social surveys.
Factors affecting water security in Bangladesh
The coastal region of Bangladesh is predominantly rural, relying on rice paddy farming, fishing and aquaculture for its primary livelihoods (FAO 2009; Chowdhury 2010). Shrimp farming has intensified over the past two decades, greatly changing the local landscape, and negatively affecting surface and groundwater resources (Datta et al. 2010).
Throughout Bangladesh ineffective water management, insufficient governance and the lack of infra-structure greatly affects water security, and drinking water needs compete with irrigation demands. Agriculture employs about two-thirds of the country’s population, and rice cultivation is the most important activity, requiring vast amounts of surface water and groundwater for irrigation (Chowdhury 2010; Abedin et al. 2014). Food security for the nation is, thus, heavily water-dependent (Falkenmark et al. 2009; UNESCO 2012).
Drinking water sources in rural are varied, and include shallow groundwater obtained through tube wells, small ponds with and without pond sand filters (PSF, a sand and gravel filter), harvested rainwater, bottled water and river water. Rainwater collection devices are of generally small volume (insufficient to last the entire year), and municipal reservoirs are essentially non-existent. This lack of adequate water storage infrastructure intensifies water insecurity (Ansari et al. 2011).
Bangladesh is vulnerable to water insecurity partially because of its environmental circumstances. Being a low-lying deltaic country of exceptionally dense population, Bangladesh is susceptible to a variety of environmental stresses and natural disasters; these stresses can exacerbate the difficulties accessing potable water (FAO 2009; Chowdhury 2010; Abedin et al. 2014). For example, south-west Bangladesh was severely impacted by cyclone Aila in 2009; many drinking water sources were inun-dated with saline tidal water and became unusable (FAO 2009; Mallick et al. 2011).
Although the country has immense natural water resources, drinking water quantity and quality are greatly affected by Bangladesh’s monsoonal climate. Rainfall in Bangladesh is not consistent tem-porally or spatially; 80 % of the rainfall occurs during June–September (Chowdhury 2010; Abedin et al. 2014). This seasonal nature of water supply affects the choices people make in selecting drink-ing sources and the quality of those sources. The long dry season results in local water scarcity and degraded water quality, and necessitates the use of multiple drinking water sources to meet basic personal needs (Ansari et al. 2011). In the dry season, rainwater is not available for drinking, and surface water sources become stagnant.
Groundwater is used extensively for drinking water throughout Bangladesh. On the coast, most of the groundwater used for water supply is pumped from the top 150 m, but much of it is saline (Ravenscroft 2003; Chowdhury 2010). Aquifers would be expected to be flushed and recharged sea-sonally during the monsoon, bringing an abundance of fresh subsurface water, but recharge is highly variable due to the presence of intermittent, thick deposits of clays (Ravenscroft 2003). Over one million
Dow
nloa
ded
by [
Van
derb
ilt U
nive
rsity
Lib
rary
], [
Jona
than
Gill
igan
] at
13:
49 1
9 Ju
ly 2
016
INTeRNATIoNAL JouRNAL oF eNvIRoNMeNTAL heALTh ReSeARCh 3
community tube wells and 10 million private tube wells are in use in Bangladesh (BBS 2012). It has been estimated that 15–100 people are served by one tube well (WASSA 2004; BBS 2011).
In Bangladesh, the main issues surrounding water quality are microbial pathogens, arsenic (As) in groundwater and salinity. Although a significant issue, bacterial contamination of water is not addressed here. For decades, the widespread contamination of groundwater by As in Bangladesh has been recognized as a severe problem (Ahmed et al. 2006; Ahmed 2011). Although it is naturally occurring, As contamination is a continuing public health issue in Bangladesh, potentially affecting millions of people (Chowdhury 2010; BBS 2011). Salinity has been recognized as a significant water problem in coastal Bangladesh for some time, as a result of both man-made and natural causes (Uddin & Kaudstaal 2003; Rahman & Bhattacharya 2006; Mahmuduzzaman et al. 2014). While water quality in Bangladesh has been acknowledged as a problem, many studies focus on either arsenic or salinity, not both. What has not readily been recognized, however, is drinking water that contains arsenic also contains numerous other toxic chemicals, so the risk to residents is vastly under reported because risks are considered cumulative (USEPA 2007; WHO 2011).
Impacts of water insecurity
The effects on human health from poor water quality are well-known (WHO & UNICEF 2011). Chronic exposure to high levels of arsenic is associated with a multitude of health issues including cancers, cardiovascular disease and skin lesions (Joseph et al. 2015). The health effects of dietary salt intakes are understood and well-documented. However, studies on health effects of drinking saline water are scarce. Khan et al. (2011, 2014) demonstrated significant risk of pre/eclampsia and gestational hypertension in women in the Dacope Upazila of Bangladesh; rates were higher in coastal residents compared to non-coastal areas. Khan also showed that women consuming tube well drinking water were at higher health risks than those who used pond water or rainwater (Khan et al. 2014). Health impacts were also found to be considerably higher in the dry season than in the monsoon season (Khan et al. 2008).
Not only are there adverse health effects to people from drinking contaminated water, but there are lost opportunity costs associated with the time in collecting water, and time spent away from education and occupational pursuits; all of these are considered to affect both an individual’s and a community’s development potential (UNDP 2006). In Bangladesh, as in many developing countries, women carry the burden of water collection. Internationally, it has been estimated that 64 % of water collection duties fall to women (WHO & UNICEF 2011).
Assessment of water security on a national basis
Bangladesh was issued a Millennium Development Goal (MDG) in 2000 to halve the proportion of people in the country that do not have access to safe drinking water by 2015 (UN 2000). There was no specific quality requirement; water was considered ‘safe’ if obtained from an ‘improved water source’ (tube wells are considered ‘improved’, but ponds are not) (WHO & UNICEF 2000, 2011). Taking arsenic contamination of groundwater into consideration, it was estimated in 2015 that 86 % of Bangladesh’s population is considered to have access to safe drinking water, well towards its goal of 89 % (BBS 2011; GOB 2015). However, this method of estimating access to ‘safe’ water is flawed because it does not address the quality of drinking water; access issues such as seasonal availability, the number of sources used, and time it takes to collect water; or the reliability of the sources.
In Bangladesh, the population that continues to be without safe water is the country’s poorest and most vulnerable. Support documentation for the MDG defines distance to an ‘improved source’ as within one kilometre (1 km) of the dwelling. Although the MDG does not account for the time needed to collect water, for accounting purposes, the time taken for water collection is usually assumed to be 30 min or less, round trip (UNESCO 2009). The success of a rural water supply is directly related to the ability to keep it in working order, which is related to who owns the source, where it is located, its acceptance by the community, and local leadership (Crow & Sultana 2002; WHO & UNICEF 2011).
Dow
nloa
ded
by [
Van
derb
ilt U
nive
rsity
Lib
rary
], [
Jona
than
Gill
igan
] at
13:
49 1
9 Ju
ly 2
016
4 L. BeNNeywoRTh eT AL.
All of the factors described that contribute to water security at the national level also affect water security at the local level. The complexity and variability of these factors suggest that water security assessed at a national level could miss significant differences, and might be better assessed at the local scale, as described in this study.
Study area
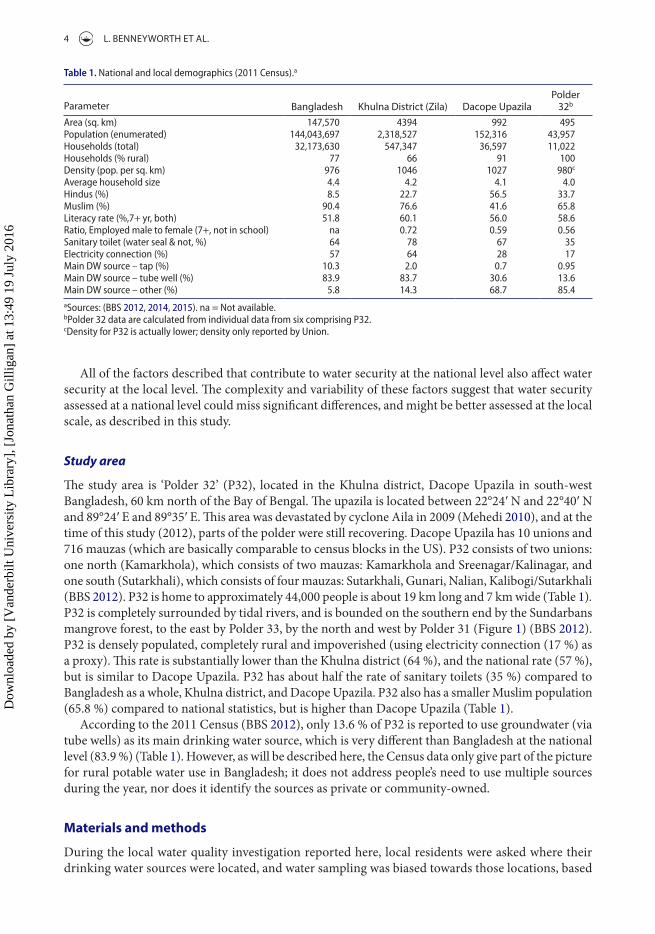
The study area is ‘Polder 32’ (P32), located in the Khulna district, Dacope Upazila in south-west Bangladesh, 60 km north of the Bay of Bengal. The upazila is located between 22°24′ N and 22°40′ N and 89°24′ E and 89°35′ E. This area was devastated by cyclone Aila in 2009 (Mehedi 2010), and at the time of this study (2012), parts of the polder were still recovering. Dacope Upazila has 10 unions and 716 mauzas (which are basically comparable to census blocks in the US). P32 consists of two unions: one north (Kamarkhola), which consists of two mauzas: Kamarkhola and Sreenagar/Kalinagar, and one south (Sutarkhali), which consists of four mauzas: Sutarkhali, Gunari, Nalian, Kalibogi/Sutarkhali (BBS 2012). P32 is home to approximately 44,000 people is about 19 km long and 7 km wide (Table 1). P32 is completely surrounded by tidal rivers, and is bounded on the southern end by the Sundarbans mangrove forest, to the east by Polder 33, by the north and west by Polder 31 (Figure 1) (BBS 2012). P32 is densely populated, completely rural and impoverished (using electricity connection (17 %) as a proxy). This rate is substantially lower than the Khulna district (64 %), and the national rate (57 %), but is similar to Dacope Upazila. P32 has about half the rate of sanitary toilets (35 %) compared to Bangladesh as a whole, Khulna district, and Dacope Upazila. P32 also has a smaller Muslim population (65.8 %) compared to national statistics, but is higher than Dacope Upazila (Table 1).
According to the 2011 Census (BBS 2012), only 13.6 % of P32 is reported to use groundwater (via tube wells) as its main drinking water source, which is very different than Bangladesh at the national level (83.9 %) (Table 1). However, as will be described here, the Census data only give part of the picture for rural potable water use in Bangladesh; it does not address people’s need to use multiple sources during the year, nor does it identify the sources as private or community-owned.
Materials and methods
During the local water quality investigation reported here, local residents were asked where their drinking water sources were located, and water sampling was biased towards those locations, based
Table 1. national and local demographics (2011 census).a
asources: (BBs 2012, 2014, 2015). na = not available.bPolder 32 data are calculated from individual data from six comprising P32.cDensity for P32 is actually lower; density only reported by union.
Parameter Bangladesh Khulna District (Zila) Dacope upazilaPolder
32b
area (sq. km) 147,570 4394 992 495Population (enumerated) 144,043,697 2,318,527 152,316 43,957Households (total) 32,173,630 547,347 36,597 11,022Households (% rural) 77 66 91 100Density (pop. per sq. km) 976 1046 1027 980c
average household size 4.4 4.2 4.1 4.0Hindus (%) 8.5 22.7 56.5 33.7muslim (%) 90.4 76.6 41.6 65.8literacy rate (%,7+ yr, both) 51.8 60.1 56.0 58.6ratio, employed male to female (7+, not in school) na 0.72 0.59 0.56sanitary toilet (water seal & not, %) 64 78 67 35electricity connection (%) 57 64 28 17main DW source – tap (%) 10.3 2.0 0.7 0.95main DW source – tube well (%) 83.9 83.7 30.6 13.6main DW source – other (%) 5.8 14.3 68.7 85.4
Dow
nloa
ded
by [
Van
derb
ilt U
nive
rsity
Lib
rary
], [
Jona
than
Gill
igan
] at
13:
49 1
9 Ju
ly 2
016
INTeRNATIoNAL JouRNAL oF eNvIRoNMeNTAL heALTh ReSeARCh 5
on field accessibility. Water samples were collected from 26 different drinking water sources: 12 groundwater (shallow tube wells) locations and 14 ponds, over two wet and dry seasons for the years 2012–2013, for a total of 41 samples (Figure 2). Two harvested rainwater samples were also analysed for limited parameters. In addition to P32, a few samples were collected from adjacent Polders 31 and 33.
Quality assurance/quality control samples were also collected and analysed during the local field investigation. Field parameters were obtained with a portable Hydrolab models 4a and DS5, and loca-tions ascertained using a Trimble GeoXT 6000. The samples were analysed by Vanderbilt University’s Civil Engineering lab for a variety of cations and anions using inductively coupled plasma mass spec-trometry (ICP-MS), ion chromatography and total organic carbon analyses. A companion study to this assessment is described by Ayers et al. (2016) which presents the sampling and analytical protocols in detail, as well as all of the raw data.
The two years of water quality data were combined by season and tested for normality by use of the Shapiro Wilkes test, as well for kurtosis and skewness. Kurtosis quantifies whether the shape of the data distribution matches the normal (Gaussian) distribution, which has a kurtosis of 0. Skewness tests for
Figure 1. (color online) location of study area.
Dow
nloa
ded
by [
Van
derb
ilt U
nive
rsity
Lib
rary
], [
Jona
than
Gill
igan
] at
13:
49 1
9 Ju
ly 2
016
6 L. BeNNeywoRTh eT AL.
symmetry of the data distribution; the degree of symmetry is an indicator of the normal distribution (Helsel & Hirsch 2002). Because all of the detected chemical concentrations did not fit a lognormal (or other typical distribution) and the sample size was small (<50), a non-parametric test (Wilcoxon Rank Sum test) was used to evaluate statistical significance of differences in means in drinking water sources between the wet and dry seasons.
In addition to the physical measurements, a detailed Ethnosurvey was conducted by Vanderbilt’s social science team from October to December 2013 in 200 randomly selected households in the northernmost and southernmost mauzas: Kamarkhola and Kalibogi/Sutarkhali, respectively, on P32. The Ethnosurvey was designed as a pilot for a wider geographic study of the region, and provided information on local drinking water sources, uses and access issues. An additional Informal Water Use Survey of 31 respondents was conducted during the October 2013 sampling season.
Results and discussion
Assessment of drinking water security can be perceived in terms of: availability – types and numbers of sources available, source ownership, other uses, sufficient water quantity and reliability/continuity of service based on seasonality, treatment and maintenance; accessibility – available within a reason-able distance, or able to be collected within a reasonable time, affordable and free of gender and class discrimination; and quality – safe for consumption and aesthetically acceptable (Crow & Sultana 2002).
Drinking water availability and accessibility
Drinking water sources and ownershipThe water quality investigation of P32 indicated that over 84 % of the drinking water sources sampled were identified as ‘community’ sources, which in this context meant that more than one family could access the source, and was responsible for its operation and upkeep. In the Ethnosurvey, it was found that some types of drinking water source tended to be privately owned and maintained, while others were community-owned and maintained. In both mauzas evaluated in the Ethnosurvey, the water sources were predominantly owned by the households, although there were more household-owned sources in Kamarkhola (52 %) than in Kalibogi (39 %). The most common water sources that were noted as owned by households in both mauzas, on average, were rainwater (70 %) and fresh pond
Figure 2. (color online) types of drinking water sources used seasonally (ethnosurvey).
Dow
nloa
ded
by [
Van
derb
ilt U
nive
rsity
Lib
rary
], [
Jona
than
Gill
igan
] at
13:
49 1
9 Ju
ly 2
016
INTeRNATIoNAL JouRNAL oF eNvIRoNMeNTAL heALTh ReSeARCh 7
water (distinguished shrimp ponds) (20 %). The water sources most noted as community-owned were fresh ponds (49 %) and river water (30 %). Results indicate that P32 residents rely on surface water sources more than groundwater. By comparison, the 2011 Census (BBS 2012) indicated that 5.8 % of the population uses ‘other’ as its main drinking water source on a national level, which includes ponds, rainwater and surface waters (Table 1).
Non-drinking water usesIn the Ethnosurvey of the two P32 mauzas, queries were made about which water sources were used for purposes other than drinking. The most frequent types of water sources noted for cooking were fresh pond water (57 %), and harvested rainwater (25 %). Fresh pond water (44 %), river water (29 %) and shrimp/fish pond water (20 %) were most commonly noted as sources for bathing. Water sources noted predominantly for household cleaning were fresh pond water (44 %), river water (24 %) and shrimp/fish pond water (24 %). Other than for drinking, tube wells were noted for other uses less than 2 %. These results indicate the possibility of reserving higher quality water for drinking and cooking.
SeasonalityThe Informal Water Use Survey of P32 found that no household used just one water source during the year; in fact, 74 % used two or more sources, 16 % used three or more and 10 % used four or more sources. Residents also reported in the Informal Water Use Survey that they used groundwater, rainwater and surface water for equal months during the year on average (3.6, 4.8 and 3.7 months/year, respectively). The Ethnosurvey indicated that 48 % of the residents in two mauzas in P32 use harvested rainwater, 40 % use fresh pond water and 5 % use tube wells as a drinking source at some time throughout the year. The water sources used predominantly in the monsoon season for drink-ing were harvested rainwater (94 %) and river water (44 %). Sources used most frequently in the dry season only were bottled (100 %), tube wells (53 %) and fresh pond water (31 %). The results for the sources used year-round were somewhat confusing: shrimp/fish ponds (88 %), river water (56 %); and fresh pond water (54 %) (Figure 2). These results indicate that rainwater is used extensively when it is plentiful in the monsoon season, but is precluded from being used year-round, presumably from lack of storage. In addition, of the population that uses tube wells for drinking water, about 32 % rely on using tube wells year-round.
Treatment and reliabilityIn the Ethnosurvey of the two P32 mauzas, it was found that the most common home water treat-ment (HWT) of surface water was ‘none’ (51 %), followed by ‘fitkari’ (also known as alum) (24 %); and PSF (18 %); only one responded ‘boiled’ as water treatment. Groundwater is not treated. In this area of Bangladesh, people do not have enough fuel to boil their drinking water, or the wealth to buy fuel. No municipal water supply was available in P32, except for in the Mauza of Nalian, which has a water treatment facility (not sampled in this investigation). Although a few ‘taps’ and water lines were observed, these are sourced to fresh ponds, usually with a PSF.
Maintenance of drinking water sourcesWhen asked during the Ethnosurvey about who maintained the water sources in the two mauzas evaluated, collectively more sources were maintained by households (47 %), rather than community (26 %), ‘not maintained’ (17 %) or NGOs (1 %). When viewed by water source, those most often noted as ‘not maintained’ were river water (62 %), and shrimp/fish ponds (35 %). The water sources most often maintained by the household included harvested rainwater (91 %), shrimp pond water (44 %) and fresh pond water (27 %). People indicated that rainwater was not maintained by the community (0 %), and that tube wells (52 %), ‘other’ (54 %) and fresh ponds (46 %) were more likely to be main-tained by the community.
Dow
nloa
ded
by [
Van
derb
ilt U
nive
rsity
Lib
rary
], [
Jona
than
Gill
igan
] at
13:
49 1
9 Ju
ly 2
016
8 L. BeNNeywoRTh eT AL.
Water collection travel time, distance and genderIn the P32 Ethnosurvey, 81 % of the respondents said that a water collection trip took 20 min or less (one roundtrip); this time is comparable to that established by the MDG. However, the results do not consider season, or the number of trips per day.
Drinking water quality
Only detected constituents with Bangladesh water quality standards (GOB 1997) were further evaluated in this investigation: specific conductivity (SpC), aluminium (Al), arsenic (As), boron (B), barium (Ba), calcium (Ca), chloride (Cl), copper (Cu), fluorine (F), iron (Fe), potassium (K), magnesium (Mg), manganese (Mn), sodium (Na), phosphorus (P), nickel (Ni), zinc (Zn) and nitrate (NO−
3). The
conductivity of solution is a measurement of how well it can conduct an electrical current for a unit length and a unit cross-section; when adjusted for ambient temperature, the measurement is referred to as ‘SpC’. The conductivity of water is a function of the rate of movement of charges, which is a function of the speed, magnitude of the charge and concentrations of the total individual ions in the water. The more dissolved ions in water, the greater its electrical conductivity (Kemker 2014).
As described below, tube well concentrations for the two constituents of primary interest (As and SpC) were greater than pond concentrations. There was no statistically significant seasonal difference in means in As and SpC found in tube wells collectively, but there was a difference for ponds. This is expected since it is thought that shallow groundwater in this region is not being diluted and recharged by rainwater, whereas fresh ponds would intercept all incident precipitation. Ayers et al. (2016) found slightly different groundwater results for the same geographic area; however, non-drinking water sources were included in that assessment.
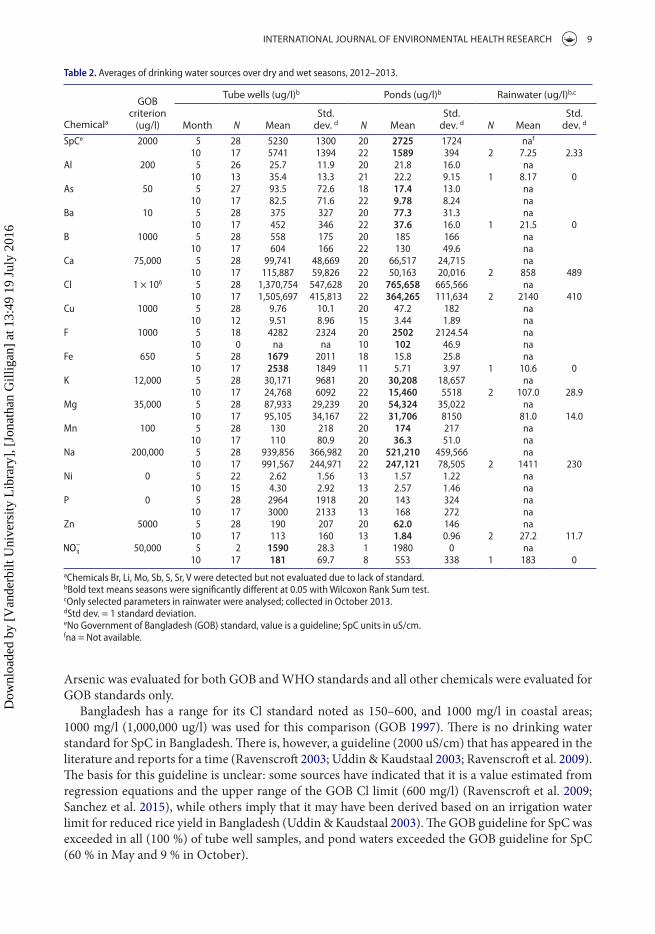
Arsenic is usually present in natural waters at concentrations <2 ug/l (WHO 2011). The range of As concentrations in tube wells found in this investigation was 2.4–254 ug/l in May (dry season), and 2.8–36.6 ug/l in October (wet season). The average concentration of As in tube wells on P32 was over 40 times natural concentrations: 93.5 ug/l in May and 82.5 ug/l in October (Table 2). The range of As concentrations in ponds on P32 was 3.1–49.1 ug/l in May and 2.8–36.6 ug/l in October. Average As concentrations in ponds were much lower than tube wells: 17.4 ug/l in May and 9.78 ug/l in October (Figure 3). For tube wells, mean As concentrations were not statistically significantly different from May (dry season) to October (wet season). In fact, of all constituents, only Fe and NO−
3 were found
to be significantly different by season in groundwater. However, As concentrations in ponds were significantly different by season, along with many other parameters.
The typical range of electrical conductivity for fresh rivers is 0–800 uS/cm (<0.5 part per thousand, ppt), and seawater is 55,000 uS/cm (about 35 ppt). Natural fresh groundwater has electrical conduc-tivity levels that are generally <300 uS/cm (Kemker 2014). The range of SpC concentrations tube wells on P32 was 10–25 times higher than natural concentrations: 3124–8012 uS/cm in May (dry season), and 3565–8220 uS/cm in October (wet season). The average SpC concentration in tube wells on P32 was 5230 uS/cm in May and 5731 uS/cm in October (Table 2).
The range of SpC concentrations in ponds on P32 was 1019–8136 uS/cm in May and 1017–2480 uS/cm in October. Average SpC concentrations in ponds were much lower than tube wells, but were lower during the wet than the dry season: 2725 uS/cm in May and 1589 uS/cm in October (Figure 4). For tube wells, mean SpC concentrations were not found to be statistically significantly different from May (dry season) to October (wet season); mean SpC concentrations in ponds were found to be significantly different by season.
Comparisons of P32 concentrations to water quality criteria
The P32 water results were compared to the current government of Bangladesh (GOB 1997) drinking water standards to ascertain the level of quality of local drinking water. GOB drinking water standards were more stringent than WHO guidelines (2011) for all of the chemicals evaluated except As and Cl.
Dow
nloa
ded
by [
Van
derb
ilt U
nive
rsity
Lib
rary
], [
Jona
than
Gill
igan
] at
13:
49 1
9 Ju
ly 2
016
INTeRNATIoNAL JouRNAL oF eNvIRoNMeNTAL heALTh ReSeARCh 9
Arsenic was evaluated for both GOB and WHO standards and all other chemicals were evaluated for GOB standards only.
Bangladesh has a range for its Cl standard noted as 150–600, and 1000 mg/l in coastal areas; 1000 mg/l (1,000,000 ug/l) was used for this comparison (GOB 1997). There is no drinking water standard for SpC in Bangladesh. There is, however, a guideline (2000 uS/cm) that has appeared in the literature and reports for a time (Ravenscroft 2003; Uddin & Kaudstaal 2003; Ravenscroft et al. 2009). The basis for this guideline is unclear: some sources have indicated that it is a value estimated from regression equations and the upper range of the GOB Cl limit (600 mg/l) (Ravenscroft et al. 2009; Sanchez et al. 2015), while others imply that it may have been derived based on an irrigation water limit for reduced rice yield in Bangladesh (Uddin & Kaudstaal 2003). The GOB guideline for SpC was exceeded in all (100 %) of tube well samples, and pond waters exceeded the GOB guideline for SpC (60 % in May and 9 % in October).
Table 2. averages of drinking water sources over dry and wet seasons, 2012–2013.
achemicals Br, li, mo, sb, s, sr, v were detected but not evaluated due to lack of standard.bBold text means seasons were significantly different at 0.05 with Wilcoxon rank sum test.conly selected parameters in rainwater were analysed; collected in october 2013.dstd dev. = 1 standard deviation.eno Government of Bangladesh (GoB) standard, value is a guideline; spc units in us/cm.fna = not available.
The year-wise average Na (a major contributor to SpC) concentrations from P32 were over 370,000 ug/l for ponds, and over 950,000 ug/l for tube wells. Although rainwater sampling was lim-ited, there is a marked difference in all detected concentrations compared to either tube well or pond water (Table 2). In a study conducted by Khan et al. (2014) in Dacope Upazila, mean levels of Na in drinking water measured from Kamarkhola and Sutarkhali Unions were 374,000 and 714,000 ug/l, for all ponds and tube wells, respectively. Khan noted that drinking water with Na levels over 500 mg/L was ‘exceptionally high’, and this level was the equivalent of 27 times the Na limit recommended by the USEPA (2003). By comparison, Khan’s results indicate that residents from P32 face similar, if not higher, health risks from salinity.
Figure 3. (color online) spatial distribution of water quality results: arsenic (as).
Dow
nloa
ded
by [
Van
derb
ilt U
nive
rsity
Lib
rary
], [
Jona
than
Gill
igan
] at
13:
49 1
9 Ju
ly 2
016
INTeRNATIoNAL JouRNAL oF eNvIRoNMeNTAL heALTh ReSeARCh 11
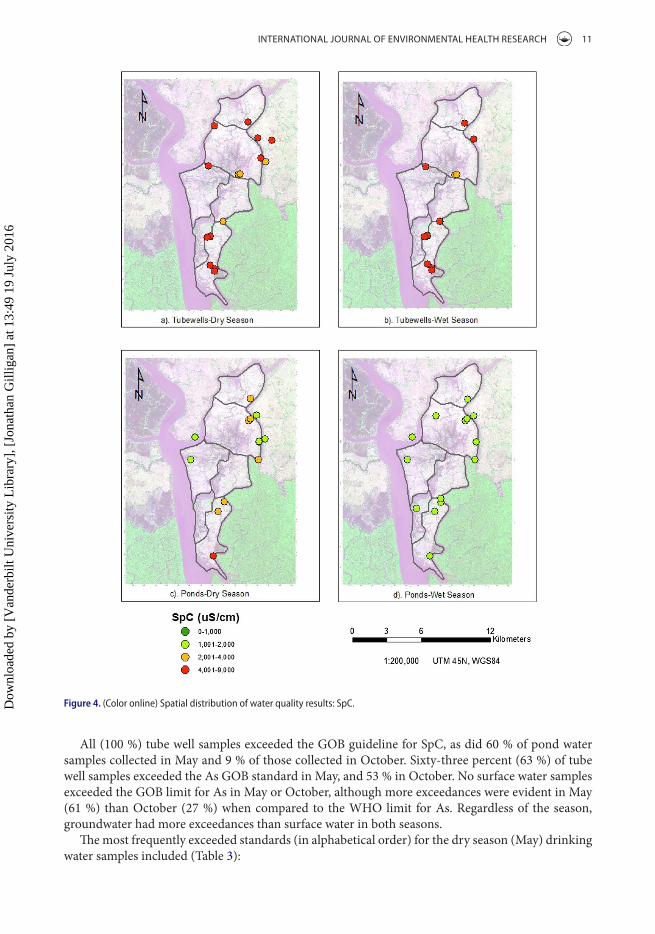
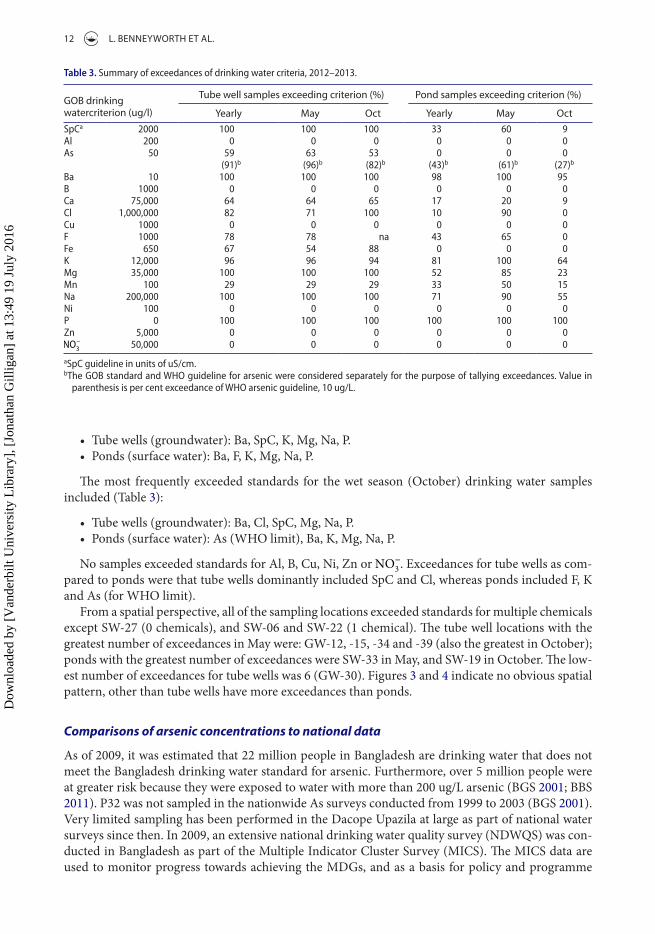
All (100 %) tube well samples exceeded the GOB guideline for SpC, as did 60 % of pond water samples collected in May and 9 % of those collected in October. Sixty-three percent (63 %) of tube well samples exceeded the As GOB standard in May, and 53 % in October. No surface water samples exceeded the GOB limit for As in May or October, although more exceedances were evident in May (61 %) than October (27 %) when compared to the WHO limit for As. Regardless of the season, groundwater had more exceedances than surface water in both seasons.
The most frequently exceeded standards (in alphabetical order) for the dry season (May) drinking water samples included (Table 3):
Figure 4. (color online) spatial distribution of water quality results: spc.Dow
No samples exceeded standards for Al, B, Cu, Ni, Zn or NO−
3. Exceedances for tube wells as com-
pared to ponds were that tube wells dominantly included SpC and Cl, whereas ponds included F, K and As (for WHO limit).
From a spatial perspective, all of the sampling locations exceeded standards for multiple chemicals except SW-27 (0 chemicals), and SW-06 and SW-22 (1 chemical). The tube well locations with the greatest number of exceedances in May were: GW-12, -15, -34 and -39 (also the greatest in October); ponds with the greatest number of exceedances were SW-33 in May, and SW-19 in October. The low-est number of exceedances for tube wells was 6 (GW-30). Figures 3 and 4 indicate no obvious spatial pattern, other than tube wells have more exceedances than ponds.
Comparisons of arsenic concentrations to national data
As of 2009, it was estimated that 22 million people in Bangladesh are drinking water that does not meet the Bangladesh drinking water standard for arsenic. Furthermore, over 5 million people were at greater risk because they were exposed to water with more than 200 ug/L arsenic (BGS 2001; BBS 2011). P32 was not sampled in the nationwide As surveys conducted from 1999 to 2003 (BGS 2001). Very limited sampling has been performed in the Dacope Upazila at large as part of national water surveys since then. In 2009, an extensive national drinking water quality survey (NDWQS) was con-ducted in Bangladesh as part of the Multiple Indicator Cluster Survey (MICS). The MICS data are used to monitor progress towards achieving the MDGs, and as a basis for policy and programme
Table 3. summary of exceedances of drinking water criteria, 2012–2013.
aspc guideline in units of us/cm.bthe GoB standard and WHo guideline for arsenic were considered separately for the purpose of tallying exceedances. value in
parenthesis is per cent exceedance of WHo arsenic guideline, 10 ug/l.
INTeRNATIoNAL JouRNAL oF eNvIRoNMeNTAL heALTh ReSeARCh 13
interventions. Water samples were collected for 15,000 household clusters, and aggregated to the district level. Arsenic and 26 other parameters were collected and analysed, although SpC was not analysed. The As samples were analysed by Digital Arsenators, and a subset of samples (about 20 %) were analysed in a lab by ICP-MS (BBS 2011) for verification. Data ‘by source’ (shallow groundwater, surface water, etc.) are available only at the national level, and only As Arsenator data are available at the upazila level (including Dacope). In order to provide a reasonable comparison with the local P32 results, only the NDWQS lab data are used.
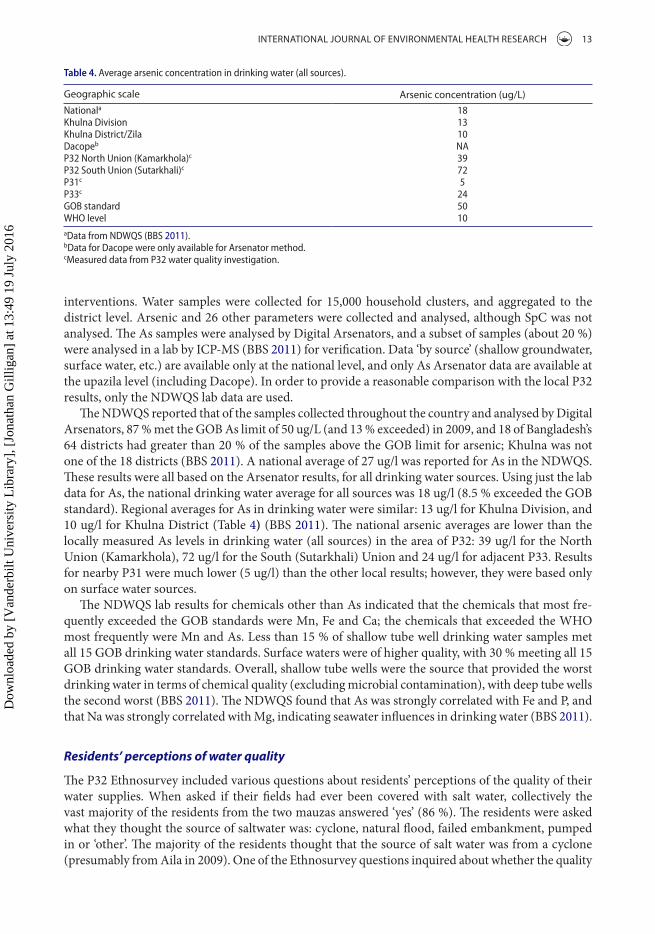
The NDWQS reported that of the samples collected throughout the country and analysed by Digital Arsenators, 87 % met the GOB As limit of 50 ug/L (and 13 % exceeded) in 2009, and 18 of Bangladesh’s 64 districts had greater than 20 % of the samples above the GOB limit for arsenic; Khulna was not one of the 18 districts (BBS 2011). A national average of 27 ug/l was reported for As in the NDWQS. These results were all based on the Arsenator results, for all drinking water sources. Using just the lab data for As, the national drinking water average for all sources was 18 ug/l (8.5 % exceeded the GOB standard). Regional averages for As in drinking water were similar: 13 ug/l for Khulna Division, and 10 ug/l for Khulna District (Table 4) (BBS 2011). The national arsenic averages are lower than the locally measured As levels in drinking water (all sources) in the area of P32: 39 ug/l for the North Union (Kamarkhola), 72 ug/l for the South (Sutarkhali) Union and 24 ug/l for adjacent P33. Results for nearby P31 were much lower (5 ug/l) than the other local results; however, they were based only on surface water sources.
The NDWQS lab results for chemicals other than As indicated that the chemicals that most fre-quently exceeded the GOB standards were Mn, Fe and Ca; the chemicals that exceeded the WHO most frequently were Mn and As. Less than 15 % of shallow tube well drinking water samples met all 15 GOB drinking water standards. Surface waters were of higher quality, with 30 % meeting all 15 GOB drinking water standards. Overall, shallow tube wells were the source that provided the worst drinking water in terms of chemical quality (excluding microbial contamination), with deep tube wells the second worst (BBS 2011). The NDWQS found that As was strongly correlated with Fe and P, and that Na was strongly correlated with Mg, indicating seawater influences in drinking water (BBS 2011).
Residents’ perceptions of water quality
The P32 Ethnosurvey included various questions about residents’ perceptions of the quality of their water supplies. When asked if their fields had ever been covered with salt water, collectively the vast majority of the residents from the two mauzas answered ‘yes’ (86 %). The residents were asked what they thought the source of saltwater was: cyclone, natural flood, failed embankment, pumped in or ‘other’. The majority of the residents thought that the source of salt water was from a cyclone (presumably from Aila in 2009). One of the Ethnosurvey questions inquired about whether the quality
Table 4. average arsenic concentration in drinking water (all sources).
aData from nDWQs (BBs 2011).bData for Dacope were only available for arsenator method.cmeasured data from P32 water quality investigation.
Geographic scale Arsenic concentration (ug/L)nationala 18Khulna Division 13Khulna District/Zila 10Dacopeb naP32 north union (Kamarkhola)c 39P32 south union (sutarkhali)c 72P31c 5P33c 24GoB standard 50WHo level 10
Dow
nloa
ded
by [
Van
derb
ilt U
nive
rsity
Lib
rary
], [
Jona
than
Gill
igan
] at
13:
49 1
9 Ju
ly 2
016
14 L. BeNNeywoRTh eT AL.
of residents’ water supplies had increased or decreased in 20 years. Collectively for all sources, 42 % said there had been a decrease in quality, 39 % said they observed an increase in quality and 20 % said they observed no change. Residents were asked if their water had a ‘bad taste’, and the majority (70 %) said ‘no’. The water source which was noted to have a ‘bad taste’ most often was ponds (63 %). Of those that responded that their main drinking water source was tube wells, only 15.4 % thought that the water tasted bad. Of the water sources evaluated, residents were asked if they perceived their water as salty, and the dominant answer was ‘no’ (88 %). More people thought that fresh pond water was salty (54 %) than thought tube well water was salty (11 %). It is interesting that most of the residents did not perceive the water as having a bad or salty taste, given that 100 % of the tube well samples exceeded the SpC guideline; furthermore, the analytical results indicate that pond water was of higher quality than tube well water (Tables 2 and 3).
Problems with potential mitigation measures
There are numerous possible options to address the challenges faced by Bangladesh regarding drinking water insecurity. The obvious technical solution for this rural area is to enhance infrastructure, such as construction of large, community-operated, rain-fed reservoirs; however, anticipated costs and the lack of governance in Bangladesh makes success of this type of resource management doubtful (Gunda et al. 2015). This was demonstrated by the observation of many poorly maintained and dysfunctional rainwater collection systems on P32.
The switch from surface water in the 1990s in Bangladesh as the primary drinking supply to shal-low tube wells greatly reduced deaths from communicable diseases, but led to the realization of the widespread arsenic contamination in shallow groundwater (Ahmed et al. 2006). Significant research efforts have been devoted to the removal of arsenic from shallow groundwater (Ahmed et al. 2006; Chowdhury 2010); however, this research does not address the salinity also present in drinking water. Ahmed et al. (2006) suggested that the widespread testing of wells for As was the most effective mit-igation measure in reducing people’s exposure to arsenic, as it led to a behavioural change in people’s selection of water sources; however, this response also does not address salinity. Others have found that the knowledge of which wells had high As concentrations fades quickly, and is inconsequential if the wells are repainted.
Although deep groundwater wells have been shown to provide uncontaminated, ‘sweet water’ in some areas, this is not consistently true throughout the coastal region (Abedin et al. 2014). Treatment of water is another obvious potential solution to Bangladesh’s drinking water problem. However, the costs for treatment beyond PSFs are too great for most rural communities, and municipal sources are rare in the rural areas. HWT is highly variable in developing countries, and essentially not practiced in Bangladesh. Treatment of water at home is correlated with wealth, and coastal Bangladesh is not a wealthy area (WHO & UNICEF 2011; Harun & Kabir 2013). PSF can serve many families and deliver drinking water of higher quality than shallow groundwater, but are less desirable in terms of taste, the inability to treat all contaminants (including salinity) and maintenance requirements.
Community ownership and local leadership can help explain why some rural communities are more water secure than others, primarily because maintenance is addressed locally (Abedin et al. 2014). Alternatives to groundwater sources for drinking water may improve water security in coastal Bangladesh, but have trade-offs. Increasing household rainwater harvesting reserves appears to be the best solution from a quality and access perspective, but start-up costs are prohibitive to most rural residents, the source is subject to drought and the number of people served is small (Harun & Kabir 2013).
Conclusions
This interdisciplinary study has demonstrated that both groundwater and surface water drinking sources in the south-west coastal area of Bangladesh have levels of arsenic, salinity and a multitude of
Dow
nloa
ded
by [
Van
derb
ilt U
nive
rsity
Lib
rary
], [
Jona
than
Gill
igan
] at
13:
49 1
9 Ju
ly 2
016
INTeRNATIoNAL JouRNAL oF eNvIRoNMeNTAL heALTh ReSeARCh 15
other contaminants above Bangladesh’s drinking water criteria. It has been shown that aggregation of drinking water data on a national scale masks local differences. Despite claims of achieving the MDG on a national level, the security and sustainability of drinking water supplies at P32 is clearly threatened, and is expected to continue to be as the population increases over time. This paper has demonstrated that assessing social conditions is important to understanding water security at a local level.
Despite the resiliency of the people living on Bangladesh’s coast, the efforts of NGOs in this area, and the many years of research that has been conducted, residents on P32 and the region are still faced with water insecurity and their health and livelihoods continue to suffer. Resolving water insecurity here presents a conundrum. Issues are evident from both the supply and the demand sides, and solu-tions to this dilemma are not easy or readily evident as they span social, political, environmental and technical realms. This research has elucidated that the water security problem does not become any less difficult by understanding the water quality in more detail or discerning which mitigation tech-nology that needs to be applied, but rather what is needed is an understanding of how a solution can be successfully implemented at P32 and similar areas of rural Bangladesh. Insights for implementation of solutions are gained by the integration of social data in water quality investigations and the collab-oration of physical and social scientists. This integrated approach has the most promising outlook for solving the problem of water insecurity in coastal Bangladesh.
As harrowing as the problem of water insecurity is at P32, conditions may be worse at other coastal polders, as well as in other countries. It is imperative to the people of south-western Bangladesh that affordable approaches to providing safe drinking water be developed, and soon. Without water security, there is no food security, energy security is jeopardized and economic growth and poverty reduction are not sustainable. As human and economic development continues to pressure diminishing water resources, the need for knowledge of concepts, methods and tools will only increase in an attempt to effectively manage water shortages at P32 and beyond.
Disclosure statementNo potential conflict of interest was reported by the authors.
FundingThis work was supported by the United States Office of Naval Research Grant N00014-11-1-0683 and IRB 130235.
ReferencesAbedin MA, Habiba U, Shaw R. 2014. Community perception and adaptation to safe drinking water scarcity: salinity,
arsenic, and drought risks in coastal Bangladesh. Int J Disaster Risk Sci. 5:110–124.Ahmed KM. 2011. III.4 Aquatic ecosystems, chapter 25: groundwater contamination in Bangladesh. In: Grafton RQ,
Hussey K, editors. Water resources planning and management. Cambridge: University Press; p. 529–560.Ahmed MF, Ahuja S, Alauddin M, Hug SJ, Lloyd JR, Pfaff A, Pichler T., Saltikov C, Stute M. 2006. Epidemiology: ensuring
safe drinking water in Bangladesh. Science. 314:1687–1688.Ansari MS, Islam HMN, Roy K. 2011. Functionality and social acceptance of safe water, technology pond sand filter
(PSF) and rainwater harvesting system (RWHS) in the southwest coastal region of Bangladesh. Saarbrucken: VDM Verlag; p. 1–76.
Ayers J, Gregory G, Fry D, Benneyworth L, Roy K, Karim MR, Akhter F, Goodbred S. Forthcoming 2016. Sources of salinity and arsenic in water in SW Bangladesh 1: groundwater. Geochemical Transactions.
[BBS] Bangladesh Bureau of Statistics. 2011. Bangladesh National Drinking Water Quality Survey of 2009 (NDWQS), with UNICEF.
[BBS] Bangladesh Bureau of Statistics. 2012. Census population and housing census 2011: socio-economic and demographic report, national series, volume 4.
[BBS] Bangladesh Bureau of Statistics. 2014. Census population and housing census 2011: national report, union statistics, volume 2.
[BBS] Bangladesh Bureau of Statistics. 2015. Census population and housing census 2011: community report. Zila: Khulna.
[BGS] British Geological Survey & WaterAid. 2001. Groundwater quality: Bangladesh information sheet 2001; p. 1–6.Chowdhury NT. 2010. Water management in Bangladesh: an analytical review. Water Policy. 12:32–51.Crow B, Sultana F. 2002. Gender, class, and access to water: three cases in a poor and crowded delta. Soc Nat Res.
15(8):709–724.Datta DK, Roy K, Hassan N. 2010. Chapter 15: shrimp culture: trend, consequences and sustainability in the south-
western coastal region of Bangladesh. In: Ramanathan, AL, Bhattacharya, P, Dittmar, T, Prasad, MBK, Nupane, BR, editors. Management and sustainable development of coastal zone environments. Springer; p. 227–244.
Falkenmark M, Rockström J, Karlberg L. 2009. Present and future water requirements for feeding humanity. Food Sec. 1:59–69.
[FAO] Food and Agriculture Organization of the United Nations. 2009. Situation assessment report in southwest coastal region of Bangladesh for the livelihood adaptation to climate change (LACC) project. (Report BDG/01/004/01/99).
[GOB] Government of the People’s Republic of Bangladesh. 1997. Department of Environment (BDOE), 1997. The Environment Conservation Rules, 1997; Schedule 3 - Standards for Water. (EQS) Bangladesh.
[GOB] Government of the People’s Republic of Bangladesh, General Economics Division. 2015. Millennium development goals: Bangladesh progress report 2015.
Gunda T, Benneyworth L, Burchfield E. 2015. Exploring water indices and associated parameters: a case study approach. Water Policy. 17:98–111.
Harun MA, Kabir GM. 2013. Evaluating pond sand filter as sustainable drinking water supplier in the Southwest coastal region of Bangladesh. Appl Water Sci. 3:161–166.
Helsel DR, Hirsch RM. 2002. Chapter A3: Statistical methods in water resources. In: US Geological Survey, editor. Techniques of water-resources investigations of the US Geological, Survey Book 4, Hydrologic analysis and interpretation, 522 pages. [cited 2016 March 28]. Available from: http://pubs.usgs.gov/twri/twri4a3/.
[IPCC] Intergovernmental Panel on Climate Change. 2007. Chapter 10: Asia. In: Parry M, Canziani O, Palutikof J, van der Linden P, Hanson C, editors. Climate change 2007: impacts, adaptation and vulnerability. Contribution of working group II to the fourth assessment report of the intergovernmental panel on climate change. Cambridge: Cambridge University Press; p. 469–506.
Joseph T, Dubey B, McBean EA. 2015. A critical review of arsenic exposures for Bangladeshi adults. Sci Tot Environ. 527–528:540–551.
Kemker C. 2014. Conductivity, salinity and total dissolved solids. Fundamentals of environmental measurements. Fondriest Environmental, Inc.; [cited 2014 March 3]. Available from: http://www.fondriest.com/environmentalmeasurements-parameters/water-quality/conductivity-salinity-tds/.
Khan A, Ireson A, Kovats S, Mojumder SK, Khusru A, Rahman A, Vineis P. 2011. Drinking water salinity and maternal health in coastal Bangladesh: implications of climate change. Environ Health Perspect. 119:1328–1332.
Khan A, Mojumder SK, Kovats S, Vineis P. 2008. Saline contamination of drinking water in Bangladesh. Lancet. 371:385.Khan A, Scheelback PF, Shilpi AB, Chan Q, Mojumder SK, Rahman A, Haines A, Kovats S, Vineis P. 2014. Salinity in
drinking water and the risk of (pre)eclampsia and gestational hypertension in coastal Bangladesh: a case-control study. PLOS One 9(9):e108715; [cited 2014 September 30]. Available from: http://journals.plos.org/plosone/article?id=10.1371/journal.pone.0108715.
Mahmuduzzaman M, Ahmed ZU, Nuruzzaman AKM, Ahmed FRS. 2014. Causes of salinity intrusion in coastal belt of Bangladesh. Int J Plant Res. 4:8–13.
Mallick B, Rahman KR, Vogt J. 2011. Coastal livelihood and physical infrastructure in Bangladesh after cyclone Aila. Mitig Adapt Strateg Glob Change. doi:http://dx.doi.org/10.1007/s11027-011-9285-y; [cited 2011 January 28]. Available from: http://www.academia.edu/10474895/Coastal_livelihood_and_physical_infrastructure_after_cyclone_Aila.
Mehedi H. 2010. Climate induced displacement: case study of cyclone Aila in the southwest coastal region of Bangladesh. Khulna: Humanitywatch; p. 1–28.
Rahman MM, Bhattacharya AK. 2006. Salinity intrusion and its management aspects in Bangladesh. J Environ Hydrol. 14:1–8.
Ravenscroft P. 2003. Chapter 3: overview of the hydrogeology of Bangladesh. In: Rahman AA, Ravenscroft P, editors. Groundwater resources and development in Bangladesh: background to the arsenic crisis, agricultural potential, and the environment. Dhaka: University Press; p. 43–86.
Ravenscroft P, Ahmed KM, Samad MA. 2009. Sector development plan (FY 2011-25): water supply and sanitation sector in Bangladesh; groundwater: quantity and quality issues affecting water supply. (Government of Bangladesh local government division, policy support unit working document no. 9).
Sanchez MF, Bashar K, Janssen G, Vogels M, Snel J, Zhou Y, Stuurman R, Essink O. 2015. SWIBANGLA: managing salt water intrusion impacts in coastal groundwater systems of Bangladesh. (Deltares report no. 1207671-000-BGS-0016).
Uddin AMK, Kaudstaal R. 2003. Delineation of the coastal zone. Program development office for the integrated coastal zone management plan (PDO-ICZMP working paper WP005).
INTeRNATIoNAL JouRNAL oF eNvIRoNMeNTAL heALTh ReSeARCh 17
[UN] United Nations. 2000. Resolution A/55/L.2, ‘United Nations Millennium Declaration’ adopted by the UN General Assembly, 18 September 2000.
[UN Water] United Nations Water. 2013. Water security & the global water agenda: a UN-water analytical brief. Available from: http://www.unwater.org/downloads/watersecurity_analyticalbrief.pdf.
[UNDP] United Nations Development Programme. 2006. Human development report 2006: beyond scarcity: power, poverty and the global water crisis. (ISBN 0-230-50058-7). Available from: http://hdr.undp.org/sites/default/files/reports/267/hdr06-complete.pdf.
[UNESCO] United Nations Educational, Scientific, and Cultural Organization. 2009. The United Nations world water development report 3 (WWDR3): water in a changing world, UN water world water assessment programme. (UNESCO ISBN: 978-9-23104-095-5). Available from: http://webworld.unesco.org/water/wwap/wwdr/wwdr3/pdf/WWDR3_Water_in_a_Changing_World.pdf.
[UNESCO] United Nations Educational, Scientific, and Cultural Organization. 2012. The United Nations world water development report 4 (WWDR4), vol. 1: managing water under uncertainty & risk, UN water world water assessment programme. (UNESCO ISBN: 978-92-3-104235-5). Available from: http://www.unesco.org/new/en/natural-sciences/environment/water/wwap/wwdr/wwdr4-2012/.
[USEPA] US Environmental Protection Agency. 2003. Drinking water advisory: consumer acceptability advice and health effects analysis on sodium. Washington, DC. (EPA 822-R-03-006).
[USEPA] US Environmental Protection Agency. 2007. Concepts, methods, and data sources for cumulative health risk assessment of multiple chemicals, exposures and effects: a resource document. Washington, DC. (EPA/600/R-06/013F).
[WASSA] Water and Security in South Asia. 2004. Water demand-supply gaps in south Asia, and approaches to closing the gaps. Carnegie Corporation of New York. Global Environment and Energy in the 21st Century, Honolulu, HI (WASSA project reports, vol. I, final report). Available from: http://www.gee-21.org/publications/water-demand-supply-gaps-in-south-asia.pdf.
[WHO] World Health Organization. 2011. Guidelines for water quality 2011. 4th ed. ISBN 9789241548151. Available from: http://apps.who.int/iris/bitstream/10665/44584/1/9789241548151_eng.pdf.
[WHO & UNICEF], World Health Organization & United Nations Children’s Fund, Joint monitoring programme for water supply and sanitation. 2000. Global water supply and sanitation assessment 2000 report. ISBN 9241562021. Available from: http://www.who.int/water_sanitation_health/monitoring/jmp2000/en/.
[WHO & UNICEF], World Health Organization & United Nations Children’s Fund, Joint monitoring programme for water supply and sanitation. 2011. Drinking water equity, safety and sustainability: thematic report on drinking water 2011. Available from: http://www.wssinfo.org/fileadmin/user_upload/resources/report_wash_low.pdf.