Vrije Universiteit Brussel Drivers of future changes in East African precipitation Souverijns, Niels; Thiery, Wim; Demuzere, M.; Van Lipzig, Nicole Published in: Environmental Research Letters Publication date: 2016 Document Version: Final published version Link to publication Citation for published version (APA): Souverijns, N., Thiery, W., Demuzere, M., & Van Lipzig, N. (2016). Drivers of future changes in East African precipitation. Environmental Research Letters, 11, 1-9. [114011]. General rights Copyright and moral rights for the publications made accessible in the public portal are retained by the authors and/or other copyright owners and it is a condition of accessing publications that users recognise and abide by the legal requirements associated with these rights. • Users may download and print one copy of any publication from the public portal for the purpose of private study or research. • You may not further distribute the material or use it for any profit-making activity or commercial gain • You may freely distribute the URL identifying the publication in the public portal Take down policy If you believe that this document breaches copyright please contact us providing details, and we will remove access to the work immediately and investigate your claim. Download date: 10. Feb. 2022
Transcript
Vrije Universiteit Brussel
Drivers of future changes in East African precipitationSouverijns, Niels; Thiery, Wim; Demuzere, M.; Van Lipzig, Nicole
Published in:Environmental Research Letters
Publication date:2016
Document Version:Final published version
Link to publication
Citation for published version (APA):Souverijns, N., Thiery, W., Demuzere, M., & Van Lipzig, N. (2016). Drivers of future changes in East Africanprecipitation. Environmental Research Letters, 11, 1-9. [114011].
General rightsCopyright and moral rights for the publications made accessible in the public portal are retained by the authors and/or other copyright ownersand it is a condition of accessing publications that users recognise and abide by the legal requirements associated with these rights.
• Users may download and print one copy of any publication from the public portal for the purpose of private study or research. • You may not further distribute the material or use it for any profit-making activity or commercial gain • You may freely distribute the URL identifying the publication in the public portalTake down policyIf you believe that this document breaches copyright please contact us providing details, and we will remove access to the work immediatelyand investigate your claim.
Supplementarymaterial for this article is available online
AbstractPrecipitation amounts over East Africa have been declining over the last decades. These changes andfuture climate change over the region are highly debated. This study analyzes drivers of futureprecipitation changes over East Africa by applying a classification of circulation patterns on 15historical and futuremembers of the COordinated Regional climateDownscaling EXperiment.Typical circulation types (CTs) are obtained.Under a high emission scenario, changes in the frequencyof occurrence of these CTs attribute for 23%of the total change in precipitation over East Africa by theend of the century. The remaining part (77%) is not related to East African synoptics, e.g. changes inmoisture content, local/mesoscale feedbacks, and changes inmoisture influx. These other effectscomprise increases in precipitation close to the equator and the Somali region, while decreases arefound over northwestern Ethiopia, the Sudan region and the lake areas.
1. Introduction
Climate over East Africa is characterized by highinterannual variations in precipitation numbers, con-tributing to a frequent succession of extreme dry andwet periods (e.g. Nicholson 1996, Segele et al 2009b).Moreover, in recent decades, a continuous decline inprecipitation numbers is observed (Lyon andDeWitt 2012, Viste et al 2013, Liebmann et al 2014,Niang et al 2014, Tierney et al 2015). This puts thepopulation, depending on rainfall in their water-fedagricultural system, under great pressure (Conway andSchipper 2011, Anyah and Qiu 2012, Hawinkelet al 2016). Currently, there is a lack of understandingof the physical and dynamical processes contributingto this interannual variability and the observed declinein precipitation. Most research has focused on identi-fying the relationship between precipitation amountsand El Niño Southern Oscillation (ENSO) or IndianOcean Dipole (IOD) events (Nicholson 1996, Indejeet al 2000, Behera et al 2005, Anyah andSemazzi 2006, 2007, Omondi et al 2012, 2013, Tierneyet al 2013). In general, dry periods are associated withLa Niña and/or negative IOD events, while wetperiods coincide with El Niño and/or positive IOD
events (Nicholson and Kim 1997, Schreck andSemazzi 2004). However, these processes do notexplain the full precipitation variability over EastAfrica. These caveats in understanding the presentprecipitation climate contribute to uncertainty infuture climate projections. Numerous Global (GCM)and Regional ClimateModel (RCM) studies project anincrease in annual precipitation over the areas locatednear the equator and the Greater Horn of Africa(Shongwe et al 2011, Otieno and Anyah 2013, Nianget al 2014, Buontempo et al 2015, Dosio andPanitz 2016, Kent et al 2015), contrasting the currentdrying trend. This apparent contradiction has beentermed the East African climate paradox and its causesso far remain unclear (Rowell et al 2015). Someauthors attribute part of the future increase inprecipitation to an enhancement of water vaporcontent in a warmer world and an intensification ofmoisture transport in the Hadley circulation (Seageret al 2010, Niang et al 2014). However, Tierney et al(2015) point out that the interpretation of precipita-tion changes over theGreaterHorn of Africa should bedone with care due to a possible wrong representationof the Walker circulation in current state-of-the-artclimatemodels. Dynamical influences are also thought
OPEN ACCESS
RECEIVED
2March 2016
REVISED
26 September 2016
ACCEPTED FOR PUBLICATION
21October 2016
PUBLISHED
8November 2016
Original content from thisworkmay be used underthe terms of the CreativeCommonsAttribution 3.0licence.
Any further distribution ofthis workmustmaintainattribution to theauthor(s) and the title ofthework, journal citationandDOI.
to be a significant driver of precipitation changes overthe region (Shongwe et al 2011), as are changes in thefrequency of occurrence of IOD and ENSO eventstowards the future (Conway et al 2007, Cai et al 2009).
To gain insight in projected future drivers of pre-cipitation changes, Emori and Brown (2005), Longet al (2016) analyzed changes in the 500 hPa verticalvelocities in order to disentangle the thermodynamicaland dynamical drivers of the precipitation change sig-nal, whereas Kent et al (2015) decomposed the pre-cipitation signal based on a mass flux approach(Chadwick et al 2013). These studies found that ther-modynamical increases in precipitation are an impor-tant driver of precipitation changes over the tropics inthe annual mean, although they also stress the impor-tance of dynamical changes, in particular the slow-down of the tropical circulation, counteractingthermodynamical increases (Kent et al 2015, Longet al 2016). All authors used GCM output at low reso-lution, smoothing local orography and in turn limitingthe representation of local airflowpatterns.
This study uses a classification of circulation pat-terns to analyze future changes in precipitation in anensemble of RCM projections over East Africa. Thestudy area approximately covers the area between14.25° S and 15° N latitudes, and between 25° E and60° E longitudes (figure 1). It roughly comprises thefollowing countries: South Sudan, Ethiopia, Djibouti,Somalia, Kenya, Uganda, Tanzania, Burundi, Rwanda,the eastern part ofDRCongo and the northern parts ofZambia, Malawi and Mozambique. Further, it alsocovers part of the Indian Ocean. Classifying circula-tion patterns is a common practice overmid-latitudes.It has been used by many authors to construct aweather atlas over a specific region (e.g. Litt-mann 2000, Schiemann and Frei 2010) or to relate spe-cific circulations to other atmospheric parameters (e.g.Huth et al 2008, Demuzere et al 2009, 2010), but ingeneral these studies focused on the European con-tinent. Over equatorial regions, classifying circulationpatterns have not yet been used to provide insight inclimate variability and climate change. Furthermore,this approach allows to separate the total precipitationchange signal into two main classes of driving pro-cesses, precipitation changes related to changes in thefrequency of occurrence of circulation patterns (fur-ther denoted as East African synoptics) and other pro-cesses. The second component is a residual term,comprising mainly thermodynamical changes inmoisture content and local/mesoscale feedbacks.Since we use high resolution RCMs, local airflow isidentified, allowing precipitation changes to be relatedmore easily to their driving process.
2.Data andmethodology
In order to determine the link between circulationpatterns and precipitation over East Africa, a
classification of mean sea level pressure fields over theregion was conducted. The goal of this classification isto transfer the multivariate information of daily meansea level pressure fields to a univariate time series oftype membership, i.e. a so-called classification catalogwhere each day is assigned to a certain typicalcirculation type (Philipp et al 2010). The classificationwas executed on ERA-Interim reanalysis data for theperiod 1981–2010 (Dee et al 2011) using theCOST733class software which consists out of aninventory of 72 classification algorithms (Philippet al 2016). The SANDRAoptimization algorithmwitha total of nine typical circulation types (CTs) wasselected based on a thorough evaluation (Text S1).
Typical CTs can be depicted together with theircorresponding precipitation amounts and theirmonthly frequency resulting in an overview of thesynoptic climatology for East Africa, a so-calledweather atlas. Daily precipitation observations areobtained from the PERSIANN-CDR dataset (Ashouriet al 2014), which is retrieved from satellite data andhas a long term record (from 1983 on) at high spatialresolution (0.25° by 0.25°). Although the dataset ischaracterized by a significant positive bias (Pfeifrothet al 2016), it is considered a reliable gridded precipita-tion product over the African continent (Awangeet al 2016). The PERSIANN-CDR data is remappedusing conservative remapping to attain the spatialresolution of ERA-Interim data (Jones 1999).
The COordinated Regional climate DownscalingEXperiment (CORDEX) model ensemble is used tocalculate differences in precipitation amountsbetween a historical (1981–2010) and future(2071–2100) period under a high-emission scenario(RCP8.5). The ensemble consists of the 15 membersthat were freely available over Africa based on fourRCMs which downscale nine GCMs to a resolution of0.44° by 0.44° (table S2). This is the first time thatmulti-RCMCORDEX ensemble projections are inves-tigated over the whole of East Africa. A RCMensembleapproach is used since it enhances the representationof local/regional processes over East Africa comparedto GCM studies (Thiery et al 2015, 2016). Further,CORDEX RCM ensembles improve the representa-tion of the annual precipitation cycle over Africa com-pared to GCMs (Nikulin et al 2012, Buontempoet al 2015, Dosio et al 2015). An evaluation of the his-torical ensemble was achieved by comparing pre-cipitation output with the PERSIANN-CDR datasetfor the period 1983–2010. Conservative remapping isexecuted on the original PERSIANN-CDR data toattain the same spatial resolution. Overall, a scatteredpattern of positive and negative biases are seen relatedto a wrong representation of convection in somemod-els (±40%). Further, biases are mostly limited to theEthiopian Highlands, and the northeastern part of theCongo basin, attaining an overall negative bias (locallyasmuch as−80%) (Text S2; figure S3).
2
Environ. Res. Lett. 11 (2016) 114011
In order to attribute the precipitation change sig-nal to an East African synoptic component, the classi-fication technique stated above was executed on allCORDEX members for the historical and future per-iod simultaneously (i.e. by concatenating the 15 his-torical and futuremembers for 30 years each to a singletime series), obtaining a new set of CTs representativefor the whole ensemble. By using this approach, circu-lation changes of the individual models are retained.Furthermore, in case of large changes in the futureperiod, this also allows to account for the potentialemergence of newCTs.
For each typical circulation type ( j), changes intheir relative frequency (Nj) between the historical andfuture period were calculated. By relating these chan-ges in the frequency of occurrence to precipitationamounts (P), the East African synoptic part of the totalprecipitation change signal in the ensemble was esti-mated
P N N P . 1j
J
j j jsyn1
,fut ,hist ,histåD = -=
( ) ( )
Subsequently, for every typical circulation typechanges in precipitation amounts between the histor-ical and future period were calculated. Weighing thiswith the circulation pattern relative frequencyaccounts for other effects changing precipitation
P N P P . 2j
J
j j jother1
,fut ,fut ,histåD = -=
( ) ( )
This component accounts for the changes in pre-cipitation that occur without changing East Africancirculation. It therefore comprises mainly of changesin moisture content (e.g. through changing evapo-transpiration) and local/mesoscale feedbacks (lake/land/sea breezes, orographic circulation,K). As this isa residual term, it also accounts for changes in pre-cipitation due to circulation changes occurring
Figure 1.ERA-Interim historical weather atlas for the period 1981–2010: resulting circulation types using the SANDRA classificationalgorithm together with the corresponding PERSIANN-CDRprecipitation pattern.
3
Environ. Res. Lett. 11 (2016) 114011
outside of the region for which the CTs were derived,potentially affecting moisture influx at the boundariesof the domain. The sum of the East African synopticcomponent (equation (1)) and the other effects(equation (2)) attains for the total precipitation signal,which can be checked by applying the distributive ruleof summation algebra.
The methodology above depends on various para-meters, such as the number of CTs and the extent ofthe domain. However, it was found that the values ofthese parameters have only limited influence on thesubdivision of the precipitation change signal overEast Africa (Text S3 and figures S6 and S7).
Before applying this technique to future precipita-tion changes, we tested its capability of detectingsynoptic/interannual precipitation variability in thepresent-day climate (1983–2010). In particular, wecompared monthly precipitation from the PER-SIANN-CDR dataset to the predicted monthly pre-cipitation based on the CTs derived from the ERAInterimdataset:
P N P . 3i mj
J
j m i j,1
, ,å= *=
( )
Here, Pi m, is the predicted precipitation for a certainpixel i during the month m, Nj m, is the number oftimes every cluster j occurred during themonthm andPi j, ,hist is the average precipitation for pixel i in cluster jfor the CTs derived from the ERA Interim dataset.Subsequently, the root mean square error and thecoefficient of variance between the predicted precipi-tation and PERSIANN-CDR are calculated (figure S8).Two regions are identified showing the lowest biases:theHorn of Africa and the land areas south of 5° S. Foreach of these two subregions, an extra analysis isperformed to establish the relation between circula-tion patterns and interannual precipitation variabilitymore clearly.
In the Horn of Africa, a clear link between ENSOand precipitation variability has been identified in lit-erature (Nicholson and Kim 1997, Indeje et al 2000).Therefore, the ENSO index is compared to the circula-tion-based predicted precipitation over the Horn of
Africa (equation (3)), on which we applied a normal-ization and a running mean of 12months (figure S9a).A similar analysis is performed for the southern part ofthe study area. However, for this area, no clear driverof precipitation variability has been identified in litera-ture (e.g. Nicholson and Kim 1997, Vizy andCook 2001, Shongwe et al 2011). Hence, the circula-tion-based predicted precipitation is compareddirectly with PERSIANN-CDR observed precipita-tion. All quantities were normalized and a runningmean of 12 months was applied. For both regionsgood correspondence between the two measures isfound. Furthermore, CTs were shown to skillfully pre-dict observed precipitation over the southern areas(figure S9b). Our results indicate that the appliedmethodology is able to capture synoptic controls onprecipitation variability in two selected subregions.We therefore conclude that our decomposition meth-odology can be applied to assess the drivers of futureprecipitation changes for these regions. Signals inother regions should, however, be treated morecarefully.
3. Circulation classification
In this section, we present aweather atlas for the regionby applying the SANDRA algorithm on ERA-Interimmean sea level pressure data (figures 1 and 2). A clearseasonality in CTs and their frequency of occurrence isobserved. Typical boreal winter CTs (e.g. CT 1 and 2)are dominated by high pressures and low rainfallamounts north of the equator. To the south, pressuredecreases while precipitation increases. These CTsrelate to the location of the intertropical convergencezone (ITCZ) in the southern part of the domain (southof∼10° S) and the ascending branch of theHadley cell.The descending branch is located north of thestudy area.
March marks the start of the long rain season inSomalia and the southeastern part of Ethiopia, whichlasts till May. A shift towards higher frequencies ofoccurrence of CT 3 and 4 is observed (>60%), having
Figure 2.Monthly relative occurrence of the circulation types depicted in figure 1 during the period 1981–2010 based onERA-Interimdata.
4
Environ. Res. Lett. 11 (2016) 114011
more northerly precipitation. However, CT 1 and2 are still present in 30% of the cases (figure 2). Thisshift represents the northward movement of the ITCZzone, which is expected during boreal spring. Theoccurrence of CT 1 and 2 during this month is attrib-uted to the strong interannual variability of the migra-tion of the ITCZ, whereby it moves north earlier insome years compared to others, accounting for a highinterannual variability in precipitation amounts overtheGreaterHorn of Africa during thismonth.
In April, CT 3 and 4 still occur approximately 40%of the time, but the dominant pattern in the regionnow corresponds to CT 5 (figure 2). Central con-tinental parts (between 10° N and 5° S) of the studyarea attain rainfall amounts higher than 3 mm d−1
during the occurrence of this circulation type(figure 1). This is due to the development of a low oversouthern Sudan.Winds from the Gulf of Aden and theIndian Ocean high pressure zones converge towardsthis low and blow across central and southern Ethio-pia. Thesemoist, easterly and southeasterly winds pro-duce the main rains in southeastern Ethiopia andSomalia (Nicholson 1996, 2000, Seleshi andZanke 2004). There, the long rain season is now in fulldevelopment and the occurrence of CT 5 is of greatimportance for the rain-fed agricultural systems.
May is characterized by a large variety of CTs. CT 5occurs approximately half of the time, but also CT 6(∼15%) and 7 (∼20%) take place (figure 2). The pres-sure pattern of CT 6 resembles CT 5, but precipitationover Somalia and southeastern Ethiopia is con-siderably lower (<2 mm d−1). CT 7 has a very lowpressure zone located north of Somalia (values downto 1002 hPa). Under these conditions the EthiopianHighlands are still characterized by high pressures(1014 hPa) and high rainfall amounts, but no rain isexpected over Somalia and southeastern Ethiopia.
The boreal summer months June–August arenearly always characterized by CT 7 and 8. A highpressure zone and precipitation rates exceeding10 mm d−1 are present over the Ethiopian Highlands.Northeast of this high pressure core, contour lines arevery close to each other, which indicates the presenceof a through (figure 1). A westerly flow is present overthe study area, opposite to a high level easterly flow,carrying monsoon rains from the Gulf of Guinea(Nicholson 2000, Seleshi andZanke 2004).
September marks the start of the short rain seasonover Somalia and southeastern Ethiopia. CT 6 bringsprecipitation over these regions, taking place morethan 30% of the time (figures 1 and 2). However, CT 9,a summer circulation type, dominates this month(50%), attaining for no precipitation over the GreaterHorn of Africa.
In November the end of the short rain season isreached and a high variety of CTs is found (figure 2).This causes a high variability in rainfall amounts. Onthe one hand CT 1, 2 and 3 together appear in 40% ofthe cases, generating no precipitation north of the
equator. On the other hand CT 4 is present half of thetime, attaining for precipitation values higher than1 mmd−1 over Somalia and southeastern Ethiopia.
Each season is defined by two or three main CTsand corresponding precipitation patterns (figures 1and 2). Furthermore, synoptic systems are very persis-tent over time on a single location (Nicholson andKim 1997). This contrast with the European region,where synoptic systems are characterized by day-to-day variability. As the climate over East Africa is domi-nated by the movement of the ITCZ zone over theregion, most synoptic anomalies are caused by a tooslow (fast) onset of themovement of the ITCZ. This, inturn, leads to an early (late) start (end) of the precipita-tion season.
As such, the circulation-based approach can alsobe used to study inter-annual precipitation variabilityover the region. For instance, the extreme drought hit-ting the Horn of Africa in 1988–9 can be investigatedin terms of anomalous synoptic conditions. Our CTclassification indicates that during these two years,boreal winter and boreal summer CTs (CTs 1, 2 and 3and 7, 8 and 9 respectively)were relatively more abun-dant. In particular, changing CT frequencies suggestthe late onset and early end of the long rain season aswell as the late onset of the short rain period, ratherthan changing circulation (and precipitation) at theheight of the wet periods. This indicates that shorterwet periods rather than lower peak precipitation is themain driver of the 1988-89 drought, consistent withearlierfindings (Segele et al 2009a, Gong et al 2016).
4.Drivers of future precipitation changes
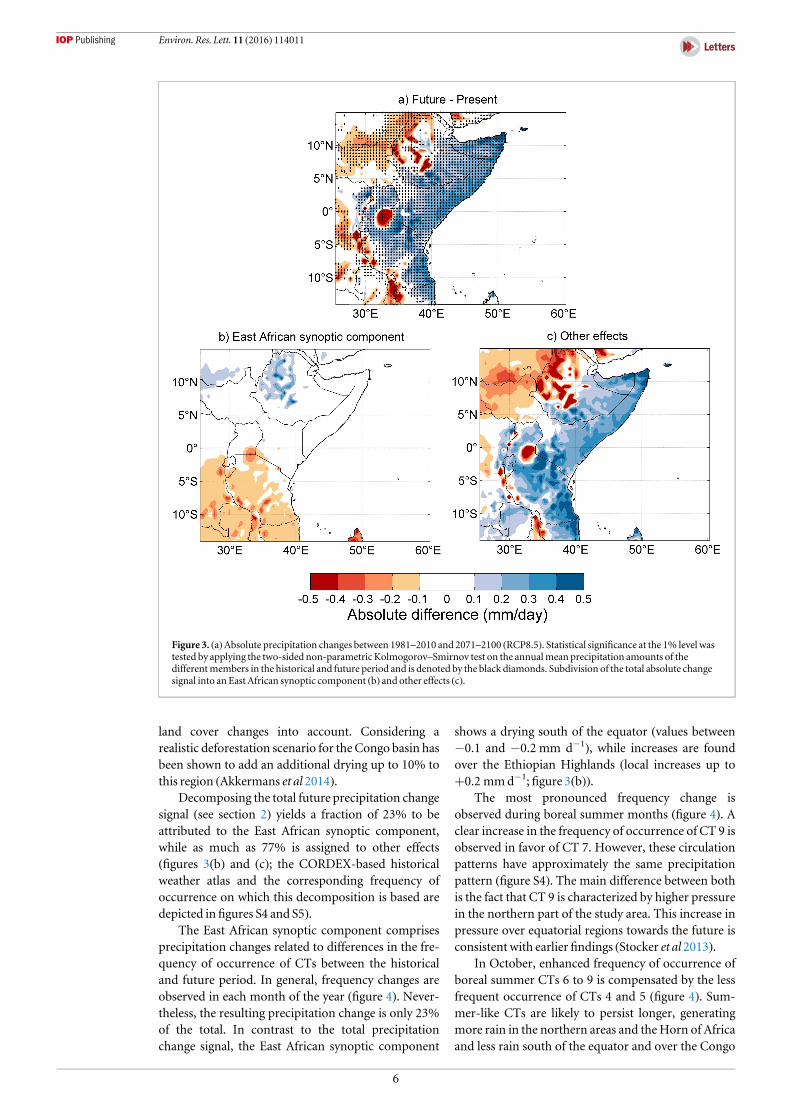
Several studies using RCM and/or GCMdata project awetting for the equatorial part of East Africa (Shongweet al 2011, Otieno and Anyah 2013, Niang et al 2014,Kent et al 2015, Long et al 2016). The CORDEX-RCMensemble confirms the increase in precipitation forthis part of the study area (figure 3(a); see also Dosioand Panitz2016, Buontempo et al2015, Descyet al2015). In the Horn of Africa, where rainfallamounts are low, a similar absolute increase wasfound. Significant decreases in precipitation are pro-jected in the northwestern parts of our study area(−0.2 mm d−1) and the Ethiopian Highlands(−0.5 mm d−1). Further, some localized drying areasare detected in the central/southern part of the studyarea, attaining values lower than−0.5 mm d−1. Theseareas correspond to the different lakes that are present:Lake Victoria (located at the border of Uganda, Kenyaand Tanzania), Lake Tanganyika (at the border ofTanzania and DR Congo) and Lake Malawi (at theborder ofMalawi,Mozambique and Tanzania). Lastly,a reduction in precipitation is projected over theCongo basin (locally up to −0.3 mm d−1). Note thathighest biases were found here (figure S3) and theCORDEX-RCM ensemble does not take land use and
5
Environ. Res. Lett. 11 (2016) 114011
land cover changes into account. Considering arealistic deforestation scenario for theCongo basin hasbeen shown to add an additional drying up to 10% tothis region (Akkermans et al 2014).
Decomposing the total future precipitation changesignal (see section 2) yields a fraction of 23% to beattributed to the East African synoptic component,while as much as 77% is assigned to other effects(figures 3(b) and (c); the CORDEX-based historicalweather atlas and the corresponding frequency ofoccurrence on which this decomposition is based aredepicted infigures S4 and S5).
The East African synoptic component comprisesprecipitation changes related to differences in the fre-quency of occurrence of CTs between the historicaland future period. In general, frequency changes areobserved in each month of the year (figure 4). Never-theless, the resulting precipitation change is only 23%of the total. In contrast to the total precipitationchange signal, the East African synoptic component
shows a drying south of the equator (values between−0.1 and −0.2 mm d−1), while increases are foundover the Ethiopian Highlands (local increases up to+0.2 mmd−1; figure 3(b)).
The most pronounced frequency change isobserved during boreal summer months (figure 4). Aclear increase in the frequency of occurrence of CT 9 isobserved in favor of CT 7. However, these circulationpatterns have approximately the same precipitationpattern (figure S4). The main difference between bothis the fact that CT 9 is characterized by higher pressurein the northern part of the study area. This increase inpressure over equatorial regions towards the future isconsistent with earlier findings (Stocker et al 2013).
In October, enhanced frequency of occurrence ofboreal summer CTs 6 to 9 is compensated by the lessfrequent occurrence of CTs 4 and 5 (figure 4). Sum-mer-like CTs are likely to persist longer, generatingmore rain in the northern areas and theHorn of Africaand less rain south of the equator and over the Congo
Figure 3. (a)Absolute precipitation changes between 1981–2010 and 2071–2100 (RCP8.5). Statistical significance at the 1% level wastested by applying the two-sided non-parametric Kolmogorov–Smirnov test on the annualmean precipitation amounts of thedifferentmembers in the historical and future period and is denoted by the black diamonds. Subdivision of the total absolute changesignal into an East African synoptic component (b) and other effects (c).
6
Environ. Res. Lett. 11 (2016) 114011
basin. This feature partly persists into November,where boreal winter CTs occur less often. Frequencychanges in these two months partly explain the dryingover the Congo basin and the areas south of the equa-tor (figure 3(c)). Other small changes in the frequencyof occurrence of the boreal winter and spring CTs donot affect precipitation amounts significantly.
The other effects show a similar spatial pattern asthe total change in precipitation. Increases in pre-cipitation are found during the rain seasons of the dif-ferent subregions, when the ITCZ overpasses. Severalauthors relate this to an increase in moisture contentand increased moisture transport in the Hadley cell ina warming world (Held and Soden 2006, Longet al 2016). For Somalia and southeastern Ethiopia,most of the precipitation increase occurs indeed dur-ing their long (March–May) and short (September–December) rain season (figures S4 and S5). Further,the easterly winds originating from the ocean areasblowing over the land contain increasedmoisture con-tent inducing higher precipitation amounts. The dry-ing over the Ethiopian Highlands and the Sudanregion is also assigned to other effects. This drying isprojected to occur during the main rain season (dur-ing boreal summer; figures S4 and S5) and is due to anincrease in sea surface temperature over the Gulf ofGuinea and a lowering of the low-level geopotentialheight, leading to lower amounts of moisture trans-port by the westerly winds which drawmonsoon rainsfrom the Gulf of Guinea to the area (Neupane andCook 2013, Lyon 2014). A last remarkable feature infigure 3(c) is the drying over the lakes. Precipitationproduction over the African Great Lakes is governedby mesoscale circulation and local moisture supplythrough lake evaporation (Thiery et al 2015). Usingdedicated high-resolution regional climate simula-tions, Thiery et al (2016) found that the projected aver-age precipitation decrease over the AfricanGreat Lakesis caused by altered mesoscale circulation patterns.The use of a high-resolution RCM coupled to a lake
model is a key prerequisite to discriminate this dryingover the lakes.
Only a low fraction of precipitation changes isattributed to the East African synoptic component,while other studies consider synoptic changes over theHorn of Africa to be significant as well (Emori andBrown 2005, Kent et al 2015, Long et al 2016). Dyna-mical decreases occur most often in regions wherethermodynamical increases in precipitation are found,i.e. due to a slowdown of the tropical circulation (Kentet al 2015, Long et al 2016). This can also be seen in ourresults, where a decrease in East African synopticssouth of the equator is found (figure 3(b)). The reasonfor the discrepancy between results partly lies in thedefinition of the different components. In our case,other effects include thermodynamical changes, butalso local/mesoscale feedbacks and changes in moist-ure influx due to changes in synoptics that occur out-side our domain. As such, a direct comparison of ourresults to Emori and Brown (2005), Kent et al (2015)and Long et al (2016) is not possible.
5. Conclusion
Prior work has stated different reasons for changes inprecipitation over the East African region, rangingfrom increases in moisture content to changes insynoptics. Emori and Brown (2005) made a firstsubdivision of the precipitation change signal into athermodynamical and dynamical component. Theyinvestigated changes in vertical velocity at the 500 hPalevel to obtain a global overview of the causes ofchanges in precipitation. Here, a formal classificationof circulation patterns on ERA-Interim and the 15members of the CORDEX-RCM ensemble was exe-cuted over East Africa. A weather atlas was obtainedand a subdivision of the total projected precipitationchange signal into anEast African synoptic componentand other effects was conducted. In the present-dayclimate, atmospheric circulation and associated pre-cipitation patterns are dominated by the location of
Figure 4.Changes in the frequency of occurrence of the circulation types between the historical and future period of theCORDEX-RCMensemble. TheCORDEXhistorical weather atlas is depicted in figure S4. The frequency of occurrence during the historicalperiod is depicted in figure S5.
7
Environ. Res. Lett. 11 (2016) 114011
the ITCZ over the region, with variations to thisgeneral pattern marking early (late) transitionsbetween wet and dry periods (and vice versa). For thefuture, we find that less than 23% of the total changesignal can be attributed to changes in the frequency ofoccurrence of CTs over East Africa. More than 77% isdue to other effects, comprising mainly changes inmoisture content and local/mesoscale feedbacks. Oneimportant advantage of using RCMs at high resolutionis the fact that small-scale air flows are resolved soprecipitation changes can be attributed more easily tolocal processes.
Changes in East African synoptics result in a dry-ing and wetting for respectively the regions south ofthe equator and the Ethiopian Highlands, while otherparts of the Horn of Africa are not affected. Thesechanges are mainly restricted to the months Octoberand November, characterized by an enhanced fre-quency of the typical boreal summer CTs at theexpense of the boreal winter CTs.
For southeastern Ethiopia and Somalia, theincrease in precipitation is related to an enhancementof water vapor content in a warmer world and anintensification ofmoisture transport in theHadley cir-culation (Seager et al 2010, Niang et al 2014). Also,increased moisture transport from easterlies to theHorn of Africa attributes for higher precipitationamounts during the rain seasons. The strong decreasein precipitation over the African Great Lakes may beattributed to changes in mesoscale circulation (Thieryet al 2016). Decreases in precipitation over Sudan andthe Ethiopian Highlands during their rain season arecaused by lower amounts of moisture transport fromthe Gulf of Guinea and a local lower geopotentialheight (Neupane and Cook 2013). These circulationchanges outside the domain of study are not capturedby our CTs. This implies that a detailed study on theeffect of synoptics for this specific region would needan extension of the domain for which CTs are derivedto cover theGulf of Guinea.
Future research could focus on elaborating thistechnique in other parts of the world in order to gain ahigher level of understanding in changes of precipita-tion over the globe.
Acknowledgments
We thank two anonymous referees for reviews thatmarkedly improved our paper. This work was finan-cially supported by the Belgian Science Policy Office(BELSPO) through the research project EAGLES.Wim Thiery is an ETH Zürich postdoctoral fellow,Matthias Demuzere is a postdoctoral fellow at theResearch Foundation Flanders (FWO). The authorsdeclare no conflict of interest. All data and methods toreproduce the results of this study are described insection 2 and the supporting information. TheCOST733class software is freely available and can be
downloaded on the following web page http://cost733.geo.uni-augsburg.de/cost733class-1.2. COR-DEX model data is freely available from the ESGFservers (http://esgf.llnl.gov/), ERA-Interim data fromECMWF (http://www.ecmwf.int/en/research/climate-reanalysis/era-interim) and PERSIANN-CDR from NOAA (https://www.ncdc.noaa.gov/cdr/atmospheric/precipitation-persiann-cdr).
References
Akkermans T, ThieryWandVan LipzigNPM2014The regionalclimate impact of a realistic future deforestation scenario intheCongo basin J. Clim. 27 2714–34
AnyahROandQiuW2012Characteristic 20th and 21st centuryprecipitation and temperature patterns and changes over theGreaterHorn of Africa Int. J. Climatol. 32 347–63
AnyahROand Semazzi FHM2006Climate variability over theGreaterHorn of Africa based onNCARAGCMensembleTheor. Appl. Climatol. 86 39–62
AnyahROand Semazzi FHM2007Variability of East Africanrainfall based onmultiyear RegCM3 simulations Int. J.Climatol. 27 357–71
AshouriH,HsuK-L, Sorooshian S, Braaithwaite DK, KnappKR,Cecil L, Nelson BR and PratOP 2014 PERSIANN-CDR:daily precipitation climate data record frommulti-satelliteobservations for hydrological and climate studiesBull. Am.Meteorol. Soc. 96 69–83
Awange J, Ferreira V, Khandu F E, Andam-Akorful S, AgutuN andHeX2016Uncertainties in remotely sensed precipitationdata over Africa Int. J. Climatol. 36 303–23
Behera S K, Luo J-J,Masson S,Delecluse P,Gualdi S, Navarra A andYamagata T 2005 Paramount impact of the IndianOceandipole on the east African short rains: a CGCMstudy J. Clim.18 4514–30
Chadwick R, Boutle I andMartinG 2013 Spatial patterns ofprecipitation change in CMIP5:why the rich do not get richerin the tropics J. Clim. 26 3803–22
ConwayD,HansonCE,Doherty R and PersechinoA 2007GCMsimulations of the IndianOcean dipole influence onEastAfrican rainfall: present and futureGeophys. Res. Lett. 34L03705
ConwayD and Schipper E L F 2011Adaptation to climate change inAfrica: challenges and opportunities identified fromEthiopiaGlob. Environ. Change 21 227–37
DeeDP,Uppala SM, SimmonsA J, Berrisford P, Poli P andKobayashi S 2011The ERA-Interim reanalysis: configurationand performance of the data assimilation systemQ. J. R.Meteorol. Soc. 137 553–97
DemuzereM,Kassomenos P andPhilipp A 2010TheCOST733circulation type classification software: an example forsurface ozone concentrations in central EuropeTheor. Appl.Climatol. 105 143–66
DemuzereM,WernerM,Van LipzigNPMandRoeckner E 2009An analysis of present and future ECHAM5pressurefieldsusing a classification of circulation patterns Int. J. Climatol. 291796–810
Descy J et al 2015East AfricanGreat Lake Ecosystem Sensitivity tochanges (EAGLES) (Brussels: Belgian Science policy) (http://hdl.handle.net/2268/194075)
DosioA and PanitzH-J 2016Climate change projections forCORDEX-Africa with COSMO-CLMregional climatemodeland differences with the driving global climatemodelsClim.Dyn. 46 1599–625
DosioA, PanitzH-J, Schubert-FrisiusM and LüthiD 2015Dynamical downscaling of CMIP5 global circulationmodelsover CORDEX-Africa with COSMO-CLM: evaluation overthe present climate and analysis of the added valueClim.Dyn.44 2637–61
Emori S andBrown S J 2005Dynamic and thermodynamic changesinmean and extreme precipitation under changed climateGeophys. Res. Lett. 32 L17706
GongD-Y, GuoD,MaoR, Yang J, Gao Y andKimS-J 2016Interannualmodulation of East African early short rains bythewinter ArcticOscillation J. Geophys. Res. 121 9441–57
Hawinkel P, ThieryW, Lhermitte S, Swinnen E, Verbist B,VanOrshoven J andMuys B 2016Vegetation response toprecipitation variability in East Africa controlled bybiogeographical factors J. Geophys. Res. 121 2422–44
Held IM and SodenB J 2006Robust responses of the hydrologicalcycle to global warming J. Clim. 19 5686–99
HuthR, BeckC, Philipp A,DemuzereM,Ustrnul Z, CahynováM,Kyselý J andTveitoOE 2008Classifications of atmosphericcirculation patterns: recent advances and applicationsAnn.NewYork Acad. Sci. 1146 105–52
IndejeM, Semazzi FHMandOgallo L J 2000 ENSO signals in EastAfrican rainfall seasons Int. J. Climatol. 20 19–46
Jones PW1999 First- and second-order conservative remappingschemes for grids in spherical coordinatesMon.Weather Rev.127 2204–10
Kent C, Chadwick R andRowell D P 2015Understandinguncertainties in future projections of seasonal tropicalprecipitation J. Clim. 28 4390–413
LiebmannB,HoerlingMP, FunkC, Bladé I, Dole RM,AlluredD,QuanX, Pegion P and Eischeid J K 2014Understandingrecent eastern horn of Africa rainfall variability and changeJ. Clim. 27 8630–45
LittmannT 2000An empirical classification ofweather types in theMediterranean Basin and their interrelationwith rainfallTheor. Appl. Climatol. 66 161–71
Long S-M,Xie S-P and LiuW2016Uncertainty in tropical rainfallprojections: atmospheric circulation effect and the oceancoupling J. Clim. 29 2671–87
LyonB 2014 Seasonal drought in the greater horn of Africa and itsrecent increase during theMarch–May long rains J. Clim. 277953–75
LyonB andDeWitt DG2012A recent and abrupt decline in the EastAfrican long rainsGeophys. Res. Lett. 39 L02702
NeupaneN andCookKH2013Anonlinear response of sahelrainfall to atlantic warming J. Clim. 26 7080–96
Niang I, Ruppel O, AbdraboM, Essel A, LennardC, Padgham J andUrquhart P 2014AfricaClimate Change 2014: Impacts,Adaptation, andVulnerability. Part B: Regional Aspects.Contribution ofWorkingGroup II to the Fifth AssessmentReport of the Intergovernmental Panel onClimate Change edVBarros et al (Cambridge: CambridgeUniversity Press)pp 1199–265
Nicholson S 1996A review of climate dynamics and climatevariability in Eastern Africa Limnology, Climatology andPaleoclimatology of the East African Lakes ed T Johnson andEOdada (Amsterdam:CRCPress) pp 25–56
Nicholson S 2000The nature of rainfall variability over Africa ontime scales of decades tomilleniaGlob. Planet. Change 26137–58
Nicholson S andKim J 1997The relationship of the ElNino-Southern oscillation to African rainfall Int. J. Climatol. 17117–35
NikulinG et al 2012 Precipitation climatology in an ensemble ofCORDEX-Africa regional climate simulations J. Clim. 256057–78
Omondi P, Awange J, Ogallo L, Okoola R and Forootan E 2012Decadal rainfall variabilitymodes in observed rainfall records
over East Africa and their relations to historical sea surfacetemperature changes J. Hydrol. 464–465 140–56
Omondi P,Ogallo L, Anyah R,Muthama JMand Ininda J 2013Linkages between global sea surface temperatures anddecadal rainfall variability over eastern Africa region Int. J.Climatol. 33 2082–104
OtienoVOandAnyah RO2013CMIP5 simulated climateconditions of theGreaterHorn of Africa (GHA): II. ProjectedclimateClim.Dyn. 41 2099–113
PfeifrothU, Trentmann J, FinkAHandAhrens B 2016 Evaluatingsatellitebaseddiurnal cycles of precipitation in theAfricantropics J. Appl.Meteorol. Climatol. 55 23–39
PhilippA, BeckC,HuthR and Jacobeit J 2016Development andcomparison of circulation type classifications using theCOST733 dataset and software Int. J. Climatol. 36 2673–91
PhilippA et al 2010Cost733cat a database of weather andcirculation type classifications Phys. Chem. EarthA/B/C 35360–73
Rowell D P, Booth BB,Nicholson S E andGoodP 2015Reconcilingpast and future rainfall trends over east Africa J. Clim. 289768–88
SchiemannR and Frei C 2010Weather types and distribution ofprecipitation throughout the EuropeanAlpsHydrologicalWeather Atlas of Switzerland (Bern: Federal Office for theEnvironment (FOEN))
SchreckC J and Semazzi FHM2004Variability of the recentclimate of easternAfrica Int. J. Climatol. 24 681–701
Seager R,NaikN andVecchi GA 2010Thermodynamic anddynamicmechanisms for large-scale changes in thehydrological cycle in response to global warming J. Clim. 234651–68
Segele Z, LambP and Leslie L 2009a Large-scale atmosphericcirculation and global sea surface temperature associationswith horn of Africa June–September rainfall Int. J. Climatol.29 1075–100
Segele ZT, LambP J and Leslie LM2009b Seasonal-to-interannualvariability of ethiopia/horn of AfricaMonsoon: I.Associations of wavelet-filtered large-scale atmosphericcirculation and global sea surface temperature J. Clim. 223396–421
Seleshi Y andZankeU2004Recent changes in rainfall and rainydays in Ethiopia Int. J. Climatol. 24 973–83
ShongweME, vanOldenborghG J, van denHurk B and vanAalstM2011 Projected changes inmean and extreme precipitation inAfrica under global warming: II. East Africa J. Clim. 243718–33
Stocker T et al 2013Technical summaryClimate Change 2013: ThePhysical Science Basis. Contribution ofWorkingGroup I to theFifth Assessment Report of the Intergovernmental Panel onClimate Change edT Stocker et al (Cambridge: CambridgeUniversity Press) pp 33–115
ThieryW,Davin E, PanitzH-J, DemuzereM, Lhermitte S andVan LipzigNPM2015The impact of the African great lakeson the regional climate J. Clim. 28 4061–85
ThieryW,Davin E, Seneviratne S, BedkaK, Lhermitte S andvan LipzigN 2016Hazardous thunderstorm intensificationover LakeVictoriaNat. Commun. 7 12786
Tierney J E, Smerdon J E, Anchukaitis K J and Seager R 2013Multidecadal variability in east African hydroclimatecontrolled by the IndianOceanNature 493 389–92
Tierney J E,Ummenhofer CC andDeMenocal P B 2015 Past andfuture rainfall in the horn of Africa Sci. Adv. 1 e1500682
Viste E, KorechaD and Sorteberg A 2013Recent drought andprecipitation tendencies in EthiopiaTheor. Appl. Climatol.112 535–51
Vizy EK andCookKH2001Mechanisms bywhichGulf of Guineaand easternNorth Atlantic sea surface temperature anomaliescan influence African rainfall J. Clim. 14 795–821