Principal Investigator/Program Director (Last, first, middle): DURFEE, WILLIAM K INTRODUCTION This is a first revision of a Phase II STTR application originally submitted in July 2001. We appreciate the constructive comments by the review panel and hope this revision addresses the concerns. In this section, review issues are paraphrased in italics and are followed by our response. The concerns are listed in approximate order of significance. The entire proposal was rewritten so we did not include change markers in the text. The major weakness is lack of information on the Phase II study to test concurrent validity between on-road and simulation. The comparisons between simulator and on- road performance for the Phase II project were insufficient and inadequately described in the first submission. Major changes have been made to the concurrent validity tests planned in this submission. In the first submission, the only validity comparison was the 3-point Global Driving Score (GDS). This is still a valid indicator because it represents an assessor's judgement of overall driving performance, and reflects the scorings currently used by clinical driving evaluators. However, we have added objective data collection devices to the car including on-board GPS to record car position and speed, camcorder to capture route information, and a sensor to capture gas/brake timing information. Sensor data will be collected in real-time on a PC. With these additions we will be able to directly compare subject’s on-road and simulator control of speed and brake timing, as well as the more global measures of safe and unsafe driving performance. The proposed dual uses of the simulator for assessment and therapy are incompatible . The primary objective of Phase II is to validate the simulator as a clinical evaluation tool, as described in the revised research plan. Future clinical users will determine if the simulator will be used for training, for evaluation, for treatment, or for licensing. We have kept the self-awareness study in the program, however, because we feel this may ultimately be the most important future application for STISIM Drive in a rehabilitation clinic. Conducting a pilot self- awareness study allows a preliminary evaluation of this hypothesis. We have re-written the specific aims and research plan to clarify and separate the validation portion of the study with the pilot self- awareness therapy study. The ease-of-use study should not use occupational therapy students. We have dropped the ease-of-use study that focused on simulator route development. Page 29
Transcript
Principal Investigator/Program Director (Last, first, middle): DURFEE, WILLIAM K
INTRODUCTIONThis is a first revision of a Phase II STTR application originally submitted in July 2001. We appreciate the constructive comments by the review panel and hope this revision addresses the concerns. In this section, review issues are paraphrased in italics and are followed by our response. The concerns are listed in approximate order of significance. The entire proposal was rewritten so we did not include change markers in the text.
The major weakness is lack of information on the Phase II study to test concurrent validity between on-road and simulation. The comparisons between simulator and on-road performance for the Phase II project were insufficient and inadequately described in the first submission. Major changes have been made to the concurrent validity tests planned in this submission. In the first submission, the only validity comparison was the 3-point Global Driving Score (GDS). This is still a valid indicator because it represents an assessor's judgement of overall driving performance, and reflects the scorings currently used by clinical driving evaluators. However, we have added objective data collection devices to the car including on-board GPS to record car position and speed, camcorder to capture route information, and a sensor to capture gas/brake timing information. Sensor data will be collected in real-time on a PC. With these additions we will be able to directly compare subject’s on-road and simulator control of speed and brake timing, as well as the more global measures of safe and unsafe driving performance.
The proposed dual uses of the simulator for assessment and therapy are incompatible. The primary objective of Phase II is to validate the simulator as a clinical evaluation tool, as described in the revised research plan. Future clinical users will determine if the simulator will be used for training, for evaluation, for treatment, or for licensing. We have kept the self-awareness study in the program, however, because we feel this may ultimately be the most important future application for STISIM Drive in a rehabilitation clinic. Conducting a pilot self-awareness study allows a preliminary evaluation of this hypothesis. We have re-written the specific aims and research plan to clarify and separate the validation portion of the study with the pilot self-awareness therapy study.
The ease-of-use study should not use occupational therapy students. We have dropped the ease-of-use study that focused on simulator route development.
The effort to create an easy-to-use tiling system for custom route creation by clinicians is misguided. The 80tiling system will not be developed as part of this project..
The number of subjects in Phase I was too small. A small number of subjects participated in Phase I because the purpose of Phase I was to prove technical feasibility of the equipment and methods. Ten subjects are too few to draw statistically valid conclusions about the simulator. That must wait for the Phase II study. We would have liked to have had additional subjects in Phase I but time and money constraints prevented this.
Insufficient use of data in the Phase II plan to prove validity. We have expanded the measurements and data analysis to examine more variables and more variable interactions. Strong test-retest reliability will be mandatory for clinical acceptance of the simulator as a tool to assess changes in driving behavior. We will use the Simulator Sickness Score be used as a covariate to help ensure that differences seen across time represent real behavioral driving differences. Concurrent validity will compare the simulated and on-road driving behaviors and determine whether the portion of the simulator drive matched to that of the on-road really does provide a reasonable facsimile in terms of driving behaviors. It will also allow us to compare the driving behaviors of the challenging portion. We would anticipate that the matched portion should have strong concurrent validity to the on-road, while the challenging portion has poorer concurrent (which would be evidence that the challenging portion assesses something different, such as the decision
Page 29
Principal Investigator/Program Director (Last, first, middle): DURFEE, WILLIAM K
making, that cannot be safely provided by the on-road). The discriminant validity portion of the study is necessary to verify that the simulation has the ability of distinguishing subjects with cognitive deficits from those with normal cognition. We would anticipate that many brain injured individuals may be able to successfully drive the matched portion of the simulation but fail the challenges of the other, while the normal subjects should be more generally capable driving both. Thus the matched simulation will show poorer discriminant power, while the challenging greater discriminant power.
Rationale not provided for the psychological test battery chosen. Should include UFOV. The perceptual test battery includes tests of visual scanning, attention, processing, visuospatial perception, reaction, planning and problem solving. Though studies report conflicting predictive validity for such test batteries vs driving (Sundet, Goffeng, Hofft, 1995; Galski, Ehle, Bruno, 1990; Korteling &Kaptein, 1996; Galski, Ehle, Williams, 1997; Klavora, Heslesgrave, Young, 2000; Akiwuntan, Feys, DeWeerdt, Pauwels, Baten, Strypstein, 2002) we included the tests because they are typically used as pre-screens before on-road testing, and are part of the usual pre-driving assessment used by Courage Center and other driving centers. We do not intend for these scores to be part of any comparison of the simulator or on-road tests. Rather, they are to ensure that drivers do not have specific severe problems that make them patently inappropriate for on-road testing. We agree that Useful Field of View (UFOV) has good evidence of predictive validity to on-road testing, and will add this short test to our pre-driving assessment. We chose the Cognistat test over the MiniMental Status Exam (MMSE) to ensure that brain injured subjects all have measurable cognitive impairment and that 'normals' do not. Though more familiar to readers because of its long history of use as a screening assessment, the MMSE has a significantly higher incidence of false-negatives (ie rating patients as normal when they have cognitive deficits) (Schwamm, van Dyke, Kiernan, Merrin, Mueller, 1987).
The choice of simulator scenario events should be made based on knowing how cognitive impairment impacts driving. The low-challenge events for the first half of the simulator run were picked to match everyday normal driving events. The high-challenge events were selected based on cognitive demands required of the driver to master the event successfully. Our Phase I data indicates that the high-challenge events are more likely to discriminate between cognitive abilities. The data from Phase II will answer clearly which events are good discriminators.
Quantitative performance indicators were based on what data is easy to collect from the simulator rather than what might be sensitive to cognitive impairment (e.g. RMS lane position is more diagnostic than average position). Many parameters were collected during the Phase I pilot including both average and RMS lane position. For our small sample, the deviation data was inconclusive, however on curves the average lane position indicated a difference between impaired and unimpaired subjects. We will collect a wide range of quantitative information during the Phase II simulator runs, including RMS lane position.
Team lacks clinical representation needed to guide the revisions of the STISIM Drive simulator. See updated CV's for Schold-Davis and Huizenga. Schold-Davis is a clinician whose specialty is brain injury. Huizenga directs a comprehensive vocational service. Other clinicians at the clinical sites will also be interviewed to help guide the direction for STISIM Drive.
Attempt to design and market STISIM Drive for use only with cognitively impaired patients is too narrow. Simulators are already being used to study the elderly and those with Alzheimer's. We agree that STISIM Drive has potential in the rehabilitation of a wide range of patients. Brain injury (CVA, trauma, tumor) are the largest population seen in rehabilitation. After brain injury, many people have some degree of cognitive loss in addition to their more obvious physical challenges. Broadening the scope to other populations within the fixed costs would weaken results.
Other comments include the following:Design scenario events that are sure to bring out performance differences in the impaired versus
unimpaired group. We provide a range of events from low to high challenge.
Page 30
Principal Investigator/Program Director (Last, first, middle): DURFEE, WILLIAM K
A single, subjective rating for driving performance is suspect. Be quantitative. We are keeping the global driving score because that is what is commonly used by clinical driving evaluators. However, we now augment that score with a battery of quantitative performance indicators based on machine-collected data.
Is sample size of 25 adequate for test-retest reliability? The experiment has 40 subjects, 25 with brain injury and 15 non-disabled. This number is fixed by the fiscal cap on the project. We did not do a pilot test-retest experiment during Phase I so we don't have a variance number for formal power analysis. Phase II results will discuss the power of the test to determine differences after all the data is in.
Why only three critical challenge events in the second half of the simulator scenario? We increased the number of high-challenge events to five based on published research and our own pilot data.
Can't tell if the simulator scenario matches the on-road drive. The first half of the simulator scenario is a functional match to the on-road drive (see Research Plan Task 1-3 for details). The second half contains high-challenge events that are not likely to occur during typical on-road experiences.
How can you do concurrent validity on the more aggressive scenarios? For safety reasons, we cannot implement high-challenge events during the on-road test. This ability to provide no-risk high-challenge driving events is frequently pointed to as a major benefit of simulation. The best we can do is validate the low-challenge drive.
What does "low cost" mean? Retail price of STISIM Drive will be approximately $30,000. Low performance simulators (all the way down to PC games and the non-interactive simulators used in drivers education classes) are cheaper but cannot be modified and do not collect performance data. The most similar clinical alternative is the DriVR, an interactive non-modifiable system that can collect performance data. This system retails for ~$2,200, but does not have realistic seating nor driving controls and requires a head-mounted display.
Simulator sickness may be a barrier to commercial success for STISIM Drive. Simulator sickness is a serious issue for any simulator and is why we will collect simulator sickness information for all subjects. Our clinical experience with brain injured individuals using this and other simulators indicates that simulator sickness can be dramatically reduced by more and longer introductory experiences prior to data collection. Independent research on simulation sickness supports this contention.
Phase 1 report should have more detail on the validation tests. We squeezed pretty much all we could out of the Phase 1 data. We think we were able to prove technical feasibility of the approach. More importantly, Phase 1 taught us how to collect and analyze data for the larger, Phase II study proposed here.
Phase I report does not address results from concurrent validity tests. We added more information to the Phase I report on concurrent validity, but because the sample was so small, we cannot make statistically meaningful statements. Those will have to wait for the results of Phase II.
Background section describes important driving distracters such as traffic and construction, but these are not implemented in the simulator. The first half of the driving scenario will include traffic flow typical to residential and commercial neighborhoods. The second half will include high-challenge driving events involving other vehicles. The second half may also include navigation through a construction site.
Reported brake, acceleration and steering problems are not trivial to fix. They will be dealt with in Phase II, Task 1.1. Since the time of first submission, these tasks are well underway.
Insufficient hours for Rosenthal. Rosenthal's hours on the project will mostly be supported by Systems Technology, Inc. and will not be all charged to the project.
Subjects should not drive a real car immediately after a simulator drive. This suggestion will be included in the new instructions to the subject and the new informed consent statement.
Subject payments not in the budget. Subject payments were bundled into the contract cost. The revised budget and budget justification clarifies this.
Page 31
Principal Investigator/Program Director (Last, first, middle): DURFEE, WILLIAM K
A. SPECIFIC AIMSBrain injury (BI) due to accident or stroke frequently results in cognitive impairment, reducing an individual’s ability to judge driving situations accurately (Engum, 1988; Galski, 1990; Klavora, 1995), and affecting the metacognitive skills necessary to self-assess their capacity for safe driving (Gianutsos, 1994). Individuals with severe cognitive impairment are easily identified as unsafe drivers. Those with mild to moderate deficits are more difficult to categorize reliably. It is, therefore, more difficult for the rehabilitation team to balance the possible increased risk to the community and to the impaired individual against the anticipated benefits that a return to driving may hold for that individual.
Interactive driving simulators can present a diversity of driving challenges in a safe environment. Interactive simulators produce reliable, objective measurement of driving behaviors, allowing rehabilitation professionals to ascertain the least restrictive safe driving option for a given individual. An interactive simulator enables a person with cognitive impairment to experience realistic outcomes of his or her performance, providing an opportunity for individuals to confront errors and more accurately self-assess their driving abilities. Accurate self-appraisal may help resolve differences between the patient’s self-assessment of driving ability and that offered by the rehabilitation professional.
The long-term goal of this project is to develop and commercialize STISIM Drive (Figure A-1), a relatively low-cost driving simulator that uses standard PC technology. Although ultimately this simulator may be useful for individuals with a wide range of motor, sensory and information processing disabilities, the current project focuses on applications to persons with adult onset brain injury and resulting cognitive deficits.
In Phase I, we implemented several engineering changes to STISIM Drive, developed protocols for using the simulator with subjects with mild to moderate cognitive disabilities resulting from brain injury, and pilot tested the protocols on five brain-injured and five matched, non-disabled subjects. In Phase II, we will further enhance the simulator and will conduct a multi-center clinical trial to demonstrate STISIM Drive's viability as a rehabilitation tool for this patient population. The purpose of the Phase II project is to validate the simulator as a tool. We will let others determine how this tool is best applied to specific tasks such as training and licensing. Commercialization and market introduction will be conducted after Phase II is complete.
Figure A-1: STISIM Drive showing driving console, 3-monitor display and operator controls. The right hand picture demonstrates a typical roadway scene.
Page 32
Principal Investigator/Program Director (Last, first, middle): DURFEE, WILLIAM K
The specific aims of Phase II are to:
1. Update the hardware and software of STISIM Drive to improve the face validity of the driving experience and to ease the task of data analysis. The improvements are based upon what we learned during the Phase I study and include:
1.1 Increasing the realism of STISIM Drive.1.2 Using feedback from clinicians participating in the multi-center trial to make
improvements in the usability of STISIM Drive. Creating improved data output formats that are clinically meaningful and easy to interpret.
1.4 Creating a driving scenario for the Phase II clinical trials that incorporates a variety of normal and extraordinary driving challenges. Data generated from driving this scenario will provide a normed performance data base that others can use in their evaluation programs.
2. Through a multi-center clinical trial, answer four key questions that will help determine simulator efficacy as an assessment tool in a clinical setting. These questions are:
2.1 Concurrent validity: Is performance on the driving simulator similar to on-road performance? This experiment requires both simulator and on-road tests.
2.2 Test-retest reliability: Do you get similar simulator session results when the test is repeated a second time on the same subject with a 2 week delay between test sessions? Favorable results will enable clinicians to determine how patient performance changes over time.
2.3 Discriminant validity: Can the simulator discriminate between the driving ability of subjects with different cognitive impairments? That is, are scores from simulator runs consistent with other test methods used to categorize the severity of cognitive impairment?
2.4 Face validity: Do clients who drive the simulator accept that simulator driving is similar to real, on-road driving?
3. Conduct a pilot study to determine if the simulator can be used therapeutically to change a driver’s self-awareness of driving ability. This study will show whether feedback given by the simulator and by the driving evaluator can improve the accuracy of self-appraisal of driving skills. We suspect that the simulator will ultimately have the most value as a therapeutic tool in a rehabilitation clinic setting and we are eager to see if use of the simulator with feedback can indeed impact self-awareness for brain-injured persons. This study is designed to not be linked to any of the validity tests listed in Aim 2.
B. SIGNIFICANCEIn the United States, driving provides both community mobility and a critical part of one’s self-definition as an adult (Cook, 1990; Katz, 1990; Fisk, 1997). Most adults in the U.S. must rely on the automobile to maintain a social life in the community and accomplish routine tasks such as commuting and shopping. The demands of driving are growing, however. Increasing traffic, higher speeds, complex signage, and roadside distractions such as outdoor advertising, compete for the driver’s attention and require faster responses. The decaying U.S. roadway infrastructure has led to more construction and work zones - the highest crash sites on our nation’s highways (Pigman, 1990). Vehicles equipped with on-board electronics, computerized climate control systems and digital instrumentation have become more, not less, demanding to drive (ITS World, 1998), and the technologies causing this phenomenon continue to proliferate. These factors make driving more difficult for everyone, but especially so for drivers with cognitive impairments.
It is often unclear when or whether adults with brain injury should return to driving. Brain injuries frequently occur during a person’s prime wage-earning years, leading to strong motivation to drive again at the earliest possible time. It is estimated that approximately 373,000 Americans per year are hospitalized with traumatic brain injury. Of these, some 99,000 sustain moderate to severe injuries
Page 33
Principal Investigator/Program Director (Last, first, middle): DURFEE, WILLIAM K
resulting in life-long disabling conditions (Brain Injury Association, 1994). Stroke affects more than half a million Americans annually, and is the leading cause of serious, long term disability in the United States (American Heart Association, 1997). Individuals with cognitive impairments due to brain injury often show deficits in critical driving skills such as simultaneous information processing, rapid attention switching, the ability to deal with complexity, peripheral awareness, freedom from distractibility, mental flexibility and impulse control (Engum, 1988; Galski, 1990; Klavora, 1995). In addition, such individuals often lack the ability to adequately assess their own capacity for safe driving. This is due in part to a loss of metacognitive (self-appraisal) capability that often accompanies such impairment (Gianutsos, 1994).
Individuals with severe cognitive impairments from BI, are readily identified as unsafe drivers who pose unreasonable risk to themselves and others. Physicians, rehabilitation personnel, families, and other caregivers generally agree that these individuals should not drive. Individuals with mild to moderate cognitive deficits occupy a gray zone. They are difficult to categorize as safe or unsafe drivers without comprehensive and explicit driving related information, and it is challenging to balance the possible risks and benefits that their return to driving carries for the individual and the community (Cook, 1990).
Many experts believe that the licensing process does a poor job of screening “safe” from “unsafe” drivers (Peck and Wachtel, 1993). Government crash data (U.S. Senate, 1993) document that drivers under age 25 and those 65 and above are significantly overinvolved in motor vehicle crashes when the data are corrected for exposure. Because of their elevated crash risk, considerable research has been devoted in recent years to younger and older at risk drivers, as well as to drivers with progressive disorders such as Alzheimer’s disease (Odenheimer, 1993; Hunt, 1993; Hunt, 1993). Much of this research has been oriented toward the development of better assessment, screening, and training methods. Cognitively impaired individuals, however, have been under served by the community of professionals engaged in driver performance research, assessment, and training.
Rehabilitation institutions throughout the U.S. use clinical assessments and on-road driving evaluations to assess the road-worthiness of brain-injured individuals, but these driving programs often suffer from one or more of the following limitations: (a) clinical assessment of cognitive and perceptual abilities is linked only minimally to “safe driving” as measured on-road (Brooke, 1992; Korner-Bitensky, 1994); (b) on-road driving evaluation is inherently subjective, and because of its real-time nature, limited in its ability to provide counseling to assist in patient self-identification of problems (Gianutsos, 1994; Sprigle, 1995; Galski, 1997), and (c) on-road driving evaluation does not permit the evaluator to observe or assess the specific situations likely to cognitively challenge during real-world driving (Rizzo, 1997). To reduce the risk of a crash during an evaluation, driving professionals typically seek the least threatening testing environment possible, such as residential neighborhoods with little traffic. Accordingly, these evaluations are often performed under conditions that are unlikely to challenge the capabilities of all but the most significantly compromised individuals. On-road evaluations rarely test real-world conditions of freeway speeds, heavy traffic and unfamiliar roads - conditions that may be encountered by any driver at any time (Gianutsos, 1994; Rizzo, 1997), and which are most likely to challenge the very skills that are likely to be compromised in cognitively impaired persons. Without having experienced realistic challenges to the cognitive skills required in driving, many cognitively compromised individuals may pass on-road evaluations and return to driving before they are ready (Cook, 1990; Pierce, 1993).
In summary, although the decision about when to return to driving after brain injury is important, with medical and legal implications, the rehabilitation community is ill equipped to make that decision. In fact, the clinical partners involved in this Phase II project all have personal experiences through their driver evaluation programs in facing this difficult problem of evaluating and helping adults with cognitive disabilities. Rehabilitation practitioners are uncomfortable with this responsibility, and the resources available to support their efforts are incomplete and inconsistent.
Page 34
Principal Investigator/Program Director (Last, first, middle): DURFEE, WILLIAM K
Driving simulatorsDriving simulators are based on the concept of placing the driver in an artificial environment where technology creates the impression of driving a vehicle on a road (Wachtel, 1995). There is general agreement that “low-cost” simulators are those that cost less than $100K; “mid-level” simulators between $100K and $1M; and “high end” simulators upward of $1M. High end simulators are specialized tools used for sophisticated research or to support engineering design of new vehicles (Schill, 1990; National Advanced Driving Simulator, 1991). The costs of such simulators, the aircraft hangar-like space needed to house them, and the specialized staff needed to operate, maintain, program, and repair them, makes them unsuitable for routine clinical driver assessment and training. Mid-level simulators offer high levels of technical sophistication, often including a structure which moves the simulator cab in response to the driver’s control inputs and a visual field-of-view that represents a full 360 from the driver’s eye position. Such simulators may use an actual automobile body as the cab in order to convey a heightened sense of realism to the driver. Although it can be argued that simulation should be as realistic as possible, there is much evidence that such sophistication is unnecessary for driver assessment and training (Hays and Singer, 1989; Wachtel, 1991). Low-cost, PC-based driving simulators are typically homegrown assemblages of hardware and software, custom-designed for particular applications (Leonard, 1975; Carsten, 1996; Wachtel, 1996) They are difficult to program, limited in flexibility, unreliable, and, because they are one-of-a-kind devices, successful research findings or assessment protocols cannot be replicated elsewhere. As an example of a very simple simulator, Nouri and Tinson (1988) used an accelerator-to-brake reaction time simulator to assess driving ability. The lowest-cost simulators are non-interactive where the roadway scene viewed by the driver is filmed or videotaped in advance and played back during the simulation. The limitation of such a simulator is that the driver’s actions on the simulated vehicle’s controls have no meaningful effect on the simulation; the scene continues to unfold as if the driver had done nothing. Such simulators are incapable of supporting assessments of the complex judgment and decision making skills that are at issue with cognitively impaired patients (Galski, 1997).
A few competing simulators have been used in rehabilitation applications. driVR by Imago Systems, Inc. (www.drivr.com, $2,200) is a PC-based simulator that uses a head-mounted display (Hirsekorn and Taylor, 1998; Liu et al, 1999; Wald et al, 2000). Head-mounted goggles are still limited in their ability to rapidly render high-fidelity images, and the totally immersive environment can induce simulator sickness. Also, some clients do not wish to wear the goggles. The Elemental Driving Simulator (EDS) from Life Science Associates (lifesciassoc.home.pipeline.com/cog/driving/edsfly~1.htm) is offered as an accessory for a home or office PC (Gianutsos, 1994). It is a quasi-simulator designed to test whether cognitive and reaction skills are sufficient for driving using simplified graphics for various driving situations. It does not offer custom, full driving scenarios. The L-300 simulator from Doran Precision Systems (www.doronprecision.com/ dorondriver.htm) is popular in driving rehab programs, but is non-interactive. The A.M.O.S. II simulator from Doran is interactive, but is designed specifically for law enforcement and emergency response vehicle training. On the PC video game market is SmartDriver from BrainTrain (www.braintrain.com/smartdriver/sd_home.htm) that presents simplified driving scenarios designed to build cognitive skills and self-esteem about driving. It is not intended to be a full, realistic driving simulator.
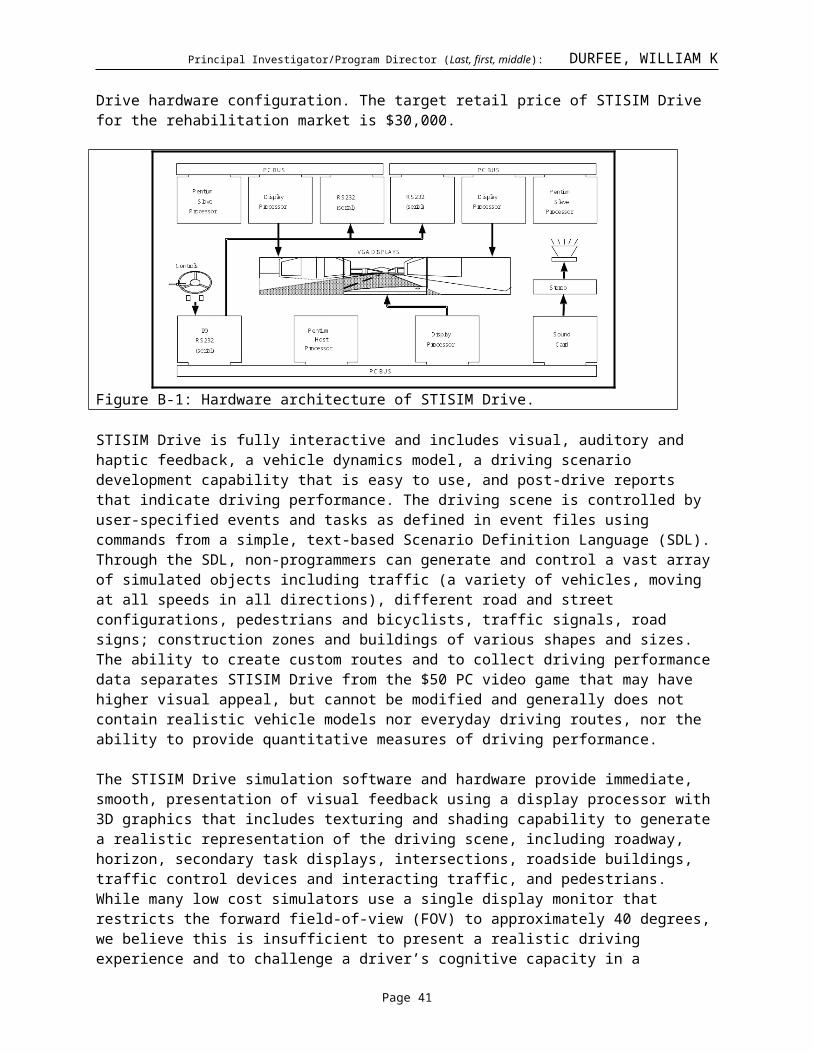
STISIM Drive simulatorSTISIM Drive is a proven, low-cost, PC-based commercial product, designed to be flexible, reliable and easy to use (www.systemstech.com/stidrsm1.htm). It uses standard PC architecture and off-the-shelf components to create simulated images and respond to driver steering, acceleration and brake input in real-time. Figure A-1 shows the three-monitor version of STISIM Drive that was used in Phase I and will be used again in Phase II. Figure B-1 shows the STISIM Drive hardware configuration. The target retail price of STISIM Drive for the rehabilitation market is $30,000.
Page 35
Principal Investigator/Program Director (Last, first, middle): DURFEE, WILLIAM K
Figure B-1: Hardware architecture of STISIM Drive.
STISIM Drive is fully interactive and includes visual, auditory and haptic feedback, a vehicle dynamics model, a driving scenario development capability that is easy to use, and post-drive reports that indicate driving performance. The driving scene is controlled by user-specified events and tasks as defined in event files using commands from a simple, text-based Scenario Definition Language (SDL). Through the SDL, non-programmers can generate and control a vast array of simulated objects including traffic (a variety of vehicles, moving at all speeds in all directions), different road and street configurations, pedestrians and bicyclists, traffic signals, road signs; construction zones and buildings of various shapes and sizes. The ability to create custom routes and to collect driving performance data separates STISIM Drive from the $50 PC video game that may have higher visual appeal, but cannot be modified and generally does not contain realistic vehicle models nor everyday driving routes, nor the ability to provide quantitative measures of driving performance.
The STISIM Drive simulation software and hardware provide immediate, smooth, presentation of visual feedback using a display processor with 3D graphics that includes texturing and shading capability to generate a realistic representation of the driving scene, including roadway, horizon, secondary task displays, intersections, roadside buildings, traffic control devices and interacting traffic, and pedestrians. While many low cost simulators use a single display monitor that restricts the forward field-of-view (FOV) to approximately 40 degrees, we believe this is insufficient to present a realistic driving experience and to challenge a driver’s cognitive capacity in a realistic way. For example, narrow FOV prevents the depiction of cross traffic at intersections. With its three-monitor display, STISIM Drive provides a 135 FOV .
Auditory and haptic cues from a simulator contribute substantially to the experience of realism in driving. Sounds of engine, road and tire noise convey a sense of speed and the sharpness of turns; while ambient sounds of horns, sirens, and car audio systems contribute to the overall experience of driving. In the absence of a full motion platform, important cues to the movement of the vehicle can be communicated via haptics through the steering wheel. STISIM Drive has a complete vehicle dynamics model that determines the behavior of the vehicle in response to driver input in real-time. The model provides high-fidelity steering dynamics and realistic vehicle response to road geometry including hills, curves and road crown. The model also accurately reproduces automatic transmission dynamics and provides haptic (proprioceptive) feedback to the driver through a torque-motor controlled steering wheel, and auditory cues that reflect engine speed via the motor sound and screeches to indicate when tire limits are exceeded during hard cornering and braking.
Complex scenes, dense traffic, and high speeds tax the graphics processing performance of the simulator’s computer, which must constantly act to minimize system delays between driver input and
Page 36
Principal Investigator/Program Director (Last, first, middle): DURFEE, WILLIAM K
visual, auditory, and tactile output. Excessive delays lead to a phenomenon known as cue conflict which can compromise the realism of the simulator and induce symptoms of simulator discomfort (Allen, 1991; Casali, 1986; Griffin, 1993). The effects of simulator discomfort, although not long lasting, tend to be in the form of mild headache and/or nausea and may preclude certain individuals from completing a simulator session. There are both design and operational characteristics that can reduce or eliminate the incidence of simulator discomfort (Hein, 1993; Wachtel 1993). To minimize simulator sickness, sustained update rates of at least 20 frames per second (fps) are needed in driving simulators (Padmos, 1992). To reduce system lag time between driver input and updating the simulation graphics, STISIM Drive uses a multi-processor approach based on the PC platform and high-speed graphics accelerators. During Phase I, we successfully used a familiarization drive to minimize the risk of simulator sickness. In Phase II, we will collect quantitative data on incidence and intensity of simulator sickness to understand how this may impact the final clinical product.
Driving simulators have not been widely used in rehabilitation applications. STISIM Drive is a low-cost, PC-based simulation platform that can support the development of standardized assessment and training protocols that can be shared across institutions. If proven valid, reliable, and acceptable to clients and rehabilitation professionals, STISIM Drive, and the protocols developed for it, will greatly enhance the ability of the rehabilitation team and physician to assess the capability of persons with moderate cognitive impairments to drive safely, and aid those persons' self-appraisal of their own driving limitations. Thus, the commercialization purpose of this project is to improve STISIM Drive technology and to conduct a clinical validation study that will allow Systems Technology to enter a new market. The project is led by Systems Technology, Inc., a small business that is a technological leader in the field of PC-based driving simulation, in collaboration with a nationally respected research university, and three major providers of rehabilitation services to the target population of individuals with cognitive disabilities.
C. PHASE I FINAL REPORTTraumatic and non-traumatic brain injury often impairs both the cognitive skills critical to safe driving and the metacognitive skills that allow these persons to realistically self-assess their abilities to drive safely. Persons with brain injury may see driving limitations as unnecessary burdens. These people are more likely to return to driving against medical advice, endangering themselves and others in the process. On-road driving assessments, the current gold standard, are hampered by their subjectivity and lack standardization, reliability, and empirical validity. Further, to control risks to person and property, on-road tests are often conducted on quiet streets. Thus, they have high face validity as tests of basic vehicle control, but are unable to reflect the stress and risks of real-world driving. Conversely, interactive driving simulators can present a diversity of driving challenges and permit the person with brain injury and cognitive impairment to experience immediate feedback of his or her performance. The Phase I goal of our project was to evaluate and validate a low-cost, PC-based, interactive driving simulator to assess driving performance of patients with moderate cognitive impairment due to adult onset brain injury. demonstration of driving capabilities and limitations.
Summary of specific Phase I aims:Phase I had 4 specific aims. A 5th was added after the project started. 1) Customize an existing, proven, interactive PC-based driving simulator developed by STI to
make it applicable for assessment of drivers with moderate cognitive impairments secondary to adult onset brain injury.
[Status: Met] We successfully used STISIM Drive and custom designed scenarios to assess 5 non-disabled subjects and 5 persons with adult onset brain injury with cognitive impairment. 2) Develop a minimum of two simulator-based driving scenarios, representing a range of real-
world driving tasks. [Status: Met] Three simulation experiences were designed and realized for Phase I: an orientation drive and a two part drive in which data were gathered. The orientation drive introduced subjects to the look and feel of the simulator, and familiarized them with basic vehicle control including starting and stopping,
Page 37
Principal Investigator/Program Director (Last, first, middle): DURFEE, WILLIAM K
negotiating curves and hills, and turning. In addition to orienting the driver to the simulator experience, an orientation experience helps reduce simulator sickness (Watson, 1997), a traditional problem of simulators.
The simulated drive for driver performance evaluation was approximately 19 miles long and took about 40 minutes to complete when driven at posted speeds. The route simulated driving requirements of rural, residential, and commercial/business areas. The majority of the simulation was spent driving 2 lane (rural and residential) and 4 lane (business) roadways and included hills and flat roads, and over 2 miles of 6 lane limited access highway. Subjects were instructed to maintain the posted speed limit and remain in the right lane except when passing, turning, or avoiding an obstacle. Commands for turns were given by a researcher, keyed to specific simulator landmarks.
The drive had 2 parts. The first half (simple) matched the turns, segments, and road environments of the on-road driving experience used in the study. It presented traffic flow in the subject’s and on-coming lanes and required that the subject maintain speed and lane position; start and stop; and move with other traffic. The second half of the simulated drive (complex) also used the on-road route as its basis, but added 6 critical events that could occur in routine driving but were not commonly encountered during the typical on-road experience. 3) Pilot test the simulator and two scenarios with a small sample of individuals diagnosed with
moderate cognitive impairments, and with a small number of non-impaired subjects[Status: Met] In addition to the 20 pre-pilot volunteers who drove the simulator to help refine the study’s scenarios and protocol, the final simulations were presented to 5 non-disabled persons and 5 persons with brain injury and resulting cognitive impairment. One brain-injured subject was able to complete only 75% of the simulated drive, due to a headache that began prior to the simulation experience. Three subjects (2 non-disabled, and 1 brain-injured) developed symptoms of simulator sickness but none had to stop driving as a result. The simulator differentiated between brain-injured and non-disabled subjects across several measures, but because of sample size, these results are tentative. Phase II will refine the simulated driving scenario and evaluate its test-retest stability, its ability to differentiate between brain-injured and non-disabled, and its concurrent validity to an on-road assessment. 4) Qualitatively compare the simulator results to independently conducted on-road driver
evaluations, and identify any deficiencies in the simulator hardware and software[Status: Met] The Global Driving Score (an overall measure of driving ability) for on-road, simple simulation, and complex simulation were compared for brain-injured and non-disabled subjects. Non-disabled subjects topped-out on all drives, producing perfect agreement across the measures. Brain-injured subjects had better scores from the simple simulated drive than from the complex. Scores from the complex drive related more closely than the simple to the on-road scores.
Subjects’ responses to forced-choice and open questions regarding the quality and self-perceived validity of the simulated and on-the-road experiences helped identify deficiencies in simulator hardware and software, and helped to determine the changes to be implemented in Phase II to gain stronger acceptance of simulation findings by the target population. 5) Describe the impact that the on-the-road and simulation have on self-awareness of deficits
related to driving.[Status: Met] Change in self-awareness of deficits was assessed quantitatively using the Self-Awareness of Deficits Inventory (SADI) (Fleming, Strong, and Ashton, 1996), adapted to emphasize driving issues and goals. The 5 brain-injured subjects’ SADI scores were compared before and after the on-road and simulated drives. In general there was a temporary, weak improvement in self-awareness of deficits associated with both on-road and simulated drives. Neither driving experience was sufficient in itself to improve self-awareness in a meaningful manner. Phase II continues this question, examining whether more intense feedback in the form of replays of the simulated drive and guided review by the researcher can significantly and permanently improve self-awareness of deficits related to driving.
It was proposed, a priori, that Phase I would be considered successful if:(a) The simulator proved capable of generating performance based driving data for the described
population. [Status: Met] The simulator was able to consistently generate 1) continuous data such
Page 38
Principal Investigator/Program Director (Last, first, middle): DURFEE, WILLIAM K
as speed and lane position, 2) discrete data such as numbers of crashes and runs off road, 3) complex data such as time to collision and types of strategies used in critical events.
(b) A protocol was developed that successfully permitted testing of individuals with moderate cognitive impairment. [Status: Met] All subjects with brain injury were considered appropriate for driving assessment by their physician, and all passed the pre-driving assessment of physical abilities, problem solving related to traffic, Trails A&B, memory, and perception. Three failed the on-road, and 2 passed with driving restrictions. None earned a true “pass”. This indicates that the criteria for study admission and screening tools provided an appropriate population for the study, and were neither too lenient nor too restrictive.
(c) Driving scenarios of contrasting difficulty yielded different performance from subjects [Status: Met] Brain-injured and non-disabled subjects showed different patterns of behaviors across several driving measures.
(d) Subjects gave pertinent subjective feedback to refine face validity of the simulation. [Status: Met] All subjects completed the exit interviews regarding face validity of the simulation, with strong similarity shown between brain-injured and non-disabled groups for most critical issues.
PHASE I METHODSSubjects: A convenience sample of 5 adults (3 women, 2 men) with adult onset brain injury met the study inclusion criteria (see Section 5 of the application). All expressed interest in and believed they were ready to return to driving. The subjects represented a wide range of brain injury: 2 subjects had had brain tumors (mengiomas), 2 had experienced a stroke (1 left parietal; 1 right basal ganglia), and 1 had brain injury from anoxia secondary to a cardiac event. Cognitive impairment was verified by a score of mild/moderate impairment on at least 1 COGNISTAT subscale (excluding language) (APA, 2000). All subjects ambulated without devices, lived in the community, had functional upper extremity strength and motor control, and could drive without adaptive vehicle controls. Subjects ranged from 29-54 years old (X=40.4 years, sd =11.04). Average time post-injury was 1.9 years (s.d. =1.34). A convenience sample of non-disabled subjects was matched to the brain-injured by sex and age (+/-5 years). All had valid licenses and driving histories with less than 3 reportable accidents and no license suspensions/ revocations. Procedure: Subjects were screened and gave informed consent. The order of driving experience was counterbalanced across subjects, with half assessed first using the on-the-road experience and half assessed first on the simulator. On-road experiences were conducted in a new sedan, equipped with instructor brake. Before their on-road drives, brain-injured subjects passed a battery of pre-driving assessments, listed earlier in this report. Other than knowing that the subject was appropriate for on-road assessment, neither the independent on-road driving evaluator nor the researchers knew the results of the pre-driving assessment. Table C-1 displays the assessment administration schedule (see Appendix for forms). Assessors were not informed of subjects’ status (brain-injured/non-disabled), but brain-injured subjects were likely identifiable by mannerism and conversation.
The researcher who completed the Cognitive and Motor Behaviors Scales and the Global Driving Score for the on-road drive was blind to the score earned during the simulated drive, and vice versa. Cognitive and Motor Behavior Scales were scored as OK, marginal, or Unacceptable across 8 cognitively based behaviors and 4 motor behaviors. The same researcher completed the Global Driving Score, assessing subjects’ overall driving ability scoring subjects on a scale of 0 (Totally Unsafe) to 4 (Totally Safe). The independent on-road, professional driving evaluator, blind to the score earned on the simulator, rated each subject’s on-road performance as Pass, Pass with restriction, or Fail. Subjects were only informed of their driving behaviors and scores after all of their data were collected for both on-road and simulated drives.
The Validity of Experience interview was used to assess the degree to which subjects were willing to accept on-road and simulator findings, their reasoning, and alterations needed to increase the face validity of the driving experiences. Subjects were interviewed after each experience using a combination of forced choice and open-ended questions. Interviews were transcribed, coded, and analyzed by a researcher and an occupational therapy graduate student. Before and after each drive, a researcher interviewed brain-injured subjects using the Self-Awareness of Deficits Interview (SADI) (Fleming, Strong and Ashton, 1996) The SADI assesses how closely an individual’s self-appraisal of
Page 39
Principal Investigator/Program Director (Last, first, middle): DURFEE, WILLIAM K
abilities matches reality, and therefore requires that the scorer be familiar with the subject’s objective cognitive and functional abilities and prognosis. Open end responses were transcribed, coded, and analyzed by a different researcher and an occupational therapy graduate student.
Table C-1 Subject schedulePreliminary On-Road Simulated Drive POST
STUDYPre Post Pre PostTelephone pre-screen XCOGNISTAT XPre-driving Battery XCognitive & Motor Behaviors Scales X X Global Driving Score X X Courage Center’s Indep. Assessment XSimulator Sickness Inventory (SSI) X XValidity of Experience X XSelf-Awareness of Deficits Interview X X X XSubject informed of drives results X
PHASE I RESULTS AND DISCUSSION
CONCURRENT VALIDITY The Global Driving Score (GDS) was the main measure used to compare simulator and on-road performance(Table C-2). Non-disabled subjects topped out on the GDS for on-road, simulation-simple, and simulation-complex scenario, demonstrating that the scoring system correctly measures good drivers and that good drivers do equally well on-road as they do in simulation. The match between on-road and simulation for the brain-injured subjects was weaker, with strongest match occurring between the complex portion of the simulator and the on-road assessment. When only the brain-injured subjects’ scores are considered, all but 1 subject performed better on the simple simulation than on the complex, indicating that the complex simulation was indeed more challenging to navigate successfully. This also suggests that a simulator with complex driving challenges is needed to bring out driving deficiencies. Over the 10 subjects, a t-test showed significant difference between brain-injured and non-disabled for both on-road and simulator GDS scores demonstrating that even using a single global evaluation of driving, the simulator is capable of distinguishing normal from brain-injured drivers. In Phase II, the much larger sample size will enable more definitive statements to be made on concurrent validity. Also, Phase II will add quantitative driving performance measures to the concurrent validity question.
There are only 2 other studies of concurrent validity in the literature. One demonstrated poor concurrent validity between simulator and on-road global scores (Nouri and Tinson, 1988). The other demonstrated that specific critical events and lane positioning were significantly correlated to on-road scores (Wald, Liu, Reil, 2000).
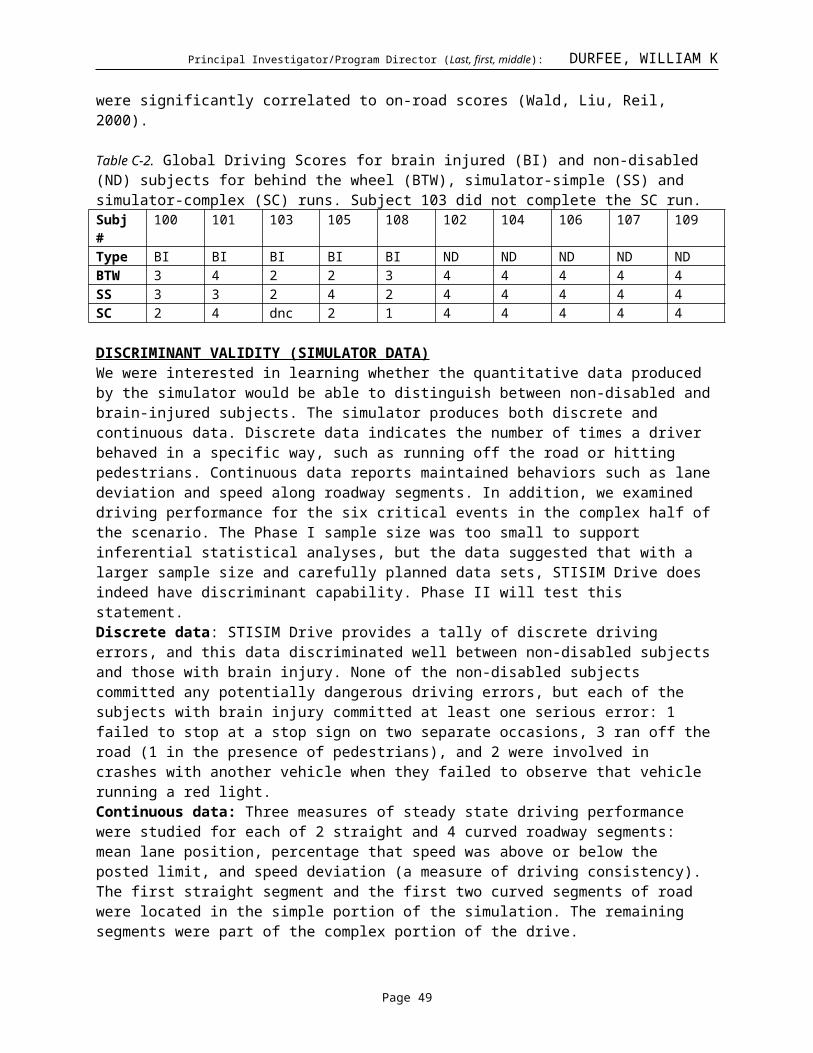
Table C-2. Global Driving Scores for brain injured (BI) and non-disabled (ND) subjects for behind the wheel (BTW), simulator-simple (SS) and simulator-complex (SC) runs. Subject 103 did not complete the SC run. Subj # 100 101 103 105 108 102 104 106 107 109Type BI BI BI BI BI ND ND ND ND NDBTW 3 4 2 2 3 4 4 4 4 4SS 3 3 2 4 2 4 4 4 4 4SC 2 4 dnc 2 1 4 4 4 4 4
DISCRIMINANT VALIDITY (SIMULATOR DATA)We were interested in learning whether the quantitative data produced by the simulator would be able to distinguish between non-disabled and brain-injured subjects. The simulator produces both discrete and continuous data. Discrete data indicates the number of times a driver behaved in a specific way, such as
Page 40
Principal Investigator/Program Director (Last, first, middle): DURFEE, WILLIAM K
running off the road or hitting pedestrians. Continuous data reports maintained behaviors such as lane deviation and speed along roadway segments. In addition, we examined driving performance for the six critical events in the complex half of the scenario. The Phase I sample size was too small to support inferential statistical analyses, but the data suggested that with a larger sample size and carefully planned data sets, STISIM Drive does indeed have discriminant capability. Phase II will test this statement. Discrete data: STISIM Drive provides a tally of discrete driving errors, and this data discriminated well between non-disabled subjects and those with brain injury. None of the non-disabled subjects committed any potentially dangerous driving errors, but each of the subjects with brain injury committed at least one serious error: 1 failed to stop at a stop sign on two separate occasions, 3 ran off the road (1 in the presence of pedestrians), and 2 were involved in crashes with another vehicle when they failed to observe that vehicle running a red light. Continuous data: Three measures of steady state driving performance were studied for each of 2 straight and 4 curved roadway segments: mean lane position, percentage that speed was above or below the posted limit, and speed deviation (a measure of driving consistency). The first straight segment and the first two curved segments of road were located in the simple portion of the simulation. The remaining segments were part of the complex portion of the drive. Straight Roadway Segments Two 1000 foot straight roadway segments were examined. Lane Position: There was little difference between the brain-injured and non-disabled subjects’ lane maintenance on straight roadways (Figure C-1). Of the nine subjects who had data for both segments, all but 1 improved in mean lane position (i.e., approached zero deviation) between the first and second segments. By the second segment, all 5 of the non-disabled subjects moved to a more centered position, as did 3 of the 4 brain-injured subjects. The ranges of lane positions were similar for both groups across the first and second segments. Lane positioning on straight segments does not appear to differentiate between brain-injured and non-disabled subjects.
Figure C-1. Mean lane position during straight segments of road.
Speed: Brain-injured and non-disabled subjects differed in their speed on straight segments. All non-disabled subjects adhered to the posted speed limit across the two segments, with 4 out of 5 showing better speed control during the second segment (Figure C-2). In contrast, the brain-injured group had wide ranges around posted speed limits during the first segment (16.1% below to 7.1% above), and even broader ranges during the second segment (9.0% below to 25.4% above speed limit).
-20
-15
-10
-5
0
5
10
15
20
25
30
Roadway Segment
Perc
ent o
f Mea
n Sp
eed
Brain Injured 1
Brain Injured 2
Brain Injured 3
Brain Injured 4
Brain Injured 5
Non-Disabled 1
Non-Disabled 2
Non-Disabled 3
Non-Disabled 4
Non-Disabled 5
Figure C-2. Percentage that subjects’ mean speed was above or below posted speed limit on straight segments of road.
Speed Deviation Speed deviation is a measure of consistent speed. Little deviation indicates smooth, steady speed maintenance. Large deviation indicates erratic control, sometimes driving faster and sometimes slower though the posted speed limit remains constant. Non-disabled subjects improved in their ability to maintain a constant speed between the first and second segment, while those with brain
Page 41
Principal Investigator/Program Director (Last, first, middle): DURFEE, WILLIAM K
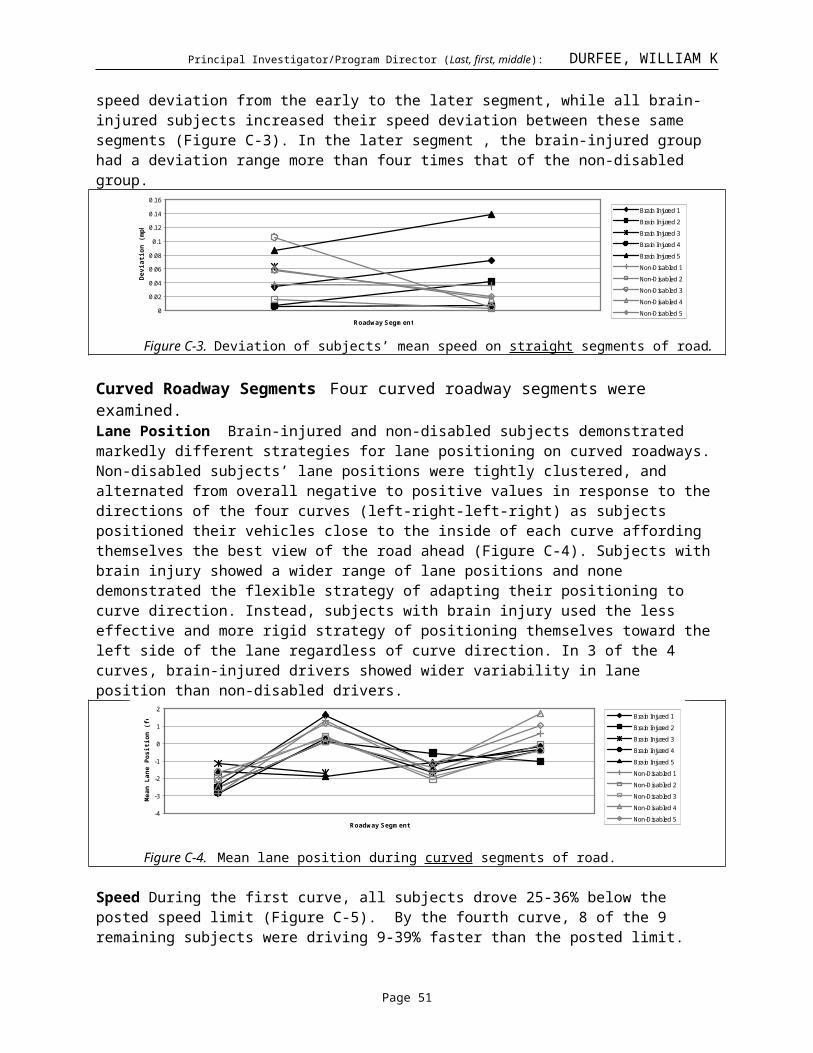
injury became more erratic. All non-disabled subjects decreased their speed deviation from the early to the later segment, while all brain-injured subjects increased their speed deviation between these same segments (Figure C-3). In the later segment , the brain-injured group had a deviation range more than four times that of the non-disabled group.
0
0.02
0.04
0.06
0.08
0.1
0.12
0.14
0.16
Roadway Segment
Dev
iatio
n (m
ph)
Brain Injured 1
Brain Injured 2
Brain Injured 3
Brain Injured 4
Brain Injured 5
Non-Disabled 1
Non-Disabled 2
Non-Disabled 3
Non-Disabled 4
Non-Disabled 5
Figure C-3. Deviation of subjects’ mean speed on straight segments of road.
Curved Roadway Segments Four curved roadway segments were examined.Lane Position Brain-injured and non-disabled subjects demonstrated markedly different strategies for lane positioning on curved roadways. Non-disabled subjects’ lane positions were tightly clustered, and alternated from overall negative to positive values in response to the directions of the four curves (left-right-left-right) as subjects positioned their vehicles close to the inside of each curve affording themselves the best view of the road ahead (Figure C-4). Subjects with brain injury showed a wider range of lane positions and none demonstrated the flexible strategy of adapting their positioning to curve direction. Instead, subjects with brain injury used the less effective and more rigid strategy of positioning themselves toward the left side of the lane regardless of curve direction. In 3 of the 4 curves, brain-injured drivers showed wider variability in lane position than non-disabled drivers.
-4
-3
-2
-1
0
1
2
Roadway Segment
Mea
n La
ne P
ositi
on (f
eet)
Brain Injured 1
Brain Injured 2
Brain Injured 3
Brain Injured 4
Brain Injured 5
Non-Disabled 1
Non-Disabled 2
Non-Disabled 3
Non-Disabled 4
Non-Disabled 5
Figure C-4. Mean lane position during curved segments of road.
Speed During the first curve, all subjects drove 25-36% below the posted speed limit (Figure C-5). By the fourth curve, 8 of the 9 remaining subjects were driving 9-39% faster than the posted limit. Nearly all subjects increased speeds at each successive curved segment.
-40
-30
-20
-10
0
10
20
30
40
50
Roadway Segment
Perc
ent o
f Mea
n Sp
eed
Brain Injured 1
Brain Injured 2
Brain Injured 3
Brain Injured 4
Brain Injured 5
Non-Disabled 1
Non-Disabled 2
Non-Disabled 3
Non-Disabled 4
Non-Disabled 5
Figure C-5. Percentage that subjects’ mean speed was above or below posted speed limit on curved segments of road.
Speed Deviation Brain-injured subjects demonstrated a less consistent speed during their drives than did the non-disabled subjects (Figure C-6). In addition, the range of speed deviations was wider for the brain-injured group than for the non-disabled group across all of the curved segments.
Page 42
Principal Investigator/Program Director (Last, first, middle): DURFEE, WILLIAM K
0
0.05
0.1
0.15
0.2
0.25
Roadway SegmentDe
viat
ion
(mph
)
Brain Injured 1
Brain Injured 2
Brain Injured 3
Brain Injured 4
Brain Injured 5
Non-Disabled 1
Non-Disabled 2
Non-Disabled 3
Non-Disabled 4
Non-Disabled 5
Figure C-6. Deviation of subjects’ mean speed on curved segments of road.
Critical Events: Six cognitively challenging events were developed for the complex portion of the drive. Of these, three discriminated between brain-injured and non-disabled subjects. For critical event 1, a car running a traffic light at a 4-way intersection, two of the BI subjects crashed into the car. In critical event 2, as the subject rounds a left curve, an oncoming sedan pulls into the driver’s lane to pass a bus that had been obscuring it from the subject’s view. When the sedan and the subject’s vehicle are within 2 seconds of colliding with each other (based on relative velocities), the sedan pulls back into its lane, in front of the bus. The subject has a 3 second window to release throttle, apply brake, and steer to avoid the head-on collision. Time to collision (Figure C-7) represents the time that the subject was away from having a head-on collision at their first evasive action (i.e., throttle, brake, or steer) and has been shown to be a sensitive measure of impairment (Fiorentino, Parseghian, 1997). All subjects applied their brakes during the event, but brain-injured subjects did so later than non-disabled. Anticipatory braking and defensive steering have been cited as strong factors in safe driving (Galski, Ehle, Williams,1997). All non-disabled subjects used a combined strategy of braking and steering to avoid collision, while only 1 brain-injured subject used steering to any significant degree.
0
0.02
0.04
0.06
0.08
0.1
0.12
0.14
Tim
e to
Col
lisio
n, S
econ
ds
Brain InjuredNon-Disabled
Figure C-7. Time to collision for head-on collision critical event.
In critical event 3, the subject is forced to travel behind a slow-moving vehicle on a two-lane road which does not permit passing. The slow pace of the lead vehicle assured that the subject could not maintain posted speed as instructed. The distance that elapsed before the subject executed a passing maneuver once the pavement markings changed to permit passing was measured. In all cases, brain-injured subjects initiated the pass sooner than non-disabled subjects (Figure C-8). On average, non-disabled subjects waited twice as long before passing. This may indicate brain-injured subjects’ greater impulsiveness and general failure to attend to potential hazard.
020406080
100120140160180
Dis
tanc
e, F
eet
Brain InjuredNon-Disabled
Figure C-8. Critical Event: Distance before passing for slow-moving vehicle critical event.The 3 critical events that failed to discriminate between brain-injured and non-disabled subjects
were: (1) car on shoulder suddenly merging into traffic, (2) an unprotected left turn, and (3) a pedestrian
Page 43
Principal Investigator/Program Director (Last, first, middle): DURFEE, WILLIAM K
crossing. In our particular implementation, these appeared to permit too much time for decision making to be truly challenging. These can still be challenging events if the decision time is reduced in the simulation and therefore may still be considered for inclusion in Phase II.
Conclusions:The data indicate that:1. Discrete data was easy to pull from the STISIM Drive. Continuous simulator data and more
complicated analysis of critical events was more difficult to prepare and analyze. In Phase II we will write software to automate continuous data analysis and will develop simpler performance metrics for critical events.
2. Though the Phase I sample size was too small to form conclusions based on statistical significance, it did indicate which indicators should be examined in future studies with larger number of subjects. Several aspects of discrete, continuous, and critical event data appear to differentiate between brain-injured and non-disabled subjects and frequently offer insights to the different strategies employed by the two groups. In Phase II, the challenging events will be designed to bring out differences.
3. It is possible that the differences between brain-injured and non-disabled are attributable to differences in motor control. Phase II will examine whether this difference is more closely linked to simple reaction time or truly demonstrates cognitive impairment, by using upper and lower extremity simple reaction time as a covariate.
4. In Phase I, a continuous stream of data was collected for the run instead of for specific blocks of data. This increased the amount of data collected and prohibited collecting data on traffic flow. Phase I results will help target the design of Phase II roadway segments and types of data most likely to differentiate between brain-injured and non-disabled.
FACE VALIDITY Participants were asked how elements of the simulation and on-road test performed and, as a separate measure, how the simulator and on-road drives demonstrated their abilities to perform specific driving skills. This data was used to determine which simulator aspects are adequate to use with brain-injured adults, and which need improvement as part of Phase II. Table C-3 displays the forced choice responses.
Table C-3. Driver Face Validity Questionnaire results Very Good Good Fair Poor Very Poor
HOW WAS THE FEEL OF THE:ON-ROAD SIMULATOR
Brain-injured Non-disabled Brain-injured Non-disabledAccelerator Steering wheel Brake Turn signal
Median Median Median Median
HOW WELL DID THIS DRIVE SHOW YOUR ABILITY TO:ON-ROAD SIMULATOR
Brain-injured Non-disabled Brain-injured Non-disabledControl speed Control in turn Brake Signal turns/lane changes
Handle difficult driving situations
See the road and other cars
Page 44
Principal Investigator/Program Director (Last, first, middle): DURFEE, WILLIAM K
Drive car in general Median Median Median Median
Several elements of the simulation appear to require little or no change for Phase II. No subject complained of problems reaching pedals, positioning the car seat or any issue with the steering wheel size or orientation, though the researcher did note that more options in wheel position might make it easier for a wide variety of patients to use the simulator. No subject voiced problems relating to clarity of view, size or shapes of objects, or difficulty understanding scenario imagery or judging following distance. None reported any concern about the lack of a car body or roof – and none mentioned problems maintaining leg position or arm fatigue that might have been attributable to the absent driver’s door. The absence of a ‘full body’ car did not appear to be an issue.
Though, on the whole, the on-road experience is credited as feeling better than the simulated by all subjects, there was less difference than anticipated between brain-injured and non-disabled subjects. We had thought that brain-injured subjects who did poorly might be overly critical of the simulation, while non-disabled subjects might be more tolerant. Instead, there were few differences in median scores across the two groups’ forced choices and, though the groups differed in the complexity of their open ended responses, the issues raised were substantially similar.
In their comments about the simulator, subjects consistently noted that:1) the turn signal failed to remain engaged, and the absence of expected auditory and visual turn signal
feedback (e.g., clicking and blinking) confused them. This may explain the high failure of even non-disabled to use the turn signal during the simulated drive.
2) the brake offered a reasonable representation when coming to a complete stop, but was less successful when braking to slow acceleration. Several subjects felt that braking response to pressure was inconsistent. Similarly, subjects of both groups voiced concerns regarding inconsistent acceleration.
3) steering was both ‘too loose’ (i.e., offered no resistance when the wheel was turned) and over-responsive (i.e. small movements seemed to produce larger results). Subjects pointed to the latter issue when voicing frustrations about steering during a turn. This was complicated by disorienting visual input and the sound of squealing tires when speed was not deemed high enough to warrant that audio response. As one unimpaired subject commented “I didn’t know where I was going to end up.”
4) the 3 computer monitors provided an adequate view of the road, but several subjects complained that the separate views were disorienting during turns. Both impaired and unimpaired subjects referred to the two-dimensional ‘video game’ look as contributing to difficulties during turns.
5) In spite of the critical events, subjects note that the situational challenges offered during both the on-road and simulated drives were the same or less taxing than those associated with typical driving. More critical events should be added to the simulated drive.
Sometimes, during start up of the simulator, the steering wheel would spontaneously spin, and sometimes "phantom" vehicles would spontaneously appear during a run. These effects (which will be fixed for Phase II) may have contributed to some of their sense of non-reality regarding the simulation.
Conclusions: Subject concerns were integrated in the simulation changes planned for Phase II. These alterations and additional challenging events during the simulated drive should increase the face validity of the simulator and scenarios with subjects and increase the likelihood that subjects with brain injury will accept simulator findings.
SELF-AWARENESS OF DEFICIT: Table C-4 displays the scores of the brain injured subjects from the Self-Awareness of Deficits Interview. The objective of the interview was to see if driving on the road or on the simulator increased a person's awareness of their deficit. Most of the self-awareness scores did not change. Five of the 30 subscores had a one-level change, and although this was too small to reach significance, all changes were towards more
Page 45
Principal Investigator/Program Director (Last, first, middle): DURFEE, WILLIAM K
self-awareness suggesting that both simulator and on-road tests can help to increase one's awareness of deficit.
The SADI interview tapes were also analyzed qualitatively. Subjects recognized that they had deficits as a result of their brain injury, but they rarely associated those deficits with increased risk for driving. Subjects attributed their driving prohibition to physician concerns with memory or general fatigue, neither of which were self-perceived as adequate reasons for not driving. With prompting, subjects did volunteer that they also had problems with decision making and concentration, but most did not connect these deficits to greater danger on the road.
The pilot self-awareness of deficits study in Phase II will include feedback to the subject during the drive and it is suspected that this feedback will have a much bigger impact on the SADI scores.
Table C-4: Scores for brain injured subjects on Self-Awareness of Deficits Interview (SADI). 0=best self-awareness 3=poorest self-awareness
Conclusions: 1) Both the simulator and the on-the-road experience showed a weak, but positive effect on self-
awareness of driving deficits of the higher level subjects. Simple exposure to driving, whether on-road or simulator, did not appear to be strong enough to alter self-perceived deficits in even the short-term. Phase II will include more direct feedback interventions.
SIMULATOR SICKNESS INTERVIEW (SSI): Only 1 brain-injured subject, and none of the non-disabled subjects, had a strong history of motion sickness. Three subjects (2 non-disabled with mild or no history of motion sickness and the 1 BI subject with history of motion sickness) complained of motion sickness after the simulator drive. The brain-injured subject reported having 5 of the 7 symptoms to some degree post-simulation (avoiding only faintness and vomiting). The 2 non-disabled subjects reported 2 or fewer symptoms, and these only in mild form. Incidence of simulator sickness was mild and uncommon among the subjects sampled. One brain-injured subject stopped the simulation drive at approximately the 75% point, due to a headache. She reported that the headache began prior to the simulation and was not a result of it.
Conclusions:1. The simulator protocol developed for the study can be used with brain-injured and non-disabled
subjects without significant simulator sickness2. The SSI yields data that is easily gathered and easily interpreted. Its use should be expanded in Phase
II for all portions of the study related to simulation. The assumption in Phase I was that the on-road experience would not produce motion sickness complaints. Gathering SSI data for subjects after both on-road and simulation would permit comparison of relative effects of the two driving experiences
Page 46
Principal Investigator/Program Director (Last, first, middle): DURFEE, WILLIAM K
and could clarify whether a similar phenomenon may be associated with real-world driving in the brain-injured population.
WHAT WAS LEARNED FROM PHASE I:1. The inclusion/exclusion criteria and Pre-driving Assessment appear to provide subjects appropriate
for driving assessment. The complete Pre-driving Assessment will be continued Phase II for all questions, with all sites using the same criteria for inclusion/exclusion.
2. The STISIM Drive simulator can be reliably used to collect driving data related to vehicle control and motor actions such as speed, lane position, and use of brake and turn signal. Phase II improvements will also permit measures associated with other vehicles or other simulated objects during critical events.
3. The Drive Log form can be simplified in Phase II to focus on elements that cannot be gathered by the computer but might be important for the evaluator to when assigning an overall driving score.
4. The 3 simulator critical events shown to discriminate between brain-injured and non-disabled in Phase I will be retained and the remaining 3 will be redesigned toward greater challenge. Likewise, continuous measures of speed and lane maintenance will be automatically gathered for several non-eventful straight and curved segments throughout the drive.
5. The Global Driving Score will be used in the Phase II concurrent validity study, to compare overall scores on simulator and on-road and on-road scores to simulator produced data.
6. The major concern expressed regarding the simulator as a measure of driving ability was difficulty in controlling the vehicle’s speed in curves and while making intersection turns. Updates planned for Phase II have targeted measures to improve car handling which should improve the face validity of the simulator with subjects as well as increasing the likelihood that subjects with brain injury will accept simulator findings.
7. Self-awareness of deficits hampers long term compliance to restrictions and willingness to use cognitive adaptations. The automatic “stop and reset” triggered when a drivers vehicle runs off-road or collides with an object, did not appear strong enough to change self-awareness of deficit. Phase II is designed to assess whether significantly stronger feedback can alter subjects’ self-awareness of driving deficits. Phase II will continue to use an adaptation of the SADI, but will focus all questions and prompts on driving.
8. The simulator orientation drive appears to adequately control simulator sickness and should be used in Phase II. The SSQ is easily administered and easily interpreted. Its use should be expanded in Phase II to assess whether 1) simulator sickness decreases across multiple experiences (as part of the test-retest study); similar, but un-reported complaints of sickness are part of both the on-road and simulator driving experiences (concurrent validity study).
Phase I was extended beyond the original 12 months because of delays in gaining IRB approval and difficulty in scheduling subjects. The latter resulted from a protocol that required coordinating five data collectors at two sites. Another delay in Phase 1 occurred because the upper Midwest faced one of its longest and most severe winters, interfering with subject access and on-road assessment. The Phase II protocols eliminate the scheduling coordination problems by having each site be independent and by requiring only one research staff member for simulation runs. We will not, however, have any additional control over the weather.
Publications and presentations resulting from the Phase I project are listed in Section G.
PROJECT STAFF: Ted Rosenthal, Senior Engineer (Systems Technology, Inc. -STI) - oversaw technical aspects of the simulator development, refinement, and management of simulator data, collaborated on data analysis. 300 hours. Zareh Parseghian, Staff Engineer (STI) - integrated hardware, electronics and software for the specific simulator used in this project. 20 hours.
Page 47
Principal Investigator/Program Director (Last, first, middle): DURFEE, WILLIAM K
Jerry Wachtel, President and Principal Scientist of The Veridian Group, and Consulting Scientist at STI - refined the simulator, collaboratively developed and refined the scenarios for the driving simulator, and contributed to study design and collaborated on data analysis. 280 hours. Erica Stern, Ph.D., OTR/L, Phase I Principal Investigator, and Associate Professor Department of Physical Medicine and Rehabilitation, University of Minnesota - responsible for overall scientific and technical aspects of the project, managed all matters concerning UM and SKI IRBs, collaboratively developed assessments, supervised 3 unpaid Occupational Therapy graduate students, led analysis and final report of Phase I. 300 hours. William Durfee, Ph.D., Associate Professor, Department of Mechanical Engineering and the Biomedical Engineering Institute University of Minnesota - oversaw technical aspects of the Phase I program, supervised the Engineering graduate research assistant, collaborated on analysis and final report. Durfee will take over as project P.I. for Phase II. 150 hours. Elin Schold Davis, OTR/L, CDRS, Sister Kenny Institute (SKI) with extensive clinical expertise in the assessment and treatment of individuals with cognitive disabilities – Served as lead occupational therapist on the project, oversaw all subject scheduling and coordination between SKI and Courage Center, responsible for or oversaw all data collection and preliminary data management, contributed to study design and collaborated on data analysis. 550 hours.
D. EXPERIMENT DESIGN AND METHODSOverviewThe work plan for Phase II entails updating the hardware and software of STISIM Drive based upon what was learned during Phase I (Aim 1), and then using the updated device in a series of targeted clinical experiments to validate the simulator (Aim 2). A pilot self-awareness of driving ability study will be conducted to explore the impact of simulator driving with feedback on clients with brain injury and cognitive deficit (Aim 3).
Task 1: Simulator improvements During Phase II, STISIM Drive will undergo a number of changes to its hardware and software in order to improve its capabilities and to make it a flexible and easy to use tool in a clinical environment. The planned changes are based upon the results of Phase I where we identified strengths and weaknesses of the simulator hardware and software. Addressing deficiencies will produce a state-of-the-art simulator that provides higher fidelity, better face validity and easier user interaction especially within non-technical clinical environments.
Task 1.1: Increase realism (Aim 1.1, Months 1-6)Hardware and graphicsSTISIM Drive computer hardware and graphics cards will be updated to reflect current state-of-the-art in high-end Windows Pentium systems which means better performance for less cost. Under separate funding, the software models of cars, people and buildings were updated. New models are high resolution and include texture mapping, greatly increasing their realism. Improvements will be made to the primary and secondary car controls to increase the sense of realism. The steering wheel will be equipped with mechanical and software limit stops to prevent the torque motor from spinning the wheel should anything go wrong with the computer, thus eliminating a concern noted in Phase I. The steering wheel will also have a wider range of tilt adjustment. To improve braking feel, a nonlinear return spring will be added to the brake pedal, and the simulated braking system dynamics adjusted accordingly. Audio cues will be added to the turn signals and their engagement and automatic return to neutral position behavior will be closer to turn signals in real cars. A real speedometer will be added to the console, replacing the current on-screen bar graph. A real key that turns to start the car will be added. Capability for automated, synchronized voice-overs will be added to allow the experimenter to pre-program automatic voice cues for the driver (e.g. “At the next light, turn right”). This will ensure that each subject receives consistent instructions and allows a simulator test to be conducted by a single researcher.
Page 48
Principal Investigator/Program Director (Last, first, middle): DURFEE, WILLIAM K
Scenario realismSTISIM Drive allows one to create complex driving events, but the current version has deficiencies that cause it to behave erratically and unrealistically for certain driving challenges involving other traffic and pedestrians. For example, other vehicles in the roadway scene can be programmed to accelerate, decelerate, and change lanes, however, they can interact with the driver in unplanned ways if the driven vehicle behaves unexpectedly. In Phase II, the underlying logic of STISIM Drive vehicle and pedestrian objects will be upgraded to improve their realism. STI has been working with TWOPAS, a program used to simulate traffic flow (St. John and Harwood, 1986), for combining vehicle dynamics with proper driving behavior. We will incorporate components of the TWOPAS software into STISIM Drive as an initial step for upgrading the capabilities of roadway objects. In addition, we will include the capability to turn the intelligence of individual objects off so that critical driving events can be triggered reliably. This will fix a problem we had in Phase I where the driven vehicle would sometimes cross an intersection before an autonomous cross-traffic vehicle had time to get there.
Task 1.2: Improve user interface (Aim 1.2, Months 1-6)In the past, STI sold STISIM Drive to research organizations where there has always been easy access to the technical expertise required to create and maintain custom driving scenarios and perform data analysis. Because the overall objective of this project is to move STISIM Drive into new markets and sell the product to rehabilitation clinics, it is important that STISIM Drive be easy to use by therapists who may not have technical expertise. The user interface will be modified based upon field observation and depth interviews (Ulrich 2000) with the clinicians and therapists who will use the simulator during Phase II. The report generation capability of STISIM Drive will be modified to create summary records of driving performance that are clinically meaningful for rehabilitation, easily understood by the clinician, and available immediately after a simulator run. To handle the data flow specific to the Phase II project, software pre-processing routines will be written to format STISIM Drive driving data in a manner that makes it easy to analyze by standard statistical processing programs.
Another improvement will be to add a playback mode that allows the clinician to replay a simulator drive. Patients with cognitive disabilities often disagree with on-road and simulator assessments of their driving. The ability to replay a driver’s run provides a powerful tool for convincing the driver that they did indeed make the referenced mistakes. In addition, the replay feature can be used as a teaching tool where mistakes can be shown and discussed and then proper driving procedures explained. In order for the playback mode to be an effective tool several features including different selectable roadway views (driver eye point, birds eye, etc.) will be required as well as the capability to fast forward, reverse and pause the simulation playback. The ability to load older saved simulation runs will be added so that a driver’s performance can be documented over time. These new capabilities will be used in the self-awareness study described below.
Task 1.3: Create simulator scenario (Aim 1.3, Months 1-4)Based on what we learned from Phase I, a new, single driving scenario will be created for use in all experiments. The scenario will take approximately 40 minutes to drive at the posted speed limit and will present the driver with a variety of demands. The scenario will be designed by the human factors consultant and implemented by Systems Technology, all in consultation with the project team.
During the first 20 minutes of the scenario, drivers will encounter low-level driving demands that are representative of vehicle control and response to signals and traffic typical to on-road driving evaluations. The first 20 minutes will match the route selected for the on-road experiments, to be conducted at the Courage Center, located in Golden Valley, Minnesota, a residential suburb of Minneapolis. The scenario will match on (a) proportional distance traveled on each road segment, (b) number and type of turns, (c) posted speed limits for each segment, (d) number of lanes, lane widths and lane markings, (e) number and type of traffic control signals and signs, (f) approximate topographic matching of hills and curves,
Page 49
Principal Investigator/Program Director (Last, first, middle): DURFEE, WILLIAM K
(g) approximate traffic density, speed and vehicle mix, (h) generic matching of residential and commercial neighborhoods. The match between simulator and on-road will not have exact face validity (e.g. buildings in the simulator will not look exactly like buildings for the on-road), but will have functional validity. "Functional validity" means that essential driving characteristics will be matched. From Phase I we learned that the overall distance driven on the simulator must be shorter than the on-road because subjects tend to feel tired in the simulator long before driving a similar, real-world route, hence we will match distance proportionally.
The second 20 minutes of the scenario will contain a set of challenging events involving other traffic and pedestrians that will require significantly greater cognitive demands to drive successfully. There is broad agreement in the literature about the types of driving situations that require rapid decision-making. Such conditions, especially when superimposed upon situations in which stress or uncertainty is present, are known to be particularly difficult for persons with cognitive impairment. This portion of the scenario will be developed to place participants in cognitively challenging, but realistic situations that are impossible to script and unsafe to perform on a real road. Our Phase I data suggests that these more challenging events are better able to distinguish between brain injured and control subjects. We also learned from Phase I that the challenging events need to be chosen and scripted carefully to reveal different behaviors among drives, and need to generate data appropriate for analyzing driving performance during the event. We anticipate including five challenging events during the 20 minute drive, spaced appropriately so that they appear natural. The types of events we will choose from include the following: (a) gap acceptance during a left-hand turn at an unsigned intersection, (b) distracters such as a construction site, (c) passing a slow-moving vehicle on a two-lane road, (d) responding to a vehicle making a U-turn in front of the driver, (e) an on-coming car suddenly pulling out to pass a larger vehicle, generating a head-on collision possibility, (f) a car running a red light in front of the driver generating a side collision possibility, (g) a child or a dog suddenly running into the roadway from behind a parked car. The specific events and associated driving performance indicators (e.g. timing of brake and wheel maneuvers, time to collision, distance before passing) will be determined during the early stages of the project when the final scenario is designed.
Data collection sections will be inserted into the scenario to collect steady-state speed and lane deviation information. One straight and two curved roadway sections (one left, one right) will be part of the first half drive and then repeated in the second half. From the Phase I study, we learned that the data collection segments must have no artifacts of previous or future driving events that might contaminate the machine-collected data. The data collection sections will be designed first, and all other simulation scenery and ambient events will be constructed around them. This will be done while still meeting the constraint of matching the on-road route for the first half of the scenario.
In addition to the main scenario, a familiarization scenario will be generated for use in acclimating subjects to the simulator. The familiarization route will start with a straight, empty road and then gradually add turns, intersections, signage and other traffic. It will take approximately 10 minutes to complete when driving at the posted limit. Familiarization scenarios can reduce incidence of simulator sickness and our inclusion of it in Phase I may help explain why our incidence of sickness was lower than those published for other driving simulators.
Task 2 Develop data collection methods for simulator runs (Aim 2, Months 4-6)STISIM Drive can record a complete history of driving including continuous-time location, speed and lane deviation data, and the timing history of primary (wheel/gas/brake) and secondary (turn signals/horn/…) control activation. Data collection procedures will be defined for each driving event as well as for the continuous-time data collection sections of the scenario.
Three categories of quantitative data are automatically collected by STISIM Drive during the drive and are available for data analysis. Data in the first category comes from continuous speed and lane position recording during the four steady-state data collection sections with simple straight and curved roadways.
Page 50
Principal Investigator/Program Director (Last, first, middle): DURFEE, WILLIAM K
The raw data is processed into three indicators of driving performance: (1) mean speed normalized to the posted speed limit, (2) standard deviation of speed normalized to the posted speed, (3) mean lane position normalized to the neutral position, and (4) standard deviation of lane position to detect weaving. The indicators are kept separate across the four segments so that learning effects during the drive can be monitored. The second data category contains discrete event information including number of times the driver ran stop signs or red lights, the number of turns missed, the number of times the driver ran off the road, and the number of times the driver crashed into another vehicle. The third category contains critical timing and distance parameters from the driving challenges described in Task 1.3. These will be finalized as part of the Phase II project.
Subjective information will be recorded by the researcher and will include simple rating scales for driving events in both halves of the simulator run. The "Drive Log" (see Appendix for Phase I version) will be revised based on what we learned from Phase I, and implemented electronically with a custom Palm Pilot program which should simplify data entry and analysis.
Task 3 Develop on-road route and on-road data acquisition instruments (Aim 2.1, Months 1-4)The concurrent validity test requires on-road tests that match the first half of the simulator run and that can generate subjective and objective performance metrics. As discussed above, the on-road route will originate from the Courage Center and will include a mix of normal driving challenges. In Phase I we used the same route used for normal driving evaluations by the Courage Center driving service and learned this was not optimal for matching to the simulator. For Phase II we will carefully select a route that can be matched to the simulator run.
Several types of data will be collected from the on-road tests. We do not have the ability to match all of the rich data produced by the simulator because we are not at liberty (nor have the budget) to fully instrument the real car. We will, however, partially instrument the car to provide quantitative information. A laptop running a custom Visual Basic application will be used to collect information from a consumer model GPS unit and from a digital signal created by tapping off the center rear brake light to generate a brake timing signal. In addition, a video camcorder will be fixed in the rear seat and pointed at the road ahead to create a visual record of the drive. The brake timing signal will be fed into one audio channel of the camcorder to synchronize the brake and visual information. The other audio channel will record a timing signal generated by a 1.0 s clock on the laptop. Ordinary GPS units provide location information with long term accuracy of about 15 m (RMS), but have much better short term accuracy and can generate speed information at 1 s updates with an accuracy of about 0.1 mph. (Higher accuracy GPS units are much more expensive or require access to WAAS signals that are erratic in Minnesota.) The route will be pre-mapped to establish GPS coordinates of turns, signage and the start and end of data collection segments. The GPS unit will be tied to the laptop through the serial port and will generate data streams of location and speed information during the drive. The VB program can then generate average speed during the steady-state data collection sections by automatically starting and stopping a clock at the beginning and end of the section which it can detect from the GPS location data. Speed deviation can be determined from the GPS speed information. Distance from a stop sign and speed when the brakes are applied in response to a stop sign can be analyzed by using the GPS speed data and manual analysis of the video data to determine the distance to stop sign which are synchronized through the brake and clock timing signals. Thus, with relatively simple instrumentation, we will be able to generate some quantitative measures of driving that can be directly compared to data from the simulator run. All instrumentation will be fully tested and verified for accuracy before experiments with subjects are started. The instrumentation system and data collection programs will be developed by the University of Minnesota team and is similar to what this team has developed in the past for other research projects.
Task 4: Clinical trials to establish simulator validity (Aim 2) General protocol for simulator sessions
Page 51
Principal Investigator/Program Director (Last, first, middle): DURFEE, WILLIAM K
The four research questions that will be addressed in the clinical trials are: (1) concurrent validity, (2) test-retest reliability, (3) discriminant validity, and (4) client face validity. This section describes the experimental protocol for simulator runs that is common to all four research questions.
The study requires brain-injured subjects with mild to moderate cognitive impairments and non-disabled, matched by age and sex to impaired subjects. (Details on human subjects, including inclusion/exclusion criteria can be found in Section E.) Prior to conducting an experimental session, subjects are pre-screened by telephone. Cognitive level is determined by administering the Neurobehavioral Cognitive Status Examination (COGNISTAT, although sometimes referred to as NCSE) instrument from The Northern California Neurobehavioral Group, Inc. (APA, 2000; Cammermeyer and Evans, 1988). We chose the Cognistat test over the MiniMental Status Exam (MMSE) because the MMSE has a significantly higher incidence of false-negatives (ie rating patients as normal when they have cognitive deficits) (Schwamm, van Dyke, Kiernan, Merrin, Mueller, 1987). We exclude the language component (language skills are not related to driving ability) and score subjects on the 8 remaining COGNISTAT categories: level of consciousness, orientation, attention, constructions, memory, calculations, similarities reasoning and judgment reasoning. Subjects also are given the Trails A and B paper and pencil test from the Halstead-Reitan Neuropsychological Battery. These are tests of psycho-motor skills that measure ability to connect a sequence of numbered and lettered circles while being timed (Reitan, 1958; Grant and Adams, 1996), and can be more discriminating than the COGNISTAT. To control for motor impairments, subjects will undergo a Dynavision test (www.dynavision2000.com) to measure upper limb reaction time, and a brake pedal response test on STISIM Drive to measure lower limb reaction time. Visual attention and visual processing speed will be measured by the Useful Field of View (UFOV) test (Ball & Owsley, 1993). The UFOV is a computer administered, computer scored test that determines the size of a driver's perceptual window and has been used to identify at-risk drivers among older adults (Owsley et al, 1998). All subjects, including the non-disabled, will be assessed using COGNISTAT, Trails A&B, reaction time and UFOV tests. Scores from these tests will be used in the data analysis for several of the clinical research questions addressed by the study.
Prior to the simulator drive, the Simulator Sickness Questionnaire (Kennedy, 1993) is administered. The SSQ is a multi-symptom questionnaire (see Appendix) where 16 effects such as sweating and nausea are rated on a 4-point scale and a composite score is calculated based upon the results. Pre- and post-simulator experience SSQ scores are compared to determine whether the simulator caused driver sickness. The SSQ is rapidly becoming the standard for determining simulator sickness and has been normed on thousands of flight simulator experiences.
Subjects are then seated in the simulator and the seat and steering wheel adjusted to a comfortable driving position. The researcher orients the subject to the physical controls of the machine, then starts the subject on the familiarization scenario. The researcher guides the subject through the route offering feedback as required to maximize the subject’s comfort with the simulator. The familiarization route may be stopped and started several times, and can be rerun as needed until the subject expresses a basic familiarity and readiness to continue with the main, data collection scenario. In Phase I, the familiarization process took 10 to 15 minutes.
When ready, the subject drives the main scenario. Automatic voice prompts are provided by STISIM Drive instructing the subject where to turn. During the drive, the researcher silently records observed driving performance on the Drive Log. After completing the first half of the scenario, which contains simple driving challenges and takes about 20 minutes, the subject is invited to rest. During the rest period, no feedback on driving performance is provided to the subject. The subject then completes the second half of the scenario containing complex driving challenges that takes another 20 minutes to complete. Simulations are taken to completion unless the subject can’t finish or there is a major simulation error. Immediately following the simulated drive, the SSQ is administered again to determine whether driving on STISIM Drive caused the subject to feel sick. The researcher fills out the Driver Rating Form (see Appendix), which includes assessing behavioral driving skills and entering a Global Driving Score (GDS)
Page 52
Principal Investigator/Program Director (Last, first, middle): DURFEE, WILLIAM K
for the run. The GDS is a 3-point scale where 0 means unsafe to drive, 1 means marginal and 2 means safe to drive. This type of scale is commonly used in traditional driver rehabilitation and testing programs. All research staff in all clinical centers who will be scoring drives will be instructed on how to anchor the GDS scale. Finally, the Driver Face Validity Questionnaire (see Appendix) is given to assess whether the subject viewed STISIM Drive as a valid representation of their driving ability and to draw out what specific aspects of the simulation undermined or supported the perceived validity. At the conclusion of the session, the subject is thanked and dismissed.
Task 4.1: Concurrent validity experiment (Aim 2.1, Months 8-22)The purpose of the concurrent validity experiment is to determine if driving performance on the simulator is similar to driving performance in a real car. On road and simulator experiments will be performed at the Courage Center with the on-road test under the supervision of the Courage Center professional driving evaluation staff. It is important to note, however, that the on-road tests are not tied to licensing nor to formal driving evaluation process for the subject, and indeed the on-road route will be especially created for the study. The length of the on-road drive will be approximately 40 minutes if all traffic signs and signals are obeyed.
Hypothesis: There is no difference between the assessment of driving performance based upon simulator drives and the assessment of driving performance based upon matched, on-road drives.
Thirty subjects with mild cognitive impairment will participate in the experiment. Non-impaired subjects will not be used because we are only interested in concurrent validity for impaired subjects. Subjects will perform the standard simulator protocol and will complete an on-road drive supervised by a professional driving evaluator. The order of the two experiment sessions will be counterbalanced across subjects and spaced by one to seven days. For any one subject, the researcher who evaluates the simulation drive will not be the same researcher who evaluates the on-road drive.
The standard Courage Center pre-driving assessment is performed prior to the on-road session to check that vision, visual information processing, physical strength and coordination, reaction time and cognitive functioning of the subject is appropriate for a safe, on-road evaluation session. During the drive, the professional driving evaluator sits in the front passenger seat of the dual control vehicle and provides route instructions keyed to landmarks and read from a prepared script to avoid bias. Deviations from the script are permitted only if the evaluator senses conditions where safety might be compromised. The researcher sits in the back seat and records observed driver activity on the Drive Log (implemented on a Palm Pilot), exactly as done in the simulation run. Missed turns and signals are also recorded in the Drive Log. During the drive, GPS location and velocity data and braking event data is logged on the laptop computer while a camcorder logs a visual record of the drive. These instruments are also manipulated by the researcher from the rear seat. Following the drive, the professional driving evaluator completes the Courage Center Driving Assessment Summary Form that includes assigning a grade of Pass, Pass with Restrictions or Fail for the subject. Independently the researcher fills out the Driver Rating Form and assigns a GDS, just as with the simulator run. The researcher then conducts the Face Validity interview with the driver. The Simulator Sickness Questionnaire is administered before and after the drive as a check to see if the subject is prone to sickness when driving real cars.
The critical subjective score to compare between on-road and simulator runs is the GDS. The kappa statistic (Cohen, 1960; Portney and Watkins, 1993), a measure of agreement corrected for chance will be used to analyze the GDS scores. Mean speed and deviation of speed parameters will be compared for straight and curved road segments. Missed turns and signals will be compared. Braking and speed behavior at stop signs will be compared using the video, GPS and brake timing data as described above. Along with comparison measures, we are interested in seeing if any of the simulator driving scores or cognitive test scores (COGNISTAT, Trails A&B, UFOV) correlate to the driving test score. With our protocol, we will only be able to probe for model fits; a future study is required to test the model's
Page 53
Principal Investigator/Program Director (Last, first, middle): DURFEE, WILLIAM K
prediction powers. Several methods will be used to develop exploratory models including logistic regression, correlation and analysis of variance.
Task 4.2: Test-retest reliability experiment (Aim 2.2, Months 8-22)The purpose of the test-retest reliability is to determine if driving performance on the simulator is stable and consistent, and therefore whether a clinician can regard changes seen in simulator driving performance as reflecting true changes in the client rather than simply random effects.
Hypothesis: The qualitative and quantitative driving performance indicators resulting from a simulator run do not change with repeated simulator drives.
Twenty-five subjects with stable, mild to moderate cognitive impairments and fifteen non-disabled subjects will participate in this experiment. Subjects will perform the standard simulator protocol described above, and then will return for a second simulator run after a two week interval. All quantitative and qualitative data are used in the analysis. Paired t-tests are used on all driving scores to check for individual variability. The intraclass correlation coefficient (ICC) will be used to check agreement among all the ratings for the two simulation runs (Portney and Watkins, 1993).
Task 4.3: Discriminant validity experiment (Aim 2.3, Months 8-22)The purpose of the discriminant validity test is to determine if the simulator can differentially identify the driving ability of subjects with and without cognitive impairments, and to determine if scores on the performance indicators are consistent with other test methods used to establish the presence of a cognitive impairment. Clinically, this research question will prove whether the simulator can identify subjects whose cognitive impairment make on-road tests questionable.
Hypothesis: Driving performance measures produced by simulator runs can be used to distinguish between drivers with mild to moderate cognitive impairment and those with no cognitive impairment.
Forty subjects with stable, mild to moderate cognitive impairments and fifteen non-disabled subjects will participate in this experiment. No separate simulator runs are required for the experiment because the data comes from the set of first simulator runs used in the test-retest reliability experiments and from those who do the simulator run first in the concurrent validity experiments. For this population, driving scores are compared between the brain-injured and non-disabled subject pools. T-tests are used on each variable in the driving scores to discover which measures show the most differences between groups. A logistic regression (Hosmer and Lemeshow, 2000; Portney and Watkins, 1993) analysis will also be used to show that when a full model using all of the driving scores is incorporated, there will be a clear separation into brain-injured and non-disabled groups. Individual components of the simulator driving scores will be correlated against the COGNISTAT subsection, the Trail A&B, the reaction time and the UFOV scores to determine if there is correlation between the driving performance and scoring on traditional cognitive tests.
Task 4.4: Face validity experiment (Aim 2.4, Months 8-22)Client face validity is important to establish if STISIM Drive is to be a viable rehabilitation tool. Face validity is established if subjects believe that their performance on the driving simulator reflects their actual driving ability. For face validity, we know that simulated driving is not the same as real driving and therefore are not concerned with the "realism" of the simulator, but rather whether the simulator offers a reasonable representation of a drivers' driving skills and abilities.
Hypothesis: Subjects driving the simulator believe that simulator driving is a valid representation of their driving ability.
Page 54
Principal Investigator/Program Director (Last, first, middle): DURFEE, WILLIAM K
Face validity will be measured using the Driver Face Validity Questionnaire (see Appendix) which is given following both simulator and on-road drives. The questions are answered on a five-point scale with opportunities for open-ended comments. Responses will be pooled across subjects and also correlated to the GDS score to see if drivers' opinions about the simulator vary with how well they performed on the drive. Comparisons will be made between on-road and simulator experiences. In addition, the data will be used by STI to make further improvements to STISIM Drive before commercialization.
Task 5 Determine if STISIM Drive causes simulator sickness (Aim 2.4, Months 8-22)Simulator Sickness Questionnaire forms will be analyzed according to the standard SSQ method and scores reported as mean +/- std dev pooled across all subjects, but also split out by impairment, by session for the test-retest subjects, and by simulator vs. on-road for the concurrent validity subjects. Scores will be compared to published SSQ scores for other driving and non-driving simulators. If a considerable fraction of subjects experiences simulator sickness, STI will have to reconsider its plans to bring STISIM Drive to market. The Phase I pilot gave no indications that sickness would be a problem.
Task 6 Self-awareness pilot study (Aim 3, Months 6-22)The purpose of the self-awareness pilot study is to determine if providing feedback during the use of a driving simulator increases a driver’s awareness of their driving ability. Self-awareness is of great clinical importance because many individuals with cognitive impairments are not able to accurately assess their own abilities and therefore are not able to exercise good judgement about when it would be appropriate to return to driving following a brain injury. If sessions on driving simulators such as STISIM Drive were part of a regular brain injury rehabilitation program, it may improve the ability of the client, his or her family and professional caregivers to make informed decisions about driving without undertaking the risk of having the client drive a real car. In the other experiments in this project, we record self-awareness before and after simulator and on-road drives, but no feedback is provided to the subject before, during or after the run on how well they did. Here, we are interested in what happens when the clinician provides active feedback to the client during the run. In particular, we are interested in seeing if that feedback affects self-awareness. For non-disabled subjects, other studies have clearly shown that feedback matters and that drivers learn from knowing their errors (Ivancic & Hesketh, 2000). This study is not tied to validation of STISIM Drive, but rather is designed to understand the therapeutic possibilities of driving simulators which in turn will help determine the value of the product in the rehabilitation market.
Feedback can take the form of verbal commentary during the run (“You missed that stop sign, you might want to pay more attention because another one is coming up in a bit”), can be delivered during a simulator pause (“Let’s pause the drive for a bit and discuss what just happened”) or after the run (“Let’s review how you did"). Feedback can also be delivered post-drive in the form of charts or graphs of driving performance (“Here is a plot of how the car moved during a straight section of the road. Do you see how much you were wobbling from side to side?”), or in replay form (“Let’s play back on the monitor what was going on when you ran into that pedestrian”). Because of the many possible variations in content, style and format of the feedback, a full, statistically validated study on the use of feedback to increase driver awareness is not possible. Instead, we will conduct a pilot study that explores a number of different behavioral (not assessment) feedback strategies to gain a sense of what might work as part of a clinical rehabilitation program. Validation of efficacy will come in a later study.
Twenty subjects with mild or moderate cognitive impairments will participate in the study. The measurement of awareness will be the Self-Awareness of Deficits Interview (SADI) (Fleming, Strong and Ashton, 1996). In addition, we will pilot a new interview instrument designed to measure self-awareness of driving performance (SADPI). A one-group pretest-posttest design will be used (Portney, 1993) with the measurement test administered before and after the simulator drive. To prevent bias, the researcher analyzing the interview data will not be the same as the researcher administering the interviews, and will not know which was given before and which after the drive. Treatment is given to all subjects and will include a selection of the feedback forms described above. In the pilot, we found that single simulator
Page 55
Principal Investigator/Program Director (Last, first, middle): DURFEE, WILLIAM K
sessions with no feedback did not have a great impact on self-awareness (Van Ert, 2002), thus we are omitting a no-treatment control group for this experiment. A future study will examine the effect of treatment dosage (feedback), including no feedback, on self-awareness.
Task 7 Project and data managementOverall project management will be the responsibility of the PI, located at the University of Minnesota (UMN). Improvements to STISIM Drive hardware, software and documentation will be done at STI under the direction of Co-Investigator Rosenthal. All project investigators will take part in defining and evaluating STISIM Drive improvements to ensure that the changes are user-driven. The common scenario will be developed under the direction of Mr. Wachtel and implemented by STI. The three clinical centers will conduct all human subject experiments. Final protocols will be brought before all investigators participating in the study for approval and refinement.
A software based data management scheme will be implemented (Months 1-3). Custom Excel spread sheets will be used for tracking subjects, data entry and export to SPSS for statistical processing. Other data will be imported electronically from the driving logs implemented on the Palm Pilots and from the on-road data stored on the laptop. Custom Visual Basic programs and SPSS macros will be written as needed to automate data processing. Study data collected at the clinical sites will be sent electronically to the team at UMN which will be responsible for combining and analyzing the data. Data processing will be automated as much as possible through macros and will proceed in parallel with data collection.
There will be a project kick-off meeting in Minneapolis (Month 2), attended by all key investigators. Once each month, the study coordinators at all sites will hold a meeting by teleconference to review project progress. An informal project summary report will be completed every six months. A project web site will be established for posting progress and results with password protected pages for restricted information. Other communication will be conducted by email. Public dissemination of results will be through the project web site, through presentations at professional conferences such as RESNA and professional driving meetings. The latter is extremely important for STI if STISIM Drive is to be accepted as a viable commercial rehabilitation product.
Page 56
Principal Investigator/Program Director (Last, first, middle): DURFEE, WILLIAM K
E. HUMAN SUBJECTS
Human subjects are required for the clinical trials and the pilot study on self-awareness. The process of obtaining institutional IRB approval is ongoing and will be complete before the project is funded. The primary study population is individuals with brain injury and mild to moderate cognitive impairment. The assignment of impairment status will be determined by subsection scores on the COGNISTAT assessment. Inclusion and exclusion criteria for the brain-injured subject population are listed in the following table.
Inclusion criteria:1. 21 to 65 years of age2. Dx: CVA, BI with mild to moderate cognitive impairment3. At least one of the eight subsection scores on the COGNISTAT shows a
maximum of mild impairment. (Note: lower scores indicate more impairment)
4. Three or more months post injury5. Active driver at time of accident: (drove at least.5,000 miles per year)6. Competent to give informed consent7. Expressed interest in driving as a goal8. Functional literacy in English adequate for driving (read signs, etc.)9. Deemed appropriate for a driving evaluation by their physician
Exclusion criteria:1. Dx: progressive disease process (MS, Dementia, etc)2. More than 2 severe and/or more than 4 moderate scores on the COGNISTAT
subsections. 3. Sensory or motor impairment that requires adaptive driving equipment
The test-retest and discriminant validity studies require additional non-disabled subjects matched by age and gender to subjects with impairments. The inclusion criteria for non-disabled subjects are: (1) 21-65 years of age, (2) active driver (5,000 or miles per year), and (3) functional literacy. Exclusion criteria are: (1) moving traffic violation in past 6 months, or (2) history of brain injury or motor disability. Subjects will be recruited in a one-to-one age/gender match to each impaired subject.
The numbers of subjects who will participate during the 24 month study is summarized in the following two tables with the first showing the number of subjects used at each participating institution and the second showing the number of subjects used in each study.
Page 57
Principal Investigator/Program Director (Last, first, middle): DURFEE, WILLIAM K
By InstitutionInstitution Cognitive
ImpairmentUnimpaired Notes
Courage Center 30 0 For concurrent validity and discriminant validity studies. Mild impairments. Subjects do one simulator session and one on-road session.
Nat’l Rehab Hosp 15 15 For test-retest reliability and discriminant validity studies. Mild and moderate impairments. Subjects do two simulator runs two weeks apart.
Sister Kenny 30 0 For test-retest reliability, discriminant validity, and self-awareness pilot studies. Mild and moderate impairments. Simulator runs only.
TOTALS 75 15 90 total subjects
By StudyStudy Cognitive
ImpairmentUnimpaired Notes
Concurrent validity 30 (CC) 0 1/2 do sim first, 1/2 do on-road firstTest-retest reliability
15 (NRH) + 10 (SKI)
15 (NRH) two sim sessions each
Discriminant validity, simulator
15 (CC) + 15 (NRH) +
10 (SKI)
15 (NRH) use only first sim run data from NRH pool and 1/2 of CC pool that does simulator first
Self-awareness 20 (SKI) 0 single sim session, all receive sim, playback and instructor feedback treatment
Subjects will be recruited from the in and out-patient populations of the various clinics involved in the study. Prospects will be solicited by publicizing the study to clinical staff and by posted fliers. An initial subject acceptance interview will be conducted in the clinic or by telephone. If the inclusion/exclusion criteria are satisfied, the subject will be invited to participate in the study and a schedule is determined for experimental sessions. At the first session, the study is described in more detail, the subject is given an opportunity to ask questions, and informed consent is obtained before proceeding with the experiment protocol. The study description and obtaining of consent will be done by the local site P.I. for the project, or by one of the study research staff as specified in the project IRB application at that site.
There are essentially no risks associated with driving the simulator. Some individuals experience a feeling of seasickness (simulator sickness) when driving, which can be particularly acute during the initial simulator training session if they try too many turns too quickly. Subjects who exhibit persistent simulator sickness to the point where their performance is impaired will be excused from the study. Subjects who are feeling sick may terminate their simulator drive at any time. Subjects will be asked not to drive a real car immediately following a simulation drive to ensure that sickness or other factors won't interfere with real driving.
Page 58
Principal Investigator/Program Director (Last, first, middle): DURFEE, WILLIAM K
Subjects who undergo the on-road tests at The Courage Center encounter all the normal risks of driving. An experienced Courage Center driving evaluator will be controlling the road test at all times and subjects will only be allowed to proceed with a road test upon recommendation by Courage Center driving evaluation staff. No deviations from normal Courage Center driving safety procedures will be necessary for this project.
There are no specific benefits for any of the subjects who volunteer to participate in the study. Subjects will be paid $50 per experiment session as a partial inducement to participate.
Each subject will be assigned a 4-digit number with the first digit indicating which clinic did the recruiting and testing, and the last three digits indicating a randomly assigned subject number. The organization that recruited the subject and obtained informed consent will keep a separate, confidential record which ties name, address and telephone number to subject number. In all internal and external forms, data recording sheets, computer databases, publications and discussions, subjects will be referred to only by their 4-digit number. Demographic information collected from the subjects will include date of birth, gender, date of injury (for impaired subjects) and nature of injury. Subjects will be asked to self-report their race and ethnicity in two separate questions using the definitions for race and ethnicity groups provided on the NIH web site. All data for the project will come from the experiment sessions, and all experiment sessions are only for the purpose of the research project and not for therapeutic treatment.
Protection of human subjects1. Risks to the subjectsa. Human subjects involvement and characteristics: See above section and inclusion/exclusion criteriab. Sources of materials: Data from cognitive tests, data from pre and post drive surveys, data from simulator and on-road drives. All data obtained specifically for research purposes. c. Potential risks: For simulator, risk of simulator sickness. For on-road, normal risk of being in a car accident.
2. Adequacy of protection against riska. Recruitment and informed consent: See aboveb. Protection against risk: Stopping simulator experiment if subject feels sick. Driving with certified rehab driving instructor in a dual-control car.
3. Potential benefits of the proposed research to subjects and othersThere are no direct benefits of the research to the subjects, other than the per session subject payment. Subjects with brain injury may, however, be interested in using the simulator to help understand their own driving ability, and subjects participating in the on-road experiments may be interested in seeing how they do on the road. The brain injured population as a whole may have long-range benefits from this research because the results may lead to improved methods for driving assessment.
4. Importance of the knowledge to be gainedThe objective of this project is to develop and eventually commercialize new products that will change the way driving evaluation and rehabilitation is done for those with brain injury. The risks to the subjects participating in the project are low, but the new products and methods that will result from the project may have a substantial impact on the process of driver rehabilitation.
Collaborating sitesIRB panels needing to approve the protocols exist at the following institutions involved with this project: The University of Minnesota, Abbot-Northwestern Hospital (for Sister Kenny Rehabilitation Services), and National Rehabilitation Hospital. The Courage Center does not have an IRB but its protocol will be reviewed by the University of Minnesota IRB. The University of Minnesota must approve all protocols since University employees are involved in all aspects of the project. The remaining IRB’s will only
Page 59
Principal Investigator/Program Director (Last, first, middle): DURFEE, WILLIAM K
handle those protocols being conducted at their home institution. Because the protocols vary, each institution will have a different IRB application.
Inclusion of women and inclusion of minoritiesWomen and minority subjects will be recruited for the project in approximately the same proportions that they are represented in the patient population for the respective sites. Note the unimpaired subjects will be age and gender matched to corresponding impaired subjects. We are targeting an equal number of male and female subjects. We do not expect significant sex/gender nor race/ethnicity differences in the experiment results.
The demographics of gender, race and ethnicity for each local site are provided in the tables below. The target numbers for enrollment of subjects are the total number of subjects for the site distributed according to the percentages listed in the tables. The target for each category is 50% male and 50% female.
SUBJECT DEMOGRAPHICS, SISTER KENNY PATIENT POPULATION (%)Ethnic Racial Gender
Hispanic or Latino 1 American Indian/Alaska Native 1 Male 52Not Hispanic or Latino 99 Asian 1 Female 48
Native Hawaiian or Other Pacific Islander
1
Black or African American 4White 93
SUBJECT DEMOGRAPHICS, COURAGE CENTER PATIENT POPULATION (%)Ethnic Racial Gender
Hispanic or Latino 1 American Indian/Alaska Native 1 Male 53Not Hispanic or Latino 99 Asian 2 Female 47
Native Hawaiian or Other Pacific Islander
0
Black or African American 6White 92
SUBJECT DEMOGRAPHICS, NATL REHAB HOSPITAL PATIENT POPULATION (%)Ethnic Racial Gender
Hispanic or Latino 1 American Indian/Alaska Native 0 Male 46Not Hispanic or Latino 99 Asian 2 Female 54
Native Hawaiian or Other Pacific Islander
5
Black or African American 52White 41
Inclusion of children There will be no children in this study. The age range for subjects is 25-65. We are excluding children and very young adults from this study because very young children do not drive and because Government crash data documents that young drivers (under age 25) and older drivers (age 65 and above) are significantly overinvolved in motor vehicle crashes when the data are corrected for exposure. Considerable research has been devoted in recent years to these younger and older at risk drivers. Inclusion of these two groups would add a confounding element of heterogeneity that our relatively small sample studies cannot sustain.
Data and safety monitoring plan
Page 60
Principal Investigator/Program Director (Last, first, middle): DURFEE, WILLIAM K
Data and safety monitoring will be done at two levels, first by the local site P.I. for the project, and second by the IRB at the respective institution. Should they occur, adverse events will be reported in writing to all sites involved in the project, to the local IRB responsible for the local protocol and to the University of Minnesota IRB.
F. VERTEBRATE ANIMALS --- N/A
G. LITERATURE CITATIONS
Allen, R.W. (1991). “Validation of Real-Time Man-in-the-Loop Simulation,” Proceedings: Strategic Highway Research Program and Traffic Safety on Two Continents. Gothenburg, Sweden: Swedish Road Research Institute.
Akinwuntan AE, Feys H, de Weerdt W, Pauwels J, Baten G, Strypstein E (2002). Determinants of driving after stroke. Archives of Physical Medicine and Rehabilitation, 83, 334-341
American Heart Association (1997). 1997 Heart and Stroke Statistical UpdateAmerican Psychiatric Association (APA) (2000). Handbook of Psychiatric Measures. Ball K, Owsley C. The useful field of view test: a new technique for evaluating age-related declines in
visual function. J Am Optom Assoc, 64:71-79. Brain Injury Association, Inc. (1994). Fact Sheet: Traumatic Brain InjuryBrooke, M.M., Questad, K.A., Patterson, D.R. & Valois, T.A. (1992). Driving evaluation after traumatic
brain injury. American Journal of Physical Medicine and Rehabilitation, 71(3), 177-182. Cammermeyer, M & Evans, J (1988) A brief neurobehavioral exam useful for early detection of
postoperative complications in neurosurgical patients, J Neurosci Nursing, 20(5):314-323.Carsten, O.M.J., & Gallimore, S. (1996). “The Leeds Driving Simulator: A New Tool for Research in
Driver Behaviour.” In Vision in Vehicles - V, A.G. Gale, Ed. Amsterdam: Elsevier.Casali, J.G. (1986). “Vehicular Simulation-Induced Sickness, Volume I: An Overview.” Naval Training
Systems Center Report No. NTSC-TR86-010.Cohen, J (1960). Coefficient of agreement for nominal scales. Educ. Psychol. Meas., 20:37, 1960. Cook, C.A. & Semmler, C.J. (1990). Ethical Dilemmas in Driver Reeducation. The American Journal of
Occupational Therapy, 45(6), 517-522.Ehle HT, Williams JB (1997). Off-road driving evaluations for persons with cerebral injury: A factor
analytic study of predriver and simulator testing. American Journal of Occupational Therapy, 51, 352-359.
Fiorentino DD, Parseghian Z. (1997) Time-to-collision: a sensitive measure of driver interaction with traffic in a simulated driving task. Proceedings of the Human Factors and Ergonomics Society 41st annual Meeting;1028-1031.
Fisk, G.D., Owsley, C. & Pulley, L.V. (1997). Driving After Stroke: Driving Exposure, Advice and Evaluations. Arch Phys Med Rehabil, 78,1338-1344.
Fleming JM, Strong J, Ashton R. (1996) Self-awareness of deficits in adults with traumatic brain injury: how best to measure? Brain Inj. 10(1):1-15Galski, T., Bruno, R.I., & Ehle H.T. (1992). “Driving After Cerebral Damage: A Model with Implications
for Evaluation.” American Journal of Occupational Therapy 46, 324-332.Galski, T., Ehle, H.T., & Bruno, R.L. (1990). An Assessment of Measures to Predict the Outcome of
Driving Evaluations in Patients with Cerebral Damage, Am Jnl Occup Therapy, 44 (8), 709-713.Galski T, Ehle HT, Williams B. (1997) Off-road driving evaluation for persons with cerebral injury: a
factor analytic study of predriver and simulator testing. Am J Occup Ther, 51(5):352-359.Gianutsos, R. (1994). Driving advisement with the elemental driving simulator (EDS): When less
suffices. Behavior Research Methods, Instruments & Computers 26(2), 183-186
Page 61
Principal Investigator/Program Director (Last, first, middle): DURFEE, WILLIAM K
Gouvier, W.D., Maxfield, M.W., Schweitzer, J.R., Horton, C.R., Shipp, M. Neilson, K. & Hale, P.N. (1989). Psychometric prediction of driving performance among the disabled. Arch Phys Med Rehabil 70, 745-750.
Grant, I and Adams K, eds. (1996) Neuropsychological Assessment of Neuropsychiatric Disorders, 2nd ed. Oxford University Press
Griffin, M. (1993). “The Influence of Complex Systems on Motion Sickness.” Gateway IV(1), 9-11.Hays, R.T. & Singer, M.J. (1989). Simulation Fidelity in Training System Design. New York: Springer-
Verlag.Hein, C. (1993). “Driving Simulators: Six Years of Hands-On Research at Hughes Aircraft Company.”
Proceedings, 37th Annual Meeting of the Human Factors and Ergonomics Society, Seattle, Washington, 607-611.
Hirsekorn, L and Taylor, S (1998). VR technology applications in determining fitness to drive, CyberPsychology & Behavior, 1(4):1-5.
Hosmer, D. and Lemeshow, S (2000). Applied Logistic Regression, 2nd ed., Wiley. Hunt, L.A. (1993) Evaluation and Retraining Programs for Older Drivers. Clinics in Geriatric Medicine 9
(2), 439-448.Hunt, L., Morris, J.C., Edwards, D., & Wilson, B.S. (1993). Driving Performance in Persons with Mild
Senile Dementia of the Alzheimer Type. Jnl Amer Geriatrics Soc, 41, 747-753.ITS World, Technology and Applications for Intelligent Transportation Systems Magazine, Page 14,
March 1998Ivancic K, Hesketh B (2000). Learning from errors in a driving simulation: effects on driving skill and
self-confidence. Ergonomics, 43(12):1966-1984. Katz, R.T., Golden, R.S., Butter, J., Tepper, D. Rothke, S. Holmes, J. & Sahgal, V. (1990). Driving Safely
After Brain Damage: Follow-up of Twenty-two Patients with Matched Controls. Arch Phys Med Rehabil, 71, 133-137.
Kennedy, RS & Lane, NE. (1993). Simulator sickness questionnaire: an enhanced method for quantifying simulator sickness. Int J Aviation Psych, 3(3):203-220.
Klavora P, Heslegrave RJ, Young M (2000). Driving skills in elderly persons with stroke: Comparison of two new assessment options. Archives of Physical Medicine and Rehabilitation, 81, 701-705.
Klavora, P., Gaskovski, K.M., Forsyth, R.D., Heslegrave, R.J., Young, M. & Quinn, R.P. (1995). “The effects of Dynavision rehabilitation on behind-the-wheel driving ability and selected psychomotor abilities of persons after stroke.” The American Journal of Occupational Therapy 49 (6), 534-542.
Korner-Bitensky, N., Sofer, S., Kaizer, F.,Gelinas, I. & Talbot, L. (1994). “Assessing ability to drive following an acute neurological event: are we on the right road?” Canadian Journal of Occupational Therapy (61) 3, 141-148.
Korteling JE, Kaptein NA (1996). Neuropsychological driving fitness tests for brain-damaged subjects. Archives of Physical Medicine and Rehabilitation, 77, 138-146.
Leonard, J.J. & Wierwille, W.W. (1975). “Human Performance Validation of Simulators: Theory and Experimental Validation.” Proceedings of the Human Factors Society 19th Annual Meeting, 446-456. Santa Monica, CA: HFS.
Liu, L, Miyazaki, M and Watson, M (1999). Norms and validity of the driVR: a virtual reality driving assessment for persons with head injuries, CyberPsychology & Behavior, 2(1):53-67.
Miles, M.B. & Huberman, A.M. (1994). Qualitative Data Analysis: An Expanded Sourcebook, 2nd Ed. Newbury Park, CA: S
Mussa, R., Newton, C., Matthias, J., Sadalla, E., & Burns, Elizabeth. (1996). “Simulator Evaluation of Flashing Amber/Green Signal Phasing.” Transportation Research Board Paper No. 96-0231 presented at the 75th Annual Meeting of the TRB, Washington, DC.
National Advanced Driving Simulator (NADS) Requirements, Systems Technology, Inc., TR-1256-2, July, 1991.
Nouri FM and Tinson DJ (1988). A comparison of a driving simulator and a road test in the assessment of driving ability after a stroke. Clinical Rehabilitation, 2, 99-104.
Odenheimer, G.L. (1993). Dementia and the Older Driver. Clinics in Geriatric Medicine 9 (2), 349-364.
Page 62
Principal Investigator/Program Director (Last, first, middle): DURFEE, WILLIAM K
Owsley C, Ball K, McGwin G, Sloane M, Roenker D, White M, Overley T (1998). Visual processing impairment and risk of motor vehicle crash among older adults. JAMA 279:14:1083-1088.
Padmos, P. & Milders, M.V. (1992). “Quality Criteria for Simulator Images: A Literature Review.” Human Factors 34 (6), 727-748.
Peck, R.C. & Wachtel, J.A. (1993). "New Technology for an Old Problem: A Report of a Prospective Study to Evaluate a Simulator-Based Approach to Driver Licensing.", presented at the 1993 Annual Meeting of the Transportation Research Board, Washington, DC.
Pierce, S. Legal Considerations for a Driver Rehabilitation Program. Physical Disabilities, 16(1), 1993. Pigman, J.G. & Agent, K.R. (1990). “Highway Accidents in Construction and Maintenance Zones.” In
Transportation Research Record No. 1270 - Safety Research: Accident Studies, Enforcement, EMS, Management and Simulation 1990. Washington, DC: Transportation Research Board, National Research Council.
Portney, LG & Watkins, MP (1993). Foundations of Clinical Research, Appleton & LangeRanney, T.A., Masalonis, A.J. & Simmons, L.A. (1996). “Immediate and Long-Term Effects of Glare
from Following Vehicles on Target Detection in a Driving Simulator,” Transportation Research Board Paper No. 96-1094, presented at the 75th Annual Meeting of the TRB, Washington, DC.
Rizzo, M., Reinach, S., McGhee, D., & Dawson, J. (1997). “Simulated car crashes and crash predictions in drivers with Alzheimer disease.” Archives of Neurology, 54, 545-551.
Schill, V. & Kading, W. (1990). “The Daimler Benz Driving Simulator - Research for Road Safety and Traffic Environment.” Paper presented at the International Conference on Road Safety and Traffic Environment in Europe. Gothenburg, Sweden.
Schwamm LH, van Dyke C, Kiernan RJ, Merrin EL, Mueller J (1987). the Neurobehavioral Cognitive Status Examination: Comparison with the Cognitive Capacity Screening Examination and the Mini-Mental State Examination in a neurological population. Annals of Internal Medicine, 107, 486-491.
Sprigle, S., Morris, B.O., Nowachek, G., & Karg, P.E. (1995). Assessment of the Evaluation Procedures of Drivers with Disabilities. Occup Therapy Jnl Res 15 (3), 147-164.
Srauss, A. & Corbin, J (1990). Basics of Qualitative Research: Grounded Theory Procedures and Techniques. Newbury Park, CA: Sage.
Stein, A.C., Parseghian, Z., Allen, R.W., & Haynes, J.T. (1990). “The Development of a Low-Cost Portable System for the Detection of Truck Driver Fatigue.” 34th Annual Proceedings of the Association for the Advancement of Automotive Medicine. Scottsdale, AZ: AAAM.
St. John, A.D., and Harwood, D.W. (1986). TWOPAS User's Guide, A User's Guide to TWOPAS - A Microscopic Computer Simulation Model of Traffic on Two-Lane, Two-Way Highways (Performing Organization Report No. 7533-S(6)), Washington, DC: Federal Highway Administration.
Sundet K, Goffeng L, Hofft (1995). To drive or not to drive: Neuropsychological assessment for driver's license among stroke patients. Scandinavian Journal of Psychology, 36, 47-58.
U.S. Senate (1993). “High Risk Drivers Act of 1993. Senate Bill No. S-738. Congressional Record, S4400-S4404.
Van Ert, J, "Self-Awareness of Deficits for Person's with Brain Injury: The Effects of a Driving Simulator versus On-Road Testing", Plan B Masters project report, Program in Occupational Therapy, University of Minnesota, 2002.
Wachtel, J. (1991). “Are we Training Operators Upside Down?” Proceedings of the Ninth Symposium on the Training of Nuclear Facility Personnel. Oak Ridge, TN: Oak Ridge National Laboratory, Report No. CONF-9104135.
Wachtel, J. (1995). "A Brief History of Driving Simulators." TR News, Number 179, July-August, pp. 26-27,45.
Wachtel, J.A. (1993). “Driving Simulators - Serious Tools or Frivolous Toys? - Overview of a Symposium and Panel Discussion.” Proceedings, 37th Annual Meeting of the Human Factors and Ergonomics Society, Seattle, Washington, 600-601, 622-624.
Wachtel, J.A. (1996). “Applications of Appropriate Simulator Technology for Driver Training, Licensing and Assessment.” In Vision in Vehicles - V, A.G. Gale, Ed. Amsterdam: Elsevier.
Page 63
Principal Investigator/Program Director (Last, first, middle): DURFEE, WILLIAM K
Wachtel, J. & Berner, J. (1996). "A Comprehensive Evaluation of a Low Cost Driving Simulator for Use in the Training of Police Officers." Paper presented at the International Conference on Traffic and Transport Psychology, Valencia, Spain.
Wald JL, Liu L, Reil S (2000). Concurrent validity of a virtual reality driving assessment for persons with brain injury. Cyberpsychology & Behavior, 3, 643-654.
Watson GS. (1997) Simulator adaptation in a high fidelity driving simulator as a function of scenario intensity and motion cueing. Presented at Driving Simulation Conference, Paris, France: ETNA; On line at http://www.ccad.uiowa.edu/media/docs/arcpapers/271.pdf
Publications and presentations resulting from Phase I1. Jodi Balik, “Driving Simulators for Individuals with Cognitive Impairments”, Masters Thesis,
Department of Biomedical Engineering University of Minnesota, December 1999.2. Schold Davis, E. "Driving assessment and treatment using a low-cost simulator", Lecture series
sponsored by the Singapore Ministry of Health, Singapore, March 2001, , 3. Schold Davis, ES "Pre-Driving Assessment in the Acute and Rehabilitation Setting", Allina
Education, Minneapolis, Minnesota, 2000, 2001.4. Wachtel, J., Durfee, W.K., Rosenthal, T.J., Schold-Davis, E., and Stern, E.B. Evaluation of a Low-
Cost, PC-Based Driving Simulator to Assess Persons with Cognitive Impairments Due to Brain Injury. Proceedings of the First International Driving Symposium on Human Factors in Driver Assessment, Training and Vehicle Design. Aspen, CO. pp.293-294., 2001
5. Stern, EB, Wachtel, J, Durfee, WK, Rosenthal, TJ and Schold Davis, E, Low-Cost Simulation as a Tool to Assess the Driving Ability of Persons with Cognitive Impairments from Brain Injury. In P.T. McCabe (Ed.), Contemporary Ergonomics 2000, London: Taylor & Francis, in press, 2002.
6. Stern, E, E. Schold Davis, W Durfee, T Rosenthal, and J Wachtel, "Driving simulation with brain injured individuals: funding, process, and findings". American Occupational Therapy Association Annual Conference, Orlando, 2002.
7. Van Ert, J, "Self-Awareness of Deficits for Person's with Brain Injury: The Effects of a Driving Simulator versus On-Road Testing", Plan B Masters project report, Program in Occupational Therapy, University of Minnesota, 2002.
H. CONTRACTUAL ARRANGEMENTS
University of MinnesotaThe University of Minnesota is the primary research institution for this STTR project, is a Land Grant university with world-renowned engineering and medical schools, and is one of the largest academic research organizations in the country. The University will provide the research and project management expertise for the project. P.I. Durfee is with the Department of Mechanical Engineering and has a long history of collaborative research in assistive technology. Co-Investigator Stern is with the Occupational Therapy Program in the Department of Physical Medicine and Rehabilitation and has extensive experience in rehabilitation treatment research. Both have collaborated with Sister Kenny and the Courage Center. Dr. Stern was P.I. on the Phase I grant with Durfee as a Co-Investigator. For Phase II, the roles are reversed. The University will also provide a Graduate Research Assistant to manage and coordinate much of the data collection and provide technical backup support to the three STISIM Drive simulators located in Minneapolis.
Sister Kenny Rehabilitation ServicesSKRS is the physical rehabilitation division of Abbot Northwestern Hospital, a 776 bed acute hospital that in turn is part of the Allina Health System. Allina is one of the largest integrated health care systems in the Midwest comprising of doctors, hospitals and health plans. Sister Kenny Rehabilitation Services
Page 64
Principal Investigator/Program Director (Last, first, middle): DURFEE, WILLIAM K
offers comprehensive rehabilitation services, including physical medicine, rehabilitation nursing, physical therapy, occupational therapy, speech/language pathology, audiology, social services, neuropsychological services, therapeutic recreation and rehabilitation technologies for individuals with brain injury, stroke, spinal cord injury and other disabling conditions. SKRS annually serves over 500 inpatients and 13,000 outpatients. The Brain Injury Clinic at SKRS is the only program of its kind in the Twin Cities area.
SKRS was a key collaborator in the Phase I project, and in Phase II will be responsible for implementing the self-awareness study.
Courage CenterCourage Center is a national rehabilitation and resource center for people with physical disabilities, brain injuries, speech or vision impairments, or hearing loss. It offers comprehensive, life long services to people of all ages, from infants to seniors. Courage’s wide-ranging programming, which include physical rehabilitation, community living skills, vocational training, camping and recreational programs, mental health and family support services, is designed to empower people with disabilities to reach for their full potential in every aspect of life. Courage serves over 16,000 individuals on an annual basis, with over 5,000 served in the medical rehabilitation areas. Courage provides more than 70 different programs at five primary locations, Golden Valley, Courage St. Croix at Stillwater, Courage Duluth, Camp Courage at Annandale, and Courage North near Bemidji, Minnesota. Courage also operates a 64 bed residential program for persons with a wide range of disability, including brain injury, spinal cord injury, congenital disabilities. Through the Residential Program Courage residents learn skills to transition from initial physical rehabilitation to community or independent living. Staff at Courage include physical therapists, occupational therapists, speech-language pathologists, physicians specializing in physical medicine and rehabilitation, nurses, psychologists, a neuropsychologist, a psychiatrist, behavior specialists, recreational therapists, driver evaluators, independent living specialists, vocational evaluators and counselors, and support services. Courage employs approximately 400 full time equivalents in staffing, and approximately 1000 employees.
Courage offers a unique driver assessment and training program serving 630 individuals per year. The comprehensive assessment is completed by an occupational therapist and an experienced driver evaluator. The components of the assessment include a clinical assessment (vision testing, reaction time screening, memory, problem solving, upper and lower body strength/coordination) and an on-the-road in-vehicle assessment. Individuals served in the Driver Assessment Program range in age from 14-91 years and represent a variety of disabilities, (brain injury, spinal cord injury, post-stroke, cerebral palsy, etc.) Courage has four vehicles with adaptations for in-vehicle evaluation and training, and provides recommendations for vehicle adaptations and community resources to consumers.
In Phase I, Courage Center was contracted to provide the on-road driving evaluations for the 10 pilot subjects. For Phase II, Courage Center becomes a key collaborator and will implement the concurrent validity study as described in the proposal and will be responsible for all on-road testing.
National Rehabilitation HospitalThe National Rehabilitation Hospital is part of the MedStar Health System that comprises seven hospitals and numerous clinics and skilled nursing facilities serving the Baltimore-Washington corridor. NRH is a free-standing, 128-bed medical rehabilitation hospital for individuals 12 and over. Comprehensive specialty programs are offered in spinal cord injury, post-polio, stroke, arthritis, musculoskeletal conditions, amputation, brain injury and other conditions. Clinical facilities include a simulated real-world environment known as Independence Square, which includes an automobile for practice transfers and simple reaction time measurements. A network of 18 outpatient sites continues to provide rehabilitation services to patients after discharge. NRH also has a formal research and training affiliation with the Clinical Center at the National Institutes of Health. The MedStar Research Institute, MRI, provides centralized administrative support for the 60+ active researchers in the MedStar system. NRH is home to two, soon to be three, externally funded research centers. One is the Assistive Technology
Page 65
Principal Investigator/Program Director (Last, first, middle): DURFEE, WILLIAM K
Research Center funded by the Medical Research and Materiel command of the U.S. Army. The other is the inaugural five-year funding of the NIDRR-supported Rehabilitation Engineering Research Center on Telerehabilitation. Their combined budget is $10M over the five-year life of the grants. Both of these center grants are based in the NRH Rehabilitation Engineering Service, with other research and clinical staff from all other departments directly involved in R&D projects. Rehab Engineering is staffed by ten scientists and research engineers plus an operations manager, secretary and engineering technologist. The Service delivers assistive technology assessment, design and selection to NRH inpatients and participates in the seating and mobility program. Lab and clinical space currently occupies 2000 square feet with planning for 50% expansion underway and funding in place. The Brain Injury Rehabilitation Program at NRH is designed for persons who have sustained head trauma as well as non-progressive non-traumatic brain insults and disease. Services are directed by board-certified neurologists, psychologists, therapists and physiatrists. The Program addresses issues including behavioral management, neuropsychological adaptation, environmental structuring, cognitive and communication skills, and skills of daily living and working. NRH has a formal driver assessment and training program that includes two adapted vehicles.
NRH will be responsible for simulator testing using impaired and non-impaired subjects as described in the proposal.
Letters of agreement from the three clinical collaborators appear at the end of this application.
I. CONSULTANTS
Mr. Jerry Wachtel, President and Principal Scientist of The Veridian Group, and a Consulting Scientist at STI, is an expert in human factors and specializes in human machine interactions. He has extensive experience with driver training and assessment and with driving simulators. Mr. Wachtel, a Board Certified Professional Ergonomist, was instrumental in the conceptualization and development of a driving simulator and associated training protocol for law-enforcement officers in the state of California that now is a commercially successful system in use by law enforcement agencies nationwide. Mr. Wachtel was a key member of the Phase I project team. In Phase II, he will work with STI to refine the simulator and with the entire project team to develop and refine the new scenarios for the driving simulator.
Dr. Bruce Center, Ph.D., will provide statistical expertise to the project as a consultant. Dr. Center is with the Family Practice and Community Health Department at the University Medical School and has extensive experience in biostatistics. Dr. Center will review and fine-tune the experiment design and data analysis procedures prior to commencing data collection, and will review the data during analysis and provide suggestions on appropriate methods for analysis and display of the results.
Letters of agreement from the two consultants appear at the end of this application. Biosketches for the two consultants appear with the rest of the biosketches that start on page 10 of the application.
Page 66
Principal Investigator/Program Director (Last, first, middle): DURFEE, WILLIAM K
J. PRODUCT DEVELOPMENT PLAN
1. Company information
STI is a research and development company (classified as a Small Business) that has been in continuous existence since 1957. STI has a staff of 27 engineers and support personnel. Over 80% of the engineers have post-graduate degrees. STI’s core area of expertise is in dynamic systems modeling and analysis including areas related to human dynamics and behavior. This expertise was developed initially through Federal research funding for aerospace applications. The basic precepts of dynamic systems modeling and analysis developed for these aerospace applications were soon extended to other vehicles and to the investigation of human dynamic behavior as well as Human Factors related to the interface between man and machine. Over its history, STI has completed over 400 prime Federal Government contracts that have resulted in over 700 technical publications including scientific papers and reports. This work has been with several branches of the Federal Government including the Departments of Defense, Transportation, Agriculture, and the National Institutes of Health. This extensive experience has given STI a corporate character that strives to obtain fundamental insight into technical problems and issues. This experience and knowledge also provided the necessary background that has allowed STI to successfully commercialize technologies developed through its research work.
In 2000, STI’s revenues stemmed from Federal funding sources (approximately 30%), non-Federal funding (Industry Consulting - approximately 25%), and commercial products (approximately 45%). As this breakdown indicates, STI has been able to successfully convert technologies to commercial products. The bulk of STI’s commercial product revenues in the past 10 years have come from the sale of low-cost, PC-based interactive driving and parachute maneuvering simulations. Other products include control systems analysis software used by industry and educational institutions and a comprehensive vehicle and tire dynamic model used by the Government, Industry, and the Legal Profession. The success of the simulation products is solely due to the incorporation of features and capabilities based on STI’s knowledge and experience in simulation-related human factors issues. In the past 10 years, STI has sold over 100 versions of the driving simulator and over 80 versions of the parachute maneuvering simulators worldwide. The market for driving simulators has been with both Government and Commercial organizations while the market for the parachute-maneuvering simulator has been in military and entertainment applications.
Through our commercial product sales, STI has gained considerable experience and expertise in commercial product marketing. STI’s strategy of combining product sales with sale of its technical services has also been successful with synergy being realized primarily in the combination of driving simulator sales with driver behavior studies. As this synergy requires collaboration with partners with other areas of technical expertise, this has resulted in a broadening of STI’s base of industrial and institutional alliances. In the area of products, STI conducts marketing campaigns in support of our software and low-cost simulation products that encompasses print advertising, press releases, presence at targeted conferences and exhibitions, and customized demonstrations and presentations to potential customers. STI also conducts market research when necessary to identify new markets and plan market entry strategies. STI’s simulation products have been featured in television programs and established magazines. STI also has a network of worldwide representative that market our products in other regions of the world. Approximately 20% of STI’s product sales have been outside the USA.
2. Value of STTR Project
The primary technical goal of this project is to develop and validate a PC based driving simulator for use in rehabilitation clinic driving programs. The test(s) will be administrable in the clinic without exposing the individual being assessed or the assessor to the risk of an on-road evaluation. The test(s) will be
Page 67
Principal Investigator/Program Director (Last, first, middle): DURFEE, WILLIAM K
based on an interactive driving simulator and will be a complete evaluation package that can be used to provide a prediction of the individual’s driving behavior and associated risk in actual on-road situations. The key technology objectives are to develop realistic testing (driving) scenarios and create a user-friendly tool that OT’s can easily use to create their own custom scenarios. The development of the testing scenarios will include improvements to STI’s present low-cost driving simulator technology and the development of driving scenarios with situations and events that will adequately test a subject’s ability to drive safely on the road. For this latter aspect of the work, the Human Factors knowledge and experience of STI will be combined with the clinical knowledge and experience of our partners. The primary competitive advantage of this test will stem from this scientific and clinical orientation of the development of the test from the outset. STI presently has a demonstrated competitive advantage in the sale of driving simulators, being the leading provider of low-cost driving simulators in the World. Our market has primarily been for applications involving driver behavior assessment that is the basic aim of this test. There is no direct competitor to such a test. In terms of driving simulation, there are several providers of “low-cost” driving simulators. Some such as those provided by Doron Precision, Inc., for driver training are non-interactive and of limited use in driver behavior assessment. Other manufacturers such as Imago Systems, Canada and KQ Systems in the US provide interactive driving simulators that are not as suited to driver behavior assessment as STI’s simulator, particularly in the area of driving scenario development. This is the primary reason for the success of STI’s driving simulator in the commercial marketplace.
3. Commercialization Plan
The driver competence test will be developed and marketed as a product to aid medical care providers to assess whether a patient could safely drive on the road. The test will be non-invasive and could be administered quickly. Initial marketing will be focused on the Government, specifically the Veteran’s Administration (VA) Hospitals throughout the US, and private industry, specifically medical organization with rehabilitation facilities. Some of these hospitals are already using early versions of STI’s driving simulator for the assessment and training of drivers with suspected impairments and disabilities. Discussions with care providers at these hospitals point to an increasing need for such a device due to the rapidly aging population in the US. Preliminary data from the US Census Bureau for the year 2000 indicates that approximately 27% of the US population is over the age of 50. With the aging of the population, these hospitals are seeing an increase in patients with cerebral impairments, mostly due to strokes, where a clear judgment of their fitness to drive could not be made without a driving assessment. Presently, in most hospitals, this assessment consists of a series of on-road tests with a certified driver rehabilitation specialist with its inherent risks. A driving simulator-based test would be a valuable screening device to assess whether such a patient should, or could, be taken to the next level of assessment that would be an on-road evaluation.
STI conducted a detailed survey and analysis of the driver rehabilitation and assessment market in 1996 that showed the total rehabilitation market potential in 2000 to be on the order of $45 billion with over 12,000 rehabilitation facilities (hospitals, skilled nursing facilities, etc.) in the US. A survey of 73 driver rehabilitation specialists across the US indicated that the primary need was to evaluate cognitive factors such as decision-making (97% of responses) and divided attention performance (95% of responses) and combined cognitive/psychomotor performance including driver response time (85% of responses). Thus far, STI’s market penetration into the driver rehabilitation area has been limited to a small proportion of our overall sales. The primary inhibiting factor has been the lack of a definitive test with associated normative data. The addition of a validated test with normative data will enable STI to penetrate this market more effectively. The driver rehabilitation facilities in the VA hospitals and commercial outpatient care facilities will be targeted initially. A market share of 1% of the rehabilitation facilities in the US will be the initial target. Once the technology gains acceptance though practical application, an increase in market share by over 10% per year is expected.
Page 68
Principal Investigator/Program Director (Last, first, middle): DURFEE, WILLIAM K
Marketing activities will include direct marketing to rehabilitation care facilities as well the automobile insurance industry. It is expected that the insurance industry will also be interested in this test. Modified versions of the device may also be used for driver education an research that ill allow access to an even broader market.
4. Intellectual Property Considerations
STI and its partners in this project intend to apply for patent protection for the driver assessment device and the driver assessment test methods.
K. PRIOR SBIR PHASE II AWARDS -- N/A
I. RESEARCH INSTITUTION CERTIFICATIONSee following page.