Page 1
European Journal of Engineering and Technology Vol. 3 No. 2, 2015 ISSN 2056-5860
Progressive Academic Publishing, UK Page 7 www.idpublications.org
DRYING KINETICS AND INFLUENCE ON THE CHEMICAL
CHARACTERISTICS OF DEHYDRATED OKRA (ABELMOSCHUSESCULENTUS)
USING CABINET DRYER
Famurewa J. A. V. & Olumofin, K. M.
Department of Food Science and Technology, Federal University of Technology
Akure, NIGERIA
ABSTRACT
This study investigated the drying kinetics and effects of drying on the chemical properties of
okra (Abelmoschusesculentus) using cabinet dryer. Fresh okra was sorted, cleaned and sliced
into 2.0 mm thickness with FUTA Slicer. They were spread in a thin layer in a cabinet dryer
and dried at varying temperatures of 40, 50 and 60oC until constant weights were obtained..
The resulting dried okra slices were milled into grit for further analyses. Each sample was
analyzed for proximate composition, mineral content, viscosity, anti-nutrients and anti-
oxidants. The drying data were fitted into eight models to predict a suitable one. Results
obtained showed that protein content followed a decreasing order for samples dried at 40 oC
(24.54%), 50 oC (21.20%) and 60
oC (17.28%). The crude fibre content of dried okra samples
increased significantly at (p<0.05) as shown by okra sample dried at 40oC (15.17%), samples
dried at 50oC was (12.86%), while that dried at 60
oC had (11.72%). It was also observed that
the sample dried at the temperature of 40oC had the highest values of the entire minerals
analyzed. The viscosity of okra samples dried at varying temperatures with different particle
sizes were significantly different at (p<0.05). The sample with a very fine particle size had
the highest mucilage retention property. Tannin and flavonnoid contents of the okra samples
were not significantly different from one another. β-carotene content of the dried okra grits
was decreasing with increasing temperature. The vitamin C content of the okra reduced
significantly at (p<0.05) from 0.26% to 0.02%. The samples dried at 60oC had the least
vitamin C content of (0.02%). It was concluded that drying of okra at 40 0C was better to
retain its nutritional qualities and Modified Page model was found most suitable to describe
the drying patterns within the temperature range under study.
Keywords: Okra, Drying, Models, Antioxidants, Mucilage.
INTRODUCTION
Okra; mucilaginous plant, which gives off a slippery/sticky substance when cut, is among the
fruits and vegetables which are seasonal and perishable. Okra is popular in human diet for the
vitamins and minerals they supply, their medicinal value, taste and texture especially when
fresh. The economic importance of Okra cannot be overemphasized. Okra contains
carbohydrates, proteins and vitamin C in large quantities (Aworh et al., 1980; Ene, 1995;
Brown, 1999; USDA, 2010). Okra is a rich source of many nutrients, including fiber, vitamin
B6 and folic acid (FAOSTAT, 2008). The essential and non essential amino acids that Okra
contained are comparable to that of soybean. Hence it plays a vital role in human diet
(Ononogbu, 1998 Adetuyi et al., 2011). The abundant slimy mucilage in okra binds and
inhibits the absorption of cholesterol, bile acids and toxins. It also helps alleviate the
irritation, swelling and pain in the throat associated with common cold and
cough.(Siemonsma and Kouame, 2004).
Page 2
European Journal of Engineering and Technology Vol. 3 No. 2, 2015 ISSN 2056-5860
Progressive Academic Publishing, UK Page 8 www.idpublications.org
Okra undergo spoilage shortly after harvest, leading to gross post harvest losses which posses
a great danger on Nigeria’s food security (Sam, 1999).Studies have also shown that the use of
low temperature storage is inappropriate for many crops of tropical and subtropical origin
such as okra due to its susceptibility to chilling damage resulting in discolouration and
rottening. To meet the demand during the entire year in all areas, the commodities are
preserved using different techniques and their processing may however lead to loss of some
of the characteristics which initially made them consumer delights.
The technique of drying is probably the oldest method of food preservation practiced by
mankind. The removal of moisture prevents the growth and reproduction of microorganisms
causing decay and minimizes many of the moisture meditated deterioration reaction. It brings
about substantial reduction in weight and volume minimizing packing, storage and
transportation cost and enables storability of the product under ambient temperatures
(Orishagbemi et al., 2000). The drying process not only decreases the water content of the
product, but also affects other physical and chemical properties, which will change the shape,
crispness, hardness, aroma, flavor and nutritive value of the food produce. Okra is easily
dried for later use; a little dried okra in prepared dishes produces much the same results as
does the fresh product (Sam, 1999; Eklou et al., 2006).
The concept of drying kinetic involved the use of mathematical equation to describe the
characteristic behaviors of a drying process (Chukwuma and Ozoma, 2006). One obvious
advantage of the use of kinetic models in the production and analysis of drying system lies in
saving cost and time that would otherwise have been expended on expensive experiments and
construction of pilot plants (Turner and Mujumdar, 1996).
It is of great necessity therefore to investigate and recommend the proper drying temperature
range at which nutritional, antioxidants and sensory attributes of okra will not be
compromised and to predict the drying model suitable for such temperature range.
MATERIALS AND METHODS
Samples Preparation and Drying of Okra
Fresh okra fruits (Iwo varieties) were bought at Shasha market in Akure Ondo state. The
fruits were sorted, washed with clean water and drained. They were then sliced with FUTA
slicer to 2.0mm thickness. A portion weighing 1 kg was loaded into tray and inserted into the
drying chamber of the cabinet dryer (model 85mo64 Shandom, UK) at mean air velocity of
1.68 m/s. The dryer was pre-set at 40 oC for 15 minutes before loading to allow stabilized
temperature. At intervals of 60 minutes the weight of the okra sample was being taken until
constant weight was obtained. The dried sample was milled and packaged in polythene. This
same processing operation was also repeated at temperatures of 50 and 60 oC using the same
cabinet dryer.
Analyses Carried Out
Chemical Analyses
The proximate compositions of the samples were determined following the procedures of
Association of Official Analytical Chemists AOAC (1995) method. Average of three
replications was used. The mineral compositions of the samples were determined using an
Atomic Absorption Spectrophotometer following the manufacturer’s specifications. The
viscosity and Specific gravity were determined using A.O.A.C (1990) methods. The samples
Page 3
European Journal of Engineering and Technology Vol. 3 No. 2, 2015 ISSN 2056-5860
Progressive Academic Publishing, UK Page 9 www.idpublications.org
were screened for antinutritional factors; spectrophotometric method of Brunner (1984) was
used for saponin determination, total flavonoid content was determined using the method of
Meda et al., (2005) and tannin was determined according to the method of Makker & Good-
child (1996). The determination of β-carotene was done using the spectrophotometric method
as described by Ameny and Wilson, (1997) and determination of ascorbic acid compositions
was done using the standard of AOAC (1995).
Analytical Modeling
In order to describe the drying behavior of okra under different drying conditions, thin layer
drying models were used. The simple type of drying models assumes that rate of exchange in
moisture content is proportional to the difference between moisture content and equilibrium
moisture content (EMC) of the material. Seven thin layer drying models were used (Table 1)
Table 1: Some selected thin layer drying models.
MODEL NAME REFERENCE
MR = exp(-kt) Newton Liu and BakkerArkema
(1997)
MR = exp(-ktn) Page Zhang and Litchfield (1991)
MR =a exp((-kt)n) Modified Page Overhults et al; (1973)
MR =a exp(-kt) Handerson and Pabis Handerson and Pabis (1961)
MR =a exp(-kt)+c Logarithmic Yaldiz et al; (2001)
MR =a exp(-kot)+b exp(-klt) Two term Raghavan et al; (1998)
MR = 1+at+bt2 Wangh and Sing Wang and Singh (1998)
The experimental values for moisture content were converted to moisture ratio using
Equation 3 which has been simplified to Equation 4 (Togrul and Pehlivan, 2004). These data
were fitted to the thin layer drying models of Table 1 to select the best model that can
suitably predict the drying characteristics of okra in sliced form, dried in a cabinet dryer. The
correlation coefficient (R2) was the primary criterion for selecting the best model to describe
the drying characteristics. In addition to R2, the reduced chi square (x
2), the mean bias error
(MBE) and the root mean square error (RMSE) were used as the statistics for the modeling.
They were calculated using:
----------------------------(1)
-----------------------------------------------(2)
RMSE
------------------------------(3)
MBE
------------------------------------------(4)
Page 4
European Journal of Engineering and Technology Vol. 3 No. 2, 2015 ISSN 2056-5860
Progressive Academic Publishing, UK Page 10 www.idpublications.org
where MRexpi is the experimentally observed moisture ratio, MRpredi the ith predicted
moisture ratio, N the number of observation and n the number of constants. The regression
was carried out using sigma plots 10.0 software
Validation of the established model
The established model was validated by plotting the moisture ratio against time for the
experimented and the predicted values of the established model for a each experimental run.
Statistical Analysis
Means of triplicate readings and their corresponding standard errors of mean (SEM) were
determined. The readings were subjected to Analysis of Variance (ANOVA) while means
were separated using Duncan’s Multiple Range Test. All the procedures were carried out
using the statistical package for social scientist,(SPSS) version 18.
RESULTS AND DISCUSSION
Effect of Drying on the Proximate Composition of Okra
The proximate compositions of the okra grits at varying temperatures (Table 2) showed that
the samples after being subjected to drying was significantly affected (at p<0.05). For the ash
content, which is an indication of the total mineral element according to Aleiro and Abdullahi
(2009), the samples dried at 40oC had the highest value of ash (13.47%), followed in a
decreasing order by the samples dried at 50oC (11.42%) and samples dried at 60
oC had
(11.11%). Heat processing of the okra samples at high temperature of 60oC enhanced the fat
content as it was found to be the highest value with (4.39%), when compared to other dried
samples, it was significantly higher than the other samples. Samples dried at 50oC had the
value of (3.66%), while that of 40oC was (3.33%).
Proteins are extremely important components of living cells in that they regulate metabolism,
act as structural molecules and in some products represent storage forms of carbon and
nitrogen (Kays, 1991). The protein content ranged between (17.28%) for samples dried at
60oC and (24.54%) for samples dried at 40
oC. Fresh okra samples had a protein content of
(28.00%), but after being subjected to drying, had the lowest content of (17.28%) for samples
dried at 60oC followed on an increasing order by samples dried at 50
oC,(21.20%) and
(24.54%) for samples dried at 40oC showing that processing at a higher temperature
denatures the protein.
Dietary fibers are constituents of many fruits and vegetables. Fibers are also general term for
plant cell wall components that are poorly digested by humans such as cellulose and lignin
(Ensminger et al., 1995). Though dietary fibers cannot be digested, they aid digestion (Eva,
1983). The crude fiber content of dried okra samples increased significantly (p<0.05), as
shown by okra samples dried at 40oC with (15.17%), samples dried at 50
oC was (12.86%)
while the ones dried at 60oC had the value of (11.72%). It is an indication that heat
processing of okra at a low temperature enhanced its fiber content. Current evidence also
suggests that an increase intake of dietary fiber may prevent or treat a variety of ailments
ranging from diabetes to arteriosclerosis and colon cancer (Nimenibo-Uadia, 2001).
Page 5
European Journal of Engineering and Technology Vol. 3 No. 2, 2015 ISSN 2056-5860
Progressive Academic Publishing, UK Page 11 www.idpublications.org
Effect of Drying on the Mineral Composition of Okra
The result of the mineral analysis (Table 3) indicated that okra was high in mineral content
such as calcium which is paramount for teeth and bone formation as well as for development.
It was also observed that the samples dried at the temperature of 40 oC had the highest value
of the entire minerals analyzed. It had the calcium content of 99 mg/100g, magnesium
content of 739 mg/100, iron content of 824 mg/100g, sodium content of 1418 mg/100g and
potassium content 2731 mg/100g among others.
Comparison of the above mineral contents with that of the fresh sample showed that the fresh
sample had the least mineral content in all the mineral elements analyzed. This implied that
dry processing of okra at a moderate temperature increased the mineral contents per gram of
okra.
Table 2: The proximate composition of okra (Abelmoschusesculentus) samples
Samples %
Moisture
% ash
content
% crude
fat
% crude
protein
% crude
fibre
%
carbohydrate
OKFR 90.00a+0.01 22.50
a+0.01 15.50
a±0.11 28.00
a+0.01 11.00
d±0.01 23.00
d±0.01
OK40oC 13.00
b+0.01 13.47
b+0.59 3.33
d±0.01 24.54
b+0.01 15.17
a±0.21 43.16
c+0.01
OK50oC 12.50
c+0.01 11.42
c+0.01 3.66
c+0.01 21.20
c+0.01 12.86
b±0.01 50.86
b±0.01
OK60oC 10.00
d+0.01 11.11
c+0.01 4.39
b+0.01 17.28
d+0.01 11.72
c±0.01 55.50
a±0.41
Values represent means of triplicate readings SEM followed by different lowercase letter
Values with the same letters along the columns are not significantly different (P<0.05)
Table 3: The mineral (g/100g) composition of okra samples
Sampl
e
Calcium Magnesiu
m
Iron Manganese Sodium Potassium Copper Phosphor
us
OkFR 59.08d±0.
56
51.83f±0.0
0
56.31e±0.0
2
50.42f±0.1
1
71.22b±0.
13
94.26a±0.
34
26.21g±0.
00
65.28c±0.
6
OK40oc 996
c±0.15 739
e±0.05 824
d±0.09 710
f±0.03 1418
b±0.1
2
2731a±0.4
0
ND 679g±0.0
0
OK50oc 863
c±0.73 681
e±0.01 746
d±0.00
2
669f±0.92 924
b±0.56 2082
a±0.1
4
ND 639f±0.3
6
OK60oc 667
c±0.10 574
e±0.04 599
d±0.27 568
f±0.18 806
b±0.73 1901
a±0.9
9
ND 595d±0.8
5
Values represent means of triplicate readings SEM followed by different lowercase letter
Values with the same letters along the columns are not significantly different (P<0.05)
KEY OKFR = Fresh Okra sample
OK40oC = Okra dried at 40
oC
OK50oC = Okra dried at 50
oC
OK60oC = Okra dried at 60
oC
Effect of Drying on the Viscosity Values of Okra
One of the main properties of okra is its mucilaginous nature which is measured in terms of
its viscosity. Mucilage content of okra pods is a reflection of the carbohydrate content.
Page 6
European Journal of Engineering and Technology Vol. 3 No. 2, 2015 ISSN 2056-5860
Progressive Academic Publishing, UK Page 12 www.idpublications.org
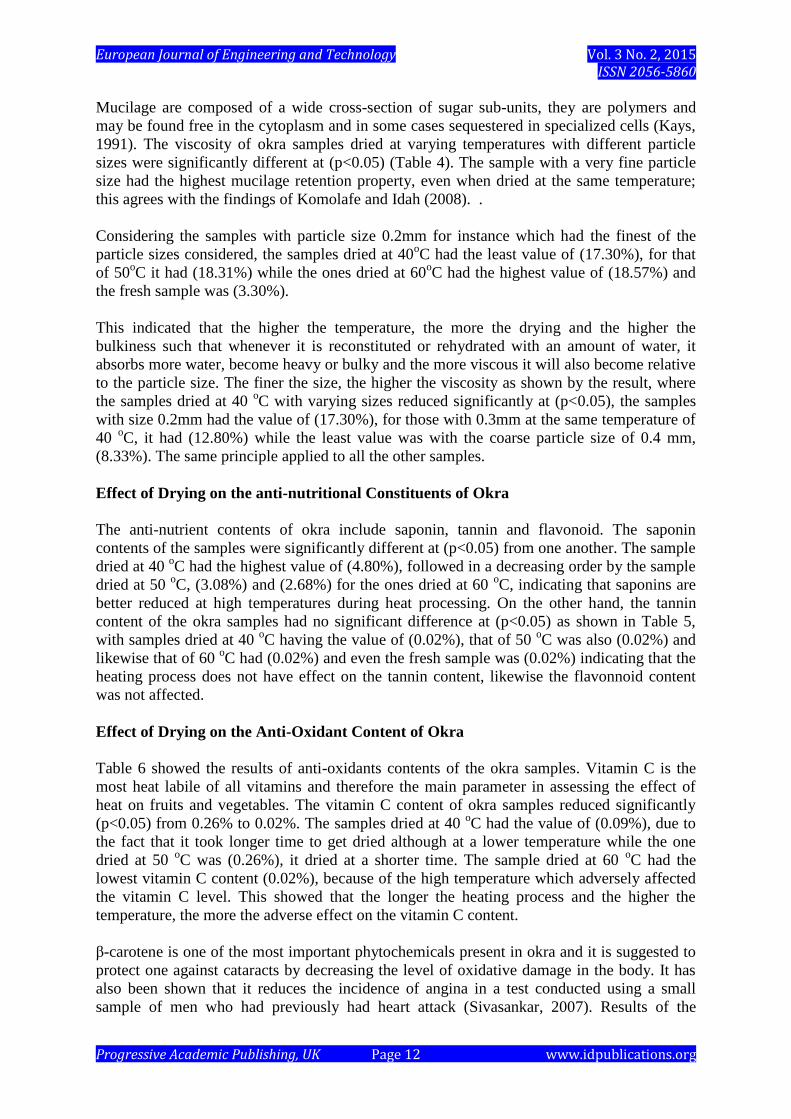
Mucilage are composed of a wide cross-section of sugar sub-units, they are polymers and
may be found free in the cytoplasm and in some cases sequestered in specialized cells (Kays,
1991). The viscosity of okra samples dried at varying temperatures with different particle
sizes were significantly different at (p<0.05) (Table 4). The sample with a very fine particle
size had the highest mucilage retention property, even when dried at the same temperature;
this agrees with the findings of Komolafe and Idah (2008). .
Considering the samples with particle size 0.2mm for instance which had the finest of the
particle sizes considered, the samples dried at 40oC had the least value of (17.30%), for that
of 50oC it had (18.31%) while the ones dried at 60
oC had the highest value of (18.57%) and
the fresh sample was (3.30%).
This indicated that the higher the temperature, the more the drying and the higher the
bulkiness such that whenever it is reconstituted or rehydrated with an amount of water, it
absorbs more water, become heavy or bulky and the more viscous it will also become relative
to the particle size. The finer the size, the higher the viscosity as shown by the result, where
the samples dried at 40 oC with varying sizes reduced significantly at (p<0.05), the samples
with size 0.2mm had the value of (17.30%), for those with 0.3mm at the same temperature of
40 oC, it had (12.80%) while the least value was with the coarse particle size of 0.4 mm,
(8.33%). The same principle applied to all the other samples.
Effect of Drying on the anti-nutritional Constituents of Okra
The anti-nutrient contents of okra include saponin, tannin and flavonoid. The saponin
contents of the samples were significantly different at (p<0.05) from one another. The sample
dried at 40 oC had the highest value of (4.80%), followed in a decreasing order by the sample
dried at 50 oC, (3.08%) and (2.68%) for the ones dried at 60
oC, indicating that saponins are
better reduced at high temperatures during heat processing. On the other hand, the tannin
content of the okra samples had no significant difference at (p<0.05) as shown in Table 5,
with samples dried at 40 oC having the value of (0.02%), that of 50
oC was also (0.02%) and
likewise that of 60 oC had (0.02%) and even the fresh sample was (0.02%) indicating that the
heating process does not have effect on the tannin content, likewise the flavonnoid content
was not affected.
Effect of Drying on the Anti-Oxidant Content of Okra
Table 6 showed the results of anti-oxidants contents of the okra samples. Vitamin C is the
most heat labile of all vitamins and therefore the main parameter in assessing the effect of
heat on fruits and vegetables. The vitamin C content of okra samples reduced significantly
(p<0.05) from 0.26% to 0.02%. The samples dried at 40 oC had the value of (0.09%), due to
the fact that it took longer time to get dried although at a lower temperature while the one
dried at 50 oC was (0.26%), it dried at a shorter time. The sample dried at 60
oC had the
lowest vitamin C content (0.02%), because of the high temperature which adversely affected
the vitamin C level. This showed that the longer the heating process and the higher the
temperature, the more the adverse effect on the vitamin C content.
β-carotene is one of the most important phytochemicals present in okra and it is suggested to
protect one against cataracts by decreasing the level of oxidative damage in the body. It has
also been shown that it reduces the incidence of angina in a test conducted using a small
sample of men who had previously had heart attack (Sivasankar, 2007). Results of the
Page 7
European Journal of Engineering and Technology Vol. 3 No. 2, 2015 ISSN 2056-5860
Progressive Academic Publishing, UK Page 13 www.idpublications.org
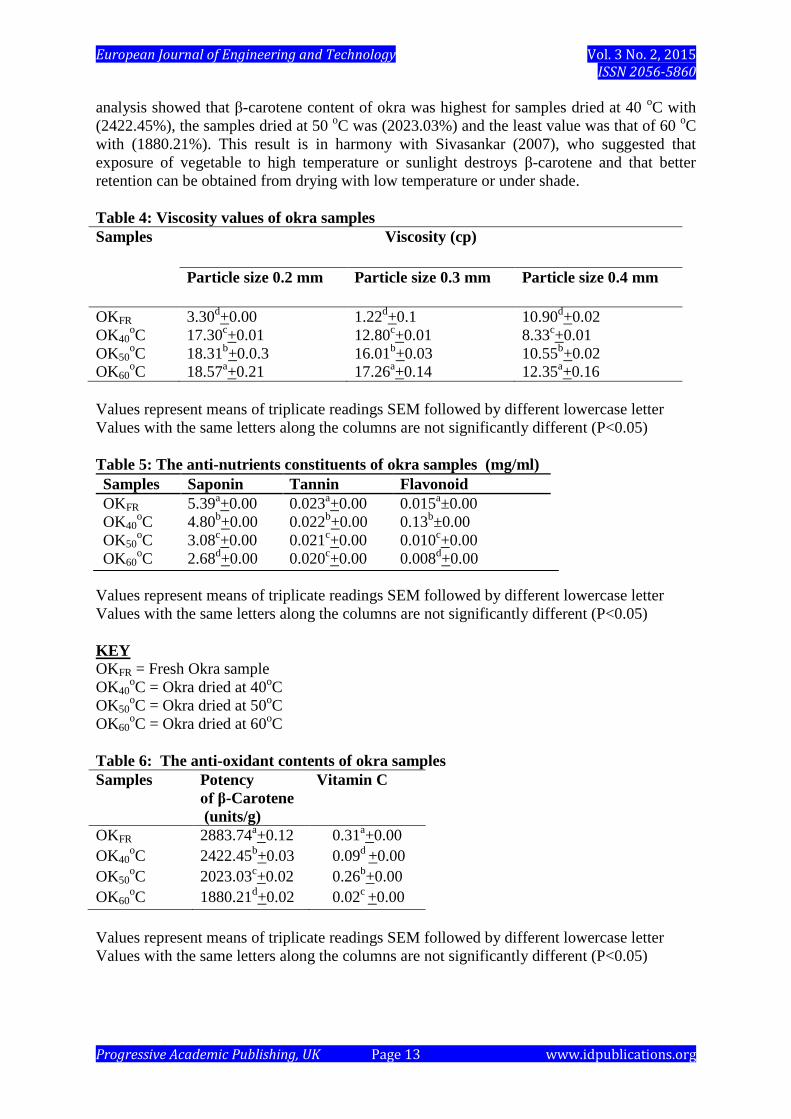
analysis showed that β-carotene content of okra was highest for samples dried at 40 oC with
(2422.45%), the samples dried at 50 oC was (2023.03%) and the least value was that of 60
oC
with (1880.21%). This result is in harmony with Sivasankar (2007), who suggested that
exposure of vegetable to high temperature or sunlight destroys β-carotene and that better
retention can be obtained from drying with low temperature or under shade.
Table 4: Viscosity values of okra samples
Samples Viscosity (cp)
Particle size 0.2 mm Particle size 0.3 mm Particle size 0.4 mm
OKFR 3.30d+0.00 1.22
d+0.1 10.90
d+0.02
OK40oC 17.30
c+0.01 12.80
c+0.01 8.33
c+0.01
OK50oC 18.31
b+0.0.3 16.01
b+0.03 10.55
b+0.02
OK60oC 18.57
a+0.21 17.26
a+0.14 12.35
a+0.16
Values represent means of triplicate readings SEM followed by different lowercase letter
Values with the same letters along the columns are not significantly different (P<0.05)
Table 5: The anti-nutrients constituents of okra samples (mg/ml)
Samples Saponin Tannin Flavonoid
OKFR 5.39a+0.00 0.023
a+0.00 0.015
a±0.00
OK40oC 4.80
b+0.00 0.022
b+0.00 0.13
b±0.00
OK50oC 3.08
c+0.00 0.021
c+0.00 0.010
c+0.00
OK60oC 2.68
d+0.00 0.020
c+0.00 0.008
d+0.00
Values represent means of triplicate readings SEM followed by different lowercase letter
Values with the same letters along the columns are not significantly different (P<0.05)
KEY OKFR = Fresh Okra sample
OK40oC = Okra dried at 40
oC
OK50oC = Okra dried at 50
oC
OK60oC = Okra dried at 60
oC
Table 6: The anti-oxidant contents of okra samples
Samples Potency
of β-Carotene
(units/g)
Vitamin C
OKFR 2883.74a+0.12 0.31
a+0.00
OK40oC 2422.45
b+0.03 0.09
d +0.00
OK50oC 2023.03
c+0.02 0.26
b+0.00
OK60oC 1880.21
d+0.02 0.02
c +0.00
Values represent means of triplicate readings SEM followed by different lowercase letter
Values with the same letters along the columns are not significantly different (P<0.05)
Page 8
European Journal of Engineering and Technology Vol. 3 No. 2, 2015 ISSN 2056-5860
Progressive Academic Publishing, UK Page 14 www.idpublications.org
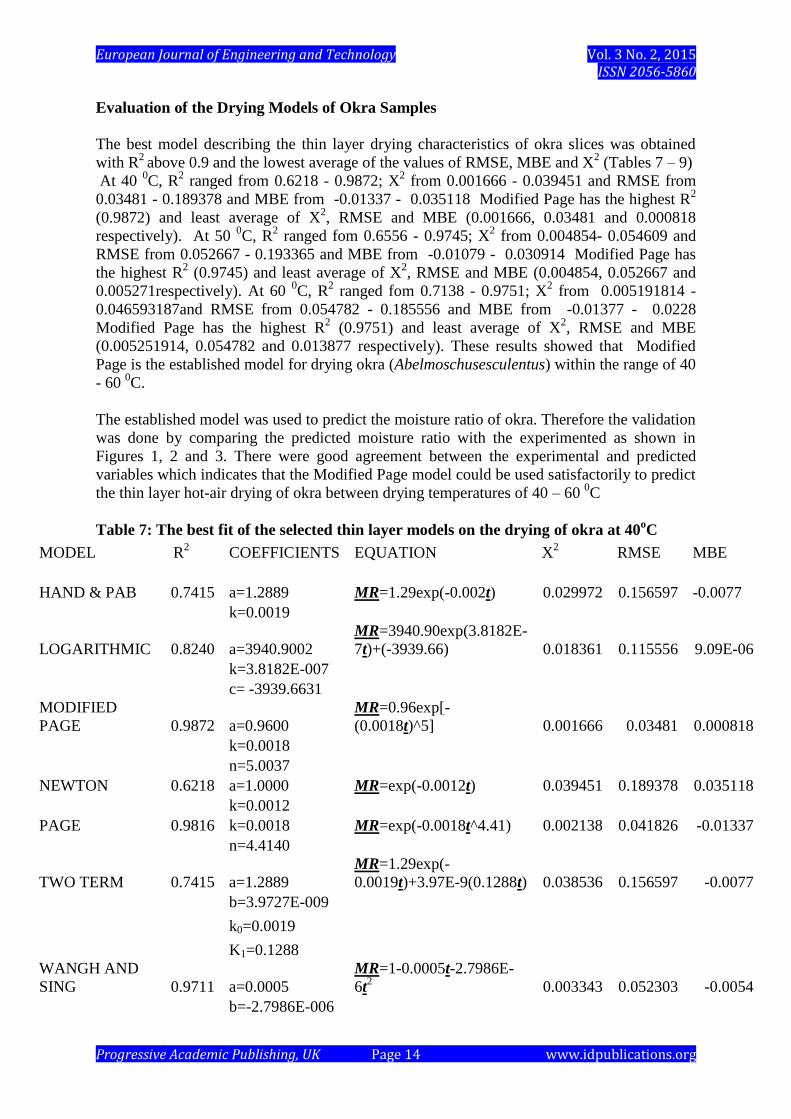
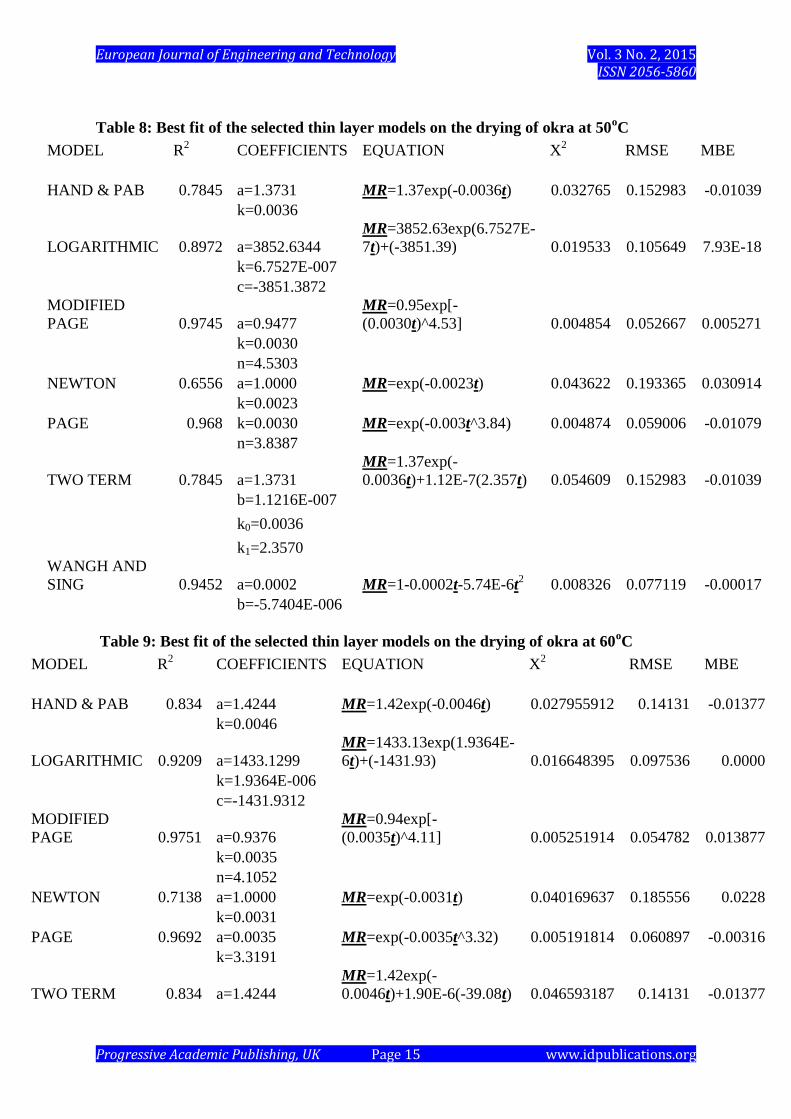
Evaluation of the Drying Models of Okra Samples
The best model describing the thin layer drying characteristics of okra slices was obtained
with R2
above 0.9 and the lowest average of the values of RMSE, MBE and X2 (Tables 7 – 9)
At 40 0C, R
2 ranged from 0.6218 - 0.9872; X
2 from 0.001666 - 0.039451 and RMSE from
0.03481 - 0.189378 and MBE from -0.01337 - 0.035118 Modified Page has the highest R2
(0.9872) and least average of X2, RMSE and MBE (0.001666, 0.03481 and 0.000818
respectively). At 50 0C, R
2 ranged fom 0.6556 - 0.9745; X
2 from 0.004854- 0.054609 and
RMSE from 0.052667 - 0.193365 and MBE from -0.01079 - 0.030914 Modified Page has
the highest R2 (0.9745) and least average of X
2, RMSE and MBE (0.004854, 0.052667 and
0.005271respectively). At 60 0C, R
2 ranged fom 0.7138 - 0.9751; X
2 from 0.005191814 -
0.046593187and RMSE from 0.054782 - 0.185556 and MBE from -0.01377 - 0.0228
Modified Page has the highest R2 (0.9751) and least average of X
2, RMSE and MBE
(0.005251914, 0.054782 and 0.013877 respectively). These results showed that Modified
Page is the established model for drying okra (Abelmoschusesculentus) within the range of 40
- 60 0C.
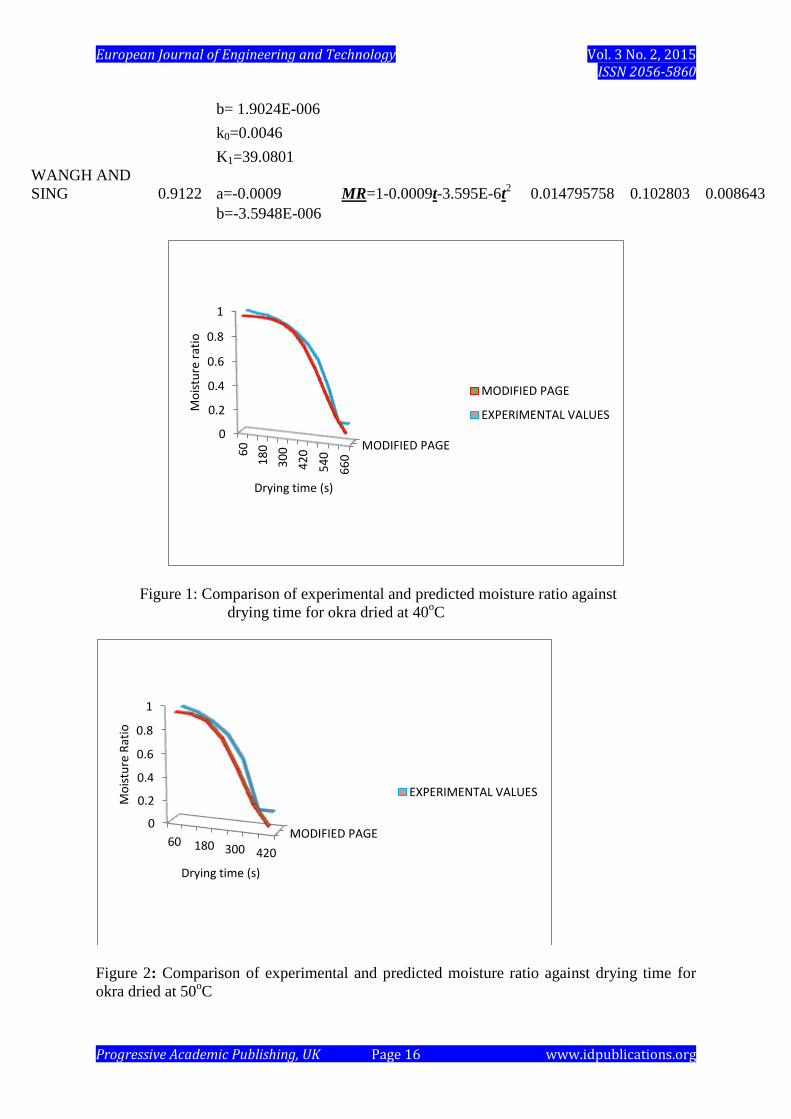
The established model was used to predict the moisture ratio of okra. Therefore the validation
was done by comparing the predicted moisture ratio with the experimented as shown in
Figures 1, 2 and 3. There were good agreement between the experimental and predicted
variables which indicates that the Modified Page model could be used satisfactorily to predict
the thin layer hot-air drying of okra between drying temperatures of 40 – 60 0C
Table 7: The best fit of the selected thin layer models on the drying of okra at 40oC
MODEL R2 COEFFICIENTS EQUATION X
2 RMSE MBE
HAND & PAB 0.7415 a=1.2889 MR=1.29exp(-0.002t) 0.029972 0.156597 -0.0077
k=0.0019
LOGARITHMIC 0.8240 a=3940.9002
MR=3940.90exp(3.8182E-
7t)+(-3939.66) 0.018361 0.115556 9.09E-06
k=3.8182E-007
c= -3939.6631
MODIFIED
PAGE 0.9872 a=0.9600
MR=0.96exp[-
(0.0018t)^5] 0.001666 0.03481 0.000818
k=0.0018
n=5.0037
NEWTON 0.6218 a=1.0000 MR=exp(-0.0012t) 0.039451 0.189378 0.035118
k=0.0012
PAGE 0.9816 k=0.0018 MR=exp(-0.0018t^4.41) 0.002138 0.041826 -0.01337
n=4.4140
TWO TERM 0.7415 a=1.2889
MR=1.29exp(-
0.0019t)+3.97E-9(0.1288t) 0.038536 0.156597 -0.0077
b=3.9727E-009
k0=0.0019
K1=0.1288
WANGH AND
SING 0.9711 a=0.0005
MR=1-0.0005t-2.7986E-
6t2 0.003343 0.052303 -0.0054
b=-2.7986E-006
Page 9
European Journal of Engineering and Technology Vol. 3 No. 2, 2015 ISSN 2056-5860
Progressive Academic Publishing, UK Page 15 www.idpublications.org
Table 8: Best fit of the selected thin layer models on the drying of okra at 50oC
MODEL R2 COEFFICIENTS EQUATION X
2 RMSE MBE
HAND & PAB 0.7845 a=1.3731 MR=1.37exp(-0.0036t) 0.032765 0.152983 -0.01039
k=0.0036
LOGARITHMIC 0.8972 a=3852.6344
MR=3852.63exp(6.7527E-
7t)+(-3851.39) 0.019533 0.105649 7.93E-18
k=6.7527E-007
c=-3851.3872
MODIFIED
PAGE 0.9745 a=0.9477
MR=0.95exp[-
(0.0030t)^4.53] 0.004854 0.052667 0.005271
k=0.0030
n=4.5303
NEWTON 0.6556 a=1.0000 MR=exp(-0.0023t) 0.043622 0.193365 0.030914
k=0.0023
PAGE 0.968 k=0.0030 MR=exp(-0.003t^3.84) 0.004874 0.059006 -0.01079
n=3.8387
TWO TERM 0.7845 a=1.3731
MR=1.37exp(-
0.0036t)+1.12E-7(2.357t) 0.054609 0.152983 -0.01039
b=1.1216E-007
k0=0.0036
k1=2.3570
WANGH AND
SING 0.9452 a=0.0002 MR=1-0.0002t-5.74E-6t2 0.008326 0.077119 -0.00017
b=-5.7404E-006
Table 9: Best fit of the selected thin layer models on the drying of okra at 60oC
MODEL R2 COEFFICIENTS EQUATION X
2 RMSE MBE
HAND & PAB 0.834 a=1.4244 MR=1.42exp(-0.0046t) 0.027955912 0.14131 -0.01377
k=0.0046
LOGARITHMIC 0.9209 a=1433.1299
MR=1433.13exp(1.9364E-
6t)+(-1431.93) 0.016648395 0.097536 0.0000
k=1.9364E-006
c=-1431.9312
MODIFIED
PAGE 0.9751 a=0.9376
MR=0.94exp[-
(0.0035t)^4.11] 0.005251914 0.054782 0.013877
k=0.0035
n=4.1052
NEWTON 0.7138 a=1.0000 MR=exp(-0.0031t) 0.040169637 0.185556 0.0228
k=0.0031
PAGE 0.9692 a=0.0035 MR=exp(-0.0035t^3.32) 0.005191814 0.060897 -0.00316
k=3.3191
TWO TERM 0.834 a=1.4244
MR=1.42exp(-
0.0046t)+1.90E-6(-39.08t) 0.046593187 0.14131 -0.01377
Page 10
European Journal of Engineering and Technology Vol. 3 No. 2, 2015 ISSN 2056-5860
Progressive Academic Publishing, UK Page 16 www.idpublications.org
b= 1.9024E-006
k0=0.0046
K1=39.0801
WANGH AND
SING 0.9122 a=-0.0009 MR=1-0.0009t-3.595E-6t2 0.014795758 0.102803 0.008643
b=-3.5948E-006
Figure 1: Comparison of experimental and predicted moisture ratio against
drying time for okra dried at 40oC
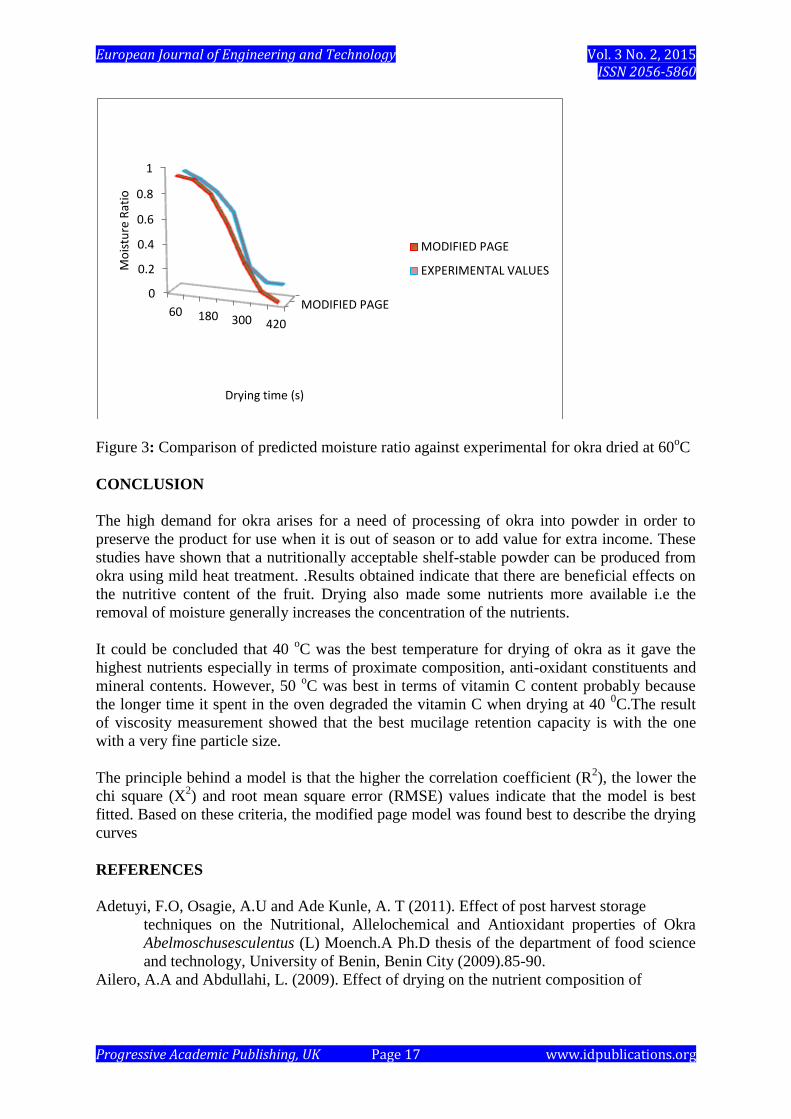
Figure 2: Comparison of experimental and predicted moisture ratio against drying time for
okra dried at 50oC
MODIFIED PAGE 0
0.2
0.4
0.6
0.8
1
60
18
0
30
0
42
0
54
0
66
0
Mo
istu
re r
atio
Drying time (s)
MODIFIED PAGE
EXPERIMENTAL VALUES
MODIFIED PAGE 0
0.2
0.4
0.6
0.8
1
60 180 300 420
Mo
istu
re R
atio
Drying time (s)
EXPERIMENTAL VALUES
Page 11
European Journal of Engineering and Technology Vol. 3 No. 2, 2015 ISSN 2056-5860
Progressive Academic Publishing, UK Page 17 www.idpublications.org
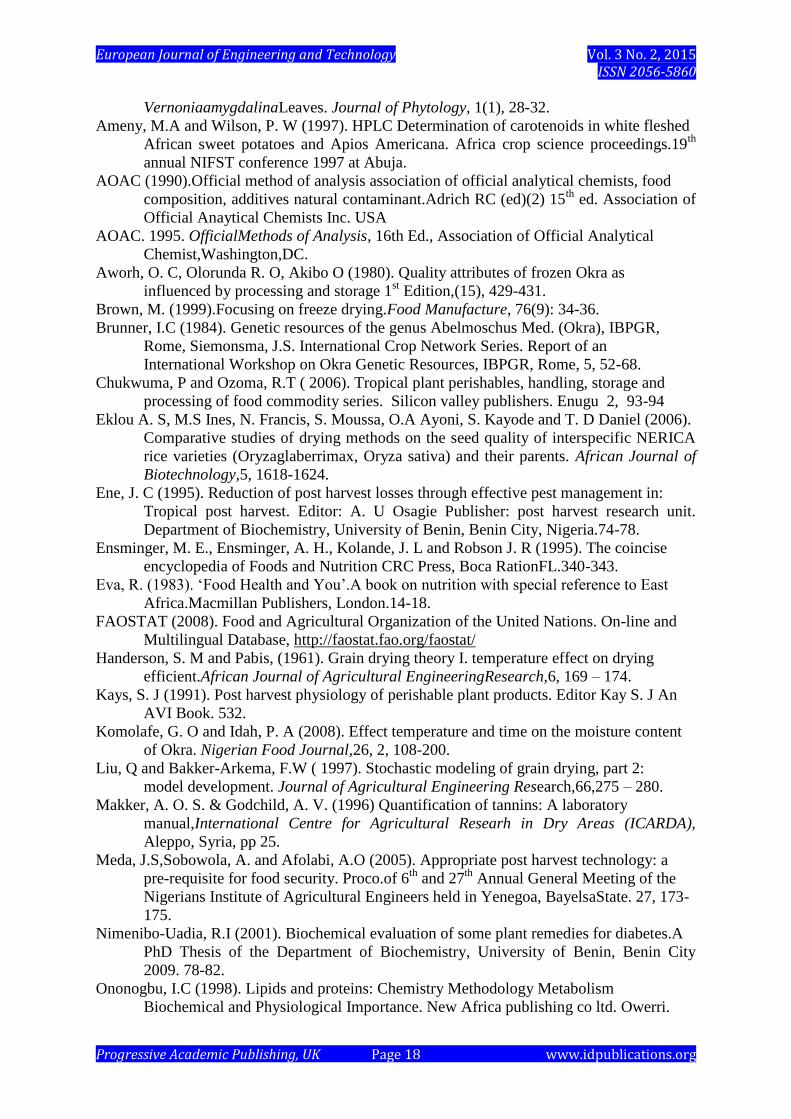
Figure 3: Comparison of predicted moisture ratio against experimental for okra dried at 60oC
CONCLUSION
The high demand for okra arises for a need of processing of okra into powder in order to
preserve the product for use when it is out of season or to add value for extra income. These
studies have shown that a nutritionally acceptable shelf-stable powder can be produced from
okra using mild heat treatment. .Results obtained indicate that there are beneficial effects on
the nutritive content of the fruit. Drying also made some nutrients more available i.e the
removal of moisture generally increases the concentration of the nutrients.
It could be concluded that 40 oC was the best temperature for drying of okra as it gave the
highest nutrients especially in terms of proximate composition, anti-oxidant constituents and
mineral contents. However, 50 oC was best in terms of vitamin C content probably because
the longer time it spent in the oven degraded the vitamin C when drying at 40 0C.The result
of viscosity measurement showed that the best mucilage retention capacity is with the one
with a very fine particle size.
The principle behind a model is that the higher the correlation coefficient (R2), the lower the
chi square (X2) and root mean square error (RMSE) values indicate that the model is best
fitted. Based on these criteria, the modified page model was found best to describe the drying
curves
REFERENCES
Adetuyi, F.O, Osagie, A.U and Ade Kunle, A. T (2011). Effect of post harvest storage
techniques on the Nutritional, Allelochemical and Antioxidant properties of Okra
Abelmoschusesculentus (L) Moench.A Ph.D thesis of the department of food science
and technology, University of Benin, Benin City (2009).85-90.
Ailero, A.A and Abdullahi, L. (2009). Effect of drying on the nutrient composition of
MODIFIED PAGE 0
0.2
0.4
0.6
0.8
1
60 180 300 420
Mo
istu
re R
atio
Drying time (s)
MODIFIED PAGE
EXPERIMENTAL VALUES
Page 12
European Journal of Engineering and Technology Vol. 3 No. 2, 2015 ISSN 2056-5860
Progressive Academic Publishing, UK Page 18 www.idpublications.org
VernoniaamygdalinaLeaves. Journal of Phytology, 1(1), 28-32.
Ameny, M.A and Wilson, P. W (1997). HPLC Determination of carotenoids in white fleshed
African sweet potatoes and Apios Americana. Africa crop science proceedings.19th
annual NIFST conference 1997 at Abuja.
AOAC (1990).Official method of analysis association of official analytical chemists, food
composition, additives natural contaminant.Adrich RC (ed)(2) 15th
ed. Association of
Official Anaytical Chemists Inc. USA
AOAC. 1995. OfficialMethods of Analysis, 16th Ed., Association of Official Analytical
Chemist,Washington,DC.
Aworh, O. C, Olorunda R. O, Akibo O (1980). Quality attributes of frozen Okra as
influenced by processing and storage 1st Edition,(15), 429-431.
Brown, M. (1999).Focusing on freeze drying.Food Manufacture, 76(9): 34-36.
Brunner, I.C (1984). Genetic resources of the genus Abelmoschus Med. (Okra), IBPGR,
Rome, Siemonsma, J.S. International Crop Network Series. Report of an
International Workshop on Okra Genetic Resources, IBPGR, Rome, 5, 52-68.
Chukwuma, P and Ozoma, R.T ( 2006). Tropical plant perishables, handling, storage and
processing of food commodity series. Silicon valley publishers. Enugu 2, 93-94
Eklou A. S, M.S Ines, N. Francis, S. Moussa, O.A Ayoni, S. Kayode and T. D Daniel (2006).
Comparative studies of drying methods on the seed quality of interspecific NERICA
rice varieties (Oryzaglaberrimax, Oryza sativa) and their parents. African Journal of
Biotechnology,5, 1618-1624.
Ene, J. C (1995). Reduction of post harvest losses through effective pest management in:
Tropical post harvest. Editor: A. U Osagie Publisher: post harvest research unit.
Department of Biochemistry, University of Benin, Benin City, Nigeria.74-78.
Ensminger, M. E., Ensminger, A. H., Kolande, J. L and Robson J. R (1995). The coincise
encyclopedia of Foods and Nutrition CRC Press, Boca RationFL.340-343.
Eva, R. (1983). ‘Food Health and You’.A book on nutrition with special reference to East
Africa.Macmillan Publishers, London.14-18.
FAOSTAT (2008). Food and Agricultural Organization of the United Nations. On-line and
Multilingual Database, http://faostat.fao.org/faostat/
Handerson, S. M and Pabis, (1961). Grain drying theory I. temperature effect on drying
efficient.African Journal of Agricultural EngineeringResearch,6, 169 – 174.
Kays, S. J (1991). Post harvest physiology of perishable plant products. Editor Kay S. J An
AVI Book. 532.
Komolafe, G. O and Idah, P. A (2008). Effect temperature and time on the moisture content
of Okra. Nigerian Food Journal,26, 2, 108-200.
Liu, Q and Bakker-Arkema, F.W ( 1997). Stochastic modeling of grain drying, part 2:
model development. Journal of Agricultural Engineering Research,66,275 – 280.
Makker, A. O. S. & Godchild, A. V. (1996) Quantification of tannins: A laboratory
manual,International Centre for Agricultural Researh in Dry Areas (ICARDA),
Aleppo, Syria, pp 25.
Meda, J.S,Sobowola, A. and Afolabi, A.O (2005). Appropriate post harvest technology: a
pre-requisite for food security. Proco.of 6th
and 27th
Annual General Meeting of the
Nigerians Institute of Agricultural Engineers held in Yenegoa, BayelsaState. 27, 173-
175.
Nimenibo-Uadia, R.I (2001). Biochemical evaluation of some plant remedies for diabetes.A
PhD Thesis of the Department of Biochemistry, University of Benin, Benin City
2009. 78-82.
Ononogbu, I.C (1998). Lipids and proteins: Chemistry Methodology Metabolism
Biochemical and Physiological Importance. New Africa publishing co ltd. Owerri.
Page 13
European Journal of Engineering and Technology Vol. 3 No. 2, 2015 ISSN 2056-5860
Progressive Academic Publishing, UK Page 19 www.idpublications.org
Orishagbemi, C.O, Ozumba, A. U and Olatunji O (2000). Effect of Stimulated Shaded
drying on the colour stability of dehydrated Okra. Proco, 20th
Annual NIFST
conference, Federal Polytechnic Bauchi.103-105.
Overhults, B.D., White, G.M., Hanilto, M.E and Ross, I.J (1973). Drying soya beans with
heated air Trans. American Society of Agricultural Engineering Journal, 16, 195-200
Sam, Oburoh (1999). Post harvest loss prevention. The role of Investment Capital Proceeding
of paper presented at the 22nd
Annual NIFST Conference, 25th
-27th
October, 1999 at
Abuja.
Siemonsma, J.S and Kouame, C (2004).AbelmoschusEsculentus. In plant Resources of
Tropical Africa 2 Vegetable Editors Grubben G.J.H and Denton O.A published by
PROTA foundation Netherlands.21-29.
Sivasankar, B. (2007). Food processing and preservation.New Delhi: Prentice-Hal of
India Private Limited.
Raghavan, G.S.V and Orsat, V (1998). Electro-technology in drying and processing of
biological materials. Keynote presentation at 11th
International Drying Symposium
(IDS 98), Halkidid, Greece 19-22 August. 456-463
Togrul, I. and Pehlivan(2004).Modeling of thin layer drying kinetics of some fruits under
open-air sun drying process. Journal of Food Engineering 65, 413 425.
Turner, I and Mujumdar, A. S. (1996).Mathematical Modeling and Numerical Techniques
in Drying Technology. Marcel Dekker, New York, 542-560.
U.S Department of Agriculture, Agricultural Research Service (2010). USDA National
Nutrient Database for Standard Reference, Release 23..
Wang, C.Y and Singh,R.P (1998).A thin layer drying equation for use of variable
equiplibrium moisture content in modeling rice drying.American Society of
Agricultural Engineers, 18, 78-650.
Yaldiz, O., Ertekin, C. andUzun, H.I. (2001).Mathematical modeling of thin layer solar
drying of sultana grapes. Energy – An International Journal; 26(5): 457–465
Zhang, Q. and Litchfield, J.B. (1991).An optimization of intermittent corn drying in a
laboratory scale thin layer dryer. Drying Technology.