21
DURHAM AGED MINEWORKERS’ HOMES ASSOCIATION VALUE FOR MONEY STATEMENT Year ended 31 st March 2017 Agenda Item 6

DURHAM AGED MINEWORKERS’
HOMES ASSOCIATION
VALUE FOR MONEY STATEMENT
Year ended 31st March 2017
Agenda Item 6

Document File Name : F:\Administration\Committees\Executive Committee\2017\2017-09-21\2017-09-21 Agenda Item 4 - DAMHA VfM Statement 2017.docx
1. Purpose
1.1. The purpose of this statement is to demonstrate the way in which Value for Money
(VfM) has been delivered by the Association in the 2016/17 financial year, as well as
looking forward to future initiatives.
1.2. A summarised extract of this statement will be included in the Annual Report to
residents and the key financial elements are included in the Executive Committee’s
Annual Report, which forms part of the annual financial statements.
1.3. The statement will be updated annually.
2. Approach to VfM
2.1. The Association, as a Registered Charity is committed to being an effective and efficient
social business achieving high levels of VfM in all its activities. A VfM Strategy was
approved for 2013-17 and this was recently updated in February 2017 for the next
three years to 2020. The strategy recognises that VfM is not a new initiative, and
indeed that VfM has been a fundamental ethos of the Association for a long time.
3. VfM objectives
3.1. In order to deliver ongoing continuously improving VfM, the original strategy identified
four specific objectives:
3.1.1. Objective 1: Understand our key input costs thoroughly;
3.1.2. Objective 2: Improve our procurement processes;
3.1.3. Objective 3: Improve the efficiency of the process of driving continuous
improvement; and
3.1.4. Objective 4: Embed VfM into capital spending procedures
3.2. During the period 2013-17, work was undertaken to attain these objectives in
successive annual Corporate Plans of the Association. This resulted in ongoing cash-
reductions of the budget which were achieved without reducing quality of our services
to residents, and indeed in most cases, marginally improving them. The precise levels
of efficiency savings in summary are demonstrated in Section 5 below.
3.3. In May 2017, the Executive Committee, acknowledging the progress made, updated the
Value for Money Strategy to identify two new objectives for the following strategy
period. These are
3.3.1. Objective 1: Develop to our maximum potential; and
3.3.2. Objective 2: Continue to improve our procurement processes.
4. VfM in practice
4.1. VfM in absolute terms is being delivered. This can be demonstrated in the following
sections.

Document File Name : F:\Administration\Committees\Executive Committee\2017\2017-09-21\2017-09-21 Agenda Item 4 - DAMHA VfM Statement 2017.docx
4.2. Resource allocation.
4.2.1. The Annual Financial Plan, which forms the basis of the Association’s Annual
Corporate Plan, is updated every year. This is the primary way in which capital
resources are allocated between competing financial priorities.
4.2.2. The Executive Committee have operated the following underlying priorities
within the business plan for many years:
Maintaining financial viability;
Providing excellent, cost-effective, services to residents;
Fund investment in existing stock to maintain a standard appropriate to the
aspirations of the residents;
Providing an on-going development programme to address the undersupply
of affordable and appropriately designed homes for older people in the
region.
4.2.3. Whilst there is competition between these priorities, and there is often a need
to compromise, this does not apply to maintaining financial viability. The latest
update to the Annual Financial Plan which looks at the potential financial
performance of the Association over the next 30 years, was approved by the
Executive Committee in May 2016 and delivers an ongoing surplus which is used
to improve the quality of existing homes and finance the development of new
ones.
4.2.4. In January 2016 the government announced a one-year suspension for
Almshouses, supported housing and sheltered housing of the full 4-year 1% per
annum rent cut initially imposed on all Housing Associations, and also a
suspension of the application of an LHA cap to “rents” for one year for the same
categories of Housing Association properties. In addition, Almshouses are
excluded in the Voluntary Right to Buy provisions of the Housing Bill.
4.2.5. This has brought some stability to the Association’s business plan and
forstalled any immediate necessity to reduce services, however pending the
implementation of the Departmental Review into the LHA cap for supported and
sheltered housing and almshouse charities, there still remains considerable
uncertainty.
4.2.6. Nevertheless, development has returned to the agenda following the
preparation of the Association’s 2016/17 Budget in February 2016. 5 properties
are expected to be developed in this financial year and a bid was approved by
the HCA as part of the Isos Development Partnership for 20 new homes in each
of the following 5 years, on assurances being received from local HCA
representatives that there is flexibility in the system given the current level of
uncertainty about future rent levels.
4.2.7. The Plan demonstrates that the Association is in a robust position and meets
the expectations of external stakeholders and funders. Being a not-for-profit,

Document File Name : F:\Administration\Committees\Executive Committee\2017\2017-09-21\2017-09-21 Agenda Item 4 - DAMHA VfM Statement 2017.docx
registered charity, 100% of surpluses earned are reinvested in the association
for the improvement of existing homes, or for the development of new ones.
4.2.8. It is recognised that in order to deliver cost effective services, efficiencies are
required and expected. As the Association is a registered charity with no
shareholders to withdraw a “profit” from it, every efficiency saving represents an
additional resource that can potentially be made available to further the
Association’s objectives. Specific measures are detailed later in this report.
4.2.9. Ensuring our existing properties are maintained and upgraded to the required
standard through the capital planned maintenance programme is essential. The
Association owns stock which has been developed at various periods over the
preceding century, much of which can be costly to maintain due to age. An
average of £943k per annum has been set aside for each of the next 5 years for
this purpose. This level of investment is reviewed on an annual basis, and is
informed by the Association’s Stock Condition Survey, which is challenged by
quinquennial inspection and linked, via component accounting to the
Association’s accounts through component accounting and the accounting policy
for depreciation.
4.2.10. The Association operates an Asset Management Strategy which is reviewed
annually by the Executive Committee, and which monitors the condition and
demand for individual groups of homes owned by the Association. Homes
identified under the strategy for which demand is low, and/or anticipated to
require excessive levels of expenditure to maintain are periodically released for
sale onto the open market, following consultation with the residents. Capital
receipts, are set aside in reserves and utilised to provide funding towards the
development of new homes.
4.2.11. The Association has conducted a Return on Assets analysis of all homes. This
identified the regional areas where homes offer lower returns. This information
feeds into the decision making process as the Asset Management Strategy is
rolled forward.
4.2.12. The provision of modern homes for retired people is a key regional strategic
priority, as indicated by the high proportion of people over 65 on the Local
Authority’s waiting list and also the Association’s own waiting list, which is
numerically larger than the number of properties owned, and growing. There are
currently 1,690 applicants on DAMHA’s waiting list (2016: 1,866).
4.2.13. The new development programme is currently projecting an average of 20
new homes per year a reduction of 33% from the level of development
previously able to be sustained by the Association prior to 2011, and reflective of
the impact of reduced grant rates and the depression of future rental income on
the Association’s ability to sustain a level private lending required for new
development.
4.2.14. Notwishtanding, the Association has agreed a development programme of 126
homes in the five years to 2022 with the Homes and Communities Agency

Document File Name : F:\Administration\Committees\Executive Committee\2017\2017-09-21\2017-09-21 Agenda Item 4 - DAMHA VfM Statement 2017.docx
utilising grant funding allocated in December 2016 and grant recycled from the
disposal of redundant homes.
4.3. Procurement
4.3.1. Efficiency in procurement is a given essential for the achievement of VfM.
During 2016/17 the following tenders were carried out:
Gas Servicing 5 year contract – to include electrical testing and solar panel
servicing.
4.3.2. There are no major contracts outstanding for tender during 2017/18.
4.3.3. The Association is planning to recruit a specialist Procurement Manager during
2017/18 who will oversee procurement strategy.
4.4. Investment Strategy
4.4.1. In 2010 the Association established a Residents’ Scrutiny Panel. The panel
meets quarterly to review performance statistics and set targets, as well as
monitoring our performance under the Customer Charter. A full schedule of
performance against Customer Charter targets in the year ended 31st March
2017 is included with the summary of all our KPI’s at Appendix 1. Our
performance continues to be on or about target in all areas.
4.4.2. It is recognised by Durham County Council and other local authorities in the
North East and nationally, that there is a shortfall of supply against demand for
2-bedroom bungalows designed with the needs of older people in mind, which is
not being met by either the private sector or the legacy of primarily 1-bedroom
bungalows provided elsewhere in the region.
4.4.3. The Association sees that it plays a significant role in locally addressing this
pressing need, and seeks to increase its provision of suitable retirement housing
for which there is a demonstrable need.
4.4.4. To that end, in every year since registering as a Housing Association in the
1980’s the Association has increased its stock of homes by building new
bungalows, of primarily 2 bedrooms. This programme paused during 2016/17
when no new homes were completed following the completion of an agreed
development programme and the retirement of the Association’s Head of Asset
Management. However the Association maintains an ambition to continue to
provide new retirement homes and following a staffing reorganisation, an annual
development programme remains in our 30 year Business Plan despite this
having become a significantly more financially challenging prospect than in the
recent past. As noted in paragraph 4.2.14 above, the Association is currently
progressing a specific programme of development of new homes within this plan.
4.4.5. We review the condition and desirability of all our stock on an annual basis.
Currently we have identified 28 properties where the anticipated cost of
maintenance is not financially justifiable given demand and achievable weekly
charges, and that in the Trustees’ opinion the capital invested would be better

Document File Name : F:\Administration\Committees\Executive Committee\2017\2017-09-21\2017-09-21 Agenda Item 4 - DAMHA VfM Statement 2017.docx
used if it was released to provide funds for the development of new properties.
These are sold on an ongoing basis on the open market upon voluntary vacation
by their residents.
4.4.6. Our average sale price per unit achieved in 2017 was £40.9k and so this
represents capital (in the form of both recycled grant and the Association’s own
reserves) of approximately £163.8k, that will be recycled into modern and
desirable homes that are more appropriate for older people in today’s market.
4.4.7. Recognising that moving home represents a greater level of upheaval and
stress for older people than for the general population, we allow new residents a
full week from getting the keys to moving in, with the first weekly maintenance
charge not becoming payable until the second Monday following. This means
that our average turnaround period, and therefore the associated income loss, is
greater than our peers (25.4 days compared to a target of 26.0 days for 2016/17),
This is affordable however, due to our otherwise low level of voids, and is very
highly valued by our new residents who are often vulnerable and in need of
assistance in moving home, which cannot always be arranged quickly.
4.4.8. For the previous two years, the average was additionally skewed by long term
voids at a single sheltered scheme. Additional effort was focused on the scheme
in an attempt to develop an improved local marketing strategy which paid off
during the year. However, marketing remains an ongoing challenge in the local
environment.
4.4.9. In order to ensure as much of our income as possible is utilised for the
provision of more homes, the Association constantly reviews its expenditure and
seeks to operate within challenging budgets. In 2017, once again a further
decrease in the proportion of operating costs as a percentage of turnover was
achieved, building on ongoing progress from prior years. This was not down to
any single item, other than an ongoing critical review of budget expenditure to
ensure waste is minimised, opportunities for savings are undertaken whenever
possible, and new methods of delivering services are explored where they have a
realistic chance of making further efficiency gains.
4.4.10. A summary of our KPI’s and our performance against them for the year ended
31st March 2017 is included at Appendix 2.

Document File Name : F:\Administration\Committees\Executive Committee\2017\2017-09-21\2017-09-21 Agenda Item 4 - DAMHA VfM Statement 2017.docx
5. Value for Money Performance - Analysis
5.1. Key areas of performance in relation to VfM are as follows:
2017 Change 2016 2015 2014
Operating costs as a percentage of turnover
44.6% (5.5%) 50.1% 52.9% 55.3%
Housing management costs per unit
£225.68 3.3% £218.40 £236.60 £230.55
Maintenance costs per unit
£552.76 (3.6%) £573.56 £522.08 £569.22
Routine repairs completed on time
99.6% (0.1%) 99.7% 99.9% 98.8%
Repairs satisfaction 91.6% 0.1% 91.5% 90.2% 89.2%
Average re-let time 25.4 days (30.4%) 36.5 days 35.2 days 29.3 days
Current resident maintenance charge arrears
£190k (4.0%) £198k £154k £125k
New homes completed 0 (100.0%) 30 5 17
Redundant homes sold 3 (40.0%) 5 2 5
5.2. The Association is committed to ongoing organic growth of its housing stock,
balancing its finite capital resources between the need for new properties and an
obligation to maintain existing stock against improving standards.
5.3. The association is committed to ongoing continuous improvement and in conjunction
with a Scrutiny Panel of residents, assesses its performance against challenging
targets on a quarterly basis. The results against these key performance indicators
for 2017 are attached at Appendix 2. The targets are reviewed annually and
revised where appropriate in consultation with the Scrutiny Panel. There were no
changes to targets this year.
5.4. The Association benchmarks with other similar providers as part of the Housemark
Benchmarking Club of Traditional Housing Associations in the Northern & Midlands
Region. The report compares the results for the Association with other registered
providers in the region. The results for 2016/17 are presented in summary at
Appendix 3.
5.5. Of the 53 measures covered, DAMHA places in the top quartile 28 times, and the
bottom quartile only four times.
5.6. Investigation of the four bottom quartile Performance Indicators shows:
5.6.1. Percentage of dwellings with a valid gas safety certificate
Value: 99.94% In fact 100% of occupied homes with a gas supply were
certified, however 0.06% of homes (1 homes) which represent the difference
between 4th quartile and 1st quartile are explained by a home which has
subsequently been disconnected from the gas mains.

Document File Name : F:\Administration\Committees\Executive Committee\2017\2017-09-21\2017-09-21 Agenda Item 4 - DAMHA VfM Statement 2017.docx
5.6.2. Percentage of properties vacant and available to let
Value: 1.22% Virtually all of the Association’s voids are caused by the resident
being referred into care, or passing away. These factors are outside of our
control.
5.6.3. Percentage of repairs completed at the first visit
Value: 85.97% As our performance in relation to resident satisfaction with our
repairs function is very good, and our overall cost per unit for repairs is low for
the sector, this indicates that there is unlikely to be a significant efficiency
saving to be found in improving first-time completions. However as there is
potential a cost implication in relation to contractor time and travel costs, this
is an area currently under review to identify any possible efficiency savings.
5.6.4. Rent collected from current and former tenants as % rent due (excluding
arrears b/f)
Value: 96.82% Our arrears and write offs for former and current residents are
both very low compared to our peers. The factor influencing our relatively low
performance in this metric is in relation to the timing of payment of housing
benefit from Local Authorities. We are satisfied that this represents a cyclical
timing issue only relevant to timing of the statistical calculation, rather than
an ongoing problem with realising rent.
5.7. Analysis of the results of benchmarking against our peers, shows that the Association
is highly cost effective, and that delivering high levels of resident satisfaction has
been achieved while still maintaining a low cost base.
5.8. Prior to 2012, all registered providers were required to take part triennially in a
mandatory satisfaction survey of residents, which were collated and benchmarked on
a national basis. When this service was withdrawn by the regulator, the Association
committed to continue with the triennial survey on a voluntary basis utilising
Housemark’s STAR survey. This asks the same questions as the formerly mandatory
STATUS survey and is entirely compatible, permitting ongoing comparison of the
satisfaction of the Association’s residents over time.
5.9. The results of the most recent survey - conducted in July 2016 - compared to the
previous survey, conducted in July 2013, are shown at Appendix 4. Benchmarking
against other Registered Providers for this data set demonstrates that we remain at,
or very near, the top of our peer group for resident satisfaction.
5.10. The Association has had a sustained and high level of achievement in the
survey results for many years. At high levels of attainment, achieving further
marginal gains can be excessively expensive, and therefore the Association is
cautious in assessing the value for money of further gains. However, satisfaction of
our residents, and potential residents, continues to be a major priority of the
Association and continuous effort is focussed on ensuring that performance in this
area does not deteriorate. The Association has therefore targeted an improvement in
resident satisfaction from 94.4% to 95% by the time of the next STAR assessment in
2019.

Document File Name : F:\Administration\Committees\Executive Committee\2017\2017-09-21\2017-09-21 Agenda Item 4 - DAMHA VfM Statement 2017.docx
5.11. In order to facilitate this, the Association seeks to identify where ongoing
efficiency savings can be made via improved processes and new initiatives. A log of
efficiency savings achieved in this way during 2016/17 is attached at Appendix 5.
The estimated annual value of new savings achieved was £50k, most of which will
continue to be ongoing in future years.
6. High level benchmarking by the Homes Communities Agency
6.1. The Homes and Communities Agency (“HCA”) provided the Association with a
comparison of its headline costs in the year ended 31st March 2015 against all
Registered Providers nationally. Appendix 6 details this information provided, as
well as comparing the externally benchmarked data for 2015 against the outcome
data for 2016 and 2017 to provide a comparator over time.
6.2. For the year benchmarked by the HCA, 2015, it is notable that the Association
performed in the lowest (best) quartile for all areas other than revenue maintenance
costs per unit. While external benchmarked data has not been made available for
2016 or 2017, data extracted from the Association’s audited accounts indicates that
the performance trend for these years has remained good, with a 3.85% reduction in
Headline Total Social Housing Cost Per Unit (“CPU”) in 2017.
6.3. However, adding the Association’s Maintenance CPU and Major Repairs CPU together,
we get a cost of £1.73k per unit for total repairs which would place the Association
just better than median for such a combined measure, were one to exist. It is also
the case that our revenue maintenance CPU’s have fallen year on year since 2015,
although capitalised major expenditure has increased – reflecting ongoing,
programmed improvements to our older housing stock.
6.4. Given the age of the Association’s stock, much of which is pre-war, and a significant
amount pre-First World War, this is not considered to be a bad performance. The
Association has long recognised that having been in existence since 1898 over time
some of its stock will become obsolete, and has operated an Asset Management
Strategy (see paragraph 4.2.10) accordingly, so that unreasonable maintenance
costs are avoided and the best use is made of the Association’s capital, recycling it
into new development and improving existing homes only where it is most effective
to do so.
6.5. A review of average costs per property for maintenance spend demonstrates that a
newer property costs only 75% of the level of an older property to maintain, as can
be seen in the chart below. (Note: 1940-49 represents a statistical outlier due to the
exceptionally low proportion of the Association’s homes that were built in this decade
covering WWII and the subsequent austerity period):

Document File Name : F:\Administration\Committees\Executive Committee\2017\2017-09-21\2017-09-21 Agenda Item 4 - DAMHA VfM Statement 2017.docx
6.6. High standards can bring extra cost, however our Executive Committee believe that
given the vulnerable nature of many of the Association’s residents, it is appropriate
that repairs are undertaken to a high standard. Mitigating strategies are in place
however (for instance, due to the structure of the network of contractors employed
and their management, it costs the Association no more to undertake an urgent
repair during working hours, than a routine one).
6.7. New methodologies are always being reviewed for their potential to leverage
efficiency gains, however.
6.8. In recent years, the Association has undertaken a large project to replace and
improve boilers in properties. As part of this project the Association sought
membership of a procurement partnership to reduce the unit costs of boilers
installed. However, in this case it was found that the additional administrative costs
of implementing the partnership outweighed any savings achieved in purchase price,
and moving forward, the Association has returned to traditional tendering procedures
for future work.
6.9. Currently the Association is restructuring its Asset Management and Procurement
functions so that greater information sharing can take place and processes can be
reviewed for their success, or otherwise, on a more timely basis. At the time of
writing this review last year, it was anticipated that the restructuring would be
complete within the 2016-17 financial year, however as the task ended up being
somewhat more complex than initially envisaged, it remains only partially complete,
with recruitment into two new posts still being outstanding.
7. Summary
7.1. This is the fourth VfM Statement produced by the Association, and the third under
the VfM Strategy adopted by the Association in February 2014. It sets out the way in
which the VfM Strategy is being delivered and some of the hurdles crossed in the
way, as well as those areas where improvements can be made. It also sets out the
way in which the Association seeks to allocate resources in order to deliver the

Document File Name : F:\Administration\Committees\Executive Committee\2017\2017-09-21\2017-09-21 Agenda Item 4 - DAMHA VfM Statement 2017.docx
objectives of its Corporate Plan, while delivering efficient procurement and aspiring to
objectives set out in the Association’s new VfM Strategy outlined in May 2017.
7.2. Whilst a high level of satisfaction is delivered, and under the STAR survey
demonstrates a higher proportion of residents who consider the Association’s services
to be Value for Money than ever before, there is no room for complacency, and
ongoing attention is focussed on ensuring the Association’s good position is
maintained within straitened financial circumstances for the sector and against
ongoing uncertainties within the weekly charge setting environment in the medium
term.

Customer Charter Report Mar 2017
Document File Name :
F:\Administration\Committees\Executive Committee\2017\2017-09-21\2017-09-21 Agenda Item 4 - DAMHA VfM Statement
2017 - Appendix 1 - Customer charter report.docx
Appendix 1
Actuals Current Period
Target Last Year End
Current Period
Resident Involvement & Empowerment Telephone calls answered within 15 seconds 99.9% 99.3% 98.0%
Housing applications sent out within one working day 99.9% 99.6% 100.0%
Written correspondence responded to within 5 working days 95.0% 95.2% 95.0%
Telephone messages responded to by following working day 92.0% 97.5% 95.0%
Complaints handled according to procedure 100.0% 100.0% 100.0%
Residents given a minimum of 10 days from receipt of keys to beginning of licence
100.0% 100.0% 100.0%
Home Emergency repairs completed in target 99.87% 99.89% 99.00%
Urgent repairs completed in target 99.56% 98.50% 99.00%
Routine repairs completed in target 99.74% 99.60% 99.00%
Appointments kept (where made) 99.90% 99.60% 100.00%
Re-let properties will meet re-let standard 100.0% 100.0% 100.0%
Neighbourhood & Community Re-let time excluding complex voids 36.5 days 25.4 days 32.0 days
ASB incidents dealt with in accordance with policy 100.0% 100.0% 100.0%

Qua
rter
ly P
ersp
ectiv
e Su
mm
ary
@ 3
1.3.
17Age
nda
Item
5
Mea
sure
Des
crip
tion
Targ
etR
esul
tM
etPr
dYr
LPI0
21 -
Em
erge
ncy
repa
irs
com
plet
ed in
targ
etH
ofH
99.0
0%99
.89%
LPI0
24 -
Urg
ent r
epai
rs
com
plet
ed in
targ
etH
ofH
99.0
0%98
.50%
LPI0
27 -
Rou
tine
repa
irs
com
plet
ed in
targ
etH
ofH
99.0
0%99
.60%
LPI0
30 -
Voi
d re
pairs
co
mpl
eted
in ta
rget
Hof
H99
.00%
99.4
2%
LPI0
33 -
Pos
t ins
pect
ions
ca
rrie
d ou
tH
ofH
10.0
0%16
.07%
LPI0
34 -
Pos
t ins
pect
ions
ca
rrie
d ou
tH
ofH
860
1,26
1
LPI0
35 -
App
oint
men
ts k
ept
(whe
re m
ade)
Hof
H10
0.00
%99
.60%
CA
1 To
pla
ce re
side
nts
at th
e he
art o
f eve
ryth
ing
we
do a
nd p
rovi
de a
n ap
prop
riate
hig
h qu
ality
and
con
tinua
lly im
prov
ing
serv
ice
Ass
et M
anag
emen
t ->
Rep
airs
& m
aint
enan
ceS
ervi
ce q
ualit
y
Hou
sing
Man
agem
ent -
> Le
tting
s
Obj
ectiv
eO
wne
rLa
test
Dat
aTr
ends
Com
men
ts
Ser
vice
qua
lity
LPI0
17 -
BM
E le
tting
sH
ofH
10
LPI0
36 -
Ove
rall
resi
dent
sa
tisfa
ctio
nH
ofH
94.4
0%94
.50%
LPI0
37 -
Rep
airs
sat
isfa
ctio
nH
ofH
90.0
0%91
.60%
LPI0
38 -
New
hom
es
satis
fact
ion
Hof
H90
.00%
92.5
0%
LPI0
39 -
Ada
ptat
ions
sa
tisfa
ctio
nH
ofH
90.0
0%91
.50%
LPI0
40 -
Res
iden
t bei
ng k
ept
info
rmed
sat
isfa
ctio
nH
ofH
93.0
0%93
.20%
Hou
sing
Man
agem
ent -
> Se
rvic
e im
prov
emen
tS
ervi
ce q
ualit
y
Hou
sing
Man
agem
ent -
> Le
tting
s

LPI0
41 -
Gro
unds
m
aint
enan
ce s
atis
fact
ion
Hof
H77
.00%
70.2
0%
LPI0
42 -
Gas
ser
vici
ng
satis
fact
ion
Hof
H95
.00%
91.4
0%
LPI0
43 -
Letti
ngs
satis
fact
ion
Hof
H92
.00%
88.4
0%
LPI0
44 -
Out
of h
ours
repa
irs
satis
fact
ion
Hof
H90
.00%
87.5
0%
LPI0
45 -
Impr
ovem
ent w
orks
sa
tisfa
ctio
nH
ofH
90.0
0%91
.00%
LPI0
19 -
Ave
rage
SA
P ra
ting
Hof
H77
.578
.8
LPI0
20 -
Faili
ng d
ecen
t ho
mes
sta
ndar
dH
ofH
0 dw
ellin
gs0
dwel
lings
LPI0
22 -
Num
ber o
f em
erge
ncy
repa
irsH
ofH
1,60
01,
745
LPI0
25 -
Num
ber o
f urg
ent
repa
irsH
ofH
1,24
893
5
LPI0
28 -
Num
ber o
f rou
tine
repa
irsH
ofH
2,60
02,
766
Ass
et M
anag
emen
t ->
Rep
airs
& m
aint
enan
ceS
tock
qua
lity
CA
2 To
impr
ove
cond
ition
and
mar
keta
bilit
y of
exi
stin
g ho
mes
with
in a
bro
ader
ass
et m
anag
emen
t str
ateg
y
LPI0
31 -
Num
ber o
f voi
d re
pairs
Hof
H1,
000
865
LPI0
54 -
Tota
l num
ber o
f re
pairs
Hof
H6,
020
6,31
1
LPI0
13 -
GN
dw
ellin
gs v
acan
t an
d av
aila
ble
to le
tH
ofH
0.50
%1.
20%
No
cont
rol o
ver w
hen
licen
ses
are
term
inat
ed.
Maj
ority
are
stil
l dea
ths
and
mov
ing
into
resi
dent
ial c
are.
LPI0
14 -
Dw
ellin
gs v
acan
t an
d un
avai
labl
e to
let
Hof
H0.
50%
0.17
%
LPI0
15 -
Re-
let t
ime
excl
udin
g co
mpl
ex v
oids
Hof
H32
.0 d
ays
25.4
day
s
LPI0
16 -
Tena
ncy
turn
over
Hof
H10
.00%
7.19
%
Hou
sing
Man
agem
ent -
> Le
tting
sS
tock
qua
lity

LPI0
46 -
GN
dw
ellin
gsH
ofH
1,60
0 dw
ellin
gs1,
643
dwel
lings
LPI0
47 -
OP
dw
ellin
gsH
ofH
26 d
wel
lings
26 d
wel
lings
LPI0
48 -
She
ltere
d dw
ellin
gsH
ofH
61 d
wel
lings
61 d
wel
lings
LPI0
49 -
New
ly d
evel
oped
Hof
H5
dwel
lings
0 dw
ellin
gsU
shaw
Moo
r dev
elop
men
t of
5 de
laye
d un
til 2
017/
18LP
I050
- S
ales
Hof
H3
dwel
lings
3 dw
ellin
gsLP
I051
- M
obili
ty s
tand
ard
dwel
lings
Hof
H40
.00%
42.7
0%
LPI0
52 -
Whe
elch
air u
ser
stan
dard
dw
ellin
gsH
ofH
1.00
%1.
05%
LPI0
23 -
Cos
t of e
mer
genc
y re
pairs
Hof
H£1
60,0
00£1
66,0
27Th
ere
was
an
unde
rspe
nd o
n th
e ov
eral
l bud
get f
or re
pairs
th
e fa
ilure
is d
ue to
the
way
th
e bu
dget
was
app
ortio
ned
acro
ss th
e ca
tego
ries
Ass
et M
anag
emen
t ->
Rep
airs
& m
aint
enan
ceV
iabi
lity
CA
3 To
incr
ease
the
bala
nce
of tw
o be
droo
m s
tock
and
del
iver
qua
lity,
wel
l des
igne
d an
d en
ergy
effi
cien
t hom
es, t
hat c
ontr
ibut
e to
the
Reg
iona
l Hou
sing
Str
ateg
y
Fina
nce
and
Adm
inis
trat
ion
-> A
dmin
istr
atio
nS
tock
qua
ntity
CA
5 To
ens
ure
the
Ass
ocia
tion
is v
iabl
e, w
ell m
anag
ed a
nd p
rovi
des
equa
l opp
ortu
nies
for a
ll
acro
ss th
e ca
tego
ries
LPI0
26 -
Cos
t of u
rgen
t re
pairs
Hof
H£1
06,9
80£8
2,00
0
LPI0
29 -
Cos
t of r
outin
e re
pairs
Hof
H£3
28,0
00£2
90,3
37
LPI0
32 -
Cos
t of v
oid
repa
irsH
ofH
£260
,000
£288
,831
Ther
e w
as a
n un
ders
pend
on
the
over
all b
udge
t for
repa
irs
the
failu
re is
due
to th
e w
ay
the
budg
et w
as a
ppor
tione
d ac
ross
the
cate
gorie
s
LPI0
55 -
Tota
l cos
t of r
epai
rsH
ofH
£828
,292
£827
,199
Fina
nce
and
Adm
inis
trat
ion
-> A
dmin
istr
atio
n
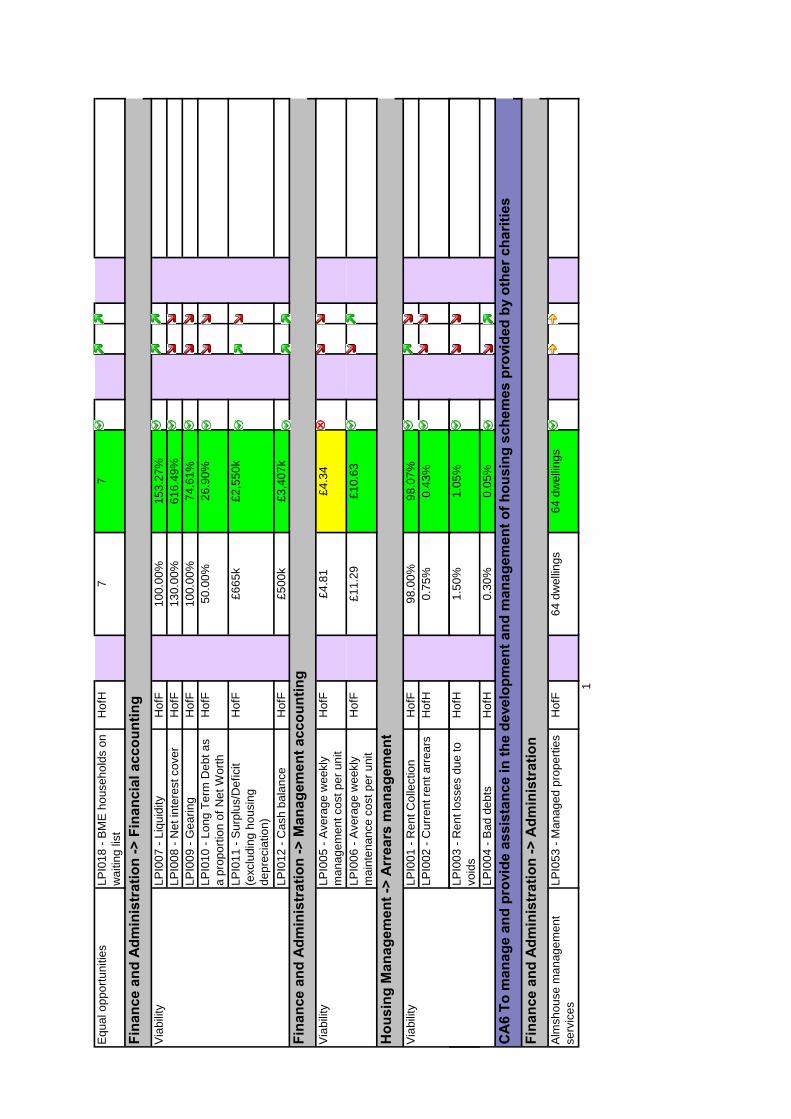
Equ
al o
ppor
tuni
ties
LPI0
18 -
BM
E h
ouse
hold
s on
w
aitin
g lis
tH
ofH
77
LPI0
07 -
Liqu
idity
Hof
F10
0.00
%15
3.27
%LP
I008
- N
et in
tere
st c
over
Hof
F13
0.00
%61
6.49
%LP
I009
- G
earin
gH
ofF
100.
00%
74.6
1%LP
I010
- Lo
ng T
erm
Deb
t as
a pr
opor
tion
of N
et W
orth
Hof
F50
.00%
26.9
0%
LPI0
11 -
Sur
plus
/Def
icit
(exc
ludi
ng h
ousi
ng
depr
ecia
tion)
Hof
F£6
65k
£2,5
50k
LPI0
12 -
Cas
h ba
lanc
eH
ofF
£500
k£3
,407
k
LPI0
05 -
Ave
rage
wee
kly
man
agem
ent c
ost p
er u
nit
Hof
F£4
.81
£4.3
4
LPI0
06 -
Ave
rage
wee
kly
mai
nten
ance
cos
t per
uni
tH
ofF
£11.
29£1
0.63
LPI0
01 -
Ren
t Col
lect
ion
Hof
F98
.00%
98.0
7%LP
I002
- C
urre
nt re
nt a
rrea
rsH
ofH
0.75
%0.
43%
LPI0
03 -
Ren
t los
ses
due
to
Hof
H1.
50%
1.05
%
Hou
sing
Man
agem
ent -
> A
rrea
rs m
anag
emen
tV
iabi
lity
Fina
nce
and
Adm
inis
trat
ion
-> F
inan
cial
acc
ount
ing
Via
bilit
y
Fina
nce
and
Adm
inis
trat
ion
-> M
anag
emen
t acc
ount
ing
Via
bilit
y
LPI0
03 -
Ren
t los
ses
due
to
void
sH
ofH
1.50
%1.
05%
LPI0
04 -
Bad
deb
tsH
ofH
0.30
%0.
05%
Alm
shou
se m
anag
emen
t se
rvic
esLP
I053
- M
anag
ed p
rope
rties
Hof
F64
dw
ellin
gs64
dw
ellin
gs
1
CA
6 To
man
age
and
prov
ide
assi
stan
ce in
the
deve
lopm
ent a
nd m
anag
emen
t of h
ousi
ng s
chem
es p
rovi
ded
by o
ther
cha
ritie
s
Fina
nce
and
Adm
inis
trat
ion
-> A
dmin
istr
atio
n

Housemark NE, Yorks Humberside Benchmark Club Survey 31st March 2017
Appendix 3
PIOrganisation
Count
Organisation
Value
Organisation
Rank
Organisation
Quartile
Group
Upper
QuartileLower Quartile
Peer
group
median
Adjusted turnover - central overheads % 28 5.75 14 2 4.95 7.24 5.78
Adjusted turnover - finance costs % 28 2.61 21 3 1.46 2.73 2.22Adjusted turnover - IT & communications costs % 28 2.31 13 2 2.01 2.94 2.52Adjusted turnover - office premises costs (excluding notional office rent) % 28 0.55 2 1 1.06 1.86 1.46Appointments kept as % of appointments made 16 99.65 3 1 98.94 92.04 95.42Average number of calendar days taken to complete repairs 21 6.02 5 1 6.14 9.71 7.35Average number of working days/shifts lost due to sickness absence per employee 24 7.74 7 2 7.65 10.94 9.46Average re-let time in days (standard re-lets) 18 25.40 14 3 14.84 25.40 21.25Average SAP rating of self-contained dwellings at the end of the year 20 78.80 1 1 73.09 70.00 71.55Cost per property - total Anti-Social Behaviour (includes overheads) 28 11.90 1 1 49.72 70.78 60.14Cost per property - total Cyclical Maintenance (includes overheads) 28 188.19 9 2 170.03 309.74 232.65Cost per property - total Cyclical Maintenance (Management) (includes overheads) 28 24.24 7 1 24.82 67.90 38.57Cost per property - total Cyclical Maintenance (Service Provision) (includes overheads) 28 163.94 10 2 142.87 253.86 195.53Cost per property - total Estate Services (includes overheads) 28 136.80 5 1 148.88 269.77 214.00Cost per property - total Housing Management (includes overheads) 28 308.70 1 1 443.05 614.04 532.42Cost per property - total Lettings (includes overheads) 28 97.63 17 3 73.42 132.28 91.34Cost per property - total Major Works & Cyclical Maintenance (includes overheads) 28 861.52 5 1 957.83 1,379.07 1,204.73Cost per property - total Major Works (includes overheads) 28 673.34 7 1 688.11 1,158.13 960.35Cost per property - total Major Works (Management) (includes overheads) 28 40.13 3 1 51.68 117.32 81.24Cost per property - total Major Works (Service Provision) (includes overheads) 28 633.21 8 2 630.92 1,072.29 826.10Cost per property - total Rent Arrears & Collection (includes overheads) 28 99.24 1 1 141.75 194.90 161.81Cost per property - total Resident Involvement (includes overheads) 28 36.71 4 1 46.29 98.93 75.81Cost per property - total Resp. Repairs (Management) (includes overheads) 28 131.37 12 2 108.90 210.85 140.32Cost per property - total Resp. Repairs (Service Provision) (includes overheads) 28 391.96 16 3 319.30 456.40 371.58Cost per property - total Responsive Repairs & Void Works (includes overheads) 28 744.79 10 2 693.01 872.09 770.58Cost per property - total Tenancy Management (includes overheads) 28 63.21 2 1 99.41 134.26 122.01Cost per property - total Void Works (Management) (includes overheads) 28 32.70 5 1 35.96 79.08 65.40Cost per property - total Void Works (Service Provision) (includes overheads) 28 188.76 13 2 134.94 222.43 197.32Evictions due to rent arrears as a % of all tenancies 20 0.00 1 1 0.26 0.54 0.41Number of tenancies terminated as % of properties managed 20 7.95 8 2 7.09 9.77 8.16Overhead costs (excluding notional office rent) % turnover 28 11.23 13 2 10.44 14.23 12.17Percentage of dwellings with a valid gas safety certificate 23 99.94 19 4 100.00 99.99 100.00Percentage of properties vacant and available to let 21 1.22 20 4 0.33 1.03 0.59Percentage of properties vacant but unavailable to let 22 0.17 9 2 0.08 0.88 0.31Percentage of repairs completed at the first visit 15 85.97 12 4 91.46 85.99 88.69Percentage of residents very or fairly satisfied with the repairs service they received 20 91.60 13 3 98.20 89.00 94.45Percentage of staff turnover in the year 23 8.06 4 1 9.37 24.89 19.29Rent arrears of current and former tenants as % of rent due (excluding voids) 22 2.46 4 1 3.01 5.22 4.32Rent arrears of current and former tenants written-off as % rent due 23 0.05 3 1 0.10 0.76 0.52Rent arrears of current tenants as % rent due (excluding voids) 23 2.34 7 2 2.27 3.98 2.62Rent arrears of former tenants as % rent due (excluding voids) 22 0.12 1 1 0.54 1.80 1.30Rent collected from current and former tenants as % rent due (excluding arrears b/f) 23 96.82 23 4 100.20 99.36 99.98Rent loss due to empty properties (voids) as % rent due 23 1.03 15 3 0.51 1.12 0.84Satisfaction - % very or fairly satisfied that their rent provides value for money (GN & HfOP) 23 92.50 2 1 86.50 82.20 84.00Satisfaction - % very or fairly satisfied that their views are being listened to and acted upon (GN & HfOP) 23 78.70 7 2 79.00 70.80 76.00Satisfaction - % very or fairly satisfied with repairs and maintenance (GN & HfOP) 23 92.80 2 1 87.05 79.20 83.00Satisfaction - % very or fairly satisfied with the overall quality of their home (GN & HfOP) 23 95.70 1 1 89.00 84.95 87.00Satisfaction - % very or fairly satisfied with the service provided (GN & HfOP) 24 94.50 3 1 91.55 84.30 89.00Satisfaction - % very or fairly satisfied with their neighbourhood as a place to live (GN & HfOP) 23 97.30 1 1 88.00 84.10 86.90Total cyclical maintenance (management) costs as % of total cyclical maintenance (service provision) costs 28 14.79 7 1 14.87 30.81 21.44Total major works (management) costs as % of total major works (service provision) costs 28 6.34 7 1 6.76 12.46 9.53Total responsive repairs (management) costs as % of total responsive repairs (service provision) costs 28 33.52 12 2 27.60 57.61 38.43Total void works (management) costs as % of total void works (service provision) costs 28 17.32 7 1 18.00 45.91 32.37
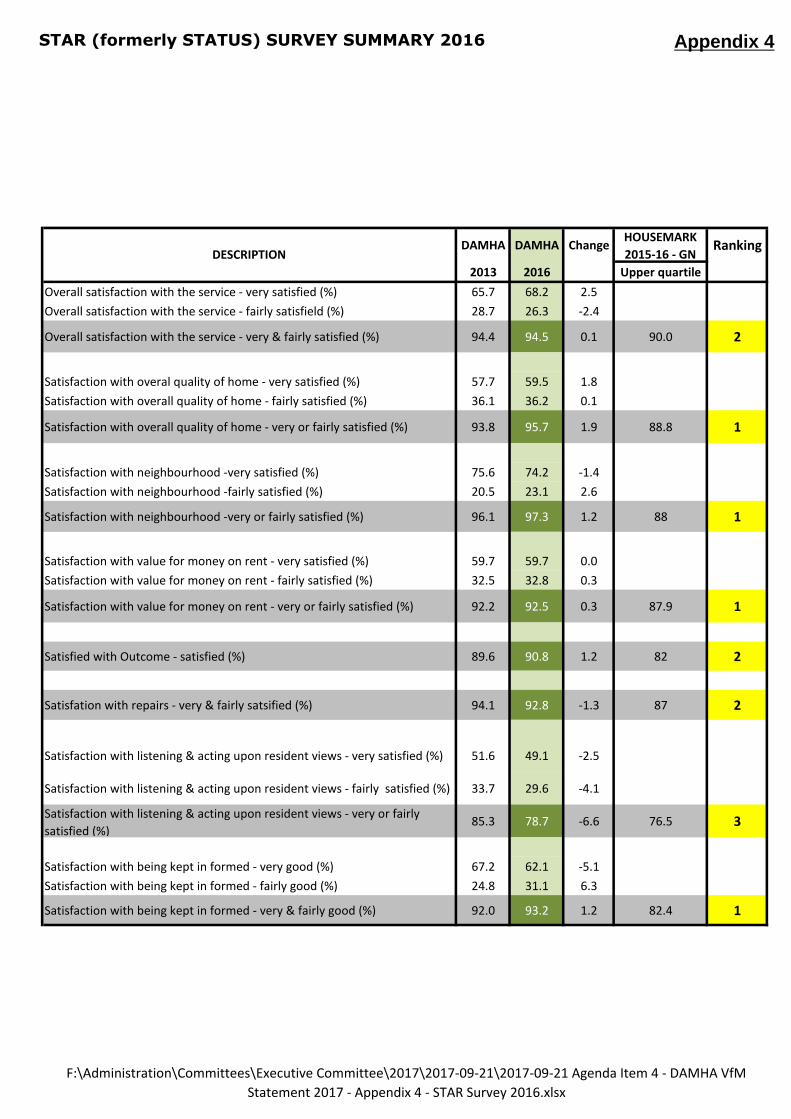
STAR (formerly STATUS) SURVEY SUMMARY 2016 Appendix 4
DAMHA DAMHA ChangeHOUSEMARK
2015-16 - GNRanking
2013 2016 Upper quartile
Overall satisfaction with the service - very satisfied (%) 65.7 68.2 2.5
Overall satisfaction with the service - fairly satisfield (%) 28.7 26.3 -2.4
Overall satisfaction with the service - very & fairly satisfied (%) 94.4 94.5 0.1 90.0 2
Satisfaction with overal quality of home - very satisfied (%) 57.7 59.5 1.8
Satisfaction with overall quality of home - fairly satisfied (%) 36.1 36.2 0.1
Satisfaction with overall quality of home - very or fairly satisfied (%) 93.8 95.7 1.9 88.8 1
Satisfaction with neighbourhood -very satisfied (%) 75.6 74.2 -1.4
Satisfaction with neighbourhood -fairly satisfied (%) 20.5 23.1 2.6
Satisfaction with neighbourhood -very or fairly satisfied (%) 96.1 97.3 1.2 88 1
Satisfaction with value for money on rent - very satisfied (%) 59.7 59.7 0.0
Satisfaction with value for money on rent - fairly satisfied (%) 32.5 32.8 0.3
Satisfaction with value for money on rent - very or fairly satisfied (%) 92.2 92.5 0.3 87.9 1
Satisfied with Outcome - satisfied (%) 89.6 90.8 1.2 82 2
Satisfation with repairs - very & fairly satsified (%) 94.1 92.8 -1.3 87 2
Satisfaction with listening & acting upon resident views - very satisfied (%) 51.6 49.1 -2.5
Satisfaction with listening & acting upon resident views - fairly satisfied (%) 33.7 29.6 -4.1
Satisfaction with listening & acting upon resident views - very or fairly
satisfied (%)85.3 78.7 -6.6 76.5 3
Satisfaction with being kept in formed - very good (%) 67.2 62.1 -5.1
Satisfaction with being kept in formed - fairly good (%) 24.8 31.1 6.3
Satisfaction with being kept in formed - very & fairly good (%) 92.0 93.2 1.2 82.4 1
DESCRIPTION
F:\Administration\Committees\Executive Committee\2017\2017-09-21\2017-09-21 Agenda Item 4 - DAMHA VfM
Statement 2017 - Appendix 4 - STAR Survey 2016.xlsx
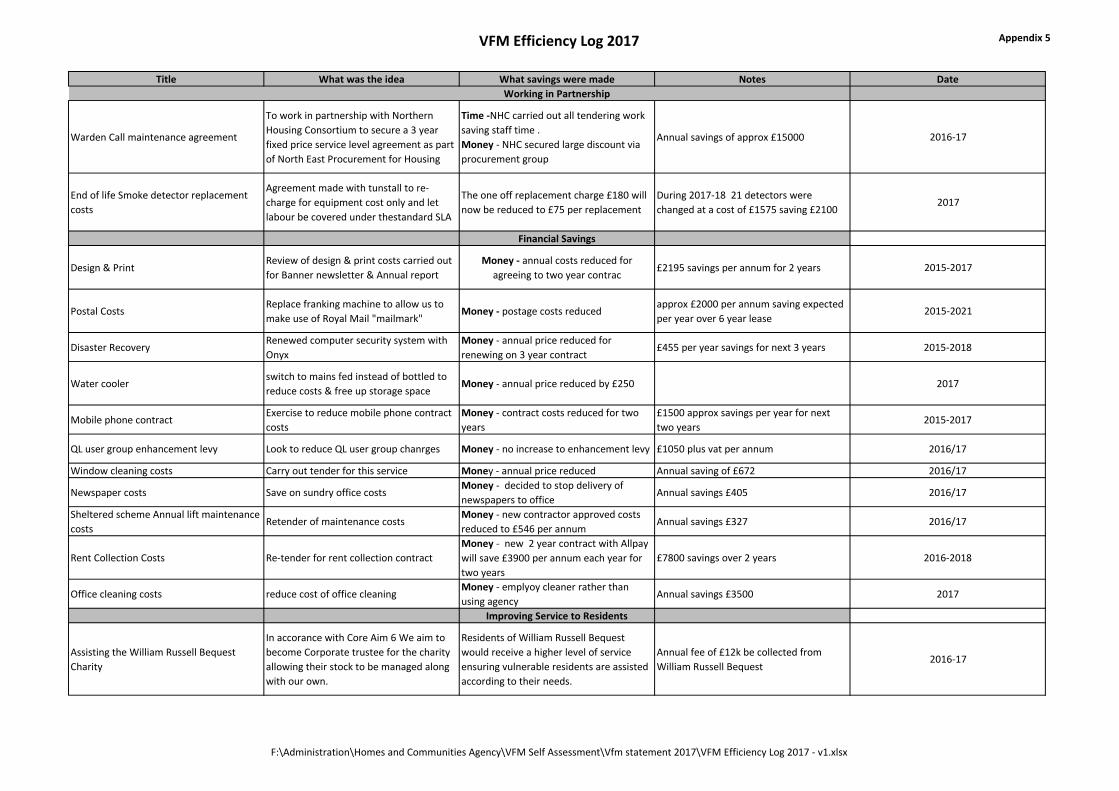
VFM Efficiency Log 2017 Appendix 5
Title What was the idea What savings were made Notes Date
Working in Partnership
Warden Call maintenance agreement
To work in partnership with Northern
Housing Consortium to secure a 3 year
fixed price service level agreement as part
of North East Procurement for Housing
Time -NHC carried out all tendering work
saving staff time .
Money - NHC secured large discount via
procurement group
Annual savings of approx £15000 2016-17
End of life Smoke detector replacement
costs
Agreement made with tunstall to re-
charge for equipment cost only and let
labour be covered under thestandard SLA
The one off replacement charge £180 will
now be reduced to £75 per replacement
During 2017-18 21 detectors were
changed at a cost of £1575 saving £21002017
Financial Savings
Design & PrintReview of design & print costs carried out
for Banner newsletter & Annual report
Money - annual costs reduced for
agreeing to two year contrac£2195 savings per annum for 2 years 2015-2017
Postal CostsReplace franking machine to allow us to
make use of Royal Mail "mailmark"Money - postage costs reduced
approx £2000 per annum saving expected
per year over 6 year lease2015-2021
Disaster RecoveryRenewed computer security system with
Onyx
Money - annual price reduced for
renewing on 3 year contract£455 per year savings for next 3 years 2015-2018
Water coolerswitch to mains fed instead of bottled to
reduce costs & free up storage spaceMoney - annual price reduced by £250 2017
Mobile phone contractExercise to reduce mobile phone contract
costs
Money - contract costs reduced for two
years
£1500 approx savings per year for next
two years2015-2017
QL user group enhancement levy Look to reduce QL user group chanrges Money - no increase to enhancement levy £1050 plus vat per annum 2016/17
Window cleaning costs Carry out tender for this service Money - annual price reduced Annual saving of £672 2016/17
Newspaper costs Save on sundry office costsMoney - decided to stop delivery of
newspapers to officeAnnual savings £405 2016/17
Sheltered scheme Annual lift maintenance
costsRetender of maintenance costs
Money - new contractor approved costs
reduced to £546 per annumAnnual savings £327 2016/17
Rent Collection Costs Re-tender for rent collection contract
Money - new 2 year contract with Allpay
will save £3900 per annum each year for
two years
£7800 savings over 2 years 2016-2018
Office cleaning costs reduce cost of office cleaningMoney - emplyoy cleaner rather than
using agencyAnnual savings £3500 2017
Improving Service to Residents
Assisting the William Russell Bequest
Charity
In accorance with Core Aim 6 We aim to
become Corporate trustee for the charity
allowing their stock to be managed along
with our own.
Residents of William Russell Bequest
would receive a higher level of service
ensuring vulnerable residents are assisted
according to their needs.
Annual fee of £12k be collected from
William Russell Bequest2016-17
F:\Administration\Homes and Communities Agency\VFM Self Assessment\Vfm statement 2017\VFM Efficiency Log 2017 - v1.xlsx

VFM Efficiency Log 2017 Appendix 5
Assisting the Vesper House Charity
In accorance with Core Aim 6 We aim to
become Corporate trustee for the charity
allowing their stock to be managed along
with our own.
Residents of Vesper House would receive
a higher level of service ensuring
vulnerable residents are assisted
according to their needs.
Annual fee of £5k be collected from
Vesper House2016-17
F:\Administration\Homes and Communities Agency\VFM Self Assessment\Vfm statement 2017\VFM Efficiency Log 2017 - v1.xlsx

Document File Name :
F:\Administration\Committees\Executive Committee\2017\2017-09-21\2017-09-21 Agenda Item 4 - DAMHA VfM
Statement 2017 - Appendix 6 - HCA benchmark.docx
HCA Benchmarked cost data
2017
%
change 2016
%
change 2015
National
Quartile
%
change 2014
Social
Housing Units 1763 (0.28%) 1768 1.43% 1743 n/a 0.06% 1742
Headline
Total Social
Housing CPU
(£k)
2.82 (3.84%) 2.93 5.97% 2.77 Lower 2.28% 2.71
Management
CPU (£k) 0.47 (4.08%) 0.49 (2.76%) 0.51 Lower 3.10% 0.49
Service
charge CPU
(£k)
0.11 (21.43%) 0.14 (4.20%) 0.14 Lower (6.82%) 0.15
Maintenance
CPU (£k) 1.12 (8.20%) 1.22 (1.60%) 1.24 Upper 2.12% 1.21
Major Repairs
CPU (£k) 0.69 27.38% 0.54 9.93% 0.49 Lower 13.38% 0.43
Other social
housing CPU
(£k)
0.46 4.72% 0.43 (0.00%) 0.43 Lower (1.90%) 0.44
Appendix 6


