Journal of ~ccu~a~~o~u~ Accidents, 9 (1987) 161-175 Elsevier Science Publishers B.V., Amsterdam - Printed in The Netherlands 161 Dust Explosion experiments iu a Vented 236 m3 Silo Cell* R. K. ECKHOFF, K. FUHRE and G. H. PEDERSEN Chr. ~~c~e~en Zns~i~ute, Bergen (Norway) (Received 25 February 1987; accepted 7 April 1987) ABSTRACT Eckhoff, R. K., Fuhre, K. and Pedersen, G. H., 1987. Dust explosion experiments in a vented 236 m3 silo cell. Journal of Occupational Accidents, 9: 161-175. The influence of dust concentration and location of the ignition point, on flame propagation and pressure development, has been studied in a series of vented maize starch explosions in a new 236 m3 steel silo, constructed specially for dust explosion experiments. The investigation consti- tutes a continuation of the experiments in a 500 m3 silo, reported previously. However, the new silo of height 22 m has a diameter of 3.7 m, and thus L/l?=6, whereas the 500 rn' silo had L/D= 4. Explosible clouds of maize starch were generated in the silo by conventional pneumatic injection, either at the top or at the bottom of the silo. Two vent areas of either 3.4 or 5.7 m’, were used. The most explosible dust concentration was found to be 400-500 g/m”. The average minimum explosible concentration was about 100 g/m3. The experiments confirmed that for explosions in large, slim silos, vented at the top, the max- imum explosion pressure depends strongly on the vertical distance between the vent and the ig- nition point further down. Therefore no straight-forward correlation between vent area and maximum explosion pressure exists. Ignition close to the silo bottom generated pressures exceed- ing 1 bar (g) and flame speeds exceeding 100 m/s, whereas ignition close to the vent at the silo top gave only marginal pressures, of the order of lo-20 mbar (g), and flame speeds of a few m/s. Realistic sizing of vents for slim silos must imply identification of likely ignition source loca- tions and be performed within an overall context of risk assessment. REALISTIC FULL-SCALE VENTED DUST EXPLOSION EXPERIMENTS ARE NEEDED From a theoretical point of view, dust explosion venting is a very complex process, and no adequate theory exists. Realistic full-scale experimentation therefore still seems to be the most beneficial means of obtaining further in- sight of practical value to industry (Eckhoff, 1982), In coal mine explosion research, experiments under realistic dust cloud gen- *Paper presented at the 5th International Symposium on Loss Prevention and Safety Promotion in the Process Industries, Cannes, France, September 15-19,1986. 0376-6349/87/$03.50 0 1987 Elsevier Science Publishers B.V.
Transcript
Journal of ~ccu~a~~o~u~ Accidents, 9 (1987) 161-175 Elsevier Science Publishers B.V., Amsterdam - Printed in The Netherlands
161
Dust Explosion experiments iu a Vented 236 m3 Silo Cell*
R. K. ECKHOFF, K. FUHRE and G. H. PEDERSEN
Chr. ~~c~e~en Zns~i~ute, Bergen (Norway)
(Received 25 February 1987; accepted 7 April 1987)
ABSTRACT
Eckhoff, R. K., Fuhre, K. and Pedersen, G. H., 1987. Dust explosion experiments in a vented 236 m3 silo cell. Journal of Occupational Accidents, 9: 161-175.
The influence of dust concentration and location of the ignition point, on flame propagation and pressure development, has been studied in a series of vented maize starch explosions in a new 236 m3 steel silo, constructed specially for dust explosion experiments. The investigation consti- tutes a continuation of the experiments in a 500 m3 silo, reported previously. However, the new silo of height 22 m has a diameter of 3.7 m, and thus L/l?=6, whereas the 500 rn' silo had L/D= 4. Explosible clouds of maize starch were generated in the silo by conventional pneumatic injection, either at the top or at the bottom of the silo. Two vent areas of either 3.4 or 5.7 m’, were used.
The most explosible dust concentration was found to be 400-500 g/m”. The average minimum explosible concentration was about 100 g/m3.
The experiments confirmed that for explosions in large, slim silos, vented at the top, the max- imum explosion pressure depends strongly on the vertical distance between the vent and the ig- nition point further down. Therefore no straight-forward correlation between vent area and maximum explosion pressure exists. Ignition close to the silo bottom generated pressures exceed- ing 1 bar (g) and flame speeds exceeding 100 m/s, whereas ignition close to the vent at the silo top gave only marginal pressures, of the order of lo-20 mbar (g), and flame speeds of a few m/s.
Realistic sizing of vents for slim silos must imply identification of likely ignition source loca- tions and be performed within an overall context of risk assessment.
REALISTIC FULL-SCALE VENTED DUST EXPLOSION EXPERIMENTS ARE NEEDED
From a theoretical point of view, dust explosion venting is a very complex process, and no adequate theory exists. Realistic full-scale experimentation therefore still seems to be the most beneficial means of obtaining further in- sight of practical value to industry (Eckhoff, 1982),
In coal mine explosion research, experiments under realistic dust cloud gen-
*Paper presented at the 5th International Symposium on Loss Prevention and Safety Promotion in the Process Industries, Cannes, France, September 15-19,1986.
eration conditions have been conducted in full-scale mine galleries for many years ( Cybulski, 1975).
Dust explosion experiments conducted in a vented 500 rn’+ silo some years ago f Eckhoff and Fuhre, 1984) confirmed the need for realistic experiments. W&h initially quiescent dust clouds, significantly smaller vent areas were required to reduce the explosion pressure to a given value, than those specified in the VDI-3673 and NFPA-68 codes (VDI, 1979; NFPA, 1978). However, initial turbulence increased the pressure by at least one order of magnitude, and even beyond the VDI code prediction.
An interesting investigation of vented dust explosions in a cyclone plant, working under conditions of realistic dust cloud generation, has been described by Palmer (1973 ) and Tonkin and Berlemont ( 1972). The experiments revealed that. t,he vent areas required for not exceeding a given maximum pressure, were substantially smaller, by a factor of five or more, than those prescribed by VDI- 3673.
In a recent, similar investigation, Lunn and Cairns (1985) studied the pres- sure build-up during vented dust explosions in a bag filter unit, run as in nor- mal industrial operation. Even in the worst case, with ignition in the bottom hopper section and venting at the top of the filter housing, the explosion pres- sures were significantly lowere than those predicted by VDI-3673. When the vent was located in the rear wall of the housing, close to the point. of ignition, very much lower explosion pressures were generated.
In t,he present contribution attention is focused at explosion of dust clouds, generated by conventional pneumatic conveying, in a large, slim silo of volume 236 rn” and L/D=6, and with a vent in the top surface. A detailed account of the investigation is given elsewhere (Eckhoff et al., 1985).
THE EXPERIMENTAL SILO INSTALLATION
The silo
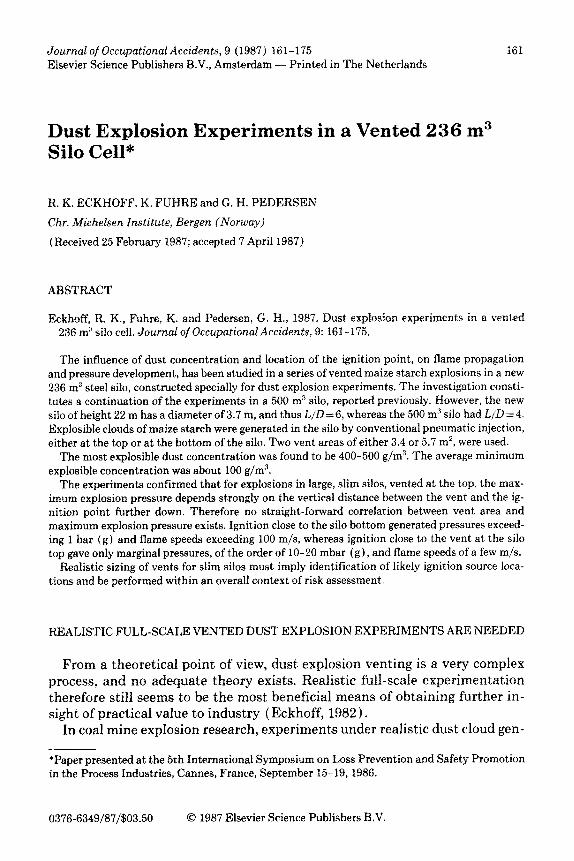
The cylindrical silo of height 22 m and diameter 3.7 m is shown in Fig. 1. The main body, made of 8 mm thick steel plate, all-welded, can withstand at least 5 bar internal overpressure. The silo wall is provided with a number of threaded holes of diameter 85 mm, accessible from a winding staircase, and permitt,ing ignition sources and various types of diagnostic probes to be mounted at desired levels above the silo bottom. A steel grid across the entire silo top, allows any desired part of the top to be blocked by bolting a number of 0.25 m” steel plates to the grid. Thus, varying the vent opening area and shape is easy. In the present investigation two alternative vent openings were used, one square of 5.7 m2 open area, and one rectangular of 3.4 m2 open area.
163
Fig. 1. Vertical section of 236 m3 experimental silo.
The dust injection system
Explosible clouds of maize starch were generated in the silo by blowing the starch into it through a conventional pneumatic conveying line of i.d. 155 mm. Three alternative dust entrance configurations were used: a.
b.
C.
Upwards injection from the bottom, with the conveying pipe exit about 5.5 m above the silo bottom, as shown in Fig. 1. Upwards injection from the bottom, but with the 5 m vertical pipe removed, i.e. with the conveying pipe exit only 0.5 m above the silo bottom. Semi-tangential, horizontal injection at the silo top, with the conveyingpipe exit flush with the silo wall. The injection system consisted of a Roots blower driven by a 55 kW electric
motor. The starch was fed into the pipeline from a 1.5 m3 hopper a few metres downstream of the blower. A conventional rotary lock was used for the feeding process. During feeding, the hopper was sealed and pressurized to balance the overpressure in the conveying line. The steady-state feeding rate of maize starch
164
into the pipe line was about 8-9 kg/s. With no dust in the pipeline the blower yielded 2600 m”/h (standard state). During injection of maize starch the air flow normally dropped to about 2150 m”/h (standard state). Typical average concentrations of dust in the conveying pipe during injection were lo-13 kg/m” ( standard state ) .
In most of the tests the air flow was maintained for the time required to feed all the dust in the hopper into the pipeline, plus a few seconds to clear the pipeline of remaining starch. Then the turbulence in the dust cloud was allowed to dissipate for a few seconds, before activating the ignition source. However, in a few tests the ignition source was activated earlier, whilst dust was still being injected.
The ignition source
The ignition source was the same as that used in the previous 500 rn” exper- iments (Eckhoff and Fuhre, 1984). It consisted of about 50 g of dried nitro- cellulose powder contained in a plastic bag and fired by a pair of electrically ignited Ce-Mg 100 J fuse heads. The special quality of nitrocellulose used (12.3% N ) was chosen so as to prevent any significant blast effects that could disturb the dust cloud, while at the same time the burning was sufficiently fast to produce a momentary and sufficiently large and efficient flame source (approx. 50-100 cm diameter). The flame was fully developed approximately 0.1 s after firing the fuse heads and maintained its full size for approximately 1.0 s. The total energy liberated by the ignition source was about 200,000 J. Due to continued burning of the plastic bag, the ignition source, after the initial main energy release, kept on burning for up to half a minute. Consequently, if no ignition of the maize starch cloud was obtained, and the ignition source had been activated sufficiently early, temporary presence of explosible dust con- centrations in the ignition source region at any instant during the experiment could, due to the prolonged burning of the source, be excluded.
Diagnostic system
Four different types of conventional measurements and observations were made during an explosion experiment: a. Three Kistler No. 7261 pressure transducers, one located 3 m above the silo
bottom, one 9 m above the bottom, and one 2.5 m below the top, were used for measuring the development with time of the explosion pressure inside the silo.
b. Six light attenuation probes, constructed by CM1 on the basis of work done at USBM (Liebman et al., 1977; Conti et al., 1982) and CERL (Gardner and Moore, 1983 ) , were used for continuous monitoring of the dust concen- tration in six different locations in the silo during dust injection. The probes
165
were calibrated in the laboratory by exposing them to clouds of known con- centrations of the same quality of maize starch as used in the silo explosion experiments.
c. Optical transducers (photo-diodes) were employed for measuring flame arrival times at up to six different locations in the silo. In fact, these trans- ducers were identical with the receiver part of the light attenuation probes used for measuring the dust concentration (see b. above).
d. A 16 mm, 64 frame/s camera, remotely operated, was positioned on a steep hillside about 40 m from the silo top, to provide high quality live pictures of selected experiments. Visual recordings of the explosions were also under- taken manually by means of a conventional 25 frame/s video camera. One important objective of this was to determine the delay between the appear- ance of the light flash of a conventional flash bulb mounted outside the silo, synchronised with the firing of the ignition source, and the arrival of the flame front at the vent opening at the top of the silo.
THE MAIZE STARCH USED IN THE EXPERIMENTS
The native maize starch used was of the same batch as that used in the previous 500 m3silo experiments (Eckhoff and Fuhre, 1984). From 1982 to 1985 the starch was stored indoors at CMI.
Gross samples of about 1 1 were taken from a number of bags immediately before emptying the bags into the small storage hopper, from which the dust was discharged into the dust injection system of the silo. The samples were kept in sealed plastic jars and brought to the CM1 laboratory for analysis.
The moisture content, related to weight before drying, and determined by drying for 4 h at about 105 “C, varied between 9.7 and 11.8%, with a mean value of 11.1%. This is slightly higher than the mean value of about 10% found in corresponding samples in 1982 (Eckhoff and Fuhre, 1984).
Size analyses by means of the Alpine air jet sieve revealed that nearly 80% by weight fell in the size range lo-20 ,um, in agreement with the fact that the maize starch is essentially composed of nearly monosized and spherical native grains of mean diameter about 12 pm.
Some maize starch samples were subjected to explosion violence tests in the Hartmann bomb and the 20 1 sphere (Bartknecht, 1978). The gross mean values of (dP/dt) max and P,,,, were 220 bar/s and 5.15 bar (g) in the Hart- mann bomb and 365 bar/s and 7.2 bar (g) in the 20 1 sphere. These values are slightly lower than those measured previously (Eckhoff and Fuhre, 1984)) probably in part due to the slight increase of the moisture content in the dust.
166
RESULTS AND DISCUSSION
Dust concentration distribution
Different dust quantities, ranging from 25 kg to 300 kg, were injected into the silo by all three methods described above. The delay between abrupt ter- mination of dust injection, and activation of the ignition source, was varied from 11.6 s down to negative values, in the case of which the explosion started while dust was still being injected.
In the first 29 experiments, the dust was introduced from the bottom, through the 5 m vertical pipe, i.e. with the injection point about 5.5 m above the silo bottom. The average dust concentration in the jet entering the silo was esti- mated to about 13 kg/m” (standard state).
In the next 18 experiments, the dust was injected through the pipe exit at the top of the silo. With this configuration significant masses of dust accu- mulated in the 21 m vertical pipe and became injected at a later stage. However, if prolonged injection times were used to clear the line completely, the main part of the dust already injected would settle out at the silo bottom to a larger extent than new dust was blown in, and the average concentration would decrease. Therefore it had to be accepted that with dust injection at the silo top, an appreciable fraction of the dust fed into the pneumatic transport line would not take part in the explosion.
Complete series of six measurements of dust concentration by the light attenuation probes were, due to breakdown of the probes by heavy thermal loads during some of the explosions and subsequent fires, only obtained in a limited number of the experiments. As expected, bottom injection through the 5 m vertical pipe tended to give higher dust concentrations in the lower half of the silo than in the upper half. Top injection, as also expected, seemed to gen- erate a more axially even dust concentration distribution.
Explosion pressure development
The three pressure traces, recorded at 3 m, 9 m and 19.5 m above the silo bottom, were normally quite similar, although slightly higher pressure peaks were usually recorded in the bottom part of the silo than further up. On average the peak pressure at 9 m was about 94%, and at 19.5 m about 87%, of the peak at 3 m.
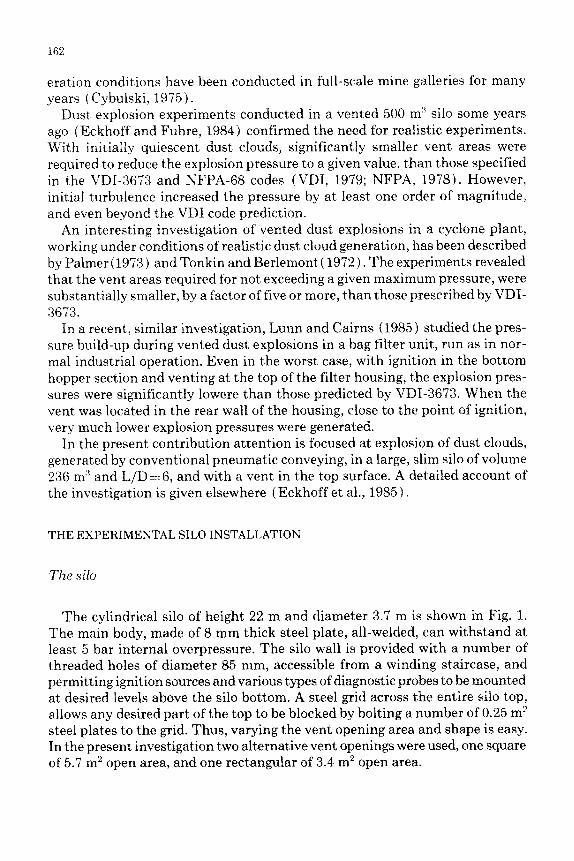
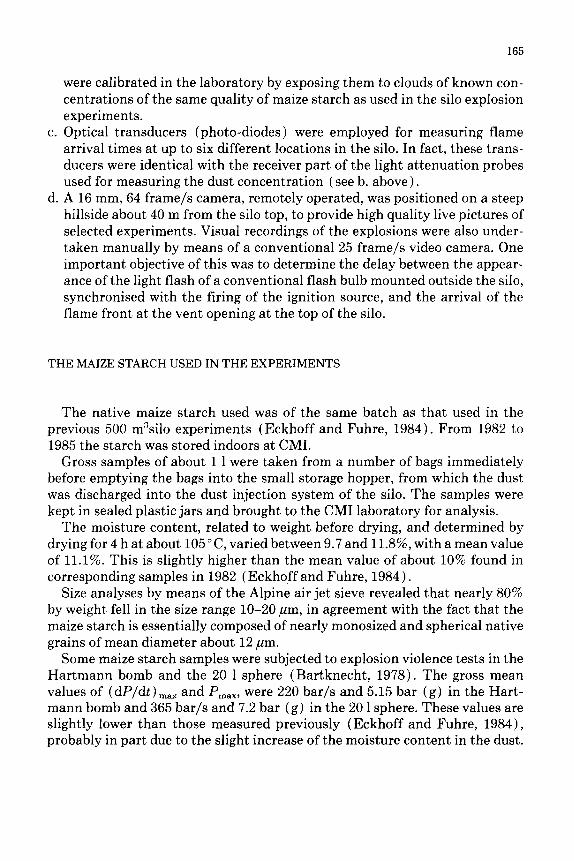
The pressure traces obtained can be grouped in three main categories. The first was those exhibiting a smooth, bell-shaped main pulse, followed by 4-6 Hz oscillations, of considerably smaller amplitudes. Such traces were encoun- tered in the case of bottom ignited explosions of moderate strength. However, occasionally a smooth main pulse was found even in the case of quite strong explosions, as shown in Fig. 2.
167
t IGNITION 0 2 04 06 0.8 10 1.2 (5)
Fig. 2. Example of smooth, bell-shaped pressure pulse followed by oscillations of smaller ampli- tudes. Ignition close to silo bottom.
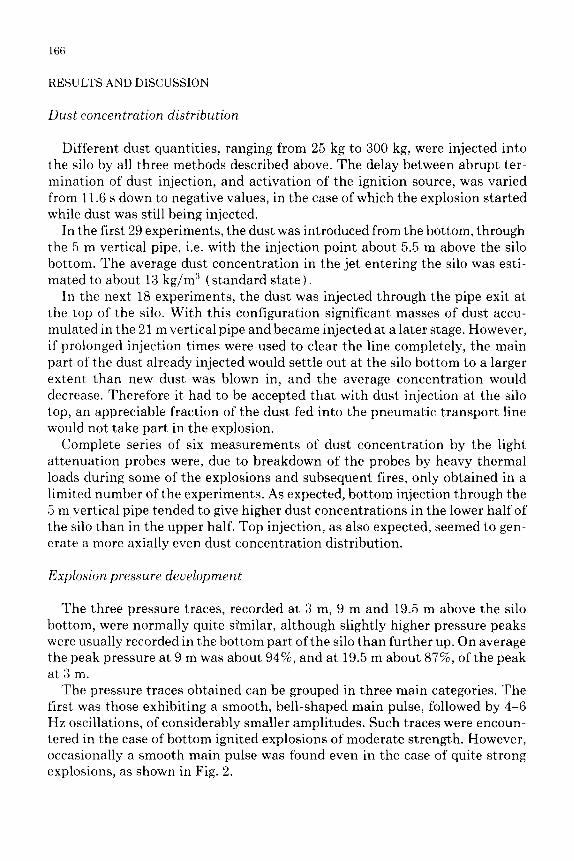
1 500 mbar A Pl
014 0:6 018 IGNITION 0 2 1.0 1.2 1.4 (5)
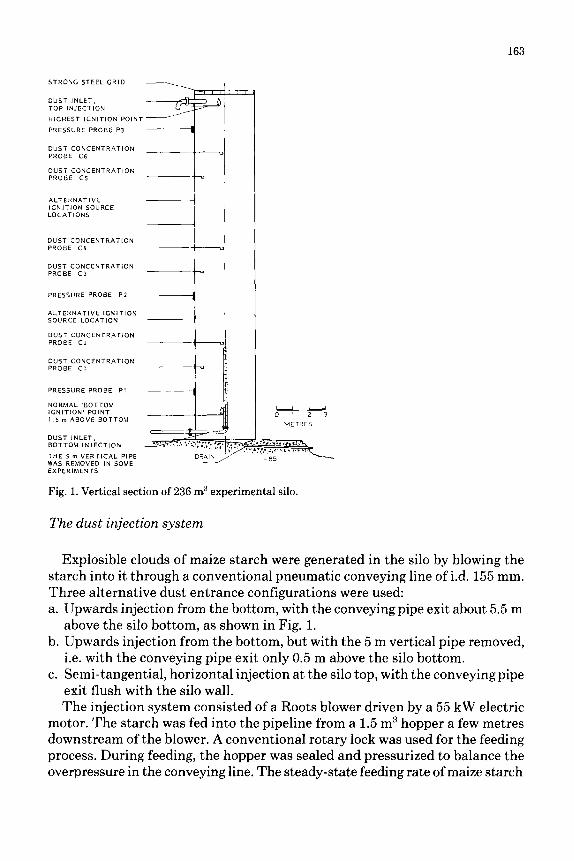
Fig. 3. Example of jagged pressure pulse resulting from ignition 3-6 m above silo bottom.
The second main category of pressure traces, shown in Fig. 3, occurred in the case of the strongest explosions, of peak pressures of 0.8-1.2 bar (g). In these cases a first phase of smooth pressure rise would be abruptly followed by a phase of much steeper rise, leading into a more or less systematic sequence of sharp pressure spikes. In the particular example shown in Fig. 3, the oscil- latory pattern of the spikes is quite regular, making it possible to identify a typical frequency of 17-18 Hz. The physical nature of these rapid oscillations
168
I I , 8 I I 1 I
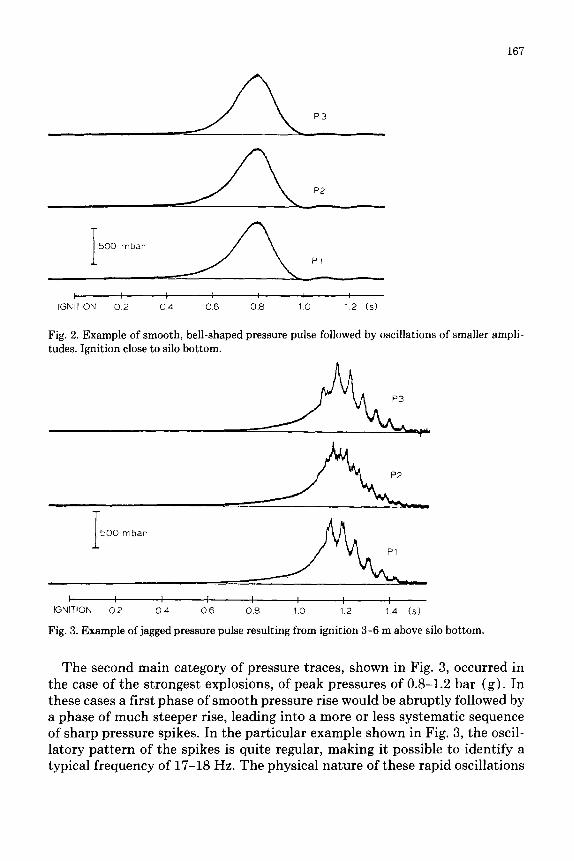
IGNITION 0.5 1.0 15 20 25 (5)
Fig. 4. Example of oscillatory pressure development caused by ignition in upper half of silo (13.5 m above bottom). Oscillations persisted for about 5 s.
has not been fully disclosed. A form of Helmholtz oscillation may be one guess. No doubt this phase of the explosion is due to violent turbulent combustion, starting at about the same time as the flame edge reaches the region of the vent opening. The mechanism for creating the high turbulence level is probably complex. Turbulence will be generated both in the shear layer along the silo wall, when unburnt dust is pushed towards the vent opening by the expanding burning cloud further down in the silo, and in the cloud just below the vent, due to the baffle effect of the edges of the vent opening. The process is likely to be of the same nature as the strong turbulence-induced combustion accel- eration observed in large-scale gas explosions (Eckhoff et al., 1984; Moen et al., 1982).
The third main category of pressure development encountered is shown in Fig. 4. It is characterised by a long train of oscillations, often with a negative phase of the same magnitude as the positive one. The oscillations, which could have peak values approaching 100 mbar, show a characteristic frequency of 4-7 Hz. This is the basic standing wave frequency of a one-end-open silo. The moderate increase of the frequency with time is probably due to the increase of the average gas temperature as the explosion develops. This exaggerated oscillatory pressure development occurred only when the ignition source was located in the middle and upper part of the silo. The oscillatory nature of the explosion could be clearly seen on the video recording. ‘Packets’ of flame were ejected at a frequency matching exactly that exhibited by the pressure traces.
169
The significance of this type of oscillatory pressure development with respect to the structural response of silos, may have to be discussed.
In the previous study of vented dust explosions in a 500 m3 silo (Eckhoff and Fuhre, 1984) it was found that a substantial increase in the explosion violence resulted when the dust cloud was ignited whilst the dust injection was still taking place. It was of interest to investigate whether a similar effect could be observed in the new silo. Two replicate experiments had already been per- formed by injecting 100 kg of starch from the silo bottom through the 5 m vertcial pipe. The injection period was 14 s, followed by automatic activation of the ignition source located 1.5 m above the silo bottom, 2.6 s after. It was therefore decided to undertake a similar experiment, the only difference being that 125 kg was fed into the system during 18 s, instead of 100 kg during 14 s. Ignition at 1.5 m above the silo bottom was, however, performed at 16.6 s as normal. This means that the turbulent dust jet would persist until 1.4 s after ignition. However, no significant violence-promoting influence of the jet could be observed. One partial reason for this could be that the explosion-induced turbulence generated in the long, slim silo in the case of bottom ignition, masks the influence of the turbulent jet. Another likely reason is the high concentra- tion of dust in the injection pipe, of about 13 kg/m3. The regions of high tur- bulence close to the pipe exit therefore probably contained too high dust concentrations for very rapid combustion to take place.
As far as reasonable estimates of average dust concentrations could be obtained, it was found that the most explosible concentration was 400-500 g/m3, although quite violent explosions were also generated at higher concen- trations, of up to 600-700 g/m”. On the lean side the explosion pressure seemed to drop relatively sharply with decreasing concentration to an average mini- mum explosible limit of about 100 g/m”.
Influence of ignition source location on maximum explosionpressure
As the experiments progressed, it was confirmed that the location of the ignition source was a decisive parameter with respect to the maximum explo- sion pressures generated in the vented silo. The pressure was reduced by two orders of magnitude, from about 1 bar, to only 10 mbar when the ignition point was moved from the bottom of the silo to close to the vent opening at the top. The likely main reason for the much higher pressures generated by bottom ignition is generation of turbulence, as discussed above. Video recordings revealed that the time for the flame to reach the vent in fact decreased as the ignition source was moved downwards, in spite of the fact that the distance that the flame had to travel to get to the vent increased.
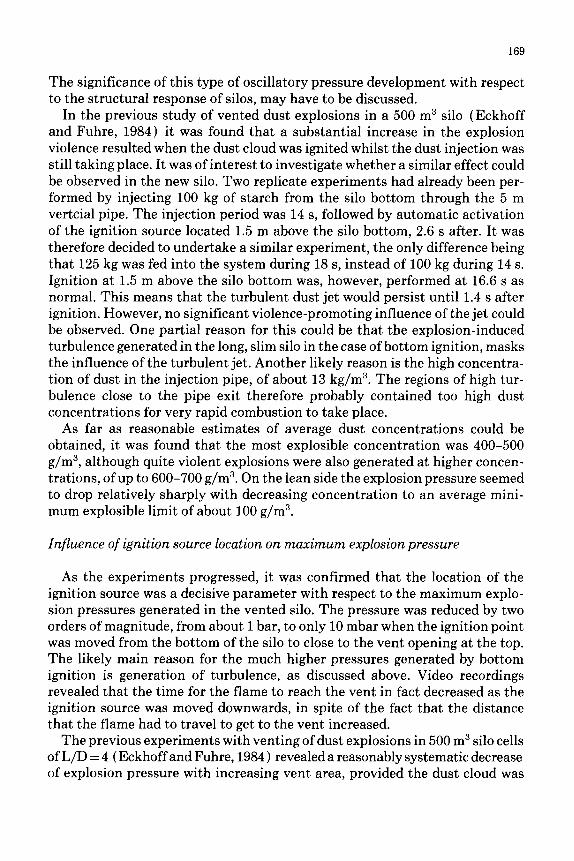
The previous experiments with venting of dust explosions in 500 m3 silo cells of L/D = 4 (Eckhoff and Fuhre, 1984) revealed a reasonably systematic decrease of explosion pressure with increasing vent area, provided the dust cloud was
lgnltlon at 21 m
2 3 4 5 6 7
vent ac?a Of 236 d stio inI')
Fig. 5. Influence of ignition source location and vent area on maximum explosion pressure. Worst- case dust clouds from all three different modes of dust cloud generation. Comparison with VDI 3673 (VDI, 1979).
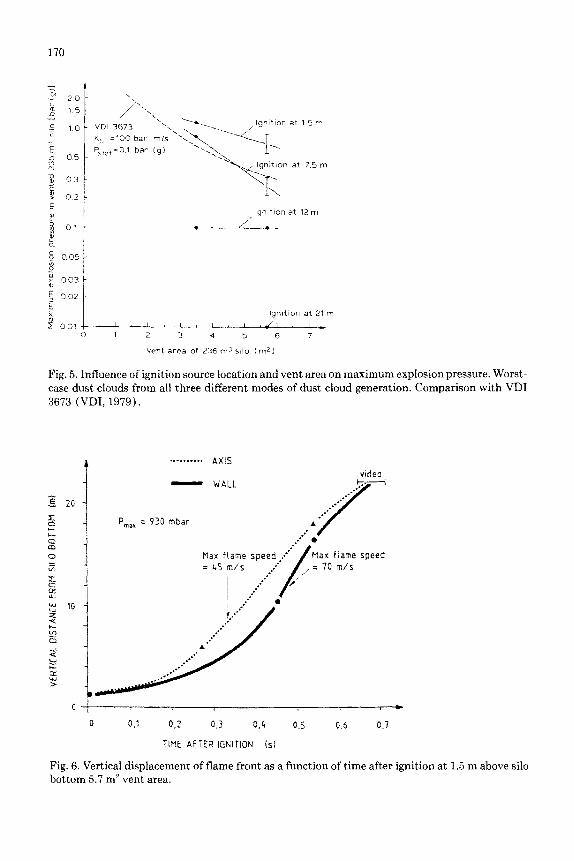
- WALL video
0 Q,l Q,2 Q,3 0.4 0.5 0.6 0.7
TIME AFTER IGNITION (sl
Fig. 6. Vertical displacement of flame front as a function of time after ignition bottom 5.7 m2 vent area.
at 1.5 m above silo
171
initially non-turbulent. Only bottom ignition was used in these experiments, but it is felt that due to the smaller L/D, the influence of the ignition source location would be less pronounced than in the present experiments.
Figure 5 summarizes the most important result of the present work with respect to industrial practice: a quantification of the strong influence of the location of the ignition point. Experience from gas and dust explosions in mine galleries and long pipelines, conducted in the past, suggests qualitatively that the kind of relationship shown in Fig. 5 would exists. However, a quantification was needed. In fact, the influence of the ignition source location is so strong that the vent area, over the range considered, only constitutes a second order parameter.
This confirms the general need for a new approach to vent sizing in the process industry. In future, simple nomographs and formulae will have to be replaced by methods tailoring the vent arrangement to suit each specific appli- cation, within an overall context of risk assessment (Eckhoff, 1986, 1987).
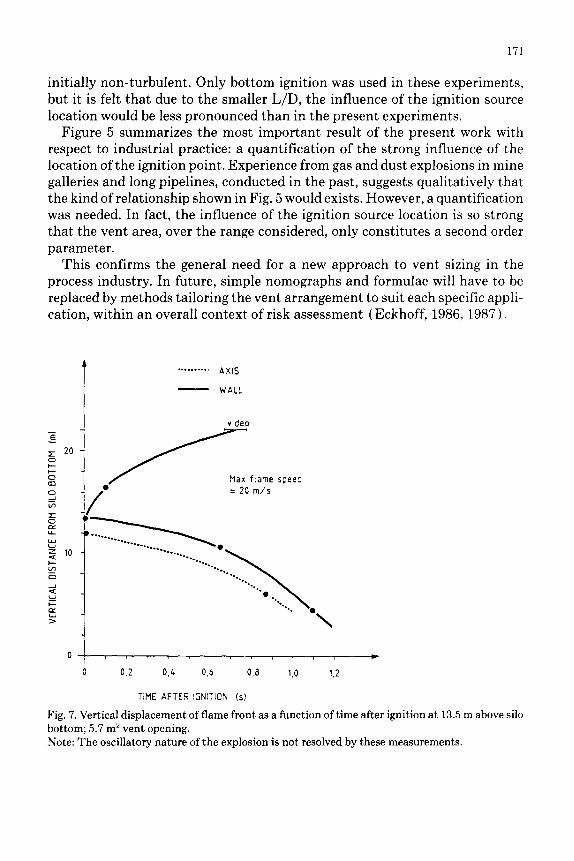
- WALL
Max flame spew = 20 m/s
I’ I 7 ” ” n r
0 0.2 0.L 0.6 0.8 1.0 1.2
TIME AFTER IGNITION (sl
Fig. 7. Vertical displacement of flame front as a function of time after ignition at 13.5 m above silo bottom; 5.7 m2 vent opening. Note: The oscillatory nature of the explosion is not resolved by these measurements.
172
Flame front displacement
Figure 6 shows an example of the measured vertical position of the flame front as a function of time. The time of flame-arrival at the vent opening, as obtained from the video recording, fits well into the picture and provides a most valuable additional data point. Because of the limited resolution, the precision of the time derived from the video recording is 2 40 ms, as indicated. As indi- cated in Fig. 1, the supporting rods of three of the flame detection probes were 0.5 m long, whereas the other three were 1.5 m. This made it possible to record the vertical flame front displacement both near the axis and near the wall of the silo. In general, the flame front near the wall lagged somewhat behind that near the axis. The maximum flame speed estimated from the gradient of the displacement curve in Fig. 6, is about 70 m/s. The highest flame speed meas- ured in the investigation altogether was 110 m/s.
Figure 7 shows the flame development following ignition at 13.5 m above the silo bottom. In this case the flame propagated simultaneously upwards and downwards. In the particular case shown, the ignition source was activated
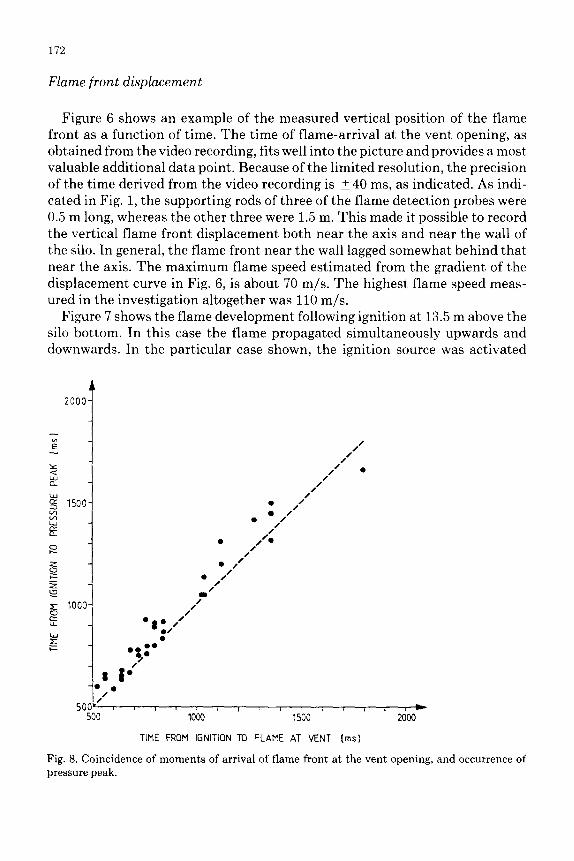
TIME FROM IGNITION TO FLAME AT VENT [ms]
Fig. 8. Coincidence of moments of arrival of flame front at the vent opening, and occurrence of pressure peak.
173
1.4 s before terminating dust injection, rather than 2.6 s after, which was the standard procedure. Consequently, heavy dust suspension being still injected at the silo top, dropped rapidly from the injection point towards the silo bottom during the explosion, and gave rise to a comparatively high downwards flame speed of about 20 m/s in the lower part of the silo. As expected, a somewhat stronger explosion resulted, than when quiescent clouds were ignited at 13.5 m. The explosion pressure exhibited oscillations of 6-7 Hz and maximum posi- tive amplitudes of about 100 mbar, similar to the course in Fig. 4.
Coincidence of flame-arrival at silo top, and occurrence of pressure peak
In the previous investigation of explosions in a 500 m3 silo (Eckhoff and Fuhre, 1984)) it was found that the moment of arrival of the flame at the vent at the silo top, and the moment of the occurrence of the pressure peak coin- cided. It was of interest to check whether the same coincidence existed even in the present experiments. In the case of the oscillatory explosions a single, dis- tinct pressure peak was not easy to define. In others the video recordings were, for various reasons, not obtained. However, for 30 of the experiments, both time intervals were available, and are plotted in Fig. 8. Although there is a tendency of the pressure peak occurring slighly later than the first sign of flame outside the vent, the correlation is conspicuous. The onset of venting of hot combustion gas is one likely reason for the drop in pressure following the arrival of the flame front at the vent.
CONCLUSIONS
1. The study of maize starch explosions in a specially constructed top-vented steel silo of volume 236 m3 and L/D = 6, revealed that the most explosible con- centration was 400-500 g/m3, although violent explosions were also obtained at higher concentrations of 600-700 g/m3. The estimated average minimum explosible concentration in the silo was of the order of 100 g/m”.
2. Varying the location of the ignition source along the silo axis, from the bottom to the top, had a substantial influence on the explosion pressure. With a vent area of 3.4 m* ignition in the lower third of the silo, resulted in over- pressures of up to 1.2 bar, whereas ignition in the upper half gave less than 0.1 bar. Ignition very close to the vent at the silo top gave only marginal overpres- sures, of the order of 0.01 bar.
3. Contrary to what was found in the earlier 500 m3 silo experiments (Eck- hoff and Fuhre, 1984), ignition of the dust cloud while dust was still being blown into the silo by a conventional pneumatic conveying system, did not cause any significant rise of the maximum explosion pressure. High dust load- ing in the turbulent dust jet of more than 10 kg/m3, i.e. well above the upper explosible concentration, is a likely main reason for this.
174
4. The maximum vertical flame front speed during an explosion in the silo ranged from a few m/s in weak explosions, to more than 100 m/s in the strong- est ones.
5. A differentiated approach to dust explosion vent sizing is needed, which accounts for the risk assessment aspects of the problem. It is necessary to discuss which dust cloud formation and ignition processes and associated com- bustion rates should, under various circumstances in industry, be regarded as the likely ‘worst cases’ that the vents to be designed should be able to accommodate.
ACKNOWLEDGEMENTS
The authors are greatly indebted to the National Grain and Feed Associa- tion, Washington, DC, for the substantial financial contribution rendering this work possible, and for unfailing constructive technical advice and support throughout. Sincere thanks are also due to the Swedish Fire Research Board, Brandforsk, Stockholm, for granting a valuable partical financial contribution.
REFERENCES
Bartknecht, W., 1978. Explosionen - Ablauf und Schutzmassnahmen. Springer, Berlin, pp. 43-45. Conti, R. S., Cashdollar, K. L. and Liebman, I., 1982. Improved optical probe for monitoring dust
explosions. Rev. Sci. Instrum., 53 (3) : 311. Cybulski, W., 1975. Coal Dust Explosions and their Suppression. English translation published
by Foreign Scientific Publ. Dept. of National Center for Scientific, Technical and Economical Information, Warsaw, Poland.
Eckhoff, R. K., 1982. Current dust explosion research at CMI. In: J. H. S. Lee and C. M. Guirao (Eds.) , Fuel-Air Explosions. University of Waterloo Press, p. 657.
Eckhoff, R. K., 1986. Sizing dust explosion vents - The need for a new approach based on risk assessment. Bulk Solids Handling, 6 (5 )
Eckhoff, R. K., 1987. Identifying likely ignition source locations - A key to sizing dust explosion vents. Symposium on Industrial Dust Explosions, Pittsburgh, USA, June 1986. ASTM Special Technical Publication.
Eckhoff, R. K. and Fuhre, K., 1984. Dust explosion experiments in a vented 500 m” silo cell. J. Occup. Accid., 6: 229.
Eckhoff, R. K., Fuhre, K., Guirao, C. M. and Lee, J. H. S., 1984. Venting of turbulent gas explo- sions in a 50 m3 chamber. Fire Saf. J., 7: 191.
Eckhoff, R. K., Fuhre, K. and Pedersen, G. H., 1985. Vented maize starch explosions in a 236 m” experimental silo. Fire and Explosion Research Report No. ESV-86-070, prepared by Chr. Michelsen Institute for National Grain and Feed Association, Washington, DC, Report No. 843307-2, Chr. Michelsen Institute, Bergen, Norway.
Gardner, B. R. and Moore, M. J., 1983. Personal communication to R. K. Eckhoff at Central Electricity Research Laboratories, Surrey, UK.
Liebman, I., Conti, R. S. and Cashdollar, K. L., 1977. Dust cloud concentration probe. Rev. Sci. Instrum., 48 (10): 1314.
175
Lunn, G. A. and Cairns, F., 1985. The venting of dust exlosions in a dust collector. J. Hazardous Materials, 12: 87-107.
Moen, I. O., Lee, J. H. S., Hjertager, B. H., Fuhre, R. K. and Eckhoff, R. K., 1982. Pressure development due to turbulent flame propagation in large-scale methane-air explosions. Comb. Flame, 47: 31.
NFPA, 1978. NFPA-68. Guide for Explosion Venting. National Fire Protection Assocation, Bos- ton.
Palmer, K. N., 1973. Dust Explosions and Fires. Chapman and Hall, London. Tonkin, P. S. and Berlemont, F. J., 1972. Dust explosions in a large-scale cyclone plant. Fire
Research Note No. 942, Fire Research Station. VDI, 1979. VDI-Richtlinie 3673. Druckentlastung von Staubexplosionen. Verein Deutscher


![Index [ftp.feq.ufu.br]ftp.feq.ufu.br/Luis_Claudio/Segurança/Safety/Double/fire_handbook... · Backdraft Explosion 174 Barium 216 Barium Carbonate 300 Barium Chlorate 300 Barium Nitrate](https://static.documents.pub/doc/80x56/5ea2585052451660ed3ed304/index-ftpfequfubrftpfequfubrluisclaudioseguranasafetydoublefirehandbook.jpg)


