Dynamic Diffusion with Disadoption: The Case of Crop Biotechnology in the USA Jorge Fernandez-Cornejo, Corinne Alexander, and Rachael E. Goodhue Controversy over the use of genetically engineered (GE) crops may have induced some farmers to disadopt these seeds, making a traditional diffusion model inappropriate. In this study, we develop and estimate a dynamic diffusion model, examine the diffusion paths of GE corn, soybeans, and cotton, predict the adoption of those crops over the next two years, and explore the main determinants of the diffusion rate. Our estimates indicate that future growth of Bt crops will be slower or negative, depending mainly on the infestation levels of the target pests. Adoption of herbicide-tolerant soybeans and cotton will continue to increase, unless consumer sentiment in the United States changes radically. Key Words: corn, cotton, diffusion of innovations, genetic engineering, pest management, soybeans Many agricultural innovations follow a well-known diffusion process which results in an S-shaped diffusion curve, first discussed by sociologists (and introduced to economics by Griliches in 1957). 1 The diffusion of genetically engineered (GE) crops followed this process in 1996S99, and the static logistic model appeared to fit the data (see figure 1). More recently, however, the market environment— particularly the export market—suggests the use of traditional (static) diffusion methods may not be ap- propriate for examining the diffusion of this tech- nology. Increased concern, especially in Europe and Japan, regarding the safety of these crops has resulted in the development of segregated markets for “non- Jorge Fernandez-Cornejo is an economist with the Economic Research Ser- vice, U.S. Department of Agriculture, Washington, DC. Corinne Alexander is a graduate student in the Department of Agricultural and Resource Economics, and Rachael E. Goodhue is an assistant professor in the Depart- ment of Agricultural and Resource Economics and member of the Giannini Foundation, both at the University of California-Davis. The views expressed herein are those of the authors and do not necessarily represent the views or policies of the U.S. Department of Agriculture. The authors would like to express their gratitude to Carol Jones, Bill McBride, Ralph Hemlich, and two anonymous reviewers for helpful comments. 1 The S-shaped diffusion was first observed by the French sociologist Tarde in 1903. An early empirical diffusion study was conducted by rural sociologists Ryan and Gross (1943). GE” crops. While these markets are still small, the evolving information regarding the demand for these crops suggests dynamic considerations are especi- ally important for this particular adoption process. This study has three objectives: (a) to examine the diffusion paths of GE crops, including corn, soy- beans, and cotton; (b) to predict the adoption of GE crops over the next two years under different sce- narios; and (c) to explore some of the determinants of the rate of diffusion. Background Genetic engineering refers to the genetic modifica- tion of organisms by recombinant DNA techniques. By a precise alteration of a plant’s traits, genetic engineering facilitates the development of character- istics not possible through traditional plant breeding techniques. By targeting a single plant trait, genetic engineering can decrease the number of unintended characteristics that may occur with traditional breed- ing. The genetically engineered crops considered in this analysis include those with herbicide-tolerant and insect-resistant traits. GE crops carrying herbicide-tolerant genes were developed to survive certain broad-spectrum her- bicides. Previously, these herbicides would have Agricultural and Resource Economics Review 31/1 (April 2002): 112S126 Copyright 2002 Northeastern Agricultural and Resource Economics Association
Transcript
Dynamic Diffusion with Disadoption:The Case of Crop Biotechnologyin the USAJorge Fernandez-Cornejo, Corinne Alexander, andRachael E. Goodhue
Controversy over the use of genetically engineered (GE) crops may have induced some farmers todisadopt these seeds, making a traditional diffusion model inappropriate. In this study, we develop andestimate a dynamic diffusion model, examine the diffusion paths of GE corn, soybeans, and cotton,predict the adoption of those crops over the next two years, and explore the main determinants of thediffusion rate. Our estimates indicate that future growth of Bt crops will be slower or negative,depending mainly on the infestation levels of the target pests. Adoption of herbicide-tolerant soybeansand cotton will continue to increase, unless consumer sentiment in the United States changes radically.
Key Words: corn, cotton, diffusion of innovations, genetic engineering, pest management, soybeans
Many agricultural innovations follow a well-knowndiffusion process which results in an S-shapeddiffusion curve, first discussed by sociologists (andintroduced to economics by Griliches in 1957).1 Thediffusion of genetically engineered (GE) cropsfollowed this process in 1996S99, and the staticlogistic model appeared to fit the data (see figure 1).More recently, however, the market environment—particularly the export market—suggests the use oftraditional (static) diffusion methods may not be ap-propriate for examining the diffusion of this tech-nology.
Increased concern, especially in Europe and Japan,regarding the safety of these crops has resulted inthe development of segregated markets for “non-
Jorge Fernandez-Cornejo is an economist with the Economic Research Ser-vice, U.S. Department of Agriculture, Washington, DC. Corinne Alexanderis a graduate student in the Department of Agricultural and ResourceEconomics, and Rachael E. Goodhue is an assistant professor in the Depart-ment of Agricultural and Resource Economics and member of the GianniniFoundation, both at the University of California-Davis.
The views expressed herein are those of the authors and do notnecessarily represent the views or policies of the U.S. Department ofAgriculture. The authors would like to express their gratitude to CarolJones, Bill McBride, Ralph Hemlich, and two anonymous reviewers forhelpful comments.
1 The S-shaped diffusion was first observed by the French sociologistTarde in 1903. An early empirical diffusion study was conducted by ruralsociologists Ryan and Gross (1943).
GE” crops. While these markets are still small, theevolving information regarding the demand for thesecrops suggests dynamic considerations are especi-ally important for this particular adoption process.
This study has three objectives: (a) to examinethe diffusion paths of GE crops, including corn, soy-beans, and cotton; (b) to predict the adoption of GEcrops over the next two years under different sce-narios; and (c) to explore some of the determinantsof the rate of diffusion.
Background
Genetic engineering refers to the genetic modifica-tion of organisms by recombinant DNA techniques.By a precise alteration of a plant’s traits, geneticengineering facilitates the development of character-istics not possible through traditional plant breedingtechniques. By targeting a single plant trait, geneticengineering can decrease the number of unintendedcharacteristics that may occur with traditional breed-ing. The genetically engineered crops considered inthis analysis include those with herbicide-tolerantand insect-resistant traits.
GE crops carrying herbicide-tolerant genes weredeveloped to survive certain broad-spectrum her-bicides. Previously, these herbicides would have
Agricultural and Resource Economics Review 31/1 (April 2002): 112S126Copyright 2002 Northeastern Agricultural and Resource Economics Association
Fernandez-Cornejo, Alexander, and Goodhue Dynamic Diffusion with Disadoption: U.S. Crop Biotechnology 113
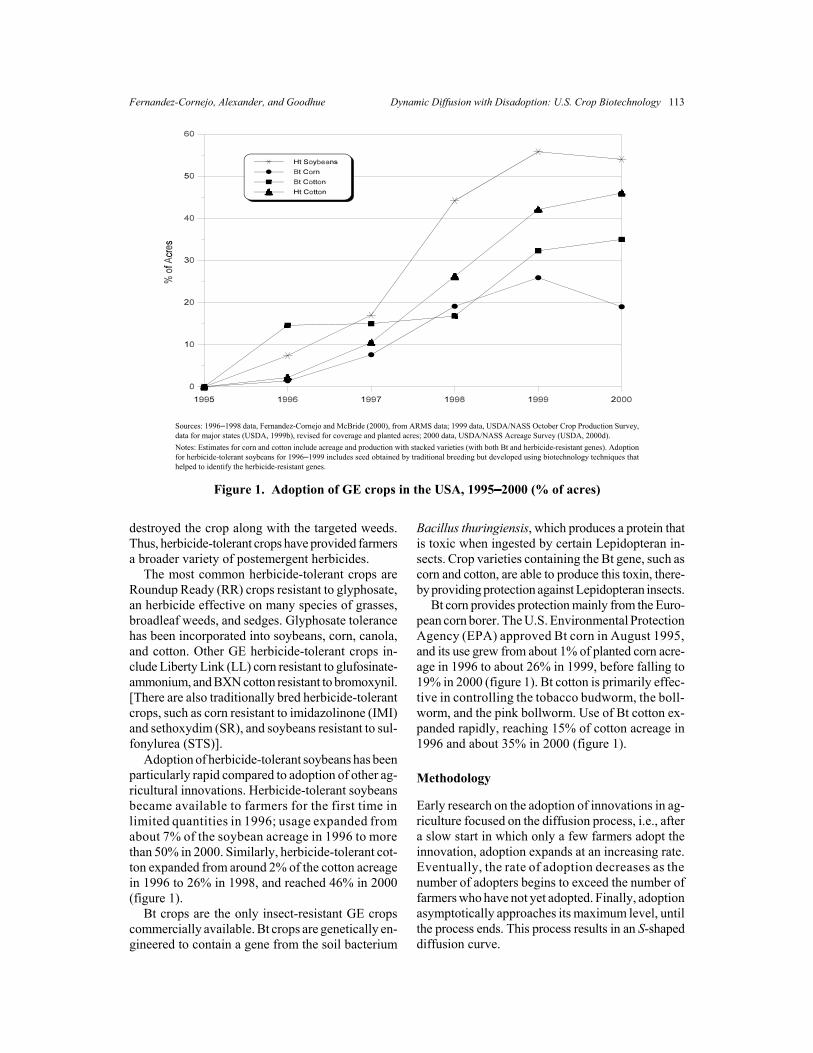
Sources: 1996S1998 data, Fernandez-Cornejo and McBride (2000), from ARMS data; 1999 data, USDA/NASS October Crop Production Survey,data for major states (USDA, 1999b), revised for coverage and planted acres; 2000 data, USDA/NASS Acreage Survey (USDA, 2000d).Notes: Estimates for corn and cotton include acreage and production with stacked varieties (with both Bt and herbicide-resistant genes). Adoptionfor herbicide-tolerant soybeans for 1996S1999 includes seed obtained by traditional breeding but developed using biotechnology techniques thathelped to identify the herbicide-resistant genes.
Figure 1. Adoption of GE crops in the USA, 1995SSSS2000 (% of acres)
destroyed the crop along with the targeted weeds.Thus, herbicide-tolerant crops have provided farmersa broader variety of postemergent herbicides.
The most common herbicide-tolerant crops areRoundup Ready (RR) crops resistant to glyphosate,an herbicide effective on many species of grasses,broadleaf weeds, and sedges. Glyphosate tolerancehas been incorporated into soybeans, corn, canola,and cotton. Other GE herbicide-tolerant crops in-clude Liberty Link (LL) corn resistant to glufosinate-ammonium, and BXN cotton resistant to bromoxynil.[There are also traditionally bred herbicide-tolerantcrops, such as corn resistant to imidazolinone (IMI)and sethoxydim (SR), and soybeans resistant to sul-fonylurea (STS)].
Adoption of herbicide-tolerant soybeans has beenparticularly rapid compared to adoption of other ag-ricultural innovations. Herbicide-tolerant soybeansbecame available to farmers for the first time inlimited quantities in 1996; usage expanded fromabout 7% of the soybean acreage in 1996 to morethan 50% in 2000. Similarly, herbicide-tolerant cot-ton expanded from around 2% of the cotton acreagein 1996 to 26% in 1998, and reached 46% in 2000(figure 1).
Bt crops are the only insect-resistant GE cropscommercially available. Bt crops are genetically en-gineered to contain a gene from the soil bacterium
Bacillus thuringiensis, which produces a protein thatis toxic when ingested by certain Lepidopteran in-sects. Crop varieties containing the Bt gene, such ascorn and cotton, are able to produce this toxin, there-by providing protection against Lepidopteran insects.
Bt corn provides protection mainly from the Euro-pean corn borer. The U.S. Environmental ProtectionAgency (EPA) approved Bt corn in August 1995,and its use grew from about 1% of planted corn acre-age in 1996 to about 26% in 1999, before falling to19% in 2000 (figure 1). Bt cotton is primarily effec-tive in controlling the tobacco budworm, the boll-worm, and the pink bollworm. Use of Bt cotton ex-panded rapidly, reaching 15% of cotton acreage in1996 and about 35% in 2000 (figure 1).
Methodology
Early research on the adoption of innovations in ag-riculture focused on the diffusion process, i.e., aftera slow start in which only a few farmers adopt theinnovation, adoption expands at an increasing rate.Eventually, the rate of adoption decreases as thenumber of adopters begins to exceed the number offarmers who have not yet adopted. Finally, adoptionasymptotically approaches its maximum level, untilthe process ends. This process results in an S-shapeddiffusion curve.
114 April 2002 Agricultural and Resource Economics Review
As Griliches (1957) observes, the choice of func-tional form for the diffusion curve is somewhat arbi-trary. The logistic function is often used to representthe S-shaped (sigmoid) diffusion process for agri-cultural innovations because of its relative simpli-city (Griliches, 1957; Jarvis, 1981; Knudson, 1991;Karshenas and Stoneman, 1992). Other S-shapedfunctions used include the cumulative normal andthe Gompertz model (Dixon, 1980). However, asMahajan and Peterson (1985, p. 10) note, any uni-modal distribution function will generate a (cumula-tive) S-shaped curve.
Diffusion curves are based on the notion that thecurrent adoption rate is a function of the ultimateadoption level and the current adoption level:
(1) dZ(t)/dt = f(K, Z, t),
where Z is the proportion of the total population thathas adopted the innovation at time t, K is the ceilingvalue or long-run upper limit on adoption, anddZ(t)/dt is the rate of diffusion at time t. Both K andZ are often expressed as a percentage of adoptingunits [usually percentage of firms, although in agri-culture the percentage often refers to acreage underadoption (e.g., Knudson, 1991)].
It is common to assume the rate of diffusiondZ(t)/dt is proportional to the difference of K!Z. Inthis case, one obtains the so-called “fundamental dif-fusion model” (Mahajan and Peterson, 1985, p. 13):
(2) dZ(t)/dt = g(t)[K!Z(t)],
where g(t) is denoted the coefficient of diffusion.Clearly, in this model as the adoption level increas-es and gets closer to the ceiling K, the diffusion ratedecreases. If g(t) is assumed to be constant, theresulting model is called the “external diffusion”model. If g(t) = NZ(t), the model is referred to asthe “internal influence” model (Mahajan and Peter-son, 1985, pp. 17S20), also known as the “contagion”or “epidemic” model in biology (Jaffe, Newell, andStavins, 2000, p. 18) in which the innovation spreadsas a disease. It is common to use the internal influ-ence model in agricultural innovations. In this case,(2) explicitly becomes:
(3) dZ(t)/dt = NZ(t)[K!Z(t)].
Integrating (2), we obtain the logistic:
(4) Z = K/ [1 + e(!a!N t )].
Making a log-linear (or logit) algebraic transforma-tion of the adoption equation, we obtain ln[Z/(K!Z)]
= a + Nt (Griliches, 1957), where the slope param-eter N is known as the natural rate of diffusion, rateof acceptance of the innovation, or rate coefficient(Griliches, 1957), as it measures the rate at whichadoption Z increases with time. The parameter a isa constant of integration related to the extent ofadoption at time 0, since at t = 0, a = ln[Z/(K!Z)].The ceiling K is the long-run upper limit on adop-tion. Technically, the diffusion rate dt(t )/dt ap-proaches zero as Z approaches K [from equation(3)]. Also, K is the limit of Z as time tends towardinfinity [equation (4)]. The logistic curve is sym-metric around the inflection point (corresponding tothe maximum adoption rate) at 50% of the ceilinglevel. The Gompertz model is similarly obtainedfrom equation (3) simply by substituting the log ofK and the log of Z(t) for the two terms in braces andthen integrating (Mahajan and Peterson, 1985, pp.19S20).
Static and Dynamic Models
Static diffusion models, following the terminologyof Knudson (1991), are growth models which repre-sent the adoption path, expressing the percentage ofadopters as a function of time. Such static modelsdo not contain any other exogenous or endogenousfactors. Two other characteristics of such modelssuggest their unsuitability for the type of innova-tions we consider here. First, they have a predefinedpoint of maximum adoption as a share of the totalpopulation. Second, adoption must always increaseover time until it converges to this maximum.
Knudson (1991) identifies the six basic assump-tions of static diffusion models as follows: (a) anindividual either adopts or does not adopt; (b) thereis a fixed, finite ceiling K; (c) the rate coefficient ofdiffusion is fixed over time; (d) the innovation isnot modified once introduced, and its diffusion isindependent from the diffusion of other innovations;(e) one adoption is permitted per adopting unit, andthis decision cannot be rescinded; and ( f ) a socialsystem’s geographical boundaries stay constant overthe diffusion process. Many models have been usedto study the diffusion of industrial innovations(Mahajan and Peterson, 1985, p. 30); for the case ofagricultural innovations the most common model isthe static logistic.
The static logistic is represented by equation (4),assuming N and K are constant (independent of t).In this case, the logit transformation of the adoptionequation ln[Z/(K!Z)] = a + Nt allows the use of lin-ear regression analysis (Griliches, 1957). The main
Fernandez-Cornejo, Alexander, and Goodhue Dynamic Diffusion with Disadoption: U.S. Crop Biotechnology 115
advantages of the static logistic are its ease of useand its wide applicability. It is also useful for fore-casting because it requires no extra exogenous vari-ables. Its usefulness is limited, however, becausethe parameters which determine the diffusion pathare fixed over time.
Unlike static diffusion models, dynamic diffusionmodels allow the parameters of diffusion that deter-mine the diffusion path (e.g., N, K) to change overtime. Dynamic diffusion methods relax some of theassumptions of static diffusion models by allowingfor disadoption and variations in the rate of accept-ance (slope), and helping directly identify the vari-ables significant to the adoption of an innovation.
In practice, two variations of dynamic models areoften considered: the variable-ceiling logistic andthe variable-slope logistic models. The variable-ceiling logistic defines the ceiling level (maximumrate of adoption) as a function of a vector S(t) ofexogenous factors believed to influence adoption(Jarvis, 1981; Knudson, 1991). There are two draw-backs of the variable-ceiling logistic model. First,there is no assurance the ceiling will stay at theo-retically justifiable levels, and second, there is noguarantee the equation will even converge when thedata are extremely nonlinear.
The second version of the dynamic logistic mod-el, the variable-slope logistic model, is obtained byallowing the adoption rate, rather than the maxi-mum number of adopters, to vary as a function ofexogenous factors like price, education, and so forth(Jarvis, 1981; Karshenas and Stonemann, 1992).This approach has several advantages. In this modelthe rate of acceptance (slope) can vary and even benegative, given the movement of the exogenous fac-tors. It also allows the direct use of outside influ-ences on adoption, and ceiling levels can be set at atheoretically justifiable level (e.g., 100% or lower).The variable-slope logistic model is easier to esti-mate and does not have the problems of the var-iable-ceiling logistic model for estimations usingnon-log-linear data (e.g., nonconvergence, unaccept-able results such as K higher than 100%).
The Dynamic Logistic Model for the Diffusion of GE Crops
The diffusion of GE crops is modeled with a vari-able-slope logistic. According to Griliches (1957),the slope, or rate of diffusion, is largely a demand or“acceptance” variable, and differences in the slopeare “interpreted as differences in the rate of adjust-ment of demand to a new equilibrium, and will be
explained by variables operating in the demand siderather than by variables operating in the supplyside” (p. 515).
For this reason, and to specify a parsimoniousmodel, the slope N of the logistic is set equal toa function of two sets of variables (R, S) denotingdemand conditions for GM crops. Thus we have: N= N0 + N1NR + N2NS. Substituting the variable slopein (3), we obtain:
(5) Z = K /{1 + e[!a!(N0+N1NR+N2N S )]t}.
Making the logit transformation and adding a vectorof regional dummy variables (D) to account forregional technology differences (fixed effects, aswe are using panel data) associated, for example,with the initial availability as well as the initialdegree of promotion of the technology, and append-ing the error term g, we arrive at the estimatingequation:
(6) ln[Z/(K!Z)] = a + (N0 + NNNN1NR + NNNN2NS)t + ((((ND + g = a + N0t + NNNN1NRt + NNNN2NS t + ((((ND + g.
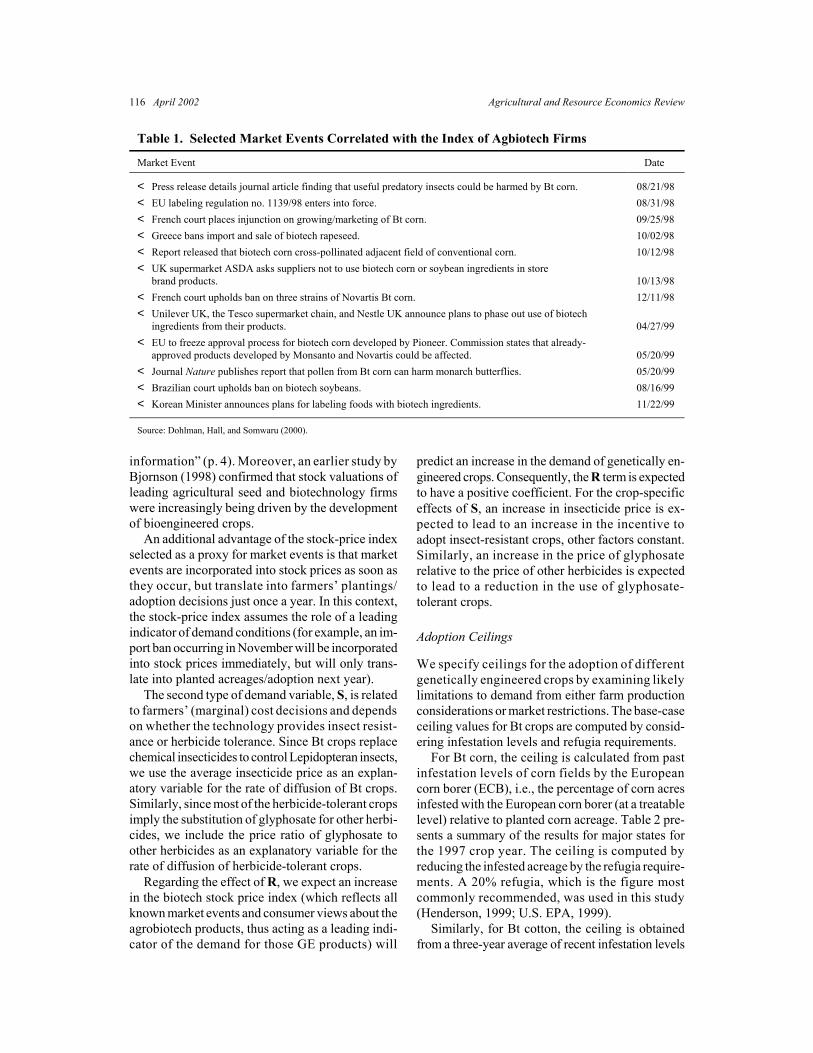
The first set of variables (vector R) attempts tocapture consumer preferences and/or concerns aboutGE products. These concerns are reflected in “marketevents” including, for example, labeling regulationsfor foods adopted by the European Union (EU),mandatory labeling proposals of genetically engi-neered foods by other countries such as Japan andKorea, announcements by UK food processors andsupermarkets of plans to phase out use of biotechingredients from their products, and plans by someU.S. food processors (Heinz, Gerber, Frito-Lay Inc.)and several Japanese brewers to stop using biotechingredients in some of their products. Table 1 listsa summary of selected market events extracted fromDohlman, Hall, and Somwaru (2000).
Given the large number of “market events” (rep-resented by the vector R) which have impacted thedemand of GE crop products in recent years, and toconserve degrees of freedom, we specify a proxyfor capturing most of the information contained inR. The proxy selected is an index of stock prices ofagricultural biotech firms. Such an index was devel-oped by Dohlman, Hall, and Somwaru (2000), whoshow empirically the effect of market events onequity values of agricultural biotechnology firmsand justify their findings by the efficient markets/rational-expectations hypothesis, which “asserts thatsecurity prices immediately reflect all available
116 April 2002 Agricultural and Resource Economics Review
Table 1. Selected Market Events Correlated with the Index of Agbiotech Firms
Market Event Date
< Press release details journal article finding that useful predatory insects could be harmed by Bt corn. 08/21/98< EU labeling regulation no. 1139/98 enters into force. 08/31/98< French court places injunction on growing/marketing of Bt corn. 09/25/98< Greece bans import and sale of biotech rapeseed. 10/02/98< Report released that biotech corn cross-pollinated adjacent field of conventional corn. 10/12/98< UK supermarket ASDA asks suppliers not to use biotech corn or soybean ingredients in store
brand products. 10/13/98< French court upholds ban on three strains of Novartis Bt corn. 12/11/98< Unilever UK, the Tesco supermarket chain, and Nestle UK announce plans to phase out use of biotech
ingredients from their products. 04/27/99< EU to freeze approval process for biotech corn developed by Pioneer. Commission states that already-
approved products developed by Monsanto and Novartis could be affected. 05/20/99< Journal Nature publishes report that pollen from Bt corn can harm monarch butterflies. 05/20/99< Brazilian court upholds ban on biotech soybeans. 08/16/99< Korean Minister announces plans for labeling foods with biotech ingredients. 11/22/99
Source: Dohlman, Hall, and Somwaru (2000).
information” (p. 4). Moreover, an earlier study byBjornson (1998) confirmed that stock valuations ofleading agricultural seed and biotechnology firmswere increasingly being driven by the developmentof bioengineered crops.
An additional advantage of the stock-price indexselected as a proxy for market events is that marketevents are incorporated into stock prices as soon asthey occur, but translate into farmers’ plantings/adoption decisions just once a year. In this context,the stock-price index assumes the role of a leadingindicator of demand conditions (for example, an im-port ban occurring in November will be incorporatedinto stock prices immediately, but will only trans-late into planted acreages/adoption next year).
The second type of demand variable, S, is relatedto farmers’ (marginal) cost decisions and dependson whether the technology provides insect resist-ance or herbicide tolerance. Since Bt crops replacechemical insecticides to control Lepidopteran insects,we use the average insecticide price as an explan-atory variable for the rate of diffusion of Bt crops.Similarly, since most of the herbicide-tolerant cropsimply the substitution of glyphosate for other herbi-cides, we include the price ratio of glyphosate toother herbicides as an explanatory variable for therate of diffusion of herbicide-tolerant crops.
Regarding the effect of R, we expect an increasein the biotech stock price index (which reflects allknown market events and consumer views about theagrobiotech products, thus acting as a leading indi-cator of the demand for those GE products) will
predict an increase in the demand of genetically en-gineered crops. Consequently, the R term is expectedto have a positive coefficient. For the crop-specificeffects of S, an increase in insecticide price is ex-pected to lead to an increase in the incentive toadopt insect-resistant crops, other factors constant.Similarly, an increase in the price of glyphosaterelative to the price of other herbicides is expectedto lead to a reduction in the use of glyphosate-tolerant crops.
Adoption Ceilings
We specify ceilings for the adoption of differentgenetically engineered crops by examining likelylimitations to demand from either farm productionconsiderations or market restrictions. The base-caseceiling values for Bt crops are computed by consid-ering infestation levels and refugia requirements.
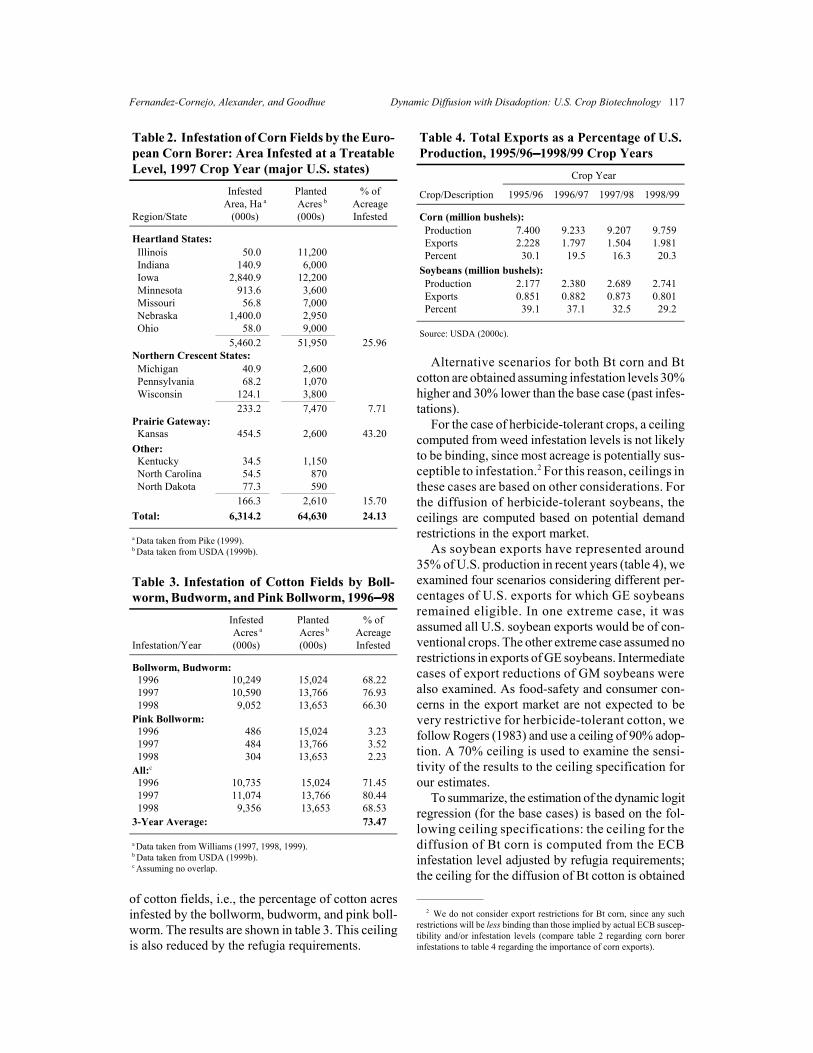
For Bt corn, the ceiling is calculated from pastinfestation levels of corn fields by the Europeancorn borer (ECB), i.e., the percentage of corn acresinfested with the European corn borer (at a treatablelevel) relative to planted corn acreage. Table 2 pre-sents a summary of the results for major states forthe 1997 crop year. The ceiling is computed byreducing the infested acreage by the refugia require-ments. A 20% refugia, which is the figure mostcommonly recommended, was used in this study(Henderson, 1999; U.S. EPA, 1999).
Similarly, for Bt cotton, the ceiling is obtainedfrom a three-year average of recent infestation levels
Fernandez-Cornejo, Alexander, and Goodhue Dynamic Diffusion with Disadoption: U.S. Crop Biotechnology 117
Table 2. Infestation of Corn Fields by the Euro-pean Corn Borer: Area Infested at a TreatableLevel, 1997 Crop Year (major U.S. states)
233.2 7,470 7.71 Prairie Gateway: Kansas 454.5 2,600 43.20 Other: Kentucky North Carolina North Dakota
34.5 54.5 77.3
1,150 870 590
166.3 2,610 15.70 Total: 6,314.2 64,630 24.13
a Data taken from Pike (1999).b Data taken from USDA (1999b).
Table 3. Infestation of Cotton Fields by Boll-worm, Budworm, and Pink Bollworm, 1996SSSS98
Infestation/Year
Infested Acres a
(000s)
Planted Acres b
(000s)
% of Acreage Infested
Bollworm, Budworm: 1996 1997 1998
10,249 10,590
9,052
15,024 13,766 13,653
68.22 76.93 66.30
Pink Bollworm: 1996 1997 1998
486 484 304
15,024 13,766 13,653
3.23 3.52 2.23
All:c
1996 1997 1998
10,735 11,074
9,356
15,024 13,766 13,653
71.45 80.44 68.53
3-Year Average: 73.47
a Data taken from Williams (1997, 1998, 1999).b Data taken from USDA (1999b).c Assuming no overlap.
of cotton fields, i.e., the percentage of cotton acresinfested by the bollworm, budworm, and pink boll-worm. The results are shown in table 3. This ceilingis also reduced by the refugia requirements.
Table 4. Total Exports as a Percentage of U.S.Production, 1995/96SSSS1998/99 Crop Years
Crop Year
Crop/Description 1995/96 1996/97 1997/98 1998/99
Corn (million bushels): Production Exports Percent
7.400 2.228
30.1
9.233 1.797
19.5
9.207 1.504
16.3
9.759 1.981
20.3 Soybeans (million bushels): Production Exports Percent
2.177 0.851
39.1
2.380 0.882
37.1
2.689 0.873
32.5
2.741 0.801
29.2
Source: USDA (2000c).
Alternative scenarios for both Bt corn and Btcotton are obtained assuming infestation levels 30%higher and 30% lower than the base case (past infes-tations).
For the case of herbicide-tolerant crops, a ceilingcomputed from weed infestation levels is not likelyto be binding, since most acreage is potentially sus-ceptible to infestation.2 For this reason, ceilings inthese cases are based on other considerations. Forthe diffusion of herbicide-tolerant soybeans, theceilings are computed based on potential demandrestrictions in the export market.
As soybean exports have represented around35% of U.S. production in recent years (table 4), weexamined four scenarios considering different per-centages of U.S. exports for which GE soybeansremained eligible. In one extreme case, it wasassumed all U.S. soybean exports would be of con-ventional crops. The other extreme case assumed norestrictions in exports of GE soybeans. Intermediatecases of export reductions of GM soybeans werealso examined. As food-safety and consumer con-cerns in the export market are not expected to bevery restrictive for herbicide-tolerant cotton, wefollow Rogers (1983) and use a ceiling of 90% adop-tion. A 70% ceiling is used to examine the sensi-tivity of the results to the ceiling specification forour estimates.
To summarize, the estimation of the dynamic logitregression (for the base cases) is based on the fol-lowing ceiling specifications: the ceiling for thediffusion of Bt corn is computed from the ECBinfestation level adjusted by refugia requirements;the ceiling for the diffusion of Bt cotton is obtained
2 We do not consider export restrictions for Bt corn, since any suchrestrictions will be less binding than those implied by actual ECB suscep-tibility and/or infestation levels (compare table 2 regarding corn borerinfestations to table 4 regarding the importance of corn exports).
118 April 2002 Agricultural and Resource Economics Review
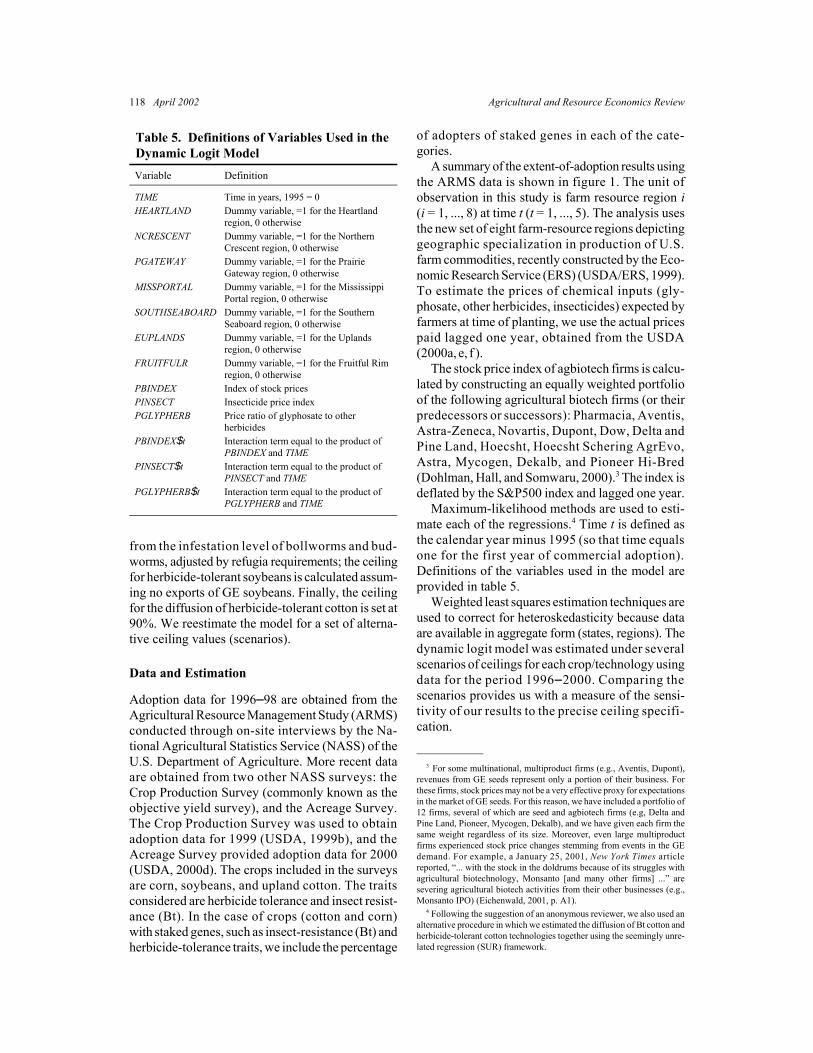
Table 5. Definitions of Variables Used in the Dynamic Logit Model Variable Definition
TIME Time in years, 1995 = 0 HEARTLAND Dummy variable, =1 for the Heartland
region, 0 otherwise NCRESCENT Dummy variable, =1 for the Northern
Crescent region, 0 otherwise PGATEWAY Dummy variable, =1 for the Prairie
Gateway region, 0 otherwise MISSPORTAL Dummy variable, =1 for the Mississippi
Portal region, 0 otherwise SOUTHSEABOARD Dummy variable, =1 for the Southern
Seaboard region, 0 otherwise EUPLANDS Dummy variable, =1 for the Uplands
region, 0 otherwise FRUITFULR Dummy variable, =1 for the Fruitful Rim
region, 0 otherwise PBINDEX Index of stock prices PINSECT Insecticide price index PGLYPHERB Price ratio of glyphosate to other
herbicides PBINDEX$t Interaction term equal to the product of
PBINDEX and TIME PINSECT$t Interaction term equal to the product of
PINSECT and TIME PGLYPHERB$t Interaction term equal to the product of
PGLYPHERB and TIME
from the infestation level of bollworms and bud-worms, adjusted by refugia requirements; the ceilingfor herbicide-tolerant soybeans is calculated assum-ing no exports of GE soybeans. Finally, the ceilingfor the diffusion of herbicide-tolerant cotton is set at90%. We reestimate the model for a set of alterna-tive ceiling values (scenarios).
Data and Estimation
Adoption data for 1996S98 are obtained from theAgricultural Resource Management Study (ARMS)conducted through on-site interviews by the Na-tional Agricultural Statistics Service (NASS) of theU.S. Department of Agriculture. More recent dataare obtained from two other NASS surveys: theCrop Production Survey (commonly known as theobjective yield survey), and the Acreage Survey.The Crop Production Survey was used to obtainadoption data for 1999 (USDA, 1999b), and theAcreage Survey provided adoption data for 2000(USDA, 2000d). The crops included in the surveysare corn, soybeans, and upland cotton. The traitsconsidered are herbicide tolerance and insect resist-ance (Bt). In the case of crops (cotton and corn)with staked genes, such as insect-resistance (Bt) andherbicide-tolerance traits, we include the percentage
of adopters of staked genes in each of the cate-gories.
A summary of the extent-of-adoption results usingthe ARMS data is shown in figure 1. The unit ofobservation in this study is farm resource region i(i = 1, ..., 8) at time t (t = 1, ..., 5). The analysis usesthe new set of eight farm-resource regions depictinggeographic specialization in production of U.S.farm commodities, recently constructed by the Eco-nomic Research Service (ERS) (USDA/ERS, 1999).To estimate the prices of chemical inputs (gly-phosate, other herbicides, insecticides) expected byfarmers at time of planting, we use the actual pricespaid lagged one year, obtained from the USDA(2000a, e, f ).
The stock price index of agbiotech firms is calcu-lated by constructing an equally weighted portfolioof the following agricultural biotech firms (or theirpredecessors or successors): Pharmacia, Aventis,Astra-Zeneca, Novartis, Dupont, Dow, Delta andPine Land, Hoecsht, Hoecsht Schering AgrEvo,Astra, Mycogen, Dekalb, and Pioneer Hi-Bred(Dohlman, Hall, and Somwaru, 2000).3 The index isdeflated by the S&P500 index and lagged one year.
Maximum-likelihood methods are used to esti-mate each of the regressions.4 Time t is defined asthe calendar year minus 1995 (so that time equalsone for the first year of commercial adoption).Definitions of the variables used in the model areprovided in table 5.
Weighted least squares estimation techniques areused to correct for heteroskedasticity because dataare available in aggregate form (states, regions). Thedynamic logit model was estimated under severalscenarios of ceilings for each crop/technology usingdata for the period 1996S2000. Comparing thescenarios provides us with a measure of the sensi-tivity of our results to the precise ceiling specifi-cation.
3 For some multinational, multiproduct firms (e.g., Aventis, Dupont),revenues from GE seeds represent only a portion of their business. Forthese firms, stock prices may not be a very effective proxy for expectationsin the market of GE seeds. For this reason, we have included a portfolio of12 firms, several of which are seed and agbiotech firms (e.g, Delta andPine Land, Pioneer, Mycogen, Dekalb), and we have given each firm thesame weight regardless of its size. Moreover, even large multiproductfirms experienced stock price changes stemming from events in the GEdemand. For example, a January 25, 2001, New York Times articlereported, “... with the stock in the doldrums because of its struggles withagricultural biotechnology, Monsanto [and many other firms] ...” aresevering agricultural biotech activities from their other businesses (e.g.,Monsanto IPO) (Eichenwald, 2001, p. A1).
4 Following the suggestion of an anonymous reviewer, we also used analternative procedure in which we estimated the diffusion of Bt cotton andherbicide-tolerant cotton technologies together using the seemingly unre-lated regression (SUR) framework.
Fernandez-Cornejo, Alexander, and Goodhue Dynamic Diffusion with Disadoption: U.S. Crop Biotechnology 119
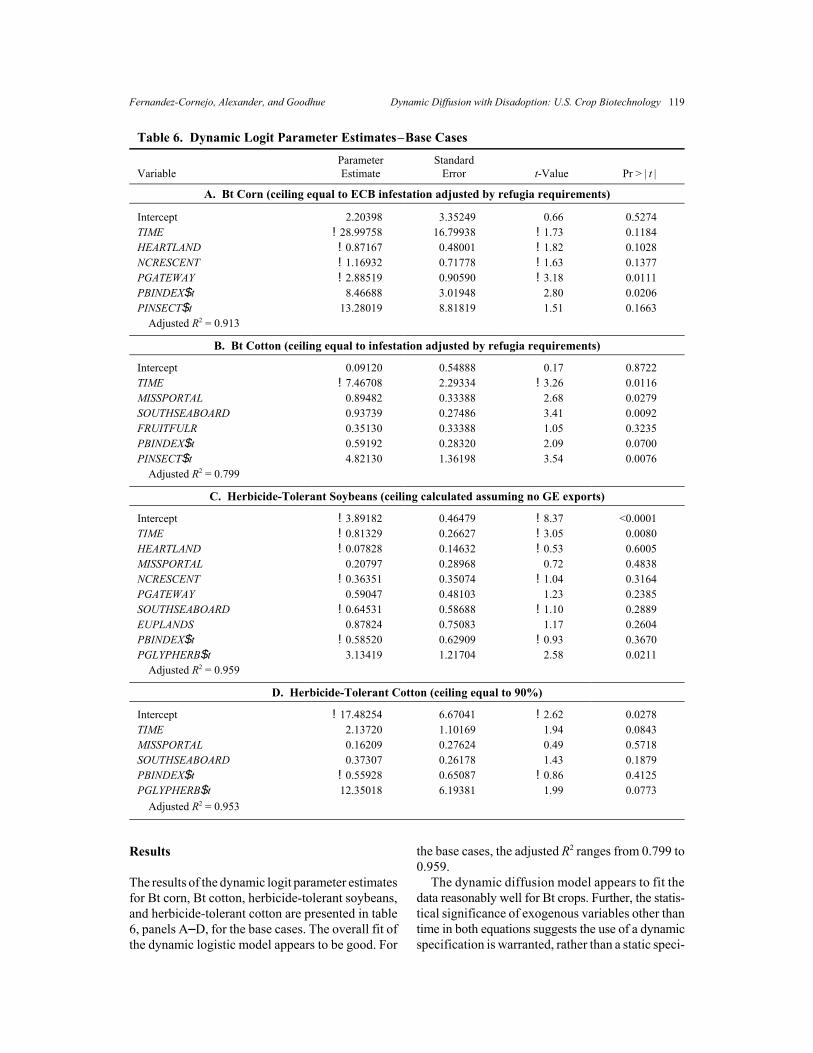
The results of the dynamic logit parameter estimatesfor Bt corn, Bt cotton, herbicide-tolerant soybeans,and herbicide-tolerant cotton are presented in table6, panels ASD, for the base cases. The overall fit ofthe dynamic logistic model appears to be good. For
the base cases, the adjusted R2 ranges from 0.799 to0.959.
The dynamic diffusion model appears to fit thedata reasonably well for Bt crops. Further, the statis-tical significance of exogenous variables other thantime in both equations suggests the use of a dynamicspecification is warranted, rather than a static speci-
120 April 2002 Agricultural and Resource Economics Review
fication. In particular, the coefficients of the rele-vant market variables have the expected sign for Btcorn and Bt cotton. For both Bt crops (table 6,panels A and B), the diffusion rate is positively andsignificantly related to the biotech stock price index,confirming biotech stock prices do capture relevantagricultural market information and serve as a lead-ing indicator of the acceptance/demand of biotechproducts. The rate of diffusion is also positivelyrelated to the price index of chemical insecticides,suggesting that the incentive to adopt the (substi-tute) Bt crops increases as insecticide prices rise.The price of insecticide is only significant, how-ever, for Bt cotton.
The lack of significance of insecticide price forthe adoption of Bt corn may be understood bynoting that, in the absence of Bt corn, the Europeancorn borer (ECB) is only partially controlled usingchemical insecticides. The economics of insecticideuse to control ECB are often unfavorable, and time-ly application is difficult. For these reasons, farmersoften accept some yield losses rather than incur theexpense of chemical insecticides to treat the ECB,and therefore do not view insecticides as a substi-tute for Bt corn adoption.
Contrary to our expectation, the adoption of herbi-cide-tolerant crops is positively and significantlyrelated to the price ratio of glyphosate to otherherbicides (table 6, panels C and D). This sign mayhave resulted from the many advantages ofherbicide-tolerant soybeans perceived by growers,who rapidly increased their adoption of herbicide-tolerant soybeans between 1995 and 1998 despitemoderate rising glyphosate prices (from about $54to more than $56 per pound). This resulted in apositive correlation between glyphosate prices andadoption. Soybean growers continued increasingadoption while the glyphosate prices declined in1999 and 2000 (glyphosate went off-patent in 2000),but this price decrease only affects the last year ofdata (2000) because we use expected (lagged) inputprices in the model. Consequently, the effect of thenegative correlation between prices and adoption in2000 was weaker than that of the positive corre-lation of the previous four years, giving an overallpositive sign.
For the herbicide-tolerant crops, the biotech stockprice index is not significantly related to adoption,indicating planting decisions regarding these cropsare not correlated with events driven by consumers’general concerns about genetically engineered crops.This, in turn, may be due to the fact that the majorityof market concerns captured in the stock price index
are related to Bt corn (refer to table 1), and in gen-eral most media coverage is related to Bt corn.5
Moreover, although corn and soybean growersare essentially the same individuals, planting deci-sions for Bt corn and herbicide-tolerant soybeansmay vary due to differences in the risk-return pro-files of the two GE crops, relative to conventionalvarieties (Alexander, Fernandez-Cornejo, and Good-hue, 2000b). In particular, the production advantagesof herbicide-tolerant soybeans may outweigh anymarket risk due to consumer concerns about gen-etically engineered crops. For Bt corn, on the otherhand, production benefits are not so large relative tomarket risk.
These results are supported by findings from focusgroups and a survey related to planting decisionsamong Iowa corn-soybean farmers reported by Alex-ander, Fernandez-Cornejo, and Goodhue (2000a,2001). Both the focus groups and the survey indi-cated that, unlike the case of Bt corn, planting deci-sions of most soybean farmers are not influenced bythe GMO controversy.
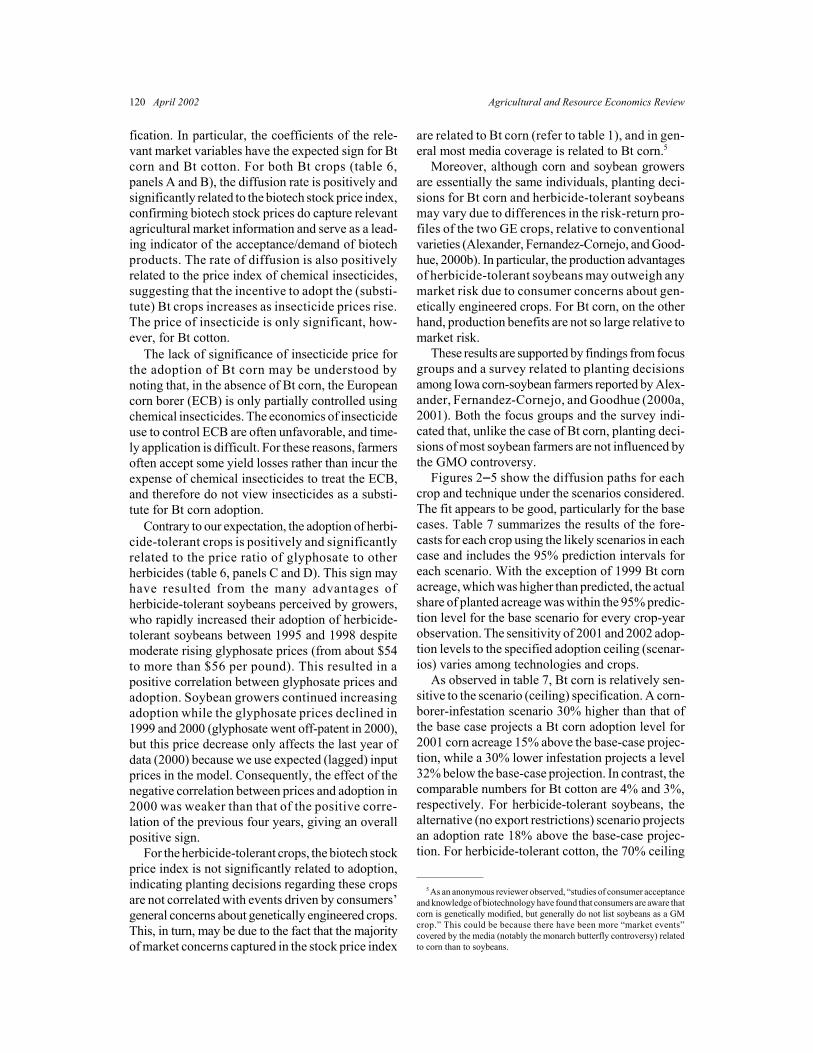
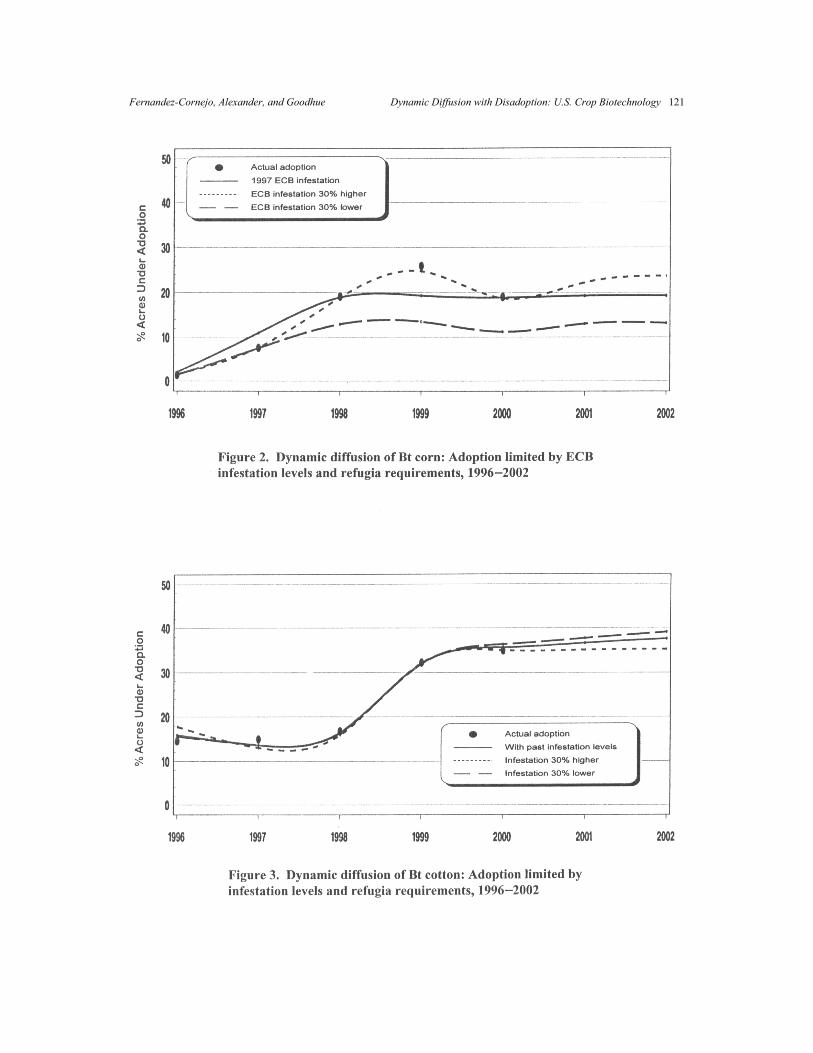
Figures 2S5 show the diffusion paths for eachcrop and technique under the scenarios considered.The fit appears to be good, particularly for the basecases. Table 7 summarizes the results of the fore-casts for each crop using the likely scenarios in eachcase and includes the 95% prediction intervals foreach scenario. With the exception of 1999 Bt cornacreage, which was higher than predicted, the actualshare of planted acreage was within the 95% predic-tion level for the base scenario for every crop-yearobservation. The sensitivity of 2001 and 2002 adop-tion levels to the specified adoption ceiling (scenar-ios) varies among technologies and crops.
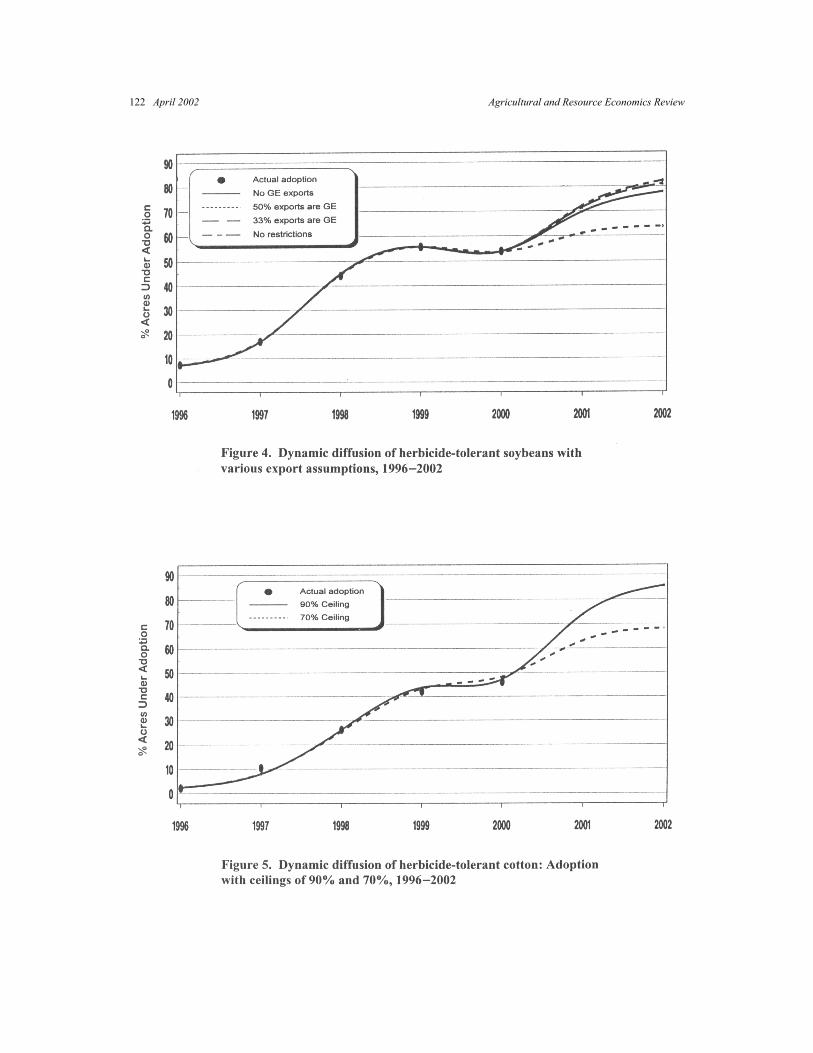
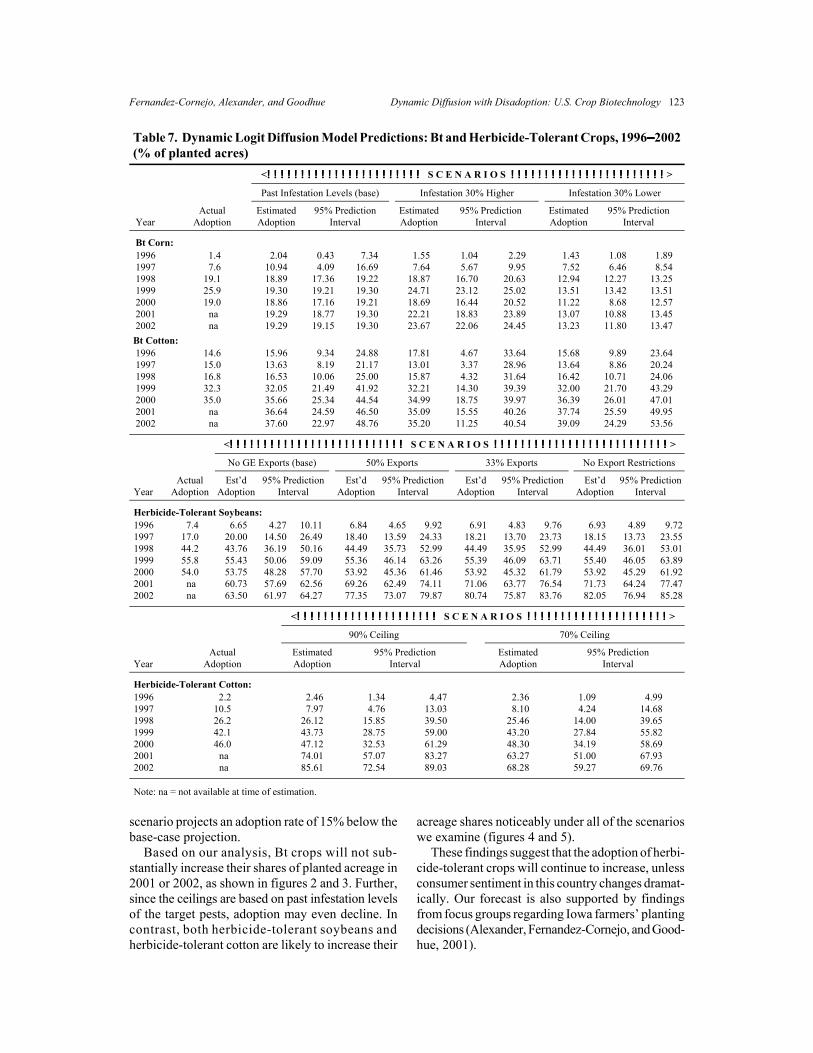
As observed in table 7, Bt corn is relatively sen-sitive to the scenario (ceiling) specification. A corn-borer-infestation scenario 30% higher than that ofthe base case projects a Bt corn adoption level for2001 corn acreage 15% above the base-case projec-tion, while a 30% lower infestation projects a level32% below the base-case projection. In contrast, thecomparable numbers for Bt cotton are 4% and 3%,respectively. For herbicide-tolerant soybeans, thealternative (no export restrictions) scenario projectsan adoption rate 18% above the base-case projec-tion. For herbicide-tolerant cotton, the 70% ceiling
5 As an anonymous reviewer observed, “studies of consumer acceptanceand knowledge of biotechnology have found that consumers are aware thatcorn is genetically modified, but generally do not list soybeans as a GMcrop.” This could be because there have been more “market events”covered by the media (notably the monarch butterfly controversy) relatedto corn than to soybeans.
Fernandez-Cornejo, Alexander, and Goodhue Dynamic Diffusion with Disadoption: U.S. Crop Biotechnology 121
122 April 2002 Agricultural and Resource Economics Review
Fernandez-Cornejo, Alexander, and Goodhue Dynamic Diffusion with Disadoption: U.S. Crop Biotechnology 123
Table 7. Dynamic Logit Diffusion Model Predictions: Bt and Herbicide-Tolerant Crops, 1996SSSS2002(% of planted acres)
<!!!!!!!!!!!!!!!!!!!!!!!!!!!!!!!!!!!!!!!!!!!!!!!!!!!!!!!!!!!!!!!!!!!!!!!!!!!!!!!!!!!!!!!!!!!! S C E N A R I O S !!!!!!!!!!!!!!!!!!!!!!!!!!!!!!!!!!!!!!!!!!!!!!!!!!!!!!!!!!!!!!!!!!!!!!!!!!!!!!!!!!!!!!!!!!!!>
Past Infestation Levels (base) Infestation 30% Higher Infestation 30% Lower
YearActual
Adoption EstimatedAdoption
95% PredictionInterval
EstimatedAdoption
95% PredictionInterval
EstimatedAdoption
95% PredictionInterval
Bt Corn: 1996 1997 1998 1999 2000 2001 2002
1.4 7.6
19.1 25.9 19.0
na na
2.0410.9418.8919.3018.8619.2919.29
0.43 4.0917.3619.2117.1618.7719.15
7.3416.6919.2219.3019.2119.3019.30
1.55 7.6418.8724.7118.6922.2123.67
1.04 5.6716.7023.1216.4418.8322.06
2.29 9.9520.6325.0220.5223.8924.45
1.43 7.5212.9413.5111.2213.0713.23
1.08 6.4612.2713.42 8.6810.8811.80
1.89 8.5413.2513.5112.5713.4513.47
Bt Cotton: 1996 1997 1998 1999 2000 2001 2002
14.6 15.0 16.8 32.3 35.0
na na
15.9613.6316.5332.0535.6636.6437.60
9.34 8.1910.0621.4925.3424.5922.97
24.8821.1725.0041.9244.5446.5048.76
17.8113.0115.8732.2134.9935.0935.20
4.67 3.37 4.3214.3018.7515.5511.25
33.6428.9631.6439.3939.9740.2640.54
15.6813.6416.4232.0036.3937.7439.09
9.89 8.8610.7121.7026.0125.5924.29
23.6420.2424.0643.2947.0149.9553.56
<!!!!!!!!!!!!!!!!!!!!!!!!!!!!!!!!!!!!!!!!!!!!!!!!!!!!!!!!!!!!!!!!!!!!!!!!!!!!!!!!!!!!!!!!!!!!!!!!!!!!!!!! S C E N A R I O S !!!!!!!!!!!!!!!!!!!!!!!!!!!!!!!!!!!!!!!!!!!!!!!!!!!!!!!!!!!!!!!!!!!!!!!!!!!!!!!!!!!!!!!!!!!!!!!!!!!!!!!!>
No GE Exports (base) 50% Exports 33% Exports No Export Restrictions
<!!!!!!!!!!!!!!!!!!!!!!!!!!!!!!!!!!!!!!!!!!!!!!!!!!!!!!!!!!!!!!!!!!!!!!!!!!!!!!!!!!!! S C E N A R I O S !!!!!!!!!!!!!!!!!!!!!!!!!!!!!!!!!!!!!!!!!!!!!!!!!!!!!!!!!!!!!!!!!!!!!!!!!!!!!!!!!!!!>
scenario projects an adoption rate of 15% below thebase-case projection.
Based on our analysis, Bt crops will not sub-stantially increase their shares of planted acreage in2001 or 2002, as shown in figures 2 and 3. Further,since the ceilings are based on past infestation levelsof the target pests, adoption may even decline. Incontrast, both herbicide-tolerant soybeans andherbicide-tolerant cotton are likely to increase their
acreage shares noticeably under all of the scenarioswe examine (figures 4 and 5).
These findings suggest that the adoption of herbi-cide-tolerant crops will continue to increase, unlessconsumer sentiment in this country changes dramat-ically. Our forecast is also supported by findingsfrom focus groups regarding Iowa farmers’ plantingdecisions (Alexander, Fernandez-Cornejo, and Good-hue, 2001).
124 April 2002 Agricultural and Resource Economics Review
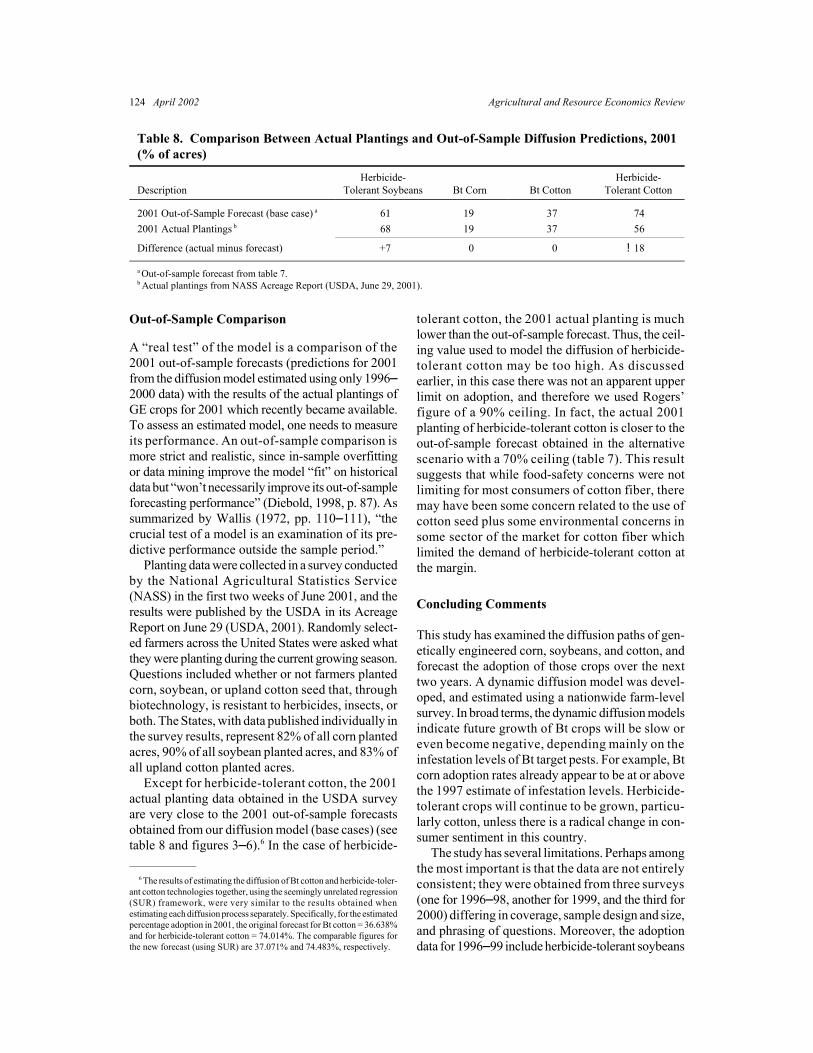
Table 8. Comparison Between Actual Plantings and Out-of-Sample Diffusion Predictions, 2001(% of acres)
DescriptionHerbicide-
Tolerant Soybeans Bt Corn Bt CottonHerbicide-
Tolerant Cotton
2001 Out-of-Sample Forecast (base case) a 61 19 37 742001 Actual Plantings b 68 19 37 56
Difference (actual minus forecast) +7 0 0 !18
a Out-of-sample forecast from table 7.b Actual plantings from NASS Acreage Report (USDA, June 29, 2001).
Out-of-Sample Comparison
A “real test” of the model is a comparison of the2001 out-of-sample forecasts (predictions for 2001from the diffusion model estimated using only 1996S2000 data) with the results of the actual plantings ofGE crops for 2001 which recently became available.To assess an estimated model, one needs to measureits performance. An out-of-sample comparison ismore strict and realistic, since in-sample overfittingor data mining improve the model “fit” on historicaldata but “won’t necessarily improve its out-of-sampleforecasting performance” (Diebold, 1998, p. 87). Assummarized by Wallis (1972, pp. 110S111), “thecrucial test of a model is an examination of its pre-dictive performance outside the sample period.”
Planting data were collected in a survey conductedby the National Agricultural Statistics Service(NASS) in the first two weeks of June 2001, and theresults were published by the USDA in its AcreageReport on June 29 (USDA, 2001). Randomly select-ed farmers across the United States were asked whatthey were planting during the current growing season.Questions included whether or not farmers plantedcorn, soybean, or upland cotton seed that, throughbiotechnology, is resistant to herbicides, insects, orboth. The States, with data published individually inthe survey results, represent 82% of all corn plantedacres, 90% of all soybean planted acres, and 83% ofall upland cotton planted acres.
Except for herbicide-tolerant cotton, the 2001actual planting data obtained in the USDA surveyare very close to the 2001 out-of-sample forecastsobtained from our diffusion model (base cases) (seetable 8 and figures 3S6).6 In the case of herbicide-
tolerant cotton, the 2001 actual planting is muchlower than the out-of-sample forecast. Thus, the ceil-ing value used to model the diffusion of herbicide-tolerant cotton may be too high. As discussedearlier, in this case there was not an apparent upperlimit on adoption, and therefore we used Rogers’figure of a 90% ceiling. In fact, the actual 2001planting of herbicide-tolerant cotton is closer to theout-of-sample forecast obtained in the alternativescenario with a 70% ceiling (table 7). This resultsuggests that while food-safety concerns were notlimiting for most consumers of cotton fiber, theremay have been some concern related to the use ofcotton seed plus some environmental concerns insome sector of the market for cotton fiber whichlimited the demand of herbicide-tolerant cotton atthe margin.
Concluding Comments
This study has examined the diffusion paths of gen-etically engineered corn, soybeans, and cotton, andforecast the adoption of those crops over the nexttwo years. A dynamic diffusion model was devel-oped, and estimated using a nationwide farm-levelsurvey. In broad terms, the dynamic diffusion modelsindicate future growth of Bt crops will be slow oreven become negative, depending mainly on theinfestation levels of Bt target pests. For example, Btcorn adoption rates already appear to be at or abovethe 1997 estimate of infestation levels. Herbicide-tolerant crops will continue to be grown, particu-larly cotton, unless there is a radical change in con-sumer sentiment in this country.
The study has several limitations. Perhaps amongthe most important is that the data are not entirelyconsistent; they were obtained from three surveys(one for 1996S98, another for 1999, and the third for2000) differing in coverage, sample design and size,and phrasing of questions. Moreover, the adoptiondata for 1996S99 include herbicide-tolerant soybeans
6 The results of estimating the diffusion of Bt cotton and herbicide-toler-ant cotton technologies together, using the seemingly unrelated regression(SUR) framework, were very similar to the results obtained whenestimating each diffusion process separately. Specifically, for the estimatedpercentage adoption in 2001, the original forecast for Bt cotton = 36.638%and for herbicide-tolerant cotton = 74.014%. The comparable figures forthe new forecast (using SUR) are 37.071% and 74.483%, respectively.
Fernandez-Cornejo, Alexander, and Goodhue Dynamic Diffusion with Disadoption: U.S. Crop Biotechnology 125
obtained using traditional breeding methods (notGE). The 2000 data, on the other hand, excludedthese varieties.7 Also, the ceilings for Bt crops maychange with time as the infestation levels changedue to exogenous factors, and also endogenously(e.g., the extent of Bt crops planted in a given yearis likely to affect the infestation levels of the follow-ing years). The overall findings regarding the patternof adoption for Bt and herbicide-tolerant crops, how-ever, are unlikely to be qualitatively altered by thesedata limitations.
In addition, it should be stressed that this forecastis only valid for adoption of the technologies cur-rently approved and commercially available. In par-ticular, the diffusion estimates exclude the adoptionof rootworm-resistant corn, expected to be availablein 2002/3.
The price index of agricultural biotech stocks is agood proxy for market demand conditions for gen-etically engineered crops. This stock price index doescapture relevant agricultural market information andserves as a leading indicator of the acceptance/de-mand of those biotech products. However, the indexis not a very effective proxy for those GE cropswhere planting decisions are not correlated withevents driven by consumer concerns about GE crops.
Finally, the diffusion estimates were calculatedbefore the StarLink incident.8 While it is likely thiscontamination problem may have some constrictingeffect on farmers’ future plantings of GE crops, par-ticularly Bt corn, we believe the drop in adoption willnot be more drastic than a 30% reduction in ECBinfestation levels. [A recent Reuters News Servicepoll taken during the Farm Bureau Federation an-nual convention among 400 farmers showed that theStarLink contamination had little impact on U.S.farmers’ loyalty to bio-crops, and most U.S. farmers“shrugged off global concerns about geneticallymodified crops and plan to reduce their 2001 springplantings only slightly” (Fabi, 2001).]
References
Alexander, C., J. Fernandez-Cornejo, and R. E. Goodhue. (2000a,August). “Determinants of GMO Use: A Survey of Iowa Corn-Soybean Farmers’ Acreage Allocation.” Paper presented atthe Fourth International Conference on the Economics ofAgricultural Biotechnology, Ravello, Italy.
———. (2000b). “The Effects of the GMO Controversy on Corn-Soybean Farmers’ Acreage Allocation Decisions.” Selectedpaper presented at the AAEA annual meetings, Tampa, FL,July 30SAugust 2.
———. (2001, Winter). “Iowa Producers’ Adoption of Bio-Engineered Varieties: Lessons for California.” Agriculturaland Resource Economics Update 4(2), 5S7. [Published bythe University of California, Davis.]
Bjornson, B. (1998, Fall). “Capital Market Values of Agricul-tural Biotechnology Firms: How High and Why?” AgBio-forum 1(2), 69S73.
Diebold, F. X. (1998). Elements of Forecasting. Cincinnati, OH:South Western College Publications.
Dixon, R. (1980). “Hybrid Corn Revisited.” Econometrica 48,1451S1461.
Dohlman, E., T. Hall, and A. Somwaru. (2000). “The Impact ofChanging Consumer Preferences and Market Events on Agri-cultural Biotechnology Firm Equity Values.” Selected paperpresented at the AAEA annual meetings, Tampa, FL, July30SAugust 2.
Eichenwald, K. (2001, January 25). “Redesigning Nature: HardLessons Learned; Biotechnology Food: From the Lab to aDebacle.” The New York Times, p. A1.
Fabi, R. (2001, January 10). “Poll–U.S. Farmers to Cut Bio-cropOutput Only Slightly.” Reuters News Service. Online.Available at http://news.excite.com/news/r/010110/18/food-biotech-usa.
Fernandez-Cornejo, J., and W. D. McBride. (2000). “GeneticallyEngineered Crops for Pest Management in U.S. Agriculture:Farm-Level Effects.” Agricultural Economics Report No.785, Economic Research Service, U.S. Department of Agri-culture, Washington, DC.
Griliches, Z. (1957). “Hybrid Corn: An Exploration in the Eco-nomics of Technological Change.” Econometrica 25, 501S522.
Henderson, P. (1999, March). “Resistence Fighter: Here’s theAdvice on Bt Corn Refuge Design, Hybrid Selection.” Soy-bean Digest, pp. 84S85.
Jaffe, A. B., R. G. Newell, and R. N. Stavins. (2000). “Techno-logical Change and the Environment.” Discussion Paper No.00-47. Resources for the Future, Washington, DC.
Jarvis, L. S. (1981). “Predicting the Diffusion of ImprovedPastures in Uruguay.” American Journal of Agricultural Eco-nomics 3, 495S502.
Karshenas, M., and P. Stoneman. (1992). “A Flexible Model ofTechnological Diffusion Incorporating Economic Factorswith an Application to the Spread of Colour Television Own-ership in the UK.” Journal of Forecasting 11, 577S601.
Knudson, M. K. (1991). “Incorporating Technological Changein Diffusion Models.” American Journal of Agricultural Eco-nomics 3, 724S733.
Lin, W., G. K. Price, and E. Allen. (2001, April). “StarLink:Impacts on the U.S. Corn Market and World Trade.” In FeedYearbook (pp. 40S48). Pub. No. FDS-2001, USDA/EconomicResearch Service, Washington, DC.
7 Based on a survey conducted through the University of California-Davis, the acreage of herbicide-tolerant soybeans obtained using traditional(non-GE) methods in Iowa was about 2% of the soybean acreage in 1999(Alexander, Fernandez-Cornejo, and Goodhue, 2000a, 2001). The corres-ponding U.S. figure is likely to be less. Thus, the measurement error forthe case of soybeans in 1999 is likely to be between 1 and 2%.
8 A news headline reported on September 20, 2000, that some tacoshells sold in retail stores contained a protein from StarLink corn, a varietyof Bt corn that contained the Cry9C protein, approved by the EPA for feedand industrial uses but not for human consumption (due to a possiblequestion about its potential to cause allergic reactions) (Lin, Price, andAllen, 2001). While StarLink corn was only grown on less than 1% of U.S.corn acreage, the discovery of the protein in some corn foods led to therecall of nearly 300 food products and had repercussions throughout thegrain handling chain, processing, as well as in global grain trade (Lin,Price, and Allen).
126 April 2002 Agricultural and Resource Economics Review
Mahajan, V., and R. A. Peterson. (1985). Models for InnovationDiffusion. Sage University Paper Series on Quantitative Appli-cations in the Social Sciences. Beverly Hills, CA: Sage Pub-lications.
Pike, D. R. (1999, August 5). Cornfield ECB infestation data, 1997crop year. University of Illinois Extension, College of Agricul-tural, Consumer, and Environmental Sciences, University ofIllinois, Urbana-Champaign. Personal e-mail communication.
Rogers, E. M. (1983). Diffusion of Innovations, 3rd edition. NewYork: Free Press.
Ryan, B., and N. C. Gross. (1943). “The Diffusion of Hybrid SeedCorn in Two Iowa Communities.” Rural Sociology 8, 15S24.
Tarde, G. (1903). The Laws of Imitation. New York: Holt.U.S. Department of Agriculture. (1999a, June 28). “New U.S.
Farm Resource Regions.” Issues Center, USDA/EconomicResearch Center, Washington, DC. Online. Available at http://www.econ.ag.gov/whatsnew/issues/regions/index.htm.
———. (1999b, October 8). Crop Production. USDA/NationalAgricultural Statistics Service, Washington, DC. Online.Available at http://usda.mannlib.cornell.edu/reports/nassr/field/pcp-bb/1999/crop1099.txt.
———. (2000b, March 31). Prospective Plantings. USDA/National Agricultural Statistics Service, Washington, DC.Online. Available at http://usda.mannlib.cornell.edu/reports/nassr/field/pcp-bbp/pspl0300.txt.
———. (2000c, April). Agricultural Outlook (p. 88). USDA/Economic Research Service, Washington, DC.
———. (2000d, June 30). Acreage. USDA/National AgriculturalStatistics Service, Washington, DC. Online. Available athttp://usda.mannlib.cornell.edu/reports/nassr/field/pcp-bba/acrg0600.pdf.
———. (2001, June 29). Acreage. USDA/National AgriculturalStatistics Service, Washington, DC. Online. Available athttp://usda.mannlib.cornell.edu/reports/nassr/field/pcp-bba/acrg0601.pdf.
U.S. Environmental Protection Agency (EPA), Office ofPesticide Programs. (1999, May 7). “EPA and USDA Posi-tion Paper on Insect Resistance Management in Bt Crops.”Online. Available at http://www.epa.gov/pesticides/biopesti-cides/otherdocs/bt_position_paper_618.htm. [minor revisionsJuly 12].
Wallis, K. F. (1972). Introductory Econometrics. Lectures inEconomics, 2. Chicago: Aldine Publishing Co.
Williams, M. R. (1996S2000). Cotton Insect Losses. Reportissued annually in each of the five years cited. Department ofEntomology, Mississippi State University, MS. Online.Available at http://www.msstate.edu/Entomology/CNT-LOSS.