39
Dynamic modeling of fertility and labour market participation of married or cohabiting women C. Edon and Th. Kamionka Discussion Paper 2010-17
Dynamic modeling of fertility and labour marketparticipation of married or cohabiting women
C. Edon and Th. Kamionka
Discussion Paper 2010-17

Dynamic modeling of fertility and labour marketparticipation of married or cohabiting women
Cyriaque Edon∗ Thierry Kamionka†
This version : April 2010
Abstract
We jointly model fertility and participation decisions of women who livein couple using a dynamic model. In this paper we analyze the labour supplyand the fertility decisions of married or cohabiting women in France, Spain,Germany, UK and Denmark. We estimate, for the period going from 1994 to2001, a dynamic bivariate probit model with random effects using the ECHP(European Community Household Panel) and using a simulated maximumlikelihood estimator. These estimates are made on an annual basis takinginto account the initial conditions problem. The decisions of participationand fertility of women who live in couple depend on the individual charac-teristics (observed or unobserved) and are characterized by a significant statedependence. Our results suggest that the decisions of employment and fer-tility cannot be modeled separately. The difference of fertility across thesecountries is explained by individual characteristics and variations of socialand fiscal policies across countries. However, the unobserved componentsof heterogeneity also play a central role in the observed differences acrosscountries. We show the importance of the permanent income component inthe participation decision. Random effects are negatively correlated acrossthe equations of the model. Consequently, women who, a priori, prefer tohave a higher consumption have weaker preferences for fertility.
Keywords : Participation, Heterogeneity, Simulation based estimation, Panel data.JEL Classification : J21, J22, C33, C35, J13.
∗ Université Catholique de Louvain and IRES ([email protected]). Phone : (32) 10 47 39 74.Address: IRES. 3, Place Montesquieu. 1348 Louvain-la-Neuve. Belgique.† CNRS and CREST ([email protected]). Phone : (33) (0)1 41 17 35 51. Address: CREST. Timbre
J390. 15, Boulevard Gabriel Péri. 92245 Malakoff Cedex. France.We would like to thank Georges Bresson, Guy Lacroix, David Margolis, Bruno Van der Linden, Christian Viege-lahn and Leonard Wantchekon for helpful discussions and comments. We are also grateful to the participants atthe UCL-IRES Research Seminar, at the 64th European Meeting of the Econometric Society (EEA-ESEM 2009)and at the European Association of Labour Economists (EALE 2009) for useful comments.

1 Introduction
Most empirical studies on female labour supply behavior rely on exogeneity offertility decisions with respect to labour supply and show a negative impact of fer-tility on labour participation. This negative correlation between fertility and em-ployment or participation decreases with the age of the youngest child (e.g Mincer(1962), (1963), Heckman (1980)). However, this relation is not necessarily causal.The negative effect of fertility may be the result of a selection phenomenon wherewomen who have higher preferences for fertility have also weaker preferences forconsumption. Mroz (1987) shows, using cross section data, that conditionally onparticipation, fertility is exogenous with respect to women labour supply. However,using panel data, Jakubson (1991) rejects the assumption of exogeneity of fertility.
The econometric problem associated to the endogeneity of fertility decisionwith respect to female labour supply has been considered in several papers. Mof-fitt (1984) and Hotz, Kydland and Sedlacek (1988) treat the endogeneity problem,estimating the determinants of fertility and labour supply within a simultaneous-equation framework. Rosenzweig and Wolpin (1980), Bronars and Grogger (1994),Angrist and Evans (1998), Jacobsen, Pearce and Rosenbloom (1999), Angrist (2001)suggest to look for "natural" experiments, such as the occurrence of twins in thefirst birth. Another solution is to use instrumental variables to take into account thepotential endogeneity of fertility. For instance Angrist (2001) exploits an exclusionrestriction based on the sex of the first two children.
These studies show that the impact of fertility on labour market participationcan be significantly different when the endogeneity of fertility is taken into accountin the estimation. However, the results can vary a lot according to the specificationused. In these studies most authors use a linear probability model to approximatenon-linear relations or estimate the parameters using a two-step estimation proce-dure.
In addition, an extensive literature based on panel data that examines femalelabour supply indicates that there is persistence in the life cycle participation deci-sions of mothers. Heckman and Willis (1977), Nakamura and Nakamura (1985),Eckstein and Wolpin (1989) show that the majority of them work for most of theiractive life or do not work at all, and participation in one period has an impact onthe participation probability in future periods. This persistence, usually referredto as "true state-dependence", may reflect the accumulation of human capital or achange in the reservation wage due to increased search costs or a potential loss ofskills when they are not employed. According to human capital theory, skills ac-cumulated through experience raise the probability of working in the future. Sim-ilarly, fixed costs of entering the labour force (search costs, for example) make fu-ture participation more likely for individuals already working. A high persistencecould imply that policies targeted at reducing the costs of participation could be ef-fective. The presence of state dependence is very important when studying womenlabour supply, in particular when we analyze the effect of fertility on participation.
1
A long maternity leave lead to a decline in human capital investment, and possiblyto a depreciation of the human capital stock. Ignoring this component is likely tobias the estimations. For example, Nakamura and Nakamura (1985, 1994) showthat the mere presence of a child does not influence current labour supply whenthey take state dependence into account.
The persistence of participation decisions can also be the result of unobservedheterogeneity that reflects the differences in preferences for employment (called"spurious state-dependence"). Heterogeneity creates persistence because of self-selection of those with high preferences for employment. This creates spurious de-pendence of aggregate transition probabilities on previous state. True and spuriousstate-dependence have different implications on the design of social and economicpolicies. It is therefore important to disentangle the relative importance of thesetwo causes of persistency.
Recent studies of female labour supply explore the role of true and spuriousstate-dependence on employment (e.g., Hyslop (1999) and Carrasco (2001), Edonand Kamionka (2008), Edon (2008), Del Boca and Sauer (2008)). Hyslop (1999)finds that participation decisions are characterized by substantial unobserved het-erogeneity and positive state dependence. He also finds negative serial correlationin the transitory errors in specifications that allow for state dependence. Usingthe same specification as Hyslop (1999) in which he considers both state depen-dence forms, Edon and Kamionka (2008) show that the decision of participationof women who live in couple depends on individual characteristics and is char-acterized by a significant true state-dependence. In addition, the components ofunobserved heterogeneity play a central role in the dynamics of labour marketparticipation. This unobserved heterogeneity reflects differences in trade-off be-tween consumption, leisure and domestic production. But, to our knowledge, ex-cept Del Boca and Sauer (2008) and Edon (2008), there are no studies that analyzethe importance of true and spurious state-dependence across countries.
In line with Del Boca and Sauer (2008), we believe that in addition to humancapital accumulation and search costs, the differences in the degree of state de-pendence across countries can be explained by institutional factors. In this case thedifference in estimated values of state dependence in female labour supply betweencountries may, in large part, be the result of the differences in institutional environ-ments, like labour market flexibility and child care. However, unlike Del Boca andSauer (2008), we consider a dynamic framework to analyze both participation andfertility decisions. In addition, in our specification, the current participation equa-tion depends on the current fertility decision. Unobserved heterogeneity is handledusing individual random effects. These random effects can be correlated acrossequations. We allow the error terms of the equations to be correlated. Initial condi-tions are dealt with the method of Wooldridge (2005). The model is estimated bymaximization of simulated likelihood (Kamionka (1998), Fougère and Kamionka(2008)) and using data from the European ECHP for 5 countries: Denmark, France,Germany, Spain and UK.
2

The estimation results show that the main empirical implications of classiclabour supply model are verified : diploma has a positive impact on employment,the permanent component of the non-labour income has a negative impact on em-ployment. We observe two effects of fertility on female labour supply: a negativedirect effect which is higher in countries where the duration of maternity leave islarger - for Denmark and France - and a dynamic effect whose intensity dependson the institutional environment, such as childcare availabilities - for Denmarkand France -, labour market flexibility - for Denmark and UK - and cultural pa-rameters such as family ties - for Spain. The institutional or social environmentsmight explain the persistence of the participation outcome decision ("true state-dependence") which differs across countries.
We also show the existence of a large and negative correlation between partic-ipation decision and fertility. This correlation is captured by the individual effects("spurious state-dependence"). This result suggests that women who have a strongpreferences for maternity tend to have a weaker preference for consumption andemployment. There is no correlation between the error terms of the equations inany country. For the model estimated for all the countries, the correlation betweenfertility and participation decision is large and negative and the correlation betweenthe idiosyncratic terms is positive. The impact of the permanent component of thenon-labour income is negative on participation. The impact of the transitory in-come is negative on fertility and positive on the participation decision.
The initial presence of a young child - at the time of the first survey - has anegative impact on fertility. The presence of a young child has a large and negativeeffect on employment. Consequently, the initial state is informative regarding theimportance of fertility. As predicted by the classic labour supply theory, the impactof the diploma is positive and increases with the level of diploma.
The paper is organized as follows. The empirical model is presented in section2. The data we use is described in section 3 where some descriptive statistics arediscussed. We then present and comment the estimation results in section 4. Thelast section concludes.
2 Specification
In the labour supply literature, several authors have stressed that labour marketparticipation and fertility decisions are the outcomes of a dynamic process wherethe effect of children on labour supply depends, in large part, on how previouslabour supply and children are treated (e.g. Moffitt (1984),Hotz and Miller (1988),Keane and Sauer (2006)). According to the life-cycle model, in addition to vari-ables describing observed heterogeneity, current employment decisions depend onpast decisions. This allows to account for the search costs associated with labourmarket entry and labour market opportunities which differ with the individual’sparticipation state (e.g Hyslop (1999)). Current employment may also depend on
3
the number of children in the household and the new births which are respectivelythe result of past and current fertility decisions.
Like Carrasco (2001), we consider a dynamic equation for fertility which al-lows for feedback and in which the gender mix of existing children is used toidentify the effect of a newborn on employment. The decision of childbearing maydepend on current employment. For employed women, the perspective of incurringhigh costs upon returning may lead them to stay in employment and to delay birth(Garibaldi and Wasmer (2004)). Thus, we include the past employment state in thefertility equation because current birth is the result of past fertility decisions whichdepend on previous participation decisions.
2.1 Modeling
Let y∗it and d∗it denote the latent variables associated with, respectively, participa-tion and fertility decisions of woman i at time t.
We make the assumption that the existing relation between these variables andthe characteristics of the women is the following:
y∗it = x′itβ1 + γ1 yit−1 + αdit + ξi1 + uit
d∗it = x′itβ2 + z′itδ + γ2 dit−1 + γ3 yit−1 + ξi2 + vit.(1)
where yit is equal to 1 if woman participates in the labour market and 0 otherwise(t = 1, . . . , T and i = 1, . . . , n). Fertility at time t, namely dit, is equal to 1 whena child was born during the last twelve months and 0 otherwise. xit is a vector ofobservable characteristics which includes the marital status, partner’s income, edu-cation level, age and demographic characteristics such as the existence of childrenin the household.
yit−1 and dit−1 represent, respectively, the indicator variables for labour marketparticipation and fertility at time t − 1. β1 and β2 are vectors of parameters. γ1,γ2 and α are real scalars (γ1, γ2, γ3 and α ∈ IR). ξi1 and ξi2 are individual effectsand, consequently, are constant with time. uit and vit are error terms for woman iand period t.
zit is a vector of instruments for fertility including a variable that indicateswhether the first two children have the same gender and another variable that char-acterizes the gender of the eldest children. This kind of instrument was suggestedby Angrist (Angrist and Evans 1998) because it is likely to be exogenous withrespect to the error term of the participation equation but correlated with futurebirths. These variables are probably good instruments since they are independentof uit and are highly correlated with dit. Let us remark that, in our sample, be-tween 38.54 % and 65.34 % of women have at least two children, depending onthe country.
4
Here, the only income taken into account for a woman who has to decide toparticipate or not - except the wage she receives when she is employed - is theincome received by her partner. It can incorporate, according to the employmentstatus of the partner, the unemployment benefit received by this individual. Inpractice, we do not consider in the specification those social benefits that dependon the total income of the household and on the number of children. This choiceallows to avoid endogeneity problems associated to the non-wage income of thewomen.
y∗it and d∗it are unobservable variables. We observe the result of the choice ofwoman i :
yit = 1I [y∗it > 0 ],
dit = 1I [d∗it > 0 ],
where t = 1, . . . , Ti and i = 1, . . . , n.
We make the assumption that ξi = (ξi1, ξi2)′ | xi, zi ∼ N(0,Σξ) and that ξiis independent of xi and zi. The random effects ξi, i = 1, . . . , n, are furthermoreassumed to be independent across women. A priori, the individual effects for agiven individual can be correlated across the equations.
Let εit = (uit, vit)′ be a vector of the error terms at time t for woman i. Let usassume that these error terms are independent across women and across periods.Moreover, εit | xi, zi ∼ N(0,Σε), where
Σε =(
1 ρuvρuv 1
),
where ρuv = cov(uit, vit) since var(uit) = var(vit) = 1.
2.2 Initial conditions
When we use a dynamic model, it is important to take into account the initialconditions when these conditions cannot reasonably be considered as exogenous.This problem has been underlined by Heckman (1981). Indeed, when the obser-vation of a process starts after the first date of the process, the initial conditionsare informative of unobserved heterogeneity. Recently, Wooldridge (2005), hasproposed a simple method in order to take into account the problem of initial con-ditions in the context of a dynamic model with individual random effects. Letxi = (x′i1, x
′i1, . . . , x
′iT )′ and zi = (z′i1, z
′i1, . . . , z
′iT )′ be two vectors of exogenous
characteristics for individual i.
Let f(ξi | xi, zi, yi1, di1; Σξ) be the density probability function associatedto the conditional distribution of the variable ξi given the initial conditions forparticipation and fertility (namely, yi1 and di1).
5

For the conditional distribution of the vector of individual effects, we assumethat
ξi1 = a0 + a1 yi1 + (x′i, z′i) b1 + ei1,
ξi2 = c0 + c1 di1 + (x′i, z′i) b2 + ei2,
where ei ∼ N(0,Σξ) and
Σξ =(
σ2ξ1
ρξ1ξ2σξ1σξ2ρξ1ξ2σξ1σξ2 σ2
ξ2
).
Then, the latent model can be re-written
y∗it = x′itβ1 + γ1 yit−1 + αdit + a0 + a1 yi1 + (x′i, z′i) b1+ei1+uit,
d∗it = x′itβ2 + zitδ + γ2 dit−1 + γ3 yit−1 + c0 + c1 di1 + (x′i, z′i) b2 + ei2 + vit,
where the variables ei = (ei1, ei2)′ are independently and identically distributedhas normal random variables N(0,Σξ).
2.3 Identification
The specification corresponds to a bivariate probit model with random effects. Letrijt denote the residual for individual i at time t and for equation j (j = 1, 2). Letri denote the vector of residuals of the latent model for all the times and all theequations:
ri =
ri11 = ui1 + ei1,...
ri1T = uiT + ei1,ri21 = vi1 + ei2,
...ri2T = viT + ei2.
Let Σ1 = σ2ξ1
1IT1I ′T , Σ2 = σ2ξ2
1IT1I ′T , Σu = σ2u IT , Σv = σ2
v IT , Σ12 =ρξ1ξ2σ
2ξ1σ2ξ2
1IT1I ′T and Σuv = ρuv σ2uσ
2v IT .
The variance of the error term of the latent model V = V ar(ri) is given by theexpression
V =(
Σ1 + Σu Σuv + Σ12
Σuv + Σ12 Σ2 + Σv
)The extra diagonal elements of this symmetric matrix are identified like in a multi-variate probit model.
Let us remark that cov(rijt; rijt′) = var(eij) = σ2ξj, for j = 1, 2 and t 6= t′.
So, the variance of the random effect is identified using the panel dimension of thedata. These parameters are identified using the correlations corresponding to timet and time t′ for a given equation of the model.
6
Moreover, cov(rijt; rij′t′) = cov(eij , eij′) = ρξ1ξ2σξ1σξ2 , if j 6= j′ and t 6= t′.The parameter ρξ1ξ2 is then identified using the correlations corresponding to timet and time t′ between fertility and employment.
Let us note that
cov(rijt; rijt) ={σ2ξ1
+ σ2u, if j = 1,
σ2ξ2
+ σ2v , if j = 2,
for t = 1, . . . , T .As the endogenous variables are binary variables, let us assume that σ2
u = σ2v =
1.Moreover, cov(ri1t; ri2t) = cov(ei1+uit; ei2+vit) = ρξ1ξ2σξ1σξ2+ρuv. Then,
ρuv is identified using the correlation corresponding to time t between fertility andemployment equations.
2.4 Likelihood function
Let us consider an independent and identically distributed sample with size n. Un-der our assumptions, the likelihood function is
L(θ) =n∏i=1
+∞∫−∞
+∞∫−∞
T∏t=2
Φ2(zit(ei1), wit(ei2); ρit) φ2(ei1, ei2,Σξ) d ei1 d ei2, (2)
where φ2(e1, e2,Σξ) = 12π |Σξ|1/2
exp(−12(e1, e2)Σ−1
ξ (e1, e2)′) and
zit(ei1) = (2yit−1) (x′itβ1+γ1 yit−1+αdit+a0+a1 yi1+(x′i, z′i) b1+ei1),
wit(ei2) = (2dit−1) (x′itβ2+zitδ+γ2 dit−1+γ3 yit−1+c0+c1 di1+(x′i, z′i) b2+ei2),
ρit = (2 yit − 1) (2 dit − 1) ρuv.
As the contribution (2) of a given individual to the likelihood function has noclosed form, we simulate this function using random drawings ehij , h = 1, . . . ,H ,for each individual i and equation j, j = 1, 2.
We can then obtain an estimation of the vector θ of parameters maximizing thelogarithm of the simulated likelihood function:
ˆ̀N,H(θ) =
N∑i=1
ln(1H
H∑h=1
T∏t=2
Φ2(zhit;whit; ρit)) (3)
where zhit = zit(ehi1) et whit = wit(ehi2). The drawings ehij are specific to the indi-vidual i, and independent and identically distributed (i = 1, . . . , n).
Indeed, the individual contribution (2) to the likelihood function can be esti-mated using (cf. Gouriéroux and Monfort (1997)):
p̂Hi =1H
H∑h=1
T∏t=2
Φ2(zhit;whit; ρit) (4)
7
where zhit = zit(ehi1) and whit = wit(ehi2). ehij = (ehi1, ehi2)′ are random drawings
obtained from the distribution N(0,Σξ). These drawings allow to generate errorterms from the equations of the model. H is the total number of drawings used foreach individual. p̂Hi is an estimation of the contribution i to the conditional like-lihood function. j = 1, 2 is the index, respectively, for participation and fertilityequations.
Let us remark that the drawing ehij = (ehi1, ehi2)′ is obtained from the distribution
N(0,Σξ). In order to obtain one of these drawings let ηhij ∼ N(0, 1) for j = 1, 2and ηhi = (ηhi1, η
hi2)′. Let Σξ = C C ′ where C is a lower triangular matrix. Then,
let us assume that ehi = C ηhi where the drawings ehi are specific to individual i andindependent.
3 Data
3.1 Sample selection
The data used in this study are from the European Community Household Panel(ECHP). The ECHP is a community survey launched by the Statistical Office of theEuropean Communities (EUROSTAT) in 1993 in the 12 countries of the EuropeanUnion1. In the first wave of 1994 a sample of some 60, 500 households- approxi-mately 130, 000 adults aged 16 years and over - were interviewed in the 12 memberStates. The ECHP is a longitudinal survey based on a standardized questionnairethat involves the annual interview of a representative panel of households and in-dividuals, covering a wide range of topics including demographics, employmentcharacteristics, education. The aim of the ECHP is to obtain a unique and coherentcommunity source in the field of households and individuals incomes, before andafter the implementation of the domestic market. Even if the income representsthe central information, this survey covers diverse domains such as employment,education, accommodation, health and social relationships. It allows to study, in adynamic way, the links between income and these various terms. It also authorizesa comparative analysis between individuals and across countries because data col-lection method and questionnaires are standardized. This will allow the distinctionbetween institutional and individual specificities.
The survey began in 1994. It was originally decided to conduct this survey forthree years but it was then prolonged until 2001. Our study is based on the eightcalendar years 1994 − 2001 corresponding to waves 1 to 8. The working sampleis restricted to women, aged between 20 and 56 years old in 1994, continuouslyliving in couple (married or not) during the period. The restriction on age allows
1At the beginning, in 1994, the ECHP data were collected in the 12 Member States (Germany,Belgium, Denmark, Spain, France, Greece, Ireland, Italy, Luxembourg, Netherlands, Portugal andthe UK) by "National Data Collection Units", either National Statistical Institutes (NSIs) or researchcenters depending on the country. They were joined by Austria in 1995, by Finland in 1996, then bySweden in 1997.
8

to cover the activity period. The condition imposed on the marital situation isnot very strong. Indeed, the women in our sample are in couple during all of thefollow up period, but it is possible for them to change spouse. There is not, to ourknowledge, in the ECHP, any variable allowing to notice the household changesfollowing a separation. However, if a woman changes partner between 1994 and2001, the effect of this change on the employment or fertility can be observedthrough the effect of spouse’s income which can vary over the time.
We consider five countries: Denmark, France, Germany, Spain and UK. Wefocus our analysis on these countries because they differ in terms of institutionsrelated to employment and childcare. Furthermore, each of these countries rep-resents one of five regimes of welfare state which prevail in Europe according tothe typology established by Esping-Andersen (Esping (1990)). According to them,Denmark belongs to the "social universalist democratic regime" which is char-acterized by flexible labour markets and generous welfare policies. These poli-cies are financed by relatively high taxes on labour income and/or social securitycontributions. This regime is in general observed in the Nordic countries. The"conservative regime" represented by Germany is characterized by a family pol-icy less generous than the Nordic regime and likely to vary according to parent’semployment status. Social transfers are related to previous earnings, and means-tested social transfers act as a residual safety net. In the UK, qualified by a "liberalregime", children are supposed to pertain to the privacy domain. The State plays aguiding role and intervenes only in poor families. In this regime, social transfers,often means-tested, are less generous than in other regimes. The labour marketis relatively flexible. Family policies are financed with lower income taxes andlower social security contributions, when compared to the universalist and the con-servative welfare regimes. In the "Mediterranean regime" characterized by Spain,the prevailing institutional regime relies on family ties rather than on social insur-ance. As in the liberal regime, social transfers are given less generously than inthe universalist and the conservative regimes. But unlike the Anglo-Saxon system,this policy is motivated only by the economic situation of countries and not by anideologic concept. The French regime is a mix of the universalist and conservativeregimes. Public policy encourages women to work. Like in the universalist regime,social transfers are relatively generous in France.
We use a balanced version of the ECHP panel in order to have the same tem-poral dimension for all individuals. This means that we retain in our study onlywomen who are present during the eight years of survey. This choice is guidedby the analysis of the income effect on employment. It is necessary to have anidentical time length for all individuals in order for the effect of permanent non-labour income which is estimated by the sample average of the spouse income tobe comparable. It is possible to use a balanced panel data without consequencefor the estimations because the individuals are followed in their geographical andprofessional mobility: this limits attrition rates.
Finally, we retained in our sample the trajectories of women for which indi-
9

Table 1: Sample characteristics
France Germany Spain UK Denmark
Education level(a)
Low educ. 46.36 21.97 71.53 51.04 20.52
(0.498) (0.414) (0.451) (0.500) (0.404)
Middle educ. 28.88 58.57 13.74 13.06 44.42
(0.453) (0.493) (0.344) (0.337) (0.497)
Higher educ. 23.13 18.83 14.73 35.14 34.98
(0.421) (0.391) (0.354) (0.477) (0.477)
Fecundity(a)
Number of 1.53 1.29 1.85 1.17 1.23children(b) (1.172) (1.075) (1.088) (1.039) (1.128)
Number of 15.03 9.40 10.81 11.65 15.44children aged 0-2 years(c) (0.357) (0.292) (0.311) (0.321) (0.361)
Number of 12.59 8.26 10.05 9.98 12.19children aged 3-5 years(c) (0.332) (0.275) (0.301) (0.299) (0.327)
Number of 32.51 25.48 31.16 24.23 28.60children aged 6-11 years(c) (0.468) (0.436) (0.463) (0.428) (0.452)
Number of 24.15 21.22 25.19 16.55 19.25children aged 12-16 years(c) (0.428) (0.409) (0.434) (0.372) (0.394)
Number of children 34.55 37.16 51.91 28.56 24.73aged 17 years and more(c) (0.476) (0.483) (0.500) (0.451) (0.431)
Partner’s income(b) 25.47 23.02 14.57 22.31 25.75(in KE 2001) (25.52) (14.07) (11.97) (16.60) (13.43)
Elements of biography
Age(b) 42.22 42.97 43.58 42.73 42.74(9.32) (9.918) (9.29) (9.80) (9.642)
Capital(a) 20.33 2.86 9.65 7.62 8.17
(0.402) (0.170) (0.295) (0.265) (0.274)
Married(a) 89.91 94.85 99.16 94.68 86.29
(0.301) (0.221) (0.091) (0.224) (0.344)
Citizenship(a)
Nationals 95.70 85.21 99.35 98.17 98.69
(0.203) (0.355) (0.080) (0.134) (0.114)
Immigrant 7.68 14.79 1.43 1.83 2.46
(0.266) (0.355) (0.119) (0.134) (0.155)
Unemployed partner 3.15 7.01 7.84 2.88 2.37
(0.175) (0.255) (0.269) (0.167) (0.152)
Number of observations 1641 1929 1638 712 650
Note : ECHP 1994 - 2001. Standard error in parentheses.(a) Column percentages(b) Sample Averages. (c) Sample Averages (×100).
10

viduals’ explanatory variables values are available in this panel. We have a sampleof 1641 women for France, 1929 for Germany, 712 for UK, 1638 for Spain and650 for Denmark (see. Table 1). The average age varies between 42 and 44 years,depending on the country.
The education levels in our sample correspond to the International StandardClassification of Education (ISCED). Low education includes pre-primary, primaryand lower secondary education. Middle education represents upper secondary edu-cation. High education represents tertiary education. The distribution of diplomasanalyzed for the full sample during the period indicates a significant differencewithin countries on the one hand, and between countries on the other hand. Den-mark is the country where women are the most educated. In particular, 20.52% ofthe Danish women living in couple have a low level of education (ISCED 0 − 2),44.42% have a middle level (ISCED 3) and 34.98% have a high level (ISCED 5-7).Among the countries of our study, the lowest education levels are observed mostfrequently in Spain. We observe that 71.53% of Spanish women who live in couplehave a low education level and 14.73% a high level.
Annual spouse’s income (non-labour income) are expressed in constant 2001Euro. The average non-labour income over the sample period is the lowest in Spain(14570 euros) and the highest in Denmark (25750 Euro). Of course, Europeanwomen living in couple are often married. According to countries, the percentageof married women in our sample varies between 86.29% and 99.16%. The low-est average number of children is observed in UK (1.17) and the highest in Spain(1.85). A priori, there is no significant difference in the global fertility rate acrosscountries. However, the observed distribution of the age of children shows a dis-parity between countries. Women who live in couple in Denmark, in France and inUK have more frequently infants and young children than those living in Germanyand in Spain. But, children stay longer in household in Spain compared to othercountries. For illustration, in our sample 51.91% of Spanish women have in theirhousehold a child aged of 17 years old or more while they are 24.73% in Denmark.
3.2 Female employment rates
Figure 1 present the annual participation rates of women who live in couple in thesample. Participation is defined by the individual employment status. Nevertheless,we have shown, in an other study (Edon and Kamionka (2008), Edon (2008)), thatthe estimation outcomes when our specification is based on employment versus notemployment or activity versus inactivity are generally similar in accordance withJones and Riddell (1999).
The employment rates over the sample period are high in all countries exceptin Spain. The lowest rates are observed in Spain (between 28.82% and 35.47%)and the highest in Denmark (between 78% and 82.46%) followed by the UK (be-tween 59.13% and 65.44%), France (between 58.13% and 64.41%) and Germany(between 56.35% and 60.29%).
11
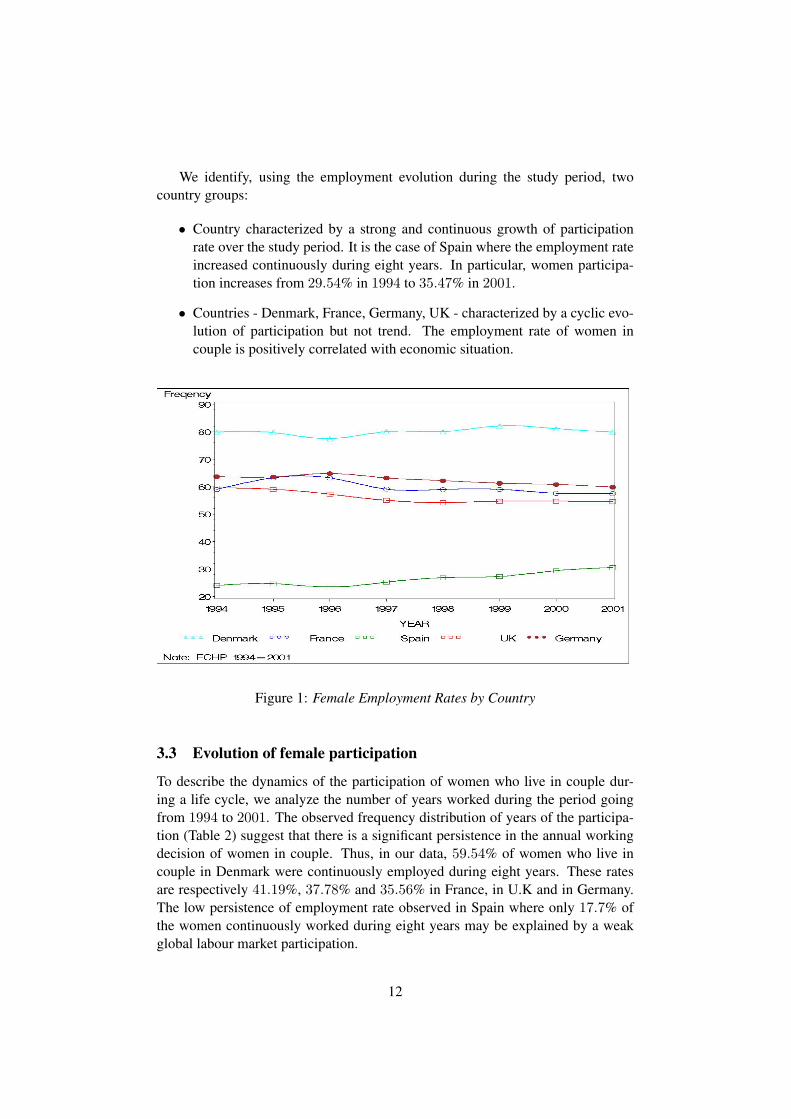
We identify, using the employment evolution during the study period, twocountry groups:
• Country characterized by a strong and continuous growth of participationrate over the study period. It is the case of Spain where the employment rateincreased continuously during eight years. In particular, women participa-tion increases from 29.54% in 1994 to 35.47% in 2001.
• Countries - Denmark, France, Germany, UK - characterized by a cyclic evo-lution of participation but not trend. The employment rate of women incouple is positively correlated with economic situation.
Figure 1: Female Employment Rates by Country
3.3 Evolution of female participation
To describe the dynamics of the participation of women who live in couple dur-ing a life cycle, we analyze the number of years worked during the period goingfrom 1994 to 2001. The observed frequency distribution of years of the participa-tion (Table 2) suggest that there is a significant persistence in the annual workingdecision of women in couple. Thus, in our data, 59.54% of women who live incouple in Denmark were continuously employed during eight years. These ratesare respectively 41.19%, 37.78% and 35.56% in France, in U.K and in Germany.The low persistence of employment rate observed in Spain where only 17.7% ofthe women continuously worked during eight years may be explained by a weakglobal labour market participation.
12

The distribution of the number of employment years is different across coun-tries. We can distinguish, in our data, two types of countries according to thefemale labour market characteristics:
• Countries with a high mobility represented by U.K and Germany where,respectively, 44.24% and 42.57 of women move, at least one time, fromnonemployment to employment or from nonemployment to employment.
• Countries with a middle mobility represented by France, Denmark and Spainwhere, respectively, 35.71, 33.84% and 33.58% of women move, at leastone time, from nonemployment to employment or from nonemployment toemployment.
Table 2: Employment Evolution
Number of employed years Total0 1 2 3 4 5 6 7 8
France 379 67 68 73 68 90 95 125 676 1641
(23.10) (4.08) (4.14) (4.45) (4.14) (5.48) (5.79) (7.62) (41.19) (100)
Germany 423 120 105 110 90 112 114 169 686 1929
(21.93) (6.22) (5.44) (5.70) (4.67) (5.81) (5.91) (8.76) (35.56) (100)
Spain 798 150 93 78 66 48 46 69 290 1638
(48.72) (9.16) (5.68) (4.76) (4.03) (2.93) (2.81) (4.21) (17.70) (100)
U.-K. 128 38 30 37 43 39 41 87 269 712
(17.98) (5.34) (4.21) (5.20) (6.04) (5.48) (5.76) (12.22) (37.78) (100)
Denmark 43 12 18 23 22 39 45 61 387 650
(6.62) (1.85) (2.77) (3.54) (3.38) (6.00) (6.92) (9.38) (59.54) (100)
Note : ECHP 1994 - 2001, Eurostat. frequency in parentheses.
3.4 Average number of children
Let us consider the observed average number of children of women aged at mostof 50 years old (see Figure 2). We can remark, according to our sample, that theaverage number of children has increased in all countries overall. Nevertheless, theaverage number of children decreased during the study period. This drop is not thesame in all countries. For instance, it is higher in Spain and Germany while it islower in France and Denmark.
The evolution of the average number of children seems to be similar in Ger-many and in Denmark. The average number of children increased between 1994and 1999, then decreased between 1999 and 2000 and, then, increased again. Nev-ertheless, the average number of children and the fertility growth are significantlyhigher in Denmark than Germany.
13

Furthermore, fertility has continuously increased in France over the sampleperiod. Finally, the highest average number of children is observed in France fol-lowed by Spain, Denmark, Germany and UK. In order to better understand thesedifferences between countries, we analyze the distribution of the average numberof children conditionally on employment.
Figure 2: Average number of children (women aged at most 50 yo.)
The relationship between the number of children and employment is shown inFigure 3. Women without employment have more children than working women inall the countries except Denmark. Fertility does not seem to penalize employmentof women in Denmark.
Except for Denmark, the average number of children drops when women areemployed. The difference between the average number of children in the householdwhen the woman is employed and when she is not is maximal for Germany andSpain (see Figure 3). This difference is minimal for Denmark. The situation inDenmark is singular since the average number of children is generally greater inthis country when women are employed.
These differences in fertility rates for employed and nonemployed women canbe due to several factors, including state-dependence in fertility, financial factorsor the difficulty to combine maternity and employment.
4 Results
We have estimated the model for each country separately. These results allow tocompare, particularly, the structure of the covariance matrix across the countries or
14

Figure 3: Average difference in the number of children between employed andnonemployed women (women aged at most 50 years old.)
the impact of the presence of a young child on the employment equation. However,the exercise is limited by the size of each subsample (see Table 1). Section 4.2presents the results of the estimation of the model on the whole sample.
4.1 Estimation results by country
The estimation results are presented in Tables (3) and (4).
4.1.1 Impact of age
The conditional probability of employment is weak for young women (aged from20 to 29 year old) comparatively to the reference group (women aged from 30 to39 year old) in all countries. The low probabilities of employment observed for thefirst age group can be the result of late arrival on the labour market of young womendue to the continuation of studies and/or a greater fertility for this age group. Forexample, in Germany women frequently decide to delay their entry in the labourmarket in order to have children (in this country women have usually less children,indeed, in 2008, the birth rate is equal to 8.18 for 1000 in Germany and to 12.73for 1000 in France2). Furthermore, women are frequently employed on the 30 to50 age group in all countries. This indicates that women who live in couple enterand stay into the labour market at ages where births are less frequent.
The conditional probability of employment is decreasing with age. Women2see http://www.statistiques-mondiales.com.
15

with age greater or equal to 50 years old are significantly less likely to be employed.The employment behavior of this group is the consequence of local practices interms of withdrawal from the labour market. In summary, we observe a quadraticeffect of age on employment behavior: the conditional employment probability isfirst increasing with age then decreasing.
4.1.2 Impact of the diploma
The effect of the diploma on the conditional probability of employment is positive.Our estimations show that employment probability increases with the degree ofdiploma, whatever the country. All things being equal, this results is consistentwith the Neoclassic labour supply theory predictions. According to this theory,there is a positive correlation between diploma and the opportunity cost associatedwith leisure. Thus, women who are more educated are also more likely to beemployed.
Compared to women who have low education, only women who have higherdiplomas are more frequently employed in the UK and in Germany. There is nosignificant difference in employment probabilities between women with elemen-tary (low) and secondary (middle) education levels in these countries. This resultsuggests that the expected wage of women who have secondary education level isnot higher than those who have elementary education in these countries.
However, the effect of diploma varies across countries. The difference in em-ployment rates across education levels is higher in Spain, country where partic-ipation of women is low. This difference is lower in the UK, a country whereparticipation of women is high and where the labour market is more flexible.
The impact of diploma on fertility is generally weak. Women who have a sec-ondary education are less likely to give birth to a child than those who have anelementary education level in all countries, particularly in Germany and in France.This result could be explained by the difficulty for women who have a middleeducation level to conciliate family life and employment. In the presence of ayoung child in the household, employment generates new participation costs suchas childcare costs. However, the expected wages of women who have middle edu-cation level are not large enough to compensate these costs. Therefore, women inthis social group postpone the birth for professional motive.
Particularly in Spain, women with a higher diploma have a greater probabilityto have a child. This result can be associated with a large impact of diploma on theconditional probability of being employed in this country. The lack of sufficientsupport for families with young children makes it difficult for mothers to conciliatea professional and a family life (see Table 6). A high level of education ensures,to some extent, higher wages allowing women to cope with high costs associatedwith the presence of young children when they are employed. Thus, it is easier formothers with higher diploma to support the participation costs due to the newborn.
16
The diploma has no significant impact on fertility for Denmark and UK. Thesample sizes are probably not large enough for these countries (respectively, 650and 712 individuals). For Germany, the estimated impact of the diploma on fer-tility is negative for women with a middle or higher diploma. Consequently, forGermany, we can consider that educated women choose more frequently to be em-ployed rather than to have children.
4.1.3 Direct and dynamic effects of fertility on employment
Our empirical specification allows to analyze both direct (short-run) and dynamic(long-run) effects of fertility on employment probabilities. The direct effect offertility on labour supply decisions can be evaluated by the impact of current birthon the employment probabilities. According to our estimations, giving birth to achild affects differently women labour force participation across countries. Indeed,the arrival of a newborn in the household reduces the employment probabilities inall countries except in Germany. But this effect is significantly different from zeroand higher in France and in Denmark, two countries where maternity and paidparental leave are longer (see Table 7).
Even if the current effect of a birth is not significant in the UK and in Spain, theeffect of the number of young children (aged 1-3) is strong in the first country andlow in the second. For the UK and Spain, these results indicate that, frequently,women do not interrupt their activity for childbearing. But mothers often stoptemporally to work during the first year after child’s birth, especially if they haveother young children. However, this effect is more important in the UK than inSpain, despite a larger childcare availability in the UK (see Tab 6). The family tieswhich provide informal childcare in Spain could explain this result.
For Germany, we observe both a strong positive effect of motherhood and ahigh negative impact of the number of young children on participation behaviour.German women frequently stay employed after childbirth but they reduce the timespent in the labour market because of low childcare availability (Voicu and Bud-delmeyer (2003)). Another possible explanation of this reliance is that women areconsidered employed during the first year of their maternity leave in Germany. Inaddition, mothers more often withdraw from the labour market during the yearsfollowing childbirth, particulary in presence of other young children in the house-hold.
It is particularly noticeable that there is no effect of the number of young chil-dren in Denmark, the country where the direct effect of fertility is the strongest . Alarge availability of childcare (see Tab 6) makes it easier to conciliate employmentwith maternity in this country. Moreover, the relative labour market flexibility re-duces the penalty for interrupting employment for childbirth. Hence, it is easierto return to the labour market in Denmark after post-birth work interruptions. Fi-nally, the effect of fertility on employment decreases with the age of children in
17

Table 3: Bivariate Dynamic Probit (employed or non employed)
France Germany Spain
Fertility Employment Fertility Employment Fertility Employment
equation equation equation equation equation equation
Fertility
Newborn - -0.9002** - 0.5685** - -0.8993
(0.3108) (0.2383) (0.5508)
Initial child -0.0813 - -0.7941 - -0.4332** -
(0.0870) (0.5062)) (0.1387)
Children of the same sex 0.4867*** - 0.2179*** - 0.3607*** -
(0.0673) (0.0842) (0.0722)
First child is a boy 0.1589*** - 0.2537*** - 0.1502** -
(0.0559) (0.0752) (0.0667)
Number of 0.0716 -0.3913*** 1.6214*** -1.1130*** 0.0812 -0.2147**children aged 1-3 years (0.0589) (0 (0.0717) (0.0597) (0.0988) (0.0648) (0.0928)
Number of -0.2008*** -0.2598*** 0.0264 -0.4320*** -0.0621 -0.1741**children aged 4-6 years (0.0581) (0.0580) (0.0785) (0.0641) (0.0620) (0.0731)
Number of -0.3920*** -0.0634 -0.2237*** -0.2412*** -0.3867*** -0.0463children aged 7-12 years (0.0444) (0.0424) (0.0640) (0.0461) (0.0418) (0.0485)
Number of -0.3846*** 0.0101 -0.1916** -0.0278 -0.3058*** 0.0619children aged 18y.o or more (0.0562) (0.0408) (0.0693) (0.0391) (0.0477) (0.0458)
Diploma
Low educ Ref Ref Ref Ref Ref Ref
Middle educ. -0.1556** 0.1135** -0.2113** 0.0497 -0.1421 0.5575***
(0.0780) (0.0550) (0.1045) (0.0713) (0.1023) (0.0820)
High educ. 0.0959 0.3763*** -0.2082 0.5332*** 0.2253** 1.0475***
(0.0829) (0.0714) (0.1334) (0.0872) (0.1002) (0.0985)
Income of partneror cohabitant
ymit -0.0186 0.0059 -0.0842 -0.0726* 0.0099 0.0073
(0.0429) (0.0303) (0.0578) (0.0383) (0.0545) (0.0385)
ypit 0.0030 -0.0191* 0.0303 -0.0994*** -0.0165 -0.1533***
(0.0321) (0.0113) (0.0353) (0.0219) (0.0514) (0.0367)
Unemployed partner 0.2266 -0.0825 0.0448 -0.1447* -0.0744 -0.0038
(0.1453) (0.1105) (0.1299) (0.0748) (0.1210) (0.0843)
(*) Significant at 10%. (**) Significant at 5%. (***) Significant at 1%.
(a): ymit is the transitory non-labour income (partner income) of woman i in year t, that is measured as
deviations from the sample average.
(b): ypit is the permanent non-labour income (partner income) of woman i in year t, that is estimated by the
sample average.
18

Table 3: Bivariate Dynamic Probit (employed or non employed)(Cont.)
France Germany Spain
Fertility Employment Fertility Employment Fertility Employment
equation equation equation equation equation equation
Age
From 20 to 29 y.o. 0.2064** -0.2240** 0.2080** -0.3046*** 0.1526 -0.2170
(0.0789) (0.0985) (0.1051) (0.0872) (0.1047) (0.1484)
From 30 to 39 y.o. Ref Ref Ref Ref Ref Ref
From 40 to 50 y.o. -0.8496*** 0.2844*** -0.3065* 0.0726 -0.5029*** 0.2931**
(0.1231) (0.0809) (0.1815) (0.0754) (0.1302) (0.0976)
50 y.o. or more - 0.1915 - -0.2521** - 0.2161
(0.1344) (0.1216) (0.1581)
Elements of biography
Married 1.5263*** 2.1566*** 0.5568* 1.3068*** 0.9977** 1.6860***
(0.2575) (0.2727) (0.3444) (0.2936) (0.3376) (0.4648)
Age*wedding -0.0461*** -0.0578*** -0.0107 -0.0407*** -0.0457*** -0.0325***
(0.0076) (0.0072) (0.0095) (0.0061) (0.0079) (0.0084)
Foreign 0.2712** -0.2509** 0.0630 -0.1908** 0.3640** -0.1881
(0.0988) (0.0974) (0.1091) (0.0924) (0.1807) (0.2303)
Other parameters
Constant -1.2345*** -1.2553*** -2.5158*** -0.3762** -0.8350*** -2.2238***
(0.1229) (0.1050) (0.2629) (0.1475) (0.2109) (0.3517)
yt−1 0.0735 1.8785*** 0.2627** 1.3358*** -0.0537 1.2224***
(0.0707 (0.0545) (0.0847) (0.0426) (0.0839) (0.0551)
dt−1 -1.0955*** - -1.8860*** - -0.6712*** -
((0.1280) (0.1720) (0.1895)
y1 - 1.3374*** - 1.4374*** - 2.0323***
(0.1000) (0.0782) (0.1161)
Variance of effects (Σξ)
σ1 - 0.6507*** - 0.9036*** - 1.0529***
(0.0558) - (0.0458) (0.0582)
σ2 0.0318 - 0.1259 - 0.0576 -
(0.1281) (0.157) (0.1317)
ρ12 -0.9312* -0.9965*** -0.0708
(0.5426) (0.0589) (0.0698)
Correlation of idiosyncratic
terms (Σε)
ρuv -0.0179 0.1642 0.1877
(0.0048) (0.1405) (0.2859)
(*) Significant at 10%. (**) Significant at 5%. (***) Significant at 1%.
19

Table 4: Bivariate Dynamic Probit (employed or non employed)
UK Denmark
Fertility Employment Fertility Employment
equation equation equation equation
Fertility
Newborn - -0.6331 - -1.1277**
(0.6125) (0.4220)
Initial child -0.3254 - -0.5865* -
(0.2330) (0.3362)
Children of the same sex 0.2203 - 0.3454** -
(0.1422) (0.1157)
First child is a boy -0.1289 - 0.1661
(0.3023) (0.1085) -
Number of 0.5748*** -0.4301** 0.7828*** -0.0673children aged 1-3 years (0.0823) (0.1313) (0.0792) (0.1230)
Number of 0.0200 -0.2704** 0.0004 -0.0530children aged 4-6 years (0.0846) (0.0925) (0.0952) (0.0957)
Number of -0.5775*** -0.0907 -0.2837*** 0.0328children aged 7-12 years (0.0910) (0.0664) (0.0718) (0.0717)
Number of -0.5433*** 0.1039 -0.3053* 0.0460children aged 18y.o or more (0.1580) (0.0692) (0.1623) (0.0816)
Diploma
Low educ Ref Ref Ref Ref
Middle educ. -0.1351 -0.0876 -0.1132 0.4020***
(0.1629) (0.1228) (0.1845) (0.0951)
High educ. -0.0212 0.2781** 0.0824 0.6790***
(0.1277) (0.0864) (0.1927) (0.1080)
Income of partneror cohabitant
ymit 0.0134 -0.0481 0.0208 0.0119
(0.0540) (0.0320) (0.0610) (0.0317)
ypit -0.0274 -0.0282 0.0413 -0.0227
(0.0535) (0.0357) (0.0799) (0.0378)
Unemployed partner 0.1427 -0.2868 -0.0497 -0.0971
(0.3457) (0.2274) (0.4469) (0.2142)
(*) Significant at 10%. (**) Significant at 5%. (***) Significant at 1%.
(a): ymit is the transitory non-labour income (partner income) of woman i in year t, that is measured as
deviations from the sample average.
(b): ypit is the permanent non-labour income (partner income) of woman i in year t, that is estimated by the
sample average.
20

Table 4: Bivariate Dynamic Probit (employed versus non employed)(Cont.)
UK Denmark
Fertility Employment Fertility Employment
equation equation equation equation
Elements of biography
Age
From 20 to 29 y.o. -0.0498 -0.2516 0.2360 -0.2346
(0.1501) (0.1796) (0.1583) (0.1583)
From 30 to 39 y.o. Ref Ref Ref Ref
From 40 to 50 y.o. -0.6366** 0.3312** -1.0254*** 0.1000
(0.2245) (0.1332) (0.2474) (0.1365)
50 y.o. or more - 0.2317 - -0.0240
(0.2009) (0.1999)
Elements of biography
Married 1.4986** 2.0102*** 1.4574** 1.6841***
(0.4872) (0.4632) (0.7115) (0.3733)
Age*wedding -0.0349** -0.0503*** -0.0448** -0.0401***
(0.0137) (0.0104) (0.0216) (0.0091)
Foreign -0.7295 -0.2335 0.3054 -0.0109
(0.5737) (0.3819) (0.4599) (0.2201)
Other parameters
Constant -1.5066*** -1.0839** -1.5770*** -0.9932***
(0.2177) (0.2270) (0.3104) (0.1735)
yt−1 0.0093 1.5836*** 0.1039 1.6451***
(0.1315) (0.0743) (0.1456) (0.0939)
dt−1 -1.0014*** - -1.5827*** -
(0.2140) (0.2711)
y1 - 1.1999*** - 0.9686***
(0.1305) (0.1303)
Variance of effects (Σξ)
σ1 - 0.8014*** - 0.4805***
(0.0761) (0.0858)
σ2 0.15036 - 0.0344 -
(0.2194) (0.2838)
ρ12 -0.9894*** -0.6600
(0.11730) (1.9159)
Correlation of idiosyncratic
terms (Σε)
ρuv -0.0778 0.2494
(0.3297) (0.2950)
(*) Significant at 10%. (**) Significant at 5%. (***) Significant at 1%.
21
all countries. Beyond 12 years, the child ceases to be a barrier to activity in allcountries.
The dynamic effect of fertility on labour supply cannot be analyzed withoutconsidering the employment persistence which might be a consequence of eithertrue or spurious state-dependence (Heckman and Willis (1977), Nakamura andNakamura (1985), Eckstein and Wolpin (1989)). Thus, persistence of employ-ment could be the result of the institutional environment, such as labour marketrigidities which are potential sources of true state-dependence. Search frictions orhuman capital depreciation, which could be regarded as indicators of labour mar-ket rigidities, may lead women to stay employed after childbearing and induce apersistence of work. Indeed, a long career interruption in order to give birth to achild might depreciate the human capital and make the return to employment moredifficult, particularly in countries where labour market is less flexible. In thesecountries, a high state-dependence of labour supply behavior might be associatedto a strong effect of fertility on employment probabilities. Similarly, the observedemployment persistence can also reflect the difficulties to find a job due to searchfrictions and not the lasting effect of child’s birth. In this case, we may observea high persistence in employment even if the current birth effect is low. Finally,the unobserved heterogeneity may also create persistence in employment becausewomen who have a strong preference for maternity may also be those who haveweaker preferences for employment. It is therefore important to disentangle thetwo potential sources of persistence if we want to understand the role of fertilityand its sensitivity to social and economic policies across countries.
As usual with this type of data, we observe a strong persistence of employment(see, for instance, Edon and Kamionka (2008)). This result is similar to the oneobtained for participation by Hyslop (1999). We found that the state-dependenceis highest in France followed by Denmark, the UK and Germany. The lowest state-dependence is observed in Spain. These estimations show that the countries wherewe observe the largest effects of birth or of young children are also those where wehave the highest employment persistence.
Refereing to the institutional differences that we discussed in Section 3, we candistinguish five typoligies of countries :
• Countries that belong to the "nordic regime", such as Denmark, where wefind a higher but not persistent effect of fertility on employment. In Den-mark, women stop their activity for childbearing more frequently. But theyreturn to the labour market before the first year of the child, even if there areother young children in the household. Large childcare availability makesit easier to conciliate family life and employment. In addition, the relativelabour market flexibility reduces the penalty for exiting the labour market forchildbirth. This explains why the state-dependence is lower in Denmark thanin France. Large childcare availability associated to relative labour market
22
flexibility may explain why the fertility effect does not persist over time.
• Anglo-Saxon countries are represented by UK and characterized by means-tested benefits and limited childcare provision and by a flexibile labour mar-ket. Indeed, we observe one of the largest effect of young children on em-ployment probabilities. Frequently, women do not stop working if they givebirth because the maternity leave is unpaid in the UK. However, mothersfrequently leave the labour market during the next year following childbirth,in particular if they have other young children. After the age of 6 years, thenumber of children ceases to penalize employment. These results suggestthat the flexibility of the labour market reduces the long-run effect of fertil-ity.
• Countries belonging to the "conservative regime", such as Germany, wherewe observed the highest effect of the number of young children on employ-ment probabilities. This effect persists over time. In Germany, children re-duce the employment probabilities until they are less than 13 years old. Thelow childcare availability associated to labour market rigidities can explainthe observed high true state-dependence.
• The French regime, which can be placed between the nordic and the con-servative regimes, where we find both a large direct birth effect and strongpersistence over time. The strong true state-dependence observed in Francemay be, in large part, explained by labour market rigidities that make thereturn to employment more difficult if women stop their activity for child-bearing.
• For mediterranean countries such as Spain, the observed birth effect is thelowest among all these countries and not persistent over time (lowest truestate-dependance). The family ties help women conciliate employment andfamily life. However, this help is not sufficient to compensate the character-istics of public policy and, particularly, an insufficient childcare provision.Consequently, we observe a relatively low participation to the labour marketand relatively weak fertility of women in this country.
For all countries, we find a positive effect of the number of young childrenon the probabilities to give birth. This effect is significant for Germany, Denmarkand U.K. The highest is found in Germany followed by Denmark and U.K. Theseresults show that women frequently seem to use their maternity leave in order tocomplete their family. In all countries, the number of children aged more than 3years old reduces the probabilities to give birth to a child.
23

4.1.4 Impact of non-labour income
The transitory part of non-labour income (ymit) has no impact on employmentprobabilities (except for Germany). The impact of the permanent part of non-labour income on employment probabilities is negative in all countries except forDenmark and U.K. This result is consistent with the empirical implications of theclassical labour supply model (Becker (1965), Becker (1981)). For Denmark andU.K, the effect is negative but not significant possibly due to the size of the sample.This impact is weak for France, greater for Germany and large for Spain. Con-sequently, the impact of the permanent part of non-labour income is particularlyimportant for countries where it is difficult to conciliate family life with youngchildren and employment like Spain or Germany. There is no impact of partnerincome on the conditional probability to have a child.
The existence of an unemployed partner has a negative impact on the employ-ment probability but is significant only for Germany. This can be the consequenceof social and tax legislation when they condition the reception of public benefitson household’s income (Laroque and Salanié (2004)). However, generally, there isno significant impact of the presence of an unemployed partner on fertility.
4.1.5 Fertility persistence
Recall that the model also incorporates state-dependance in the fertility equationin order to analyze the dynamic of births. We find a negative and strong statedependance on fertility behaviour. The higher coefficient is found in Germanyfollowed by France, Denmark and UK. The lowest state-dependence is observedfor Spain. The gap between two births is minimal for Spain, country where thenegative effect of a young child on employment probabilities is the smallest. Inabsence of large childcare availability or labour market flexibility, women postponechild’s births except if they can rely on family ties in order to provide childcare.
In order to evaluate the impact of employment on fertility decisions, we haveincluded the past employment state in the fertility equation. We assume that a cur-rent birth may be the result of past participation decision. Except for Germany, thepast employment state doest not affect the current fertility decision. For Germany,past employment has a positive impact of fertility. The fact that women are con-sidered as employed during the first year of their maternity leave in Germany mayexplain this result. This reflects too the insufficiency of childcare provision thatcould permit to the women to conciliate family and professional life. For instance,in 2000, childcare outside households for children less than 3 y.o. hosted 64% ofthe children in Denmark, 7% of young children in Germany and only 5% of thesechildren in Spain (see table 6).
24

4.1.6 Initial conditions
The effect of the initial conditions for employment (y1) is positive and significantfor all countries. The effect comes from the treatment of the initial conditions us-ing the method proposed by Wooldridge (2005). This parameter gives the impactof initial employment on the conditional mean of the random effect specific to theemployment equation. The effect of the initial conditions on employment probabil-ities is highest for Spain followed by UK, Germany and France. The lowest effectis observed for Denmark. Hence, the largest effect is found in countries where it isdifficult to conciliate family life with young children with employment (Spain, UKand Germany). Consequently, women who are employed in the first period (1994)have stronger preferences for employment.
The parameters associated to the initial conditions for fertility - initial child -is always negative but is significant only for Denmark and U.K. Indeed, for thesecountries, women who have a young child in 1994 have a weak probability togive birth to a child for all the other years of observation. This phenomenon canreveal a preference of women for employment. Consequently, initial conditions areinformative of the distribution of unobserved heterogeneity terms. This result canbe also the consequence of the timing of births and the average number of childrenper women.
4.1.7 Other variables
In our sample, married women are more often employed than women who livein couple without being married. Similarly, married women give more birth to achild than cohabitating women. The effect of marriage on probabilities to givebirth to a child is higher in France, followed by Denmark and U.K. The lowestimpact of marriage is observed in Spain and in Germany. Thus, the countries withthe strongest effect of marriage on fertility are also the countries where marriedwomen are more often employed. These countries are where it is easier to con-ciliate employment with maternity due to generous welfare policies (France andDenmark) or flexibility of labour market (UK).
Foreign women are less often employed in France and in Germany comparedto national women. The impact of nationality is not significant in the other coun-tries. We also find that foreign women give birth more often in France and Spaincompared to national women.
We use for our estimations two instruments for the fertility. The first instrumentis an indicator of whether the first two children have the same gender. The otherinstrument is an indicator of whether the eldest children is a boy. For all countries,the probability to give birth to a child in the future increases if the eldest child isa boy or if the first two children have the same gender. This result indicates thatwomen and couples want more frequently to have at least two children with distinctgenders.
25

4.1.8 Variance-covariance matrix
The correlation between the idiosyncratic terms of the two equations, i.e. employ-ment and fertility, is not significant whatever the country. This means that a shockon the participation decision has no impact on fertility for the same period and ashock to fertility decision has no significant impact on employment probabilities.
However, the employment and fertility equations are correlated through theindividual effects specific to the employment decision (namely ξi1) and through therandom term specific to the fertility decision (namely ξi2). Indeed, the estimatedcorrelation (ρ12) between the two random effects is negative for all the countriesbut significantly different from zero only for Germany, France and UK. This resultsuggests that in these countries, women who have a strong preference for maternitytend to have a weaker preference for consumption and employment.
The variance of unobserved heterogeneity in the employment equation (σ21) is
always significantly different from zero. This variance is higher in Spain followedby Germany, UK and France. The smallest value is observed in Denmark. It isnoticeable that the countries with higher unobserved heterogeneity (spurious state-dependence) are also the countries where we observe the lower employment persis-tence. These results show that the difference in employment rates across countriesis mainly due to true state-dependence rather than the spurious state-dependence.For instance, Danish and French mothers do not participate more in the labour mar-ket than German or Spanish mothers because they have undisclosed preferences foremployment but because there are, in France and in Denmark, some institutionalfactors that make it easier to conciliate employment and maternity. Thus, the differ-ence in estimated values of state dependence in female labour supply may, in largepart, be the result of differences in institutional environments, like labour marketflexibility and childcare.
The variance of the random term specific to the employment equation is largerthan the variance of the unobserved heterogeneity specific to the fertility decisionindicating that a large part of the heterogeneity in the decision to have a child hasbeen integrated via observable variables (like age, diploma and previous realiza-tions of fertility).
4.2 Estimation on the whole sample
In order to increase the size of the sample, we have estimated the model using asingle specification for all countries. The heterogeneity across countries is takeninto account adding dummy variables, one for each country. As a constant is in-cluded in each equation, the dummy variable for Germany is dropped from thespecification. The estimation results are presented in Table 5.
26
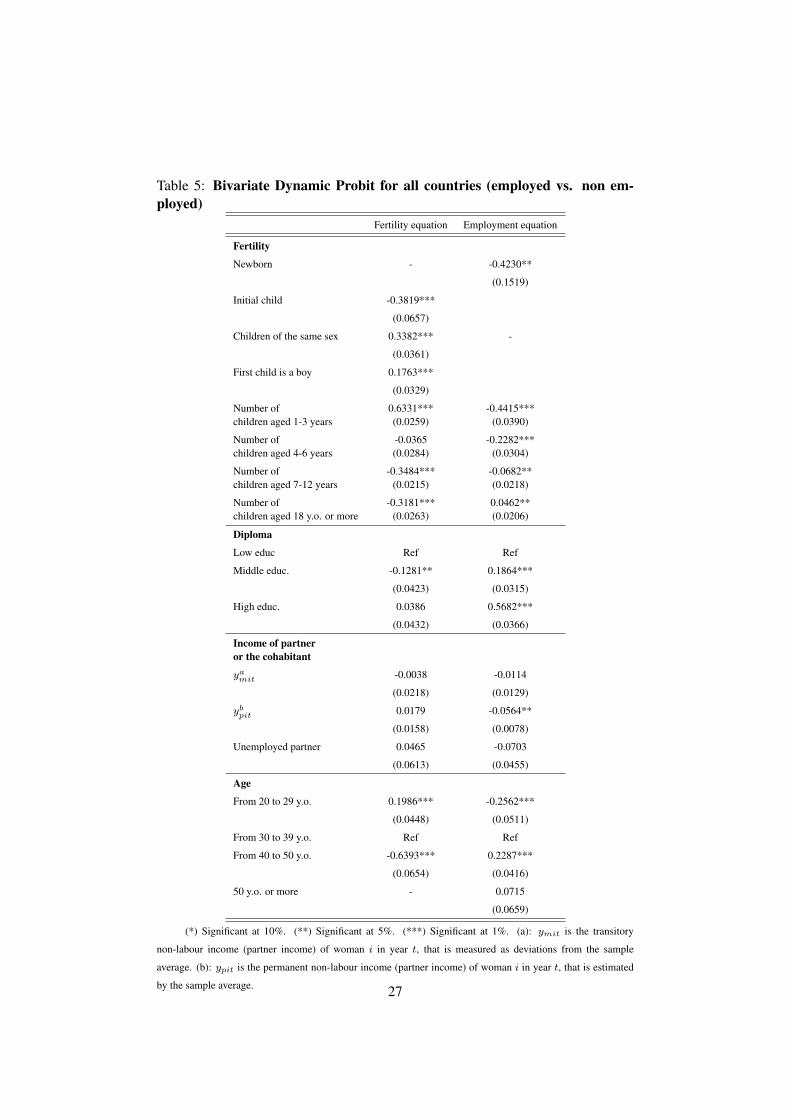
Table 5: Bivariate Dynamic Probit for all countries (employed vs. non em-ployed)
Fertility equation Employment equation
Fertility
Newborn - -0.4230**
(0.1519)
Initial child -0.3819***
(0.0657)
Children of the same sex 0.3382*** -
(0.0361)
First child is a boy 0.1763***
(0.0329)
Number of 0.6331*** -0.4415***children aged 1-3 years (0.0259) (0.0390)
Number of -0.0365 -0.2282***children aged 4-6 years (0.0284) (0.0304)
Number of -0.3484*** -0.0682**children aged 7-12 years (0.0215) (0.0218)
Number of -0.3181*** 0.0462**children aged 18 y.o. or more (0.0263) (0.0206)
Diploma
Low educ Ref Ref
Middle educ. -0.1281** 0.1864***
(0.0423) (0.0315)
High educ. 0.0386 0.5682***
(0.0432) (0.0366)
Income of partneror the cohabitant
yamit -0.0038 -0.0114
(0.0218) (0.0129)
ybpit 0.0179 -0.0564**
(0.0158) (0.0078)
Unemployed partner 0.0465 -0.0703
(0.0613) (0.0455)
Age
From 20 to 29 y.o. 0.1986*** -0.2562***
(0.0448) (0.0511)
From 30 to 39 y.o. Ref Ref
From 40 to 50 y.o. -0.6393*** 0.2287***
(0.0654) (0.0416)
50 y.o. or more - 0.0715
(0.0659)
(*) Significant at 10%. (**) Significant at 5%. (***) Significant at 1%. (a): ymit is the transitory
non-labour income (partner income) of woman i in year t, that is measured as deviations from the sample
average. (b): ypit is the permanent non-labour income (partner income) of woman i in year t, that is estimated
by the sample average. 27

Table 5: Bivariate Dynamic Probit for all countries (employed or non em-ployed)(Cont.)
Fertility equation Employment equation
Country
France 0.1286** 0.0819**
(0.0490) (0.0393)
Germany Ref Ref
Spain 0.0541 -0.2569***
(0.0541) (0.0411)
UK 0.2133*** 0.0763
(0.0604) (0.0485)
Denmark 0.2200*** 0.5387***
(0.0615) (0.0551)
Elements of biography
Married 1.1169*** 1.6053***
(0.1318) (0.1380)
Age*wedding -0.0324*** -0.0428***
(0.0038) (0.0033)
Foreign 0.1638** -0.1582**
(0.0542) (0.0557)
Other parameters
Constant -1.6921*** -1.2106***
(0.0878) (0.0693)
yt−1 0.0754** 1.4930***
(0.0372) (0.0247)
dt−1 -1.2700*** -
(0.0672)
y1 - 1.4887***
(0.0459)
Variance of effects (Σξ)
σ1 - 0.8301***
(0.0255)
σ2 0.0628 -
(0.0609)
ρ12 -0.9457***
(0.1294)
Correlation of idiosyncratic
terms (Σε)
ρuv -0.0045
(0.0831)
(*) Significant at 10%. (**) Significant at 5%. (***) Significant at 1%.
28
4.2.1 Impact of age
The effect of age on the conditional employment probability is negative for the firstage group in (20-29 years old) and positive for the second age group (40-50 yearsold) compared to the reference group (30-39 years old). Based on the argumentsdeveloped in section 4.1, participation to the labour market is weak for ages wherefertility is high and large for low fertility ages. Indeed, the impact of age on theconditional fertility probability is decreasing. Births occur more frequently for the20 to 29 years old group and are, of course, much less frequent after 40 years old.
4.2.2 Impact of diploma
The impact of diploma on the conditional employment probability is positive. Theeffect increases with the level of the diploma. This result is consistent with theempirical implications of the labour supply theory. The impact of the diploma onfertility is only significant and negative for the secondary education level. Womenwho have secondary education level give less birth to a child but participate morefrequently to the labour market than women who have an elementary school degree.These results confirm that employment penalizes fertility, especially for womenwho have secondary education diploma. The policies designed to help mothersconciliate family and professional life must target this category of women.
4.2.3 Direct and dynamic effects of fertility on employment
Overall, giving birth reduces female labour supply. The presence of a young childhas a strong and negative impact on employment. This result is consistent withthe empirical implications of labour supply theory because the presence of youngchildren is associated with large care costs. However, the direct effect of fertilityon employment probabilities decreases with children’s age. The presence of a childolder than 18 years no longer penalizes employment.
The initial number of children has a negative and significant impact on theconditional fertility probability. On average, women who gave birth to a child in1994, are less likely to give birth in the following years. However, this effect isweak. In accordance with previous estimations, having one or more children aged1 to 3 years old increases the probability of giving birth to a newborn. This resultindicates that, frequently, women do not like to space births. On the contrary, thenumber of children aged 3 years old or more reduces the probability of giving birthin the future. The conditional probability to have an additional child is decreasingwith the number of children older than 3 present in the household.
When the household has only children of the same sex, the conditional prob-ability to have an additional child is significantly higher. Frequently, householdsprefer to have at least one child of each gender. Similarly, if women give birth to aboy in first, they are more likely to have a newborn in the future.
29
4.2.4 Impact of non-labour income
The permanent component of non-labour income (ypit) has a negative impact onthe conditional employment probability. This is consistent with the empirical im-plications of labour supply theory. The transitory component of the non-labourincome has no effect on the conditional employment probability (ymit).
There is no impact of the non-labour income on fertility probabilities. Con-sequently, even when women anticipate some modifications in the non-labour in-come, they do not change their fertility behaviour.
4.2.5 Fertility persistence
We find a negative state dependance of fertility behavior. This non-persistence offertility indicates that births are spaced frequently more than one year. In addition,we observe a positive impact of previous employment on fertility probabilities.Being employed does not penalize the probabilities to give birth.
However, the positive effect of past employment on fertility behaviour is weak.In some countries, public policies and labour market flexibility make possible morefrequently the combination of employment and maternity (Denmark for instance).
4.2.6 Initial conditions
The initial condition for employment (y1) has a large and positive impact on theconditional employment probability. Women who are employed in 1994 have thenhigher probabilities to be employed in the following years. Thus, the initial em-ployment situation is informative about the distribution of the individual effectspecific to the employment equation.
The impact of the initial condition for fertility is negative and significant. Wo-men who have a young child in 1994 have then lower probabilities to have anadditional child. Consequently, the initial fertility is also informative about thedistribution of the random effect specific to the fertility equation.
4.2.7 Other variables
The employment probability is largest for Denmark and smallest for Spain (seeFigure 1). The differences of employment behaviour are very important amongthese European countries. Fertility is maximum for Denmark and France and min-imum for Germany. The estimated impacts are partly different of what we observein the graphics that depict the marginal distribution of the average number of chil-dren by country (see Figure 2). This result is at first sight surprising for Denmark.Let us notice that the estimations are made conditionally on unobserved hetero-geneity. Moreover, for Denmark, the fertility is relatively constant with respect tothe situation on the labour market (see Figure 3). This implies that, when indi-viduals are initially employed, the unobserved component for fertility is frequently
30

negative and large (see ρ12, Table 5), which explains why the effect of the dummyvariable Denmark in the specification is positive and large.
Marriage has a positive impact on fertility and employment. But the effectof age on employment probability is negative for married women indicating thatmarried women have children earlier.
4.2.8 Variance-covariance matrices
The correlation between the idiosyncratic terms is not significantly different fromzero. This means that a positive or negative shock on preferences for fertility doesnot affect preferences for consumption and, finally, for employment.
The correlation between random effects is negative and large. This means thatindividuals who prefer, a priori, to have more children have frequently lower pref-erences for consumption and employment. We find a positive variance of unob-served heterogeneity for employment. There is more heterogeneity in participationdecisions than in fertility behaviour.
5 Conclusion
In this paper we jointly model employment and fertility decisions. We use a dy-namic model and take into account the presence of unobserved heterogeneity spe-cific to the individual and to the category of decision. The model allows distin-guishing between state and spurious dependence. As the observation starts afterthe starting time of the process, we also model initial conditions. We find thatthese initial conditions are very informative of the distribution of the random effectin the sample.
The estimation results show that the main empirical implications of classiclabour supply model are verified : diploma has a positive impact on employmentand the permanent component of the non-labour income has a negative impacton employment. We observe two effects of fertility on female labour supply: adirect effect which is higher in countries where mean duration of maternity leaveis larger - for Denmark and France - and a dynamic effect for which the degree ofintensity depends on the institutional environment, such as childcare availabilities- for Denmark and France - and labour markets flexibilities - for example Denmarkand UK , or cultural parameters such as family ties - for Spain.
Our results suggest that in the absence of flexible labour markets, women exitemployment less frequently once they have given birth (higher true state depen-dance), especially if there is large childcare availability. Mothers employment isthus based on the provision of childcare. The total fertility rate might be lowerespecially when the delivery of childcare is not important enough or not adapted toworking hours - for Germany. Generous family policies based on long maternityleaves and high child benefits increase the direct effect of fertility on participation
31
which reduces highly employment probabilities. This effect might persist over timeif the provision of childcare is not accompanied by a flexibility of labour marketwhich facilitate movements in and out of unemployment.
We find a large heterogeneity of the both decisions across European countries:employment of women is maximal in Denmark and minimal in Spain whereas fer-tility is maximal in France and minimal in Germany. Germany and Spain are twocountries where, in practice, it is more difficult for women to conciliate family lifewith an active participation in the labour market. These two countries have, how-ever, two different profiles : employment rates of women in Germany are similarto that of other European countries like France but fertility is lower in Germany;employment rates of women is minimal in Spain but fertility is similar to that ofFrance. The situation of Denmark is very particular : in this country the labourmarket is very flexible and childcare spending is large. This explains why women’semployment and fertility are important.
32

References
Angrist, J. D. (2001) ‘Estimation of limited dependent variable models withdummy endogenous regressors : Simple strategies for empirical practice.’Journal of Business and Economics Statistics 19, 2–16
Angrist, J. D., and W. N. Evans (1998) ‘Children and their parents labor supply: Evidence from exogenous variation in family size.’ American EconomicReview 88, 450–477
Becker, G. (1965) ‘A theory of the allocation of time.’ The Economic Journal75(299), 493–517
Becker, G (1981) A treatise on the family, (Mass : Harvard University Press)
Bronars, S. G., and J. Grogger (1994) ‘The economic consequences of unwedmotherhood : Using twin births as a natural experiment.’ The American Eco-nomic Review 80, 1141–1156
Carrasco, R. (2001) ‘Binary choice with binary endogenous regressors in paneldata : Estimating the effect of fertility on female labor participation.’ Journalof Business and Economic Statistics 19(4), 385–394
De Henau, J., D. Meulders, and S. O’ Dorchai (2006) ‘The childcare triad? indica-tors assessing three elds of child policies towards working mothers in the eu-15.’ Journal of Comparative Policy Analysis 8, 129–148
Del Boca, D., and R. Sauer (2008) ‘Life cycle employment and fertility acrossinstitutional environments.’ European Economic Review
Drew, E. (2004) ‘Le congé parental dans les etats membres du conseil de l’europe,.’CDEG (2004) 14 Final, http ://www.coe.int/equality/fr. Direction Généraledes Droits de l’Homme. Strasbourg, 2005
Eckstein, Z., and K. I. Wolpin (1989) ‘The specification and estimation of dynamicstochastic discrete choice models : A survey.’ Journal of Human Resources24(4), 562–598
Edon, C. (2008) ‘Participation des femmes en couple au marché du travail: unecomparaison européenne.’ PhD Dissertation, University Paris II, Panthéon -Assas.
Edon, C., and T. Kamionka (2008) ‘Modélisation dynamique de la participation aumarché du travail des femmes en couple.’ Annales d’Economie et Statistique
Esping, A. G. (1990) ‘The three worlds of welfare capitalism.’ Cambridge, PolicyPress
33

Fougère, D., and T. Kamionka (2008) ‘Econometrics of individual labor markettransitions.’ in L’aszl’o M’aty’as and Patrick Sevestre eds., The econometricsof panel data, Fundamentals and recent developments in theory and practice,pp. 865–905, Princeton University Press, Princeton, NJ, 1980.
Garibaldi, P., and E Wasmer (2004) ‘Raising female employment: Reflexions andpolicy tools.’ Journal of the European Economic Association 2, 320–330
Gouriéroux, C., and A. Monfort (1997) ‘Simulation-based econometric methods.’Core Lecture Series
Heckman, J. (1980) Sample Selection Bias as a Specification Error: An Applicationto Estimation of Female Labor Supply Functions (James Smith). PrincetonUniversity Press, Princeton, NJ
(1981) ‘Heterogeneity and state dependence.’ in Structural Analysis of Dis-crete Data ( Rosen, S., Ed.) pp. 91–139. Umversity of Chicago Press,Chicago, IL
Heckman, J., and R. Willis (1977) ‘A beta-logisticmodel for the analysis of se-quential labor force participation by marriedwomen.’ The Journal of PoliticalEconomy 85, 27–58
Hotz, V., and R. Miller (1988) ‘An empirical analysis of life cycle fertility andfemale labor supply.’ Econometrica 56(1), 91–118
Hotz, V. J., E. Kydland, and G. Sedlacek (1988) ‘Intertemporal preferences andlabor supply.’ Econometrica 56, 335–360
Hyslop, D. R. (1999) ‘State dependence, serial correlation and heterogeneity inintertemporal labor force participation of married women.’ Econometrica67(6), 1255–1294
Jacobsen, J. P., J. Pearce, and J. L. Rosenbloom (1999) ‘The effects of childbearingon married women’s labor supply and earnings using twin births as a naturalexperiment.’ The Journal of Human Resources 34, 449–474
Jakubson, G. (1991) ‘Estimation and testing of the union wage effect using paneldata.’ Review of Economic Studies 58(5), 971–991
Jones, S. R. G., and C. W. Riddell (1999) ‘The measurement of unemployment :An empirical approach.’ Econometrica 67, 147–161
Kamionka, T. (1998) ‘Simulated maximum likelihood estimation in transitionmodels.’ Econometrics Journal, 1, C129–153.
Keane, M.P, and R. Sauer (2006) ‘Classification error in dynamic discrete choicemodels: Implications for female labor supply behavior.’ IZA : DiscussionPaper
34

Laroque, G., and B. Salanié (2004) ‘Fertility and financial incentives in france.’CESIfo Economic Studies
Mincer, J. (1962) ‘Labor force participation of married women : a study of lasupply.’ in Aspect of Labor Economics, Princetone University Press pp. 63–97. National Bureau of Economics Research, Princetone
(1963) ‘Market prices, opportunity costs and income effects.’ in Measure-mentin Economics, Stanford University Press pp. 67–82. C.F. Christ et al(eds), Stanford
Moffitt, R. (1984) ‘Life cycles profile of labour supply and fertily.’ Review of Eco-nomic Studies 51(2), 263–578
Mroz, T. (1987) ‘The sensitivity of an empirical model of married women’s hoursof work to economic and statistical assumptions.’ Econometrica 55(4), 765–799
Nakamura, A., and M. Nakamura (1985) ‘Dynamic models of the labor force be-havior of married women which can be estimated using limited amounts ofpast information.’ Journal of Econometrics 27, 273–298
Périvier, H. (2004) ‘Emploi des mères et garde des jeunes enfants en europe.’ Revuede l’OFCE, pp. 225–258.
Rosenzweig, M., and K. Wolpin (1980) ‘Life-cycle labor supply and fertility :Casual inferences from household models.’ Journal of Political Economy88(2), 328–348
Voicu, A., and H. Buddelmeyer (2003) ‘Children and women’s participation dy-namics: Direct and indirect effects.’ IZA : Discussion Paper
Wooldridge, J. (2005) ‘Simple solutions to the initial conditions problem in dy-namic, nonlinear panel data models with unobserved heterogeneity.’ Journalof Applied Econometrics 20(1), 39–54
35
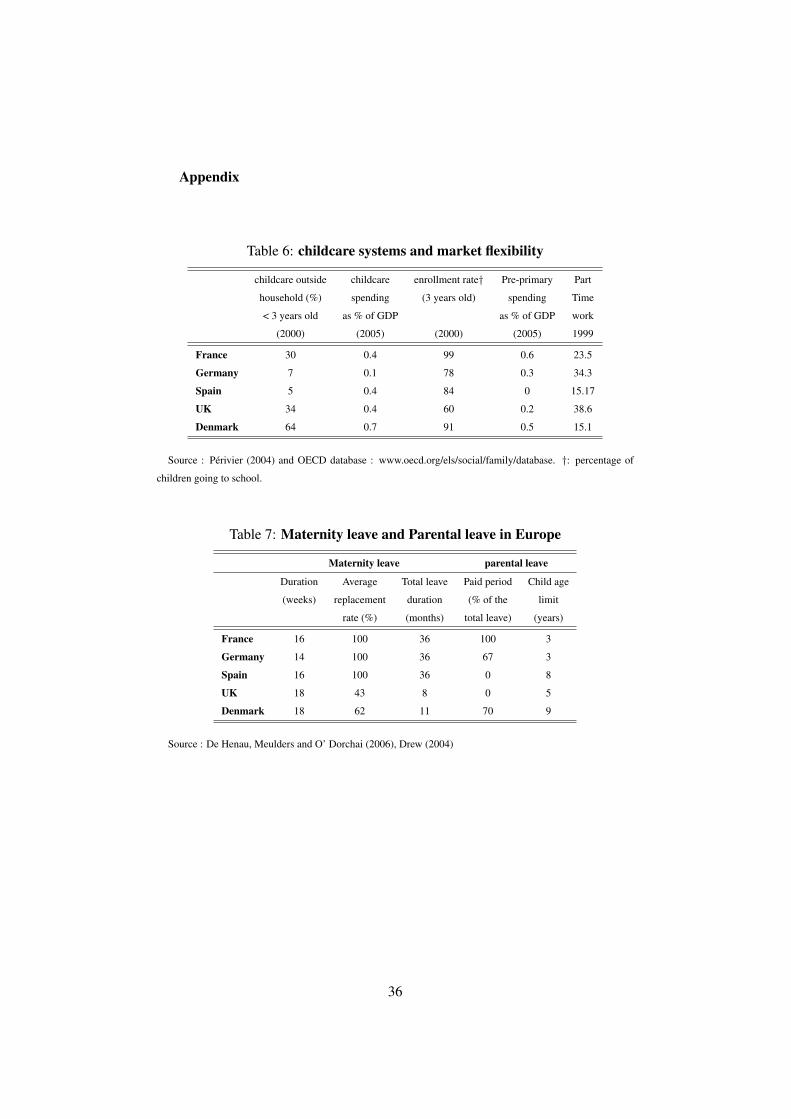
Appendix
Table 6: childcare systems and market flexibility
childcare outside childcare enrollment rate† Pre-primary Part
household (%) spending (3 years old) spending Time
< 3 years old as % of GDP as % of GDP work
(2000) (2005) (2000) (2005) 1999
France 30 0.4 99 0.6 23.5
Germany 7 0.1 78 0.3 34.3
Spain 5 0.4 84 0 15.17
UK 34 0.4 60 0.2 38.6
Denmark 64 0.7 91 0.5 15.1
Source : Périvier (2004) and OECD database : www.oecd.org/els/social/family/database. †: percentage of
children going to school.
Table 7: Maternity leave and Parental leave in Europe
Maternity leave parental leave
Duration Average Total leave Paid period Child age
(weeks) replacement duration (% of the limit
rate (%) (months) total leave) (years)
France 16 100 36 100 3
Germany 14 100 36 67 3
Spain 16 100 36 0 8
UK 18 43 8 0 5
Denmark 18 62 11 70 9
Source : De Henau, Meulders and O’ Dorchai (2006), Drew (2004)
36

ISSN 1379-244X D/2010/3082/017


