DYNAMICS BETWEEN BANK-LED FINANCIAL INCLUSION AND ECONOMIC GROWTH IN EMERGING ECONOMIES: THE CASE OF INDIA
KAJOLE NANDA*Punjab School of Economics, Guru Nanak Dev University,
Amritsar, Punjab, India
The purpose of this article is to examine the nexus between financial inclusion and economic growth in the emerging Indian economy, both, theoretically and empirically using and ARDL methodological approach. The theses of the paper state that financial inclusion strives to include the previously excluded in the ambit of formal financial services and the economic system. This, in turn promotes capability enhancement, human development, economic productivity and thus, inclusive growth. The empirical results point out that in the context of India, there is a bi-directional and positive relationship between financial inclusion and economic growth, in the long as well as short run. Economic growth helps to foster financial inclusion by overcoming the demand and supply bottlenecks of the formal financial system. On the other side, financial inclusion aids to actualize the objective of inclusive economic growth; which helps in the reduction of the deep-rooted problems of income inequality and poverty.
Keywords: Financial development, financial inclusion, economic growth, social inclusion.
JEL Classification: G21, G28, O15.
A large quantum of academic literature on the nexus between finance and growth has adequately discussed the causality and relationship between financial development and economic growth. As a corollary, there has emerged an endless and ever controversial debate on the Schumpeterian (1911) vis-à-vis the Robinson’s (1952) growth hypotheses. While the existing literature has succeeded to investigate this relationship using depth/development of the formal financial system as a proxy; the importance of considering distribution of access to formal financial services (financial inclusion) has gained importance only in the recent period (Beck et al 2007; Pal and Pal, 2013). The vitality of equality of financial
International Journal of Development and Conflict9(2019) 95–121
access in fostering ‘inclusive growth’ has become a matter of considerable importance world over. Financial inclusion has, thus, become a policy agenda and policy priority in almost all countries, with particular reference to the developing ones (Sarma, 2008).The issue of financial inclusion is of critical importance to India (a developing economy), because it is the second most populous country in the world, and only 35 per cent of its population is is within the confines of formal financial service providers. According to the latest estimates (as on January 16, 2017) provided by the International Monetary Fund, Indian economy is the second fastest growing economy in the world. Given this pace, a lot of economic opportunities are being created. Financial inclusion is such a strategy, by means of which the previously deprived can get assimilated in the formal financial and economic system/s, and become capable of reaping the benefits of economic growth. Financial inclusion of them shall also have implications for enhancement of capabilities, and therefore productivity, thereby leading to an all inclusive growth of the country. Given this backdrop, the need, therefore, for exploring the link between financial inclusion and economic growth/development becomes both, unavoidable and extremely topical.
Economic growth, in the simplest sense, refers to an increase in the Gross Domestic Product (GDP) of the country. While economic growth creates opportunities; financial inclusion makes these opportunities available to the economically deprived. This, in turn, incorporates them into the economic and financial system, thereby furthering all-inclusive growth in the economy (United Nations, 2006; Kuri and Laha, 2011; Kodan and Chhikara, 2011). The interactions between financial inclusion and economic growth, apparently, are very dynamic.
In the backdrop of such interactions between financial inclusion and growth, and a dearth of existing literature in this regard; an attempt has been made through this article to probe into such link. For this, an ARDL and Bounds Testing approach has been employed. Furthermore, both, long and short-run interplays between the two have been examined. The current article has been divided into six sections. Section I presents the theoretical underpinnings on the relationship between financial development and economic growth, and also on the nexus between financial inclusion, and economic growth. Section II discusses the relevance of financial inclusion in India. Section III presents the relevant literature for the measurement of financial inclusion and its relationship with economic growth. Section IV discusses the research design and methodology used for the current article. Section V presents the empirical findings of the nexus between financial inclusion and economic growth in India, and Section VI concludes the article.
1. Theoretical Underpinnings on the Nexus between Financial Development, Inclu-sion and Economic growth
1.1. Interplay Between Financial Development and Economic Growth
The relationship between finance and growth has been a centennial subject of research. However, based on the premise of ‘efficiency of markets’ the classical growth theory failed to recognize the vitality of finance for growth (and vice-versa). Put differently, a Gerard
Dynamics Between Bank-Led Financial Inclusion and Economic Growth in Emerging Economies 97
Debreu (1959) - Kenneth Arrow (1964), state-contingent claim framework, assumes that the presence of financial systems simply results in the expenditure of huge resources. This is because; financial systems cause wastage of time and funds in facilitating transactions and mitigating risks. But, market exchange can freely take place in a set-up attributed by absence of any market frictions, transaction costs, information asymmetries etc. Finance, therefore, adds hassles in the Arrow-Debreu model (Levine, 1997). This set of assumptions, however, is both, inappropriate and impractical. Realistically, there exists a dynamic relation between finance and growth. To investigate the same, economists thereafter started exploring the nexus between finance and growth, at both, theoretical and empirical levels. As a result, the debate over the ‘supply leading growth hypothesis’ of Schumpeter (1911), and the ‘demand followed hypothesis’ of Robinson (1952) started growing. The relationship between finance and growth can be summarized in the following four hypotheses (Chuah and Thai, 2004; Acarvci, Ozturk and Acarvci, 2009; Gurgul and Lach, 2012).
First, the supply leading growth hypothesis of Schumpeter (1911) postulates a positive and significant role of finance in expediting growth. According to Schumpeter (1911), “well functioning banks spur technological innovation by identifying and funding those entrepreneurs with the best chances of successfully implementing innovative products and production processes.” The Arrow-Debreu sort of a market characterization is nothing, but, unreal. The existence of market frictions, information asymmetries, and transaction costs cannot, per say, be overruled. Additionally, if the quantum of these imperfections is high, no exchange would take place in the markets. Therefore, in order to overcome these hassles, financial institutions and intermediaries come into the picture. They help to reduce such costs and increase the efficiency of markets (Levine 1997; Acaravci, Ozturch and Acaravci, 2009).
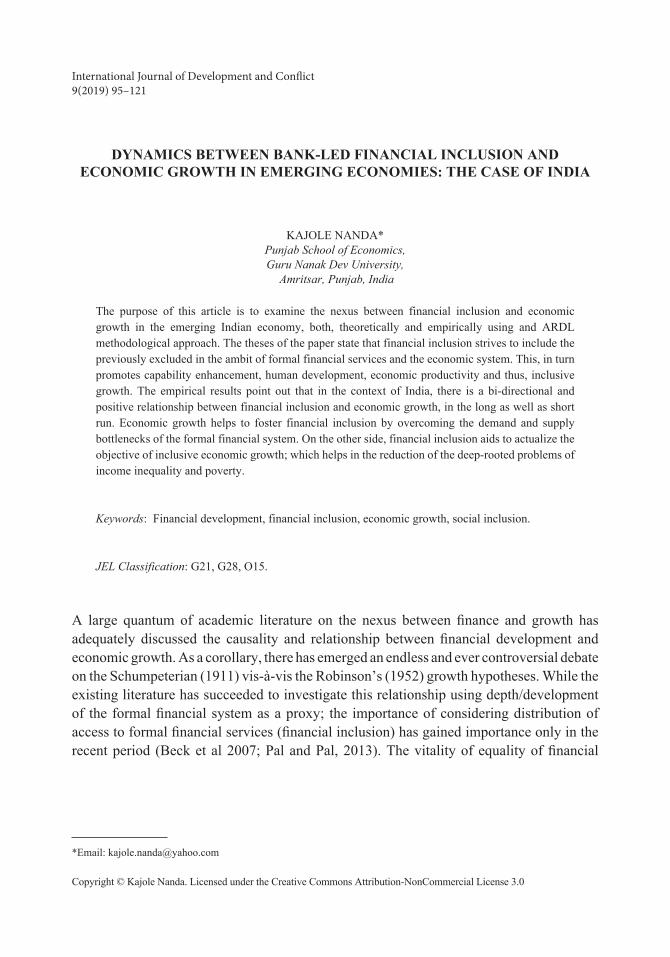
In order to make informed investment decisions, evaluation of markets, firms, and managers is inevitable. This, however, is not only difficult, but also costly (Carosso, 1970; Levine 1997). To ease such problems, financial systems, through their institutions and intermediaries facilitate adequate monitoring of these for their clients. They also help individual and/or small investors in overcoming difficulties in acquiring and evaluating information on investment opportunities and strategies (Levine, 1997). All of these help in accentuating savings’ performance and the rate of physical and human capital accumulation. This, in turn, spurs technological innovation, thereby inducing growth (Levine, 1997). A summary of the theoretical link between finance and economic growth, as proposed by Levine (1997) has been presented in Figure 1. Additionally, empirical research works in this regard have also tested and substantiated this direction of causality and the nexus between finance and growth (Jung 1986; King and Levine, 1993; Patrick 1996; Bhattacharya and Swasubramian, 2003; Shan, 2005; Odhiambo, 2009; Jalil and Feridun, 2011).
Financial Functions -Mobilize resources -Associate resources - Exert corporate control -Facilitate risk management -Ease of trading goods & services
Channels of Growth - Capital accumulation -Technological goods & innovation
Growth
Source: Levine, 1997
Figure 1: Levine’s Theoretical Approach to Finance and Growth
Second, according to the ‘demand following hypothesis’ of Robinson (1952, pp. 86), “where enterprise leads, finance follows”. Economic growth creates demand for several financial arrangements, products, and services. As a result, the financial system automatically responds to them (Robinson, 1952; Patrick, 1966; Demetriades and Hussein, 1996). In such a response, it creates and introduces new financial markets and institutions. Further, it also improves the role of market intermediaries to satiate such elevated demand (Acaravu, Ozturk and Acaravi, 2009). This set of theoretical findings has also been validated by empirical works in this context (Demetriades and Hussein, 1996; Shan, Morris and Sun, 2001; Shan, 2005; Odhiambo, 2008; Teng & Liang, 2010; Sarma & Pais, 2011; Gurgul & Lach, 2012; Chow & Fung, 2013).
The third hypothesis postulates a bi-directional or feedback link between finance and growth. Financial development gradually stimulates economic growth, which in feedback, spurs financial development, and vice-versa. Robustness of the same set of hypotheses has also been documented by empirical works (Darrat, 1999; Singh, 2008; Acaravci, Ozturk and Acaravci, 2009; Teng and Liang, 2010).
The fourth finance-growth hypothesis advocates the neutrality, and even negates the importance of finance for growth. Under this approach, financial development and
Dynamics Between Bank-Led Financial Inclusion and Economic Growth in Emerging Economies 99
economic growth are independent of each other (Stern, 1989) According to Lucas (1988), the role of financial deepening, if not neutral, is trivial in inducing growth.
The findings of the four finance-growth hypotheses suggest that the finance-growth nexus or the growth-finance nexus is not positive in all cases. Further, the nexus may vary depending upon the kind of political, economic and social factors across economies. The relationship may also vary depending upon the stage of economic development of an economy.
1.2 Financial Inclusion and Economic Growth
The ever growing theoretical and empirical literature has although adequately discussed the nexus between financial development and economic growth; economic literature on financial inclusion and growth has, however, remained scanty. According to United Nations (2006), “equality of financial access is a key requisite to enable the economically and socially excluded people to integrate better into the economy and actively contribute to development.” Financial inclusion and development are, therefore, inter-linked (Kodan and Chhikara, 2013). Financial deepening should not only imply depth of formal financial institutions (e.g. banks) in terms of the volume of credit extended by them; but, should also strive to include in its ambit, equality of opportunity of financial access to even the most vulnerable. The questions then arise; whether economically advanced regions are also financially more included? Whether financial inclusion and economic growth influence each other? What is the nature and extent of the relationship and causality between them? The subsequent section aims to theoretically tackle these issues.
Finance matters for both, economic growth and development (Pal and Pal, 2013). Developed financial systems provide greater accessibility to funds than the under-developed ones. The problems of poor availability and access to funds in the under-developed systems stem out of both demand and supply bottlenecks (Kodan and Chhikara, 2013). In such circumstances, the lagging sections of the society depend only on their meager incomes and savings for reaping the benefits of economic growth (e.g. education, entrepreneurship etc.) (World Bank, 2008; Kodan & Chhikara, 2013). Informal sources of finance emerge as the only alternative source available to them. They, however, offer such a support at interest rates three to four times higher than the banks’ lending rate (Kodan and Chhikara, 2013). As a corollary, the under-advantaged sections either remain deprived of the gains of economic growth, or the cost benefit ratio for them becomes staggeringly high. This, in turn, keeps them trapped in the poverty net. The benefits of economic growth, thus, continue to remain concentrated in the hands of those who are already served by the formal financial system (RBI, 2008; Bongomin, 2016). The gap, therefore, between the economically privileged and the under-privileged widens.
Notwithstanding the importance of a developed financial system, an all-inclusive financial framework is inevitable in ensuring equality of access to economic opportunities for furthering growth. The minimum that such a framework strives for is parity in terms of accession to formal savings. Savings additionally are one of the measures of financial
100 K. Nanda
inclusion. Inclusion helps to mobilize savings, channelizing them towards the most productive uses (Levine, 1997). Through savings, the economically underprivileged become capable of incorporating themselves in the formal financial network (World Bank, 2008; RBI, 2008; Sarma 2008; Dacanay, Nito and Buensuceso, 2011). The poor, however, are dis-savers. They have an intrinsic need to borrow (Armendáriz and Morduch, 2010; Dacanay, Nito and Buensuceso, 2011). Additionally, other than saving or deposit, credit is the second leg of financial inclusion. The modus operandi of inclusion is to provide “timely and adequate credit, when needed by the vulnerable groups, at an affordable cost” (RBI, 2008). The funds should, therefore, be made available well in time, to even the weakest section of the society, in order to enable them to realize the benefits of economic growth.
The provision of loans to the poor, however, raises issues regarding the borrowers’ risk of default. In such cases, the financial products of the formal sources of finance (including micro-finance institutions) should so be designed to minimize such a risk (Dacanay, Nito and Buensuceso, 2011). By all odds, financial inclusion, through its various means (small and safe savings, meticulously designed credit products etc) enhances economic productivity, physical and human capital accumulation, human development and risk reduction (United Nations, 2006). Thus, financial inclusion helps in trimming down poverty and inequality directly by providing access to formal savings and growth; and indirectly by inducing ‘all-inclusive’ growth (Kuri and Laha, 2011; Pal and Pal, 2013).
Deepening of financial services is conditioned upon the level of economic growth (Gurley and Shaw, 1955; Patrick, 1966; Calderon and Liu, 2003; Laha and Kuri, 2014). Economic growth influences both, demand and supply of financial services. With enhancement in the availability of formal financial services and improvement in the delivery mechanisms, the supply side inadequacies are reduced. These improvements follow as consequences of economic growth (RBI, 2008; Kuri and Laha, 2011). On the flip side, economic backwardness causes a feeble demand for formal financial products, services and/or arrangements. In order to better the inclusion level of the under-privileged, remotion of their economic posteriority is a prerequisite. This can be facilitated by adequate provision of employment opportunities, improving physical resource endowments and human development, mitigating risks etc (RBI, 2008). All of these and also many more are the results of economic growth. Financial inclusion is, therefore, colligated with greater levels of economic growth (Sarma and Pais, 2011; Kodan and Chhikara, 2013). Additionally, adequate policies on economic growth, focusing on the equitable distribution of income are conducive to financial inclusion.
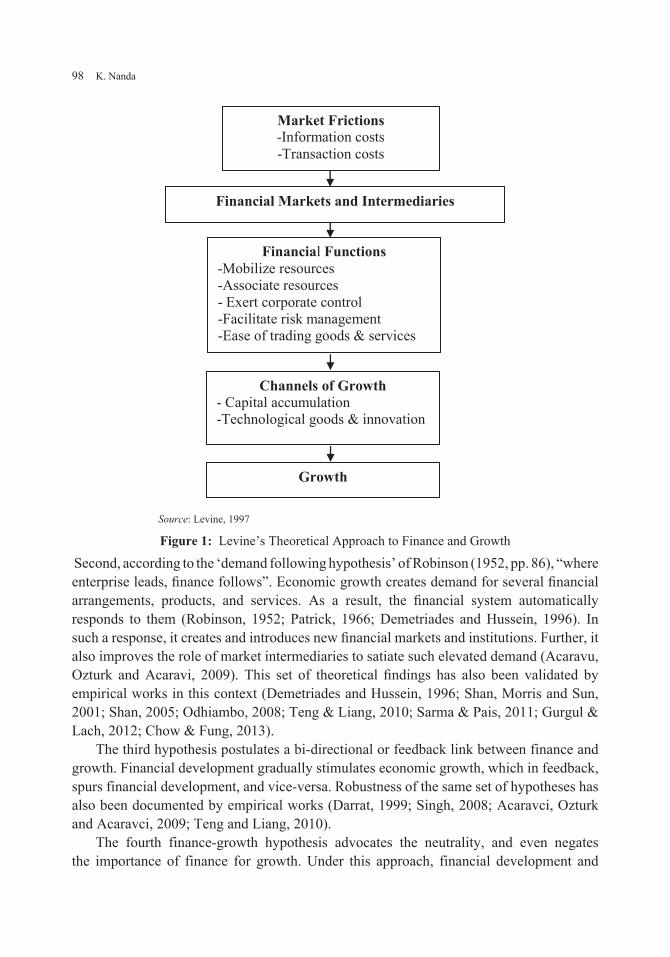
The interplay between financial inclusion and economic growth is even more dynamic. Panoramically, financial development creates an enabling environment for economic growth; and economic growth creates economic opportunities. Financial inclusion, by striving to include even the most vulnerable in the ambit of formal financial services, provides these opportunities to the previously economically deprived. As a result, they become able of assimilating themselves in the formal financial and economic system (United Nations, 2006; Kodan and Chhikara, 2011; Kodan & Chhikara, 2013). This in turn helps in capability enhancement, human development, and improvements in economic
Dynamics Between Bank-Led Financial Inclusion and Economic Growth in Emerging Economies 101
productivity and standard of living, enhancement in physical resource endowments, and reductions in risk and involuntary exclusion. All of these aid diminution in poverty and income inequality. On the whole, inclusive growth gets promoted (Kuri, 2010; Kuri and Laha, 2011; Kodan and Chhikara, 2011). A summary of the interplay between financial inclusion and economic growth has been presented in Figure 2.
The previous discussion reveals that the nexus between poverty and limitations in access to finance is robust and problematic. Talking about India, the problem with the modus operandi of the country’s banks is that they believe in, and focus on making more money from the opulent clients in urban areas than the poor and deprived in the rural parts. The oft quoted reasons for less financial inclusion in the rural areas of the country are; the rural poor ‘can’t save’ or are ‘not willing to save’. This however, is not entirely true. Several survey reports have found out that the rural poor have a unique need to save. So, the products and services of the banks should be specifically designed to cater to such (small) needs of such clients. Inability of the banking system in this regard, has impelled dependence of the poor (rural) individuals and households on the informal and potentially usurious sources of funds. This has resulted in a two-fold impact on the economy, one the economy has remained deprived of a huge pool of savings, which could have been invested profitably; two, the poor have failed to enjoy the outcomes of economic growth. Specifically, the fruits of the previous two decades of economic growth have been enjoyed only by the economically ‘well-off’ Indians. The need of the hour is to include the vulnerable and the deprived in the ambit of formal financial services to achieve the millennium development goal of ‘all-inclusive ‘growth. (Jain, 2012)
Therefore, both, financial inclusion and economic growth have a consequence for each other. The nature and extent of causality between them are however complex. Each one has an implication to reinforce the other. (Kuri and Laha, 2011). Conclusively, financial inclusion is a means for actualizing the objective of inclusive growth (UNDP, 2006).
2. Relevance of Financial Inclusion in India
According to the United Nations, “access to well functioning financial systems by creating equal opportunities, enables the economically and socially excluded individuals to integrate better in the economy, and actively contribute towards development and also protects them against economic shocks”. Given that a quarter of the world’s population is out of the ambit of formal financial services, the World Bank group and the United Nations in October 2013, put forth a vision to achieve universal financial inclusion by 2020. 50 countries of the world, including India, have, since then, dedicated themselves for the accomplishment of the said objective.
Literature suggests that transitionary or developing economies have a relatively lower level of formal financial inclusion, juxtaposed the developed ones; and India is one of them (Park & Mercado., 2015). Agriculture dominates the country’s economy, thereby characterizing it with various socio economic problems like low income, poverty, unemployment, high income inequality etc. Also a large section of the country’s population
102 K. Nanda
Equi
tabl
e di
strib
utio
n of
in
com
e R
educ
tion
in p
over
ty &
in
com
e in
equa
lity
'All-
incl
usiv
e' gr
owth
Ris
k m
itiga
tion
R
educ
tion
in
invo
lunt
ary
excl
usio
n
Impr
ovem
ent i
n st
anda
rd o
f liv
ing
Im
prov
emen
t in
econ
omic
pr
oduc
tivity
Enha
ncem
ent o
f ph
ysic
al re
sour
ce
endo
wm
ents
Impr
ovem
ent i
n hu
man
de
velo
pmen
t
Cap
abili
ty
enha
ncem
ent
Mak
es e
cono
mic
opp
ortu
nitie
s ava
ilabl
e to
ev
en th
e m
ost v
ulne
rabl
e
Fina
ncia
l inc
lusi
on
Econ
omic
opp
ortu
nitie
s
Cre
ates
eco
nom
ic o
ppor
tuni
ties
Cre
ates
an
enab
ling
envi
ronm
ent
Econ
omic
gro
wth
Fina
ncia
l dev
elop
men
t
Sour
ce: A
utho
r's e
labo
ratio
ns b
ased
on
Levi
200
8; K
uri a
nd L
aha
2011
Figu
re 2
: Int
erpl
ay b
etw
een
Fina
ncia
l Inc
lusi
on a
nd E
cono
mic
Gro
wth
Dynamics Between Bank-Led Financial Inclusion and Economic Growth in Emerging Economies 103
lives at the ‘bottom of the economic pyramid’. All of these are serious roadblocks to formal financial inclusion in the country.
Estimates suggest that only 35 per cent of adults in India have a bank account and only 8 per cent avail formal credit (Demirgüç-Kunt and Klapper, 2012). About 70 per cent of the country’s population lives in rural areas, wherein the condition of formal financial inclusion is even worse. According to the World Bank estimates (as quoted in Nair and Tankha, 2015), about 59.5 per cent of the rural households in the country are not linked to banks. The situation is even worse in the category of landless or marginal workers, wherein about 70 per cent of them are financially excluded. The statistics highlight the status of financial exclusion and the dire need to achieve financial inclusion in the country.
Indian economy is a bank based economy, as banks dominate the country’s financial system. In India, the commencement of an indirect bank led approach for achieving financial inclusion can be traced back to the year 1904, when the Cooperative Bank was established in the country. Subsequent major steps in this regard include, nationalization of the scheduled commercial banks in the country (1969 and 1980), setting up of Regional Rural Branches (RRBs) in 1975 and introduction of banking sector reforms for financial depth/penetration in 1990s. The Government of India and the Central Bank (Reserve Bank of India)also introduced several schemes like the Integrated Rural development program in 1978,Indira Awaz Yojna in 1985, MFI-SHG Model in 1992 etc to link the deprived with the main stream financial products/services. To focus explicitly and exclusively on financial inclusion, RBI set up Khan Commission in the year 2004. The Commission recommended making available basic no frills bank accounts to ‘all’. The recommendations of the committee were incorporated in the midterm review of the monetary policy of 2005-06. Following this, to deliberate on the issue of financial inclusion, RBI formed a Committee on Financial Inclusion, under the chairmanship of Dr. C. Rangarajan in the year 2006. Defining financial inclusion as “The process of ensuring access to financial services and timely and adequate availability of credit where needed by vulnerable groups such as the weaker sections and low income groups at an affordable cost”, the Committee recommended ensuring appropriateness, availability and uniqueness of financial products and services to suit the financial needs of the poor and vulnerable. Following the recommendations of the Committee, financial inclusion was made an explicit policy objective by the Government. The country witnessed another radical step towards financial inclusion, when the present Prime Minister, Mr. Narendra Modi introduced a national mission scheme for financial inclusion, titled Pradhan Mantri Jan Dhan Yojna on August 28, 2014. The said scheme is considered as the most revolutionary step towards financial inclusion, so far. While the primary focus of the scheme is to provide basic banking account for all households of the country, it is supplemented by provisions of an overdraft facility, RuPay Debit Card1, accidental life insurance worth INR 100,000. Over the span of the launch of the scheme, a total of 224.5 million accounts (as on March 15, 2017) have been opened. However, mere opening of bank accounts is not sufficient, as 23.94 per cent of these accounts are still dormant (Sharma, 2016). Therefore, promotion of greater usage of bank accounts becomes important to ensure that the said scheme and other social banking experiments of the country fruitfully contribute towards a country’s holistic growth.
104 K. Nanda
3. Review of Literature
Studies in the context of measurement of financial inclusion are available at both, macro (cross country) and micro (within country) levels. Since banks have been observed to dominate the financial systems across countries, therefore, as indicators of an inclusive financial system, penetration of deposits and credit, availability of bank branches and usage of the deposit and credit services have emerged as the most widely used indicators of financial inclusion, in both national and international perspectives (Beck et al., 2007; Honohan, 2008; Sarma 2008; Mehrotra et al. 2009; Sarma 2010; Sarma and Pais 2011; Chakravarty and Pal 2010; Chattopadhyay 2011; CRISIL 2013; and Kodan and Chhikara 2013). Penetration of ATMs (Beck et al. 2007; Sarma, 2010), Point of Sale (PoS) terminals, cost and ease of transactions (Gupte et al, 2012) have been found to be other important indicators of financial inclusion, the usage of which has however been limited, owing to paucity of adequate data. In the cross country context, Honohan (2008); Sarma (2008); Sarma and Pais (2011); Park and Mercado Jr. (2015) have found that the level of financial inclusion of a country is a reflection of its level of economic development. That is why, while financial inclusion is in a majority in the developed countries, it is in a great minority in the LDCs. In the case of India, Chakravrthy and Pal (2008); Chattopadhyay (2011); Kumar and Mishra (2011); CRISIL (2013); Yadav and Sharma (2016) have found out an overall low-moderate level of financial inclusion in the country, with a distinct presence of interstate variability in terms of financial inclusion. Further, Kuri and Laha (2011), Kumar (2013) have documented varied levels of financial access and availability in diverse geographic locations of the country.
Methodologically, either individual indicators on standalone basis (Beck et al., 2007; Conrad et al., 2008; Kodan and Chhikara, 2011; Mehar, 2014) or composite index (Honohan, 2008; Mehrota et al., 2009; Chakravarty and Pal, 2010; Chattopadhyay, 2011; Kumar and Mishra, 2011; CRISIL, 2013; Ambarkane et al., 2014; Park and Mercado, 2015; Rahman, 2016) of financial inclusion based on averages have been used to measure financial inclusion. While the use of individual indicators provides only partial information about the inclusiveness of the financial system as a whole; the application of averages for the computation of a financial inclusion index is dramatically affected by the outliers. Therefore, indices based on Euclidean Distance Functions as propped by Sarma (2008) and Sarma (2012) provide appropriate measurement of the extent of financial inclusion of a particular region. The computation and usage of such indices, however, is in infancy and have only been computed at the cross country level and also for a single point of time.
The literature on the nexus between financial development and economic growth has adequately established the relationship between the two, with the finding that the nexus between the two may be positive (Schumpeter, 1911; Robinson, 1952) or completely insignificant (Lucas, 1988). Further the relationship between the two is also found to depend upon the political, social and economic factors (Barajas et al., 2012). The literature has also established that in the case of emerging economies, while in the short run there may be a positive relationship between financial deepening and economic growth (Apergis et al., 2007), the association may weaken in the long due to inflationary pressures and non
Dynamics Between Bank-Led Financial Inclusion and Economic Growth in Emerging Economies 105
productive credit (Demetriades and Hussein 1996; Rosusseau and Wachtel, 1998; Arestis et al., 2001). While the researchers have found an indirect association between deepening and growth in the cross country context, there is complete absence of such a study in the context of India. Also, financial deepening is only one of the various dimensions of financial inclusion. It is important to mention here, that very few studies have explicitly focused on the direct association between financial inclusion and economic growth. Financial inclusion is not only an integral part of social banking, but holds significant importance in the financial development of a country. The interplay between financial inclusion and economic growth has only been confirmed theoretically (UNDP, 2006; RBI, 2008; Kuri and Laha, 2011), or a high correlation between the two has been recorded (Arora, 2010). Specific to the Indian context, Kumar (2013), Kodan and Chhikara (2013); Chakravarty and Pal (2013) have found out a positive role of economic growth in furthering financial inclusion. No evidence on the direction of causality between them has however been obtained. Further, the studies that have been conducted to examine the determinants of financial inclusion have treated financial inclusion as an endogenous variable and the set of economic growth related variables as exogenous. The relationship between these variables is, however, complex. They have to be treated as endogenous and exogenous simultaneously. No such study has been carried out in the case of India.
Overall review of the relevant literature suggests that the research work in the area of financial inclusion has evolved through various stages and dimensions. Beginning from the conceptual development, theoretically recognizing the importance of financial inclusion for economic (all inclusive growth), it has further moved on to development of a comprehensive index to measure financial inclusion and further to the establishment of economic growth as a significant determinant of financial inclusion. The research evidences are available in both, macro and micro contexts. A critical review of the literature, however, suggests that the studies based on individual indicators lack comprehensiveness on the assessment of the inclusiveness of the financial system as a whole, and those based on indices are largely based on averages and therefore, do not yield an adequate measure of financial systems’ inclusiveness. Further, empirical evidences based on the relationship between financial inclusion and economic growths are quite in infancy, are largely theoretical in nature and fail to use appropriate statistical model/s to address the dynamism between the two. The literature has helped in gaining necessary insights to identify the research gap/s, formulate the research question and to identify the appropriate methodology to be used for the current purpose.
4. Research Design
4.1 Objectives of the Study
The article seeks to empirically examine the causal relationship and the long and short run dynamics between financial inclusion and economic growth in India. Indian economy has been preferred to achieve this objective because the Indian financial system is dominated by banking institutions for the purpose of mediation of funds. Hence, formal financial
106 K. Nanda
inclusion, in terms of access to banks and banking services by the society is imperative to attain holistic or inclusive growth of the nation
4.2 Variables and Data Sources
In order to study the relationship between financial inclusion and economic growth, two variables, i.e. Index of Financial Inclusion (IFI) and the Natural Logarithm of Per Capita State Domestic Product at real prices (LPCSDP) have been employed to proxy financial inclusion and economic growth, respectively. As regards the measure of economic growth, the economic theory suggests the usage of GDP per worker, i.e. labour productivity, rather than per head of population. Since annual data on labour productivity (state wise labour productivity in this case) is not available, studies have commonly used per capita GDP as a measure of economic growth (Roubini and Sala-i-Martin, 1992; King and Levine, 1993; Levine, 1997; Singh, 2014). Also, Heston (1994) suggests that GDP per capita is a better measure of economic growth over aggregate GDP, due to the fact that errors in the estimation of GDP are counter balanced by the errors in the estimation of population. Further to capture the essence of state specific heterogeneity, dummy variables for 16 out of 17 states have been introduced as exogenous variables in the models. While IFI values have been calculated using inverse of the normalized euclidean distance (discussed ahead), the estimates of the State Domestic Product have been obtained from the Handbook of Statistics of Indian Economy (Reserve Bank of India, various issues).
4.3 Sample Size and Reference Period
Data have been used for 17 major Indian states from 1994-95 to 2013-14. These 17 states2 contribute towards more than 75 per cent of the country’s GDP and account for about 80 per cent of its population.
4.4 Methodology
4.4.1 Methodology for the computation of IFI Based on the financial inclusion indicators presented in the Financial Access Survey of the International Monetary Fund (IMF), the Index of Financial Inclusion (IFI) has been computed for the present purpose. The indicators have been further classified into three categories viz., Banking Penetration (d1), Availability of Banking Services (d2) and Usage of Banking Services (d3) that have been used as dimensions for the computation of IFI (Sarma, 2008; Sarma, 2010; Chattopadhyay, 2011; Bihari, 2011; Prusty et al. 2011; Sarma and Pais, 2011; CRISIL, 2013 etc). In order to determine the Index of Financial Inclusion (IFI) for India, first, the respective dimension indices have been calculated using the UNDP’s methodology of index computation (equation 1). Such computed values for each dimension have subsequently been multiplied by the respective dimension weights to arrive at the final dimension score (equation 2). The final Index of Financial Inclusion (equation 5) has been arrived at by averaging the normalized inverse euclidean distance
Dynamics Between Bank-Led Financial Inclusion and Economic Growth in Emerging Economies 107
from the ideal dimension points (equation 3), and the normalized worst point distance (equation 4) in a three dimensional Cartesian space (Sarma, 2012). A detailed explanation of the variables considered and the methodology for IFI computation has been provided in the Annexure I.
dA mM mi
i i
i i= −
− (1)
wd w di i i= × (2)
Xw d w d w d
w w w1
1 12
2 22
3 32
12
22
32
1= −− + − + −
+ +
( ) ( ) ( ) (3)
Xd d d
w w w2
1 2 3
12
22
32
=+ ++ +
(4)
IFIX X= +1 2
2 (5)
Where: di is the dimension index; wi is the dimension weight; Mi is the maximum dimension value; mi is the minimum dimension value; d1, d2, d3 represent the dimension indices on penetration, availability and usage; X1 is the normalized inverse euclidean distance from the ideal point (1; 0.5; 0.5); X2 is the euclidean distance from the worst point (0; 0; 0).
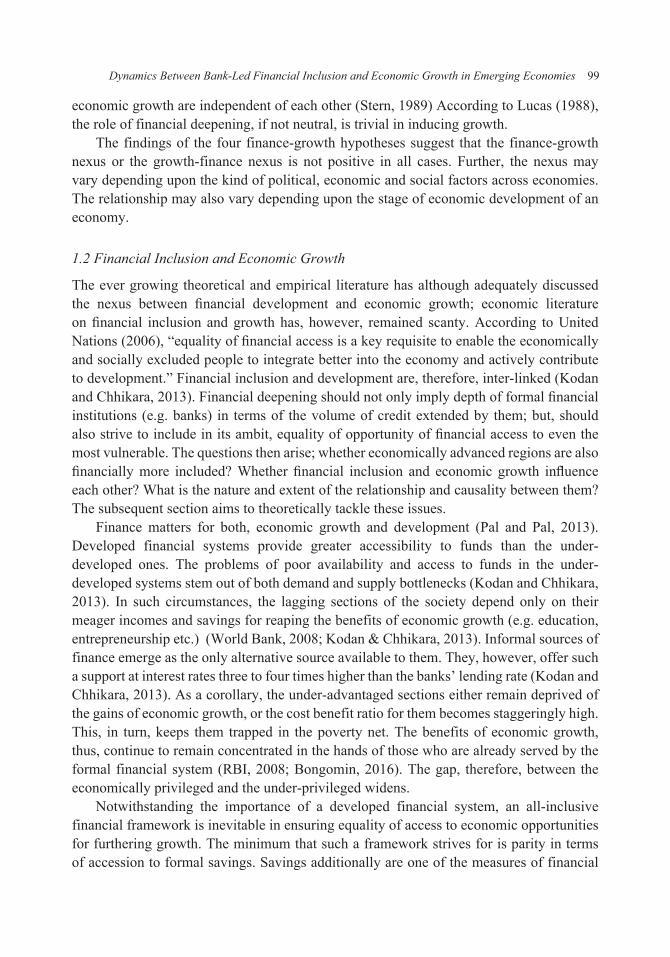
A graphical representation of the index has been presented in the form of Figure 3. The dotted line in the graph indicates the worst point distance, and the black (bold) line the ideal point distance.
Source: Sarma, 2012
Figure 3: Graphical Representation of IFI
108 K. Nanda
4.4.2 Co-integration: ARDL and Bounds Testing Approach
Various approaches to co-integration have found wide applicability in the empirical economic literature. In the context of two variables, the Engle-Granger Method, originally suggested by Engle and Granger (1987) has generally been used. Accordingly, if two variables are integrated of the same order; in order to establish co-integration, the residuals from the regression should be stationary at level. The same can be explained as follows:
If Xt and Yt are integrated of the same order; and
Yt - βo Xt = μt; (6)
Where: Yt is the dependent variable; Xt is the independent variable; mt is the error term (should be level stationary)
This model, however, suffers from serious limitations. First, being a single equation method, the maximum number of co-integration relationships that it allows is one. Hypothetically, there can be up to n-1 co-integration vectors. This limitation can, however, be ignored in a two variable context (Yusupov et al, 2010). Second, it suffers from simultaneous equation bias, i.e. two non-stationary variables cannot be simultaneously treated. Even if the relationship between the variables is coeval, the variables have definitely to the identified as endogenous and exogenous, individually and distinctly (Yusupov et al, 2010). Third, the method is affected by the variable chosen for normalization (Ssekuma, 2011). Therefore, alteration of the role of the variables from endogenous to exogenous (and vice-versa) may alter the conclusions (Yusupov et al, 2010). Fourth, in testing for co-integration, the method suffers a lack of power, typically in small samples (Yusupov et al, 2010). Fifth, the long run regression derived under this model, although consistent, may not always be efficient (Utkulu, 2012).
Another and perhaps the most widely applied approach is the Johansen Test. As an improvement over the Engle-Granger test, this approach allows more than one co-integrating vectors. However, this approach is multi-variate in nature and cannot be applied in the context of two variables.
The third approach that allows checking for co-integration is the ARDL model. This model can be applied in cases of two or more than two variables that are integrated of the same or different orders. Further, small sample properties of the ARDL approach are far superior to that of the co-integration approach of Johansen and Juselius (Pesaran, Shin and Smith, 1999; Jalil and Feridun, 2011). Thus, for the current discussion, an ARDL and Bounds Testing approach has been adopted to investigate the relationship between financial inclusion and economic growth. As a preliminary step, stationarity has been checked using the Im, Pesaran and Shin Unit Root Test. Further the lags have been selected using Schwarz Criteria. The long run relationship between the two has been examined using the following forms:
Dynamics Between Bank-Led Financial Inclusion and Economic Growth in Emerging Economies 109
Where: α1 and α2 are constants; β1 to β34 are respective regression coefficients; e1 and e2 are error terms; D1 to D16 are state specific dummies capturing cross sectional heterogeneity.
In order to apply the bounds testing procedure, the following conditional ARDL models have been applied
∆ ∆ ∆
∆
IFI IFI LPCNSDP
D
ti
n
i ti
n
i t i
i
n
i
= + ∑ + ∑
+ ∑
=−
=−
=
a b b
b
31
35 10
36
037 11 16
052 1 1 2 1 1t i
i
n
i t i t t tD IFI LPCSDP−=
− − −+ …+ ∑ + ++b q q m∆
(9)
∆ = + ∆ + ∆ +=
−=
−
=
∑ ∑
∑
LPCSDP LPCSDP IFIti
n
it i
i
n
i t i
i
n
a b b41 53
5310
54
0
bb b q m550
71 2 1 21 1∆ + + ∆ + +−=
− −∑D D LPCSDPt ii
n
t i t t�
(10)
Where: θ1 and θ2 are the long run multipliers, α3 and α4 are constants; β35 to β71 are respective regression coefficients; µ1t and µ2t are error terms.
The Bounds F-test is used for testing the existence of the long-run relationship. The null hypothesis for the same is for no co integration among variables i.e. H0: θ1= θ2 = 0; against the opposite (H1) that H1: θ1 ≠ θ2 ≠ 0. Further the short run relationship has been examined by using the following Error Correction Model:
∆ = ∆ + ∆ + ∆= = =
− −∑ ∑ ∑1 1 1 130
35 30
36 30
371 1F F LPCNSDP Dt i it tai
n
i
n
i
n
† † † 11
16 1
1
1 1 10
52
t i
t i t ti D ECT e
−
− −=
+ +
∆ + +∑
�
i
n
† j
(11)
∆ = + ∆ + ∆ + ∆=
−=
−=
∑ ∑ ∑LPCSDP LPCSDP Fti
n
i ti
n
i ti
n
a b b b11
53 10
54 10
551 1 11
16 2
1
071 1 2 1 2
t
i
n
t t tECT e
−
=− −
+ +
∆ + +∑
�
b j
(12)
Where: D is the difference operator, and ECT are the Error Correction Terms
5. Results and Discussion
5.1 Preliminary Testing: Unit Rest Test
In order to ensure an absence of statistical impurities arising from non stationary series, it is pertinent to check the order of integration. The order of differencing at which a non stationary series becomes stationary is termed as the integration order. Im, Pesaran and Shin (IPS) test statistic has been used to check the order of integration. Providing distinct estimates for each cross-section, this test permits different specifications of parametric values, residual variance and lag lengths.
110 K. Nanda
In the first step, the existence of unit root in the variables IFI and LPCSDP has been tested using IPS statistic. This has been done to find out the order of integration, and also to check the possibility of co-integration between IFI and LPCSDP. The results of Panel Unit Root Tests have been presented in Table 1
Table 1: Im, Pesaran and Shin Unit Root Test
H0a: IFI has a unit root;H0b: LPCSDP has a unit root.H1a: IFI does not have a unit root; H1b: LPCSDP does not have a unit root.
Variables Without Trend (Individual Intercept)
With Trend (Individual Intercept and Trend)
Order of Integration
Level First Difference
Level First Difference
IFI 0.717(0.763)
-9.369*(0.000)
-1.579(0.057)
-5.976*(0.000)
I (1)
LPCSDP 10.507(1.000)
-9.090*(0.000)
1.501(0.933)
-9.658*(0.000)
I (1)
Notes: Based on data provided in Annexure II and III; * denotes statistical significance at 1% level; figures in parentheses indicate p-valuesSource: Authors’ own calculations
Table 1 iterates presence of unit root at ‘level’ in both variables. The variables are therefore not stationary at level. However, differencing (first difference) causes attainment of stationary (in both cases). The variables can sufficiently be concluded to be integrated of order one. As both series are integrated of the same order ’d’, d>0 (d=1); the subsequent step involves checking the existence of a stationary linear combination of these variables. If the existence of a stationary linear combination is confirmed, the variables can then be inferred as being co-integrated. The subsequent section aims to discuss the same.
5.2 Long-Run Dynamics
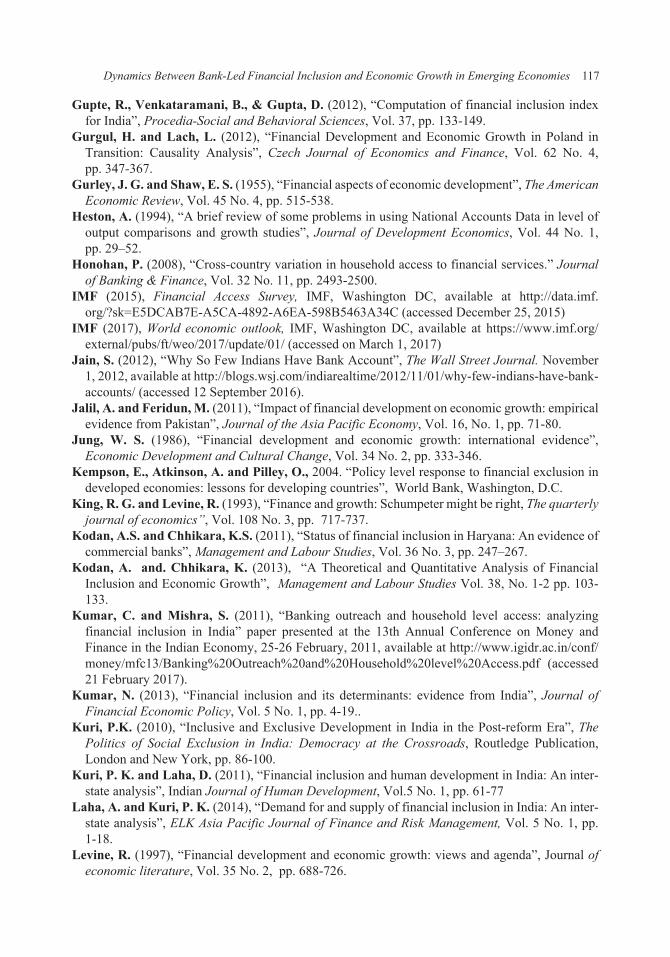
In order to probe into the nexus between financial inclusion and economic growth; an ARDL approach has been employed. The first step that follows in the ARDL estimation is selection of lags for the appropriate model. For this, Swartz Criteria (SC) has been selected over Akaike Information Criteria (AIC) due to its parsimoniousness (Nyasha and Odhiambo, 2015). Also, SC is observably a consistent and better approach of model selection over AIC (Pesaran, 1997). Consequently, with IFI as the dependent variable, ARDL (4, 1) model has been selected; and with LPCSDP as the dependent variable, ARDL (1,1) has been chosen. Additionally, Graphs 1(a) and 1(b) have been presented to highlight the model selection summary.
Dynamics Between Bank-Led Financial Inclusion and Economic Growth in Emerging Economies 111
Graph 1(a): ARDL Model Selection Summary based on Schwarz Criteria
Graph 1(b): ARDL Model Selection Summary based on Schwarz Criteria Dependent Variable: LPCSDP
Subsequently, the existence of co-integration or long run relationship among the variables has been checked using Bounds F Test. The results of Bounds F test have been presented along with asymptotic critical values in Tables 2(a) and 2(b) respectively.
Table 2(a): Bounds F Test for Co-integration
H0c: No long run relationship between the variables existsH1c: Long run relationship between variables exists
Dependent Variable F StatisticIFI 113.082*LPCSDP 49.266*
Notes: Based on data provided in Annexures II and III; * denotes statistical significance at 1% levelSource: Authors’ own calculations
The results indicate that the value of F statistic is greater than the critical (upper) bound values. The null hypotheses indicating an absence of any long run (co-integration) relationship between financial inclusion and economic growth (and vice-versa) fail to be accepted against the alternative of a long run relationship. IFI and LPCSDP are, therefore, co-integrated in both cases. Furthermore, the long run dynamics between financial inclusion and economic growth have been investigated using equations 7 and 8. Results for the same have been presented in Tables 3(a) and 3(b).
Table 3(a): Long Run Coefficients (Dependent Variable: IFI)
Notes: Figures in parenthesis indicate p values; * denotes statistical significance at 1% level; most (14 out of 16) state dum-mies were found to be statistically significant; the same have not been presented here for the sake of brevity. Source: Authors’ own calculations
Table 3(b): Long Run Coefficients (Dependent Variable: LPCSDP)
Variable Coefficient Std. Error t-Statistic
C 8.645 0.242 35.687*(0.000)
IFI 3.222 0.400 8.062*(0.000)
Notes: Figures in parenthesis indicate p values; * denotes statistical significance at 1% level; most (14 out of 16) state dum-mies were found to be statistically significant; the same have not been presented for the sake of brevity.Source: Authors’ own calculations
The results indicate that when financial inclusion is assumed as the dependent variable, there is notably a positive and significant effect of growth on it. The reverse is also true for the impact of financial inclusion on growth. The outcomes corroborate the existence of a bi-directional relationship between the variables. Financial inclusion and economic growth, therefore, reinforce each other (Kuri and Laha, 2011). The findings also compare favorably with previous (theoretical and empirical) research works (United Nations, 2006;RBI, 2008; Sarma and Pais, 2011; Kuri and Laha, 2011; Dacanay, Nito and Buensuceso, 2011; Kodan and Chhikara, 2013). Further, most state dummies are significant, thereby confirming the existence of cross sectional heterogeneity.
Dynamics Between Bank-Led Financial Inclusion and Economic Growth in Emerging Economies 113
5.3 Short Run Dynamics
To examine the short run dynamics, Error Correction Models (ECMs) have been estimated using equations 11 and 12. The results for the same have been presented in Tables 4 (a) and 4 (b)
Table 4 (a): Co-integration Form (Short Run Coefficients)Dependent Variable ∆IFI
Notes: ∆ denotes first differenced operator; CointEq(-1) is the Error Correction Term; * denotes statistical significance at 1% level. State specific dummies have not been presented for the sake of brevity.
Table 4 (b): Co-integration Form (Short Run Coefficients)Dependent Variable ∆LPCSDP
Variable Coefficient Std. Error t-Statistic
∆ (IFI) 1.924 0.207 9.277*(0.000)
CointEq(-1) -0.383 0.039 -9.749*(0.000)
Notes: ∆ denotes first differenced operator; CointEq(-1) is the Error Correction Term; * denotes statistical significance at 1% level. State specific dummies have not been presented for the sake of brevity.Source: Authors’ own calculation.
The results, presented in Table 4(a) indicate that IFI values of the current and preceding three years have a positive and statistically significant impact on economic growth. Penetration of inclusive finance through greater linkage of individuals with banks in one year may certainly have a carry-over impact on inclusion through higher usage in the subsequent years. This further implies that the task of inclusion does not end in only cajoling masses to open bank accounts, but involves facilitation of greater usage of banking services (Sarma, 2008). Put differently, the absence of full usage of banking services may perpetuate the existence of under-banked or ‘marginally-banked’ individuals in the economy (Kempson et al, 2004; Sarma, 2012). Thus, for improving the level of financial inclusion, efforts should be put in place to prevent further pauperization of these groups. For this, the demand side efforts that include enhancement of financial literacy and awareness, improving human and resource endowments, capacity enhancement, strategic market linkages etc, need to be
114 K. Nanda
put in place. From the supply perspective, the banks should strive to not only expand their network in the remote and rural areas of the country, but also lay more emphasis on the on the ‘uniqueness’ of the financial products and services. Only when the demand and supply side efforts are coupled together, the objective of fruitful and profitable financial inclusion can be achieved.
Further, economic growth helps to further inclusion by overcoming the demand and supply inadequacies of the financial system (e.g. banks) (RBI, 2008; Kuri and Laha, 2011; Sharma, 2016). As discussed in the earlier sections, it creates economic opportunities, and in order to take advantage of these economic opportunities, the previously excluded tend to link themselves with the formal financial institutions (e.g banks). As a result, not only does financial inclusion get promoted, but, they (the previously excluded) get assimilated in the formal financial and economic system, thereby fostering the country’s inclusive growth. The same has been iterated by a positive and significant impact of the variable LPCSDP on IFI, as concluded from Table 4(b).
Furthermore, to check stability and significance of the relationships, the error correction terms (ECTs) as presented in Tables 4 (a) and (b) have been evaluated. When IFI is assumed as the dependent variable, the ECT is noted to be -0.539 conversely, with LPCSDP as the dependent variable, the value of the same is -0.383. Evidently, the significance and sign (negative) of the ECTs confirms the stability of the relationship between the variables in both the cases. Futuristically while economic growth would be capable of restoring back economic equilibrium in 1.85 years, (or 677 days), financial inclusion could do it in 2.611 years (or 953 days).
Overall analysis of the long and short run dynamics between financial inclusion and economic growth reveal a feedback link between the two. The results emphasize on the indispensable roles of financial inclusion and economic growth in enforcing one another. The essence of financial inclusion is in providing accessibility, ensuring penetration and usage of financial (bank) services. Accessibility involves providing and ensuring adequate banking infrastructure in the remotest corners of the country. Greater accessibility also has implications for greater infrastructural development of the country. Easy financial access to the savers and the borrowers also helps in the mobilization of funds and their utilization for the productive purposes of economic growth. Greater linkage of the previously excluded with the formal financial network increases the country’s pool of formal savings, which can in turn be used for investment and capital formation. All of these are stimulants therefore, of economic growth.
Conclusion and Policy Implications
The objective of the study is to investigate the nexus between financial inclusion and economic growth in India from 1994 to 2014. The study attempted to study the relationship using the dynamic Auto Regressive Distributed Lag Model in order to address the problem of endogenity bias. The results confirmed existence of a feedback relationship between financial inclusion and economic growth in a bank based emerging economy, i.e. India, in
Dynamics Between Bank-Led Financial Inclusion and Economic Growth in Emerging Economies 115
both short and long periods. The findings suggest that financial inclusion is an enabler of economic growth in India. The finding implies that linking individuals to bank accounts and ensuring adequate usage of bank accounts is likely to increase the formal saving and investment pool of the country, thereby leading to all inclusive growth. Financial inclusion should be viewed as a policy objective by the policy makers to achieve sustainable economic growth. This, in turn can help to reduce the deep-rooted problems of income inequality and poverty. Typically for a developing country like India; equality of opportunity of financial access is undeniable and conducive to better economic growth. The findings also support the social banking experiment/s of the Government of India.
The study also finds that economic growth helps to foster inclusion by providing economic opportunities and increasing the individuals’ need to be associated with the formal financial network, in order to reap the benefits of this growth. Further, economic growth helps to foster inclusion by overcoming the demand and supply bottlenecks of the formal financial system. The policy implication of this is that the policies on economic growth should explicitly focus on equitable distribution of income and opportunities. This will in turn increase the financial need and therefore, the level of formal financial services’ inclusiveness in the country. The findings of the study, by considering financial inclusion and not financial development or depth, create a new dimension in the finance-growth nexus. The findings bring out that financial inclusion is not only a significant part of social banking, but is imperative to achieve economic growth. The academic implication of this is to direct future research in this area and consider the importance of financial inclusion as an enabler of economic growth.
The findings of the study are of immense importance in understanding the relationship between financial inclusion and economic growth in emerging, bank based economies. The study is, however limited to only banking institutions, and fails to span the importance of Self Help Groups and Micro finance Institutions in this regard. The study also fails to include digital financial inclusion in its ambit owing to paucity of data in this regard. Future studies may work on these limitations and also investigate the nexus in case of developed economies, LDCs, other emerging economies and even in the cross country context.
References Acaravci, S. K., Ozturk, I. and Acaravci, A. (2009), “Financial development and economic growth:
literature survey and empirical evidence from sub-Saharan African countries: economics”, South African Journal of Economic and Management Sciences, Vol. 12 No. 1, pp. 11-27.
Ambarkane et al., (2014), “Measuring financial inclusion of Indian states”, available at www.papers.ssrn.com/sol3/papers.cfm?abstract_id=2485776 (accessed on February 1, 2017).
Apergis, N., Filippidis, I. and Economidou, C. (2007), “Financial deepening and economic growth linkages: a panel data analysis”, Review of World Economics, Vol. 143 No. 1, pp. 179-198.
Arestis, P., Demetriades, P.O. and Luintel, K.B. (2001), “Financial development and economic growth: the role of stock markets”, Journal of Money, Credit, and Banking, Vol. 33 No. 1, pp. 16-41.
Armendáriz, B. and Morduch, J. (2010), “The economics of microfinance”, working paper, Massachusetts Institute of Technology, Massachusetts.
116 K. Nanda
Arora, R. U. (2010), “Measuring financial access”, Discussion Paper No. 201007, Griffith University, Australia.
Arrow, K. (1964), “The Role of Securities in the Optimal Allocation of Risk Bearing,” The Review of Economic Studies, Vol. 31 NO. 2, pp. 91-96.
Beck, T., Demirguc-Kunt, A. and Peria, M. S. M. (2007), “Reaching out: Access to and use of banking services across countries”, Journal of Financial Economics, Vol. 85 No. 1, pp. 234-266.
Bhattacharya, P. C. and Sivasubramanian M. N. (2003), “Financial Development and Economic Growth in India: 1970-1971 to 1998-1999”, Applied Financial Economics, Vol. 13 No. 1, pp. 925–92.
Bihari, S. C. (2011), “Growth through financial inclusion in India”, Journal of International Business Ethics, Vol. 4 No. 1.
Bongomin J., Ntayi, J. and Munene, J. (2016),”Institutional frames for financial inclusion of poor households in Sub-Saharan Africa”, International Journal of Social Economics, Vol. 43 No. 11 pp. 1096 - 1114
Calderón, C. and Liu, L. (2003), “The direction of causality between financial development and economic growth”, Journal of development economics, Vol. 72 No. 1, pp. 321-334.
Carosso, V. P. (1970), Investment banking in America: A history, Harvard University Press, MA, USA.
Chakravarty, S. R., and Pal, R. (2010), “Measuring Financial Inclusion: An Axiomatic Approach”, available at http://www.eaber.org/sites/default/files/documents/IGIDR_Chakravarty_2010.pdf (accessed on January 2, 2017).
Chattopadhyay, S. K. (2011), “Financial Inclusion in India: A case-study of West Bengal”, working paper no. WPSDEPR: 8/2011, Reserve Bank of India, Mumbai.
Chow, W. W. and Fung, M. K. (2013), “Financial development and growth: A clustering and causality analysis”, The Journal of International Trade & Economic Development, Vol. 22 No. 3, pp. 430-453.
Chuah, H. and Thai, W. (2004), “Financial development and economic growth: Evidence from causality tests for the GCC countries”, working paper, International Monetary Fund, Washington, D.C.
Conrad, A., Neuberger, D., and Schneider-Reißig, M. (2009), “Geographic and demographic Bank outreach: Evidence from Germany’s three-pillar banking system”, Kredit und Kapital, Vol. 42 No. 3, pp. 377-411.
CRISIL (2013), “CRISIL Inclusix: An index to measure India’s progress on financial inclusion”, CRISIL, Mumbai.
Dacanay, J.C., Nito, B. and Buensuceso, P. (2011), “Microfinance, Financial Inclusion and Financial Development: An Empirical Investigation with an International Perspective”, available at https://www.researchgate.net/profile/Jovi_Dacanay2/publication/216506808_Microfinance_Financial_Inclusion_and_Financial_Development_An_Empirical_Investigation_with_an_International_Perspective (accessed 12 September 2016).
Darrat, A. F. (1999), “Are financial deepening and economic growth causally related? Another look at the evidence”, International Economic Journal, Vol. 13, No. 3, pp. 19-35.
Debreu, G. (1959), Theory of value, Wiley, New York. Demirgüç-Kunt, A., and Klapper, L. F. (2012), Measuring financial inclusion: The global findex
database, World Bank, Washington, D.C.Demetriades, P. O. and Hussein, K. A. (1996), “Does financial development cause economic
growth? Time-series evidence from 16 countries”, Journal of development Economics, Vol. 51, No. 2, pp. 387-411.
Engle, R.F. and Granger, C.W.J. (1987), “Cointegration and Error Correction: Representation,Estimation and Testing”, Econometrica, Vol. 55, No.2, pp. 251-276.
Dynamics Between Bank-Led Financial Inclusion and Economic Growth in Emerging Economies 117
Gupte, R., Venkataramani, B., & Gupta, D. (2012), “Computation of financial inclusion index for India”, Procedia-Social and Behavioral Sciences, Vol. 37, pp. 133-149.
Gurgul, H. and Lach, L. (2012), “Financial Development and Economic Growth in Poland in Transition: Causality Analysis”, Czech Journal of Economics and Finance, Vol. 62 No. 4, pp. 347-367.
Gurley, J. G. and Shaw, E. S. (1955), “Financial aspects of economic development”, The American Economic Review, Vol. 45 No. 4, pp. 515-538.
Heston, A. (1994), “A brief review of some problems in using National Accounts Data in level of output comparisons and growth studies”, Journal of Development Economics, Vol. 44 No. 1, pp. 29–52.
Honohan, P. (2008), “Cross-country variation in household access to financial services.” Journal of Banking & Finance, Vol. 32 No. 11, pp. 2493-2500.
IMF (2015), Financial Access Survey, IMF, Washington DC, available at http://data.imf.org/?sk=E5DCAB7E-A5CA-4892-A6EA-598B5463A34C (accessed December 25, 2015)
IMF (2017), World economic outlook, IMF, Washington DC, available at https://www.imf.org/external/pubs/ft/weo/2017/update/01/ (accessed on March 1, 2017)
Jain, S. (2012), “Why So Few Indians Have Bank Account”, The Wall Street Journal. November 1, 2012, available at http://blogs.wsj.com/indiarealtime/2012/11/01/why-few-indians-have-bank-accounts/ (accessed 12 September 2016).
Jalil, A. and Feridun, M. (2011), “Impact of financial development on economic growth: empirical evidence from Pakistan”, Journal of the Asia Pacific Economy, Vol. 16, No. 1, pp. 71-80.
Jung, W. S. (1986), “Financial development and economic growth: international evidence”, Economic Development and Cultural Change, Vol. 34 No. 2, pp. 333-346.
Kempson, E., Atkinson, A. and Pilley, O., 2004. “Policy level response to financial exclusion in developed economies: lessons for developing countries”, World Bank, Washington, D.C.
King, R. G. and Levine, R. (1993), “Finance and growth: Schumpeter might be right, The quarterly journal of economics”, Vol. 108 No. 3, pp. 717-737.
Kodan, A.S. and Chhikara, K.S. (2011), “Status of financial inclusion in Haryana: An evidence of commercial banks”, Management and Labour Studies, Vol. 36 No. 3, pp. 247–267.
Kodan, A. and. Chhikara, K. (2013), “A Theoretical and Quantitative Analysis of Financial Inclusion and Economic Growth”, Management and Labour Studies Vol. 38, No. 1-2 pp. 103-133.
Kumar, C. and Mishra, S. (2011), “Banking outreach and household level access: analyzing financial inclusion in India” paper presented at the 13th Annual Conference on Money and Finance in the Indian Economy, 25-26 February, 2011, available at http://www.igidr.ac.in/conf/money/mfc13/Banking%20Outreach%20and%20Household%20level%20Access.pdf (accessed 21 February 2017).
Kumar, N. (2013), “Financial inclusion and its determinants: evidence from India”, Journal of Financial Economic Policy, Vol. 5 No. 1, pp. 4-19..
Kuri, P.K. (2010), “Inclusive and Exclusive Development in India in the Post-reform Era”, The Politics of Social Exclusion in India: Democracy at the Crossroads, Routledge Publication, London and New York, pp. 86-100.
Kuri, P. K. and Laha, D. (2011), “Financial inclusion and human development in India: An inter-state analysis”, Indian Journal of Human Development, Vol.5 No. 1, pp. 61-77
Laha, A. and Kuri, P. K. (2014), “Demand for and supply of financial inclusion in India: An inter-state analysis”, ELK Asia Pacific Journal of Finance and Risk Management, Vol. 5 No. 1, pp. 1-18.
Levine, R. (1997), “Financial development and economic growth: views and agenda”, Journal of economic literature, Vol. 35 No. 2, pp. 688-726.
118 K. Nanda
Lucas, R. E. (1988), “On the mechanics of economic development”, Journal of monetary economics, Vol. 22 No. 1, pp. 3-42.
Mehar, L. (2014), “Financial inclusion in India”, Innovative Journal of Business Management, Vol. 3 No. 4, pp. 42-46.
Mehrotra, N., Puhazhendhi, V., Nair, G., and Sahoo, B. (2009), “Financial inclusion-an Overview, working paper no. 48)”, National Bank for Agriculture and Rural Development (NABARD), Mumbai.
Nair, T.S. and Tankha, A. (2015), Inclusive Finance India Report 2014. New Delhi: Oxford University Press.
Nanda, K. and Kaur, M., (2016), “Financial Inclusion and Human Development: A Cross-country Evidence”, Management and Labour Studies, Vol. 41, No. 2, pp.127-153.
Nyasha, S. and Odhiambo, N. M. (2015), “The Impact of Banks and Stock Market Development on Economic Growth in South Africa: an ARDL-bounds Testing Approach”, Contemporary Economics, Vol. 9 No.1, pp. 93-108.
Odhiambo, N. M. (2008), “Financial depth, savings and economic growth in Kenya: a dynamic causal linkage”, Economic Modeling, Vol. 25 No. 4, pp. 704-713.
Odhiambo, N. M. (2009), “Interest rate reforms, financial deepening and economic growth in Kenya: an empirical investigation,” The Journal of Developing Areas, Vol. 43 No. 1, pp. 295-313.
Pal, R. and Pal, R. (2013), “Income related inequality in financial inclusion and role of banks: Evidence on financial exclusion in India”, working paper No. 2012-013, Indira Gandhi Institute of Development Research, Mumbai, India.
Park, C. Y., and Mercado Jr, R. V. (2015), “Financial Inclusion, Poverty, and Income Inequality in Developing Asia”, available at http://econpapers.repec.org/RePEc:ris:adbewp:0426 (accessed on January 2, 2017).
Patrick, H. T. (1966), “Financial development and economic growth in underdeveloped countries”, Economic development and Cultural change, Vol. 14 No. 2, pp. 174-189.
Pesaran, M.H. (1997), “The role of economic theory in modeling the long run”, The Economic Journal, Vol. 107, No. 440, pp. 178-191.
Pesaran, M.H., Shin, Y. and Smith, R.P. (1999), “Pooled mean group estimation of dynamic heterogeneous panels”, Journal of the American Statistical Association, Vol. 94 No. 446, pp.621-634.
Prusty,R., Tanna, J. J., Desai, M., and Bansal, D. (2011), “Financial inclusion in India: An inter-state analysis”, Shodhdrishti,Vol. 2, No. 3, pp. 30-42.
Rahman, Z. A. (2015), “Financial inclusion in Malaysia: tracking progress using index”, available at https://ideas.repec.org/h/bis/bisifc/38-24.html (accessed on February 1, 2017).
RBI (1995), “Basic statistical returns of scheduled commercial banks (1994-95)”. Reserve Bank of India, Mumbai.
RBI (1995), “Handbook of statistics of Indian economy (1994-95)”. Reserve Bank of India, Mumbai. RBI (2005), “Basic statistical returns of scheduled commercial banks (2004-05)”. Reserve Bank of
India, Mumbai.RBI (2005), “Handbook of statistics of Indian economy (2004-05)”. Reserve Bank of India, Mumbai.RBI (2008), “Report of the Committee on Financial Inclusion”, available at www.nabard.org/
report_comfinancial.asp (accessed 12 September 2016).RBI (2014), “Basic statistical returns of scheduled commercial banks (2013-14)”. Reserve Bank of
India, Mumbai.RBI (2014), “Handbook of statistics of Indian economy (2013-14)”. Reserve Bank of India, Mumbai.Robinson, J. (1952), “The Generalization of the General Theory,” in The Rate of Interest and Other
Essays, Macmillan, London, pp. 67-142.
Dynamics Between Bank-Led Financial Inclusion and Economic Growth in Emerging Economies 119
Roubini, N. and Sala-i-Martin, X. (1992), “Financial repression and economic growth”, Journal of Development Economics, Vol. 39 No.1, pp. 5–30.
Rousseau, P. L. and Wachtel, P. (1998), “Financial intermediation and economic performance: historical evidence from five industrialized countries”, Journal of Money, Credit, and Banking,Vol. 30 No.1, pp. 657–78.
Sarma, M. (2008), “Index of financial inclusion”, working paper no. 215, Indian Council for Research on International Economics Relations, New Delhi.
Sarma (2010), “Index of financial Inclusion”, discussion paper, Centre for International Trade and Development, Jawaharlal Nehru University, New Delhi.
Sarma, M. (2012), “Index of financial inclusion - A Measure of financial sector inclusiveness “, working paper no. 07/2012, Centre for International Trade and Development, New Delhi.
Sarma, M. and Pais, J. (2011), “Financial inclusion and development”, Journal of International Development, Vol. 23 No. 5, pp. 613-628.
Schumpeter, J.A. (1911), The Theory of Economic Development, Transaction Publishers.Shan, J. (2005), “Does financial development ‘lead ‘economic growth? A vector auto-regression
appraisal, Applied Economics”, Vol. 37, No. 12, pp. 1353-1367.Shan, J. Z., Morris, A. G. and Sun, F. (2001), “Financial Development and Economic Growth:
An Egg-and-Chicken Problem?”, Review of International Economics, Vol. 9 No. 3, pp. 443-454.Sharma, D., (2016), “Nexus between financial inclusion and economic growth: Evidence from the
emerging Indian economy”, Journal of Financial Economic Policy, Vol. 8 No.1, pp.13-36.Singh, T. (2008), “Financial development and economic growth nexus: a time-series evidence from
India”, Applied economics, Vol. 40 No. 12, pp. 1615-1627.Singh, T. (2014), “Financial development and economic growth nexus: a time-series evidence from
India”, Applied Economics, Vol. 40 No. 12, pp. 1615-1627.Ssekuma, R. (2011), “A study of Co-integration Models with Applications”, working paper,
University of South Africa, South Africa.Stern, N. (1989), “The economics of development: a survey”, Economic Journal, Vol. 9 No. 1, pp.
597-685.Teng, J. and Liang, Q. (2010), “Reassessment of the finance-growth nexus in the presence of
structural breaks.” Applied Economics, Vol. 42 No. 8, pp. 977-988.UNDP (2006), Human Development Report. UNDP, available at hdr.undp.org/en/content/human-
development-report (accessed 15 October, 2016).United Nations. (2006), “Building inclusive financial sectors for development”, working paper,
United Nations, New York.Utkulu, U (2012), “How to estimate long-run relationships in economics, an overview of recent
developments, available at www. kisi.deu.edu.tr/utku.utkulu/dosyalar/How_to_estimate. DOC (accessed 15 October, 2016).
World Bank (2008), “Finance for all? Policies and pitfalls in expanding access”, working paper, Washington, D.C.
Yadav, P. and Sharma, A. (2010), “Financial inclusion in India: an application of TOPSIS” Humanomics, Vol. 32 No. 3, pp. 328-351.
Yusupov, G., Duan, W. and Larsson, K. (2010), “Long Run Relationships between Base Metals, Gold and Oil”, record series 162447, Lund University , Sweden, available at http://lup.lub.lu.se/student-papers/record/1624477 (accessed 15 October, 2016).
120 K. Nanda
Annexure IIFI Computation
The index of financial inclusion has been computed using three dimensions of an inclusive financial system, viz., Banking Penetration (d1), Availability of Banking Services (d2) and Usage of Banking Services (d3). The selection of the dimensions and the variables has been motivated by two factors: their usage in recent literature (Sarma, 2008; Sarma, 2010; Chattopadhyay, 2011; Bihari, 2011; Prusty et al. 2011; Sarma and Pais, 2011; CRISIL, 2013, Nanda and Kaur, 2016 etc) and availability of data in the case of India. IMF’s Financial Access Survey (FAS) presents data for about 189 countries for an eleven year time period (2004-2015) on the indicators of financial access/inclusion. The indicators of financial access (inclusion) as proposed by IMF include commercial bank branch penetration (deposit and loan accounts per 1000 adults); availability of bank branches (per 1000 km2 and per 1000 adults) and usage (volume of outstanding loan and deposits as a fraction of GDP). Other indicators include the number and volume of mobile money transactions. The dimensions of financial inclusion in the context of the states of India, for the present study, have been based on the indicators proposed in the FAS for countries. However, for the states of India, consistent data are not available for ATM penetration and mobile money transactions. As far as dimension weights are concerned, all dimensions were considered equally important for the inclusiveness of a financial system. However, the data for certain indicators that completely characterize the second and third dimension of financial inclusion (ATM availability, usage of mobile and internet banking, usage of other financial services, viz., payments, transfers etc. ) were not available in the context of Indian states, therefore, weight ‘0.5’ was assigned to the second and third dimensions. The same are also based on the dimension weights used in the literature (Sarma, 2012; CRISIL, 2013, Nanda and Kaur, 2016).
Annexure II State-Wise Index of Financial Inclusion (IFI) for Select Years