32
Local Employment Dynamics (LED) & OnTheMap Nick Beleiciks Oregon Census State Data Center Meeting April 14, 2009
| Date post: | 29-Dec-2015 |
| Category: |
Documents |
| Upload: | trevor-price |
| View: | 214 times |
| Download: | 0 times |

Local Employment Dynamics (LED)&
OnTheMap
Nick BeleiciksOregon Census State Data Center MeetingApril 14, 2009

• Longitudinal Employer-Household Dynamics (LEHD)• Program within the U.S. Census Bureau
• Local Employment Dynamics (LED)• Partnership between the states and Census• Creates new information about the labor market
• Low cost• No additional respondent burden• Protects confidentiality
What is LED?

• “A Census – State Partnership”
The folks at LEHD
• “Sexy”
OnTheMap user during a Webinar
• “LED is a thousand answers looking for a thousand questions”
Tom Tveidt of SYNEVA Economics LLC
How To Describe LED?

http://lehd.did.census.gov/led/

• Quarterly Workforce Indicators (QWI)• 30 Indicators
• QWI Online• 8 Indicators – Easy to access and use
• OnTheMap• Maps and much more!
• Industry Focus• Ranks industries by the 8 Indicators
• Older Worker Profiles• “Old” data
The Products…

• States provide quarterly administrative data• Employer locations, number of employees, payroll
• Quarterly Census of Employment and Wages (QCEW)
• Individual earnings and employers• Unemployment Insurance “Wage File”
• LEHD matches state employment data with demographic (age & gender) and residency information about individual workers• Social Security Administration records
How It Works…

Who’s Involved?

• Workers covered under Oregon’s Unemployment Insurance (UI) program• About 1.7 million
• Who is not covered?• Federal employees• Railroad workers• Some agricultural workers• Student workers
What Workers Are Included In LED?
• LED maintains confidentiality about workers and employers
• They “fuzz” some data to ensure confidentiality
• Unsure how the folks at LEHD do this
• This leads to some hesitation for some new users
• Fuzz information available for QWI
The FUZZ(data police)

• Available from the Cornell VirtualRDC websitehttp://www.vrdc.cornell.edu/news/
• 30 employment and earnings indicators• Year – Oregon goes back to 1991• Quarter – Partial information for 2q2008• Gender – male, female, or both• Age – 14-99, 14-18, 19-21, 22-24, 25-34, 35-44,
45-54, 55-64, 65-99• Geography – County and Metro and Micro Areas• Industry – 4-digit NAICS level
Quarterly Workforce Indicators (QWI)

Types of Fuzz Codes
-2 No employers operate in this category during this quarter
-1 Required historical of future wage record data are not available
0 No employment in this age, sex category
1 The value is not significantly affect by the disclosure protections
5 This value has been suppressed because it does not meet Census Bureau publication standards
9 The value has been significantly distorted to protect confidentiality

Quarterly Workforce Indicators (QWI) Example
Number of Average AverageNew Monthly Monthly Turnover
Industry Hires Earnings Earnings Rate
Health care and social assistance 14,575 $2,078 $3,393 7%Ambulatory health care services 4,445 $2,658 $4,341 7%Nursing and residential care facilities 4,074 $1,599 $2,009 12%Social assistance 3,755 $1,261 $2,037 9%Hospitals 2,301 $3,216 $4,264 4%
All Industries 117,432 $1,921 $3,454 9%
Source: U.S. Census Bureau, Local Employment Dynamics
Stable New Hires All Workers
New Hires in Oregon's Health Care IndustriesFirst Quarter 2008

QWI Online• 8 Employment Indicators:
• Available for same groups as regular QWI• Easy to use online tool at LEHD Website:
http://lehd.did.census.gov/led/datatools/qwiapp.html
Total Employment
Net Job Flows Job Creation New Hires
Separations TurnoverAvg Monthly Earnings
Avg New Hire Earnings

QWI OnlineExample
Industry65 and Over
Jobs
Share of65 and Over
Jobs65 and Over
New Hires
Share of65 and Over
New Hires
65 and OverNew Hire
Rate*
All Industries 58,557 100% 5,809 100% 2.6%
Education and Health Services 12,714 22% 820 14% 2.5%Retail Trade 7,267 12% 447 8% 1.7%Professional and Business Services 6,883 12% 987 17% 2.2%Leisure and Hospitality 6,042 10% 848 15% 2.2%Manufacturing 4,966 8% 301 5% 1.9%Other Services 3,450 6% 283 5% 3.1%Financial Activities 3,384 6% 271 5% 2.9%Natural Resources and Mining 3,047 5% 834 14% 9.0%Construction 2,830 5% 434 7% 2.8%Wholesale Trade 2,596 4% 210 4% 2.7%Transportation, Warehousing, and Utilities 2,520 4% 180 3% 3.0%State and Local Government 2,120 4% 102 2% 2.6%Information 733 1% 77 1% 1.6%
* New hires 65 and over divided by new hires of all ages.Source: U.S. Census Bureau, Local Employment Dynamics
Jobs and New Hires for Workers 65 and Over by IndustryOregon - First Quarter 2008

• Adds GIS capability to LED data• Fewer indicators – more geographic detail
• Years – 2002 – 2006• Quarter – 2nd Quarter only• Age – 30 or younger, 31 to 54, 55 or older• Wages – < $1,200, $1,201 to $3,400, > $3,400• Geography – Down to Census Block Groups• Industry – 2-digit NAICS level• Industry Groups
• Goods producing• Trade, transportation and utilities• Other services
OnTheMap – Version 3

OnTheMap – Version 3Example (1 of 4)
Job counts in Counties Where Workers LiveTotal Primary Jobs
Count ShareCount Share Multnomah Co., Oregon 2,010 54.1%
Total Primary Jobs 3,716 100.0% Washington Co., Oregon 813 21.9%Clackamas Co., Oregon 406 10.9%
Job counts in Cities/Towns Where Workers Live Clark Co., Washington 224 6.0%Marion Co., Oregon 61 1.6%
Count Share Lane Co., Oregon 32 0.9%Portland, Oregon 1,825 49.1% Columbia Co., Oregon 24 0.6%Beaverton, Oregon 241 6.5% Yamhill Co., Oregon 19 0.5%Gresham, Oregon 115 3.1% Polk Co., Oregon 18 0.5%Lake Oswego, Oregon 106 2.9% Linn Co., Oregon 17 0.5%Vancouver, Washington 102 2.7% All Other Locations 92 2.5%Hillsboro, Oregon 93 2.5%Tigard, Oregon 61 1.6% Job counts in States Where Workers LiveAloha, Oregon 50 1.3%Salem, Oregon 42 1.1% Count ShareWest Linn, Oregon 38 1.0% Oregon 3,474 93.5%All Other Locations 1,043 28.1% Washington 238 6.4%
California 2 0.1%Iowa 1 0.0%Idaho 1 0.0%All Other Locations 0 0.0%
PSU Area Labor Shed Analysis
2006
2006
2006
2006

OnTheMap – Version 3

OnTheMap – Version 3Example (2 of 4)
Jobs by Industry Type (2-digit NAICS)Total Primary Jobs
Count ShareCount Share Agriculture, Forestry, Fishing and Hunting 0 0.0%
Total Primary Jobs 3,716 100.0% Mining, Quarrying, and Oil and Gas Extraction 0 0.0%Utilities 0 0.0%
Jobs by Worker Age Construction 0 0.0%Manufacturing 11 0.3%
Count Share Wholesale Trade 3 0.1%Age 30 or younger 589 15.9% Retail Trade 69 1.9%Age 31 to 54 2,225 59.9% Transportation and Warehousing 0 0.0%Age 55 or older 902 24.3% Information 7 0.2%
Finance and Insurance 8 0.2%Jobs by Earnings Paid Real Estate and Rental and Leasing 6 0.2%
Professional, Scientific, and Technical Services 9 0.2%Count Share Management of Companies and Enterprises 0 0.0%
$1,200 per month or less 600 16.1% Administration & Support, Waste Management 282 7.6%$1,201 to $3,400 per month 1,517 40.8% Educational Services 3,006 80.9%More than $3,400 per month 1,599 43.0% Health Care and Social Assistance 6 0.2%
Arts, Entertainment, and Recreation 0 0.0%Accommodation and Food Services 168 4.5%Other Services (excluding Public Administration) 19 0.5%Public Administration 122 3.3%
2006
PSU Area Work Area Profile Analysis
2006
2006
2006

OnTheMap – Version 3Example (3 of 4)
Job counts in Counties Where Workers are EmployedTotal Primary Jobs
Count ShareCount Share Multnomah Co., Oregon 271 65.9%
Total Primary Jobs 411 100.0% Washington Co., Oregon 82 20.0%Clackamas Co., Oregon 26 6.3%
Job counts in Cities/Towns Where Workers are Employed Marion Co., Oregon 8 1.9%Lane Co., Oregon 4 1.0%
Count Share King Co., Washington 4 1.0%Portland, Oregon 256 62.3% Columbia Co., Oregon 3 0.7%Hillsboro, Oregon 25 6.1% Yamhill Co., Oregon 2 0.5%Beaverton, Oregon 21 5.1% Deschutes Co., Oregon 2 0.5%Gresham, Oregon 14 3.4% Whatcom Co., Washington 1 0.2%Tigard, Oregon 13 3.2% All Other Locations 8 1.9%Tualatin, Oregon 8 1.9%Salem, Oregon 7 1.7% Job counts in States Where Workers are EmployedOregon City, Oregon 6 1.5%Lake Oswego, Oregon 6 1.5% Count ShareEugene, Oregon 4 1.0% Oregon 403 98.1%All Other Locations 51 12.4% Washington 7 1.7%
California 1 0.2%All Other Locations 0 0.0%
PSU Area Commute Shed Analysis
2006
2006
2006
2006

OnTheMap – Version 3

OnTheMap – Version 3Example (4 of 4)
Jobs by Industry Type (2-digit NAICS)Total Primary Jobs
Count ShareCount Share Agriculture, Forestry, Fishing and Hunting 4 1.0%
Total Primary Jobs 411 100.0% Mining, Quarrying, and Oil and Gas Extraction 1 0.2%Utilities 1 0.2%
Jobs by Worker Age Construction 8 1.9%Manufacturing 24 5.8%
Count Share Wholesale Trade 12 2.9%Age 30 or younger 207 50.4% Retail Trade 44 10.7%Age 31 to 54 166 40.4% Transportation and Warehousing 6 1.5%Age 55 or older 38 9.2% Information 19 4.6%
Finance and Insurance 33 8.0%Jobs by Earnings Paid Real Estate and Rental and Leasing 9 2.2%
Professional, Scientific, and Technical Services 23 5.6%Count Share Management of Companies and Enterprises 11 2.7%
$1,200 per month or less 142 34.5% Administration & Support, Waste Management 35 8.5%$1,201 to $3,400 per month 158 38.4% Educational Services 37 9.0%More than $3,400 per month 111 27.0% Health Care and Social Assistance 35 8.5%
Arts, Entertainment, and Recreation 9 2.2%Accommodation and Food Services 56 13.6%Other Services (excluding Public Administration) 13 3.2%Public Administration 31 7.5%
PSU Area Home Area Profile Analysis
2006
20062006
2006

• Natural disasters – tornados, floods, etc.• Employment impact• Estimate unemployment insurance payouts
• Commute patterns
• Economic development
• Housing studies• Affordable housing
Other Uses of OnTheMap

• Quick way to look at QWI indicators by industry
• Ranks industries by any of the 8 QWI Indicators
• Uses a four quarter average
Industry Focus

Industry FocusExample
Oregon Industries With Largest Percent of Employees 65 and Older
0% 2% 4% 6% 8% 10% 12%
All Oregon Industries
Performing Arts, Sports, and Related Industries
Accommodation
Scenic and Sightseeing Transportation
Religious and Membership Organizations
Support Activities for Agriculture and Forestry
Transit and Ground Passenger Transportation
Real Estate
Animal Production
Crop Production
Private Households
Percent of EmploymentSource: U.S. Census Bureau, Local Employment Dynamics

• LEHD produces this series of reports for 30 states
• The Geographic Distribution and Characteristics of Older Workers: 2004
• The data is “old” – 2004 when we now have 2007
• “Easily” replicable
Older Worker Profiles

Older Worker ProfilesPortion of County Workforce Age 55 and Older
2007 Census LEHD data
15.0% to 18.0%18.1% to 21.1%21.2% to 24.2%33.5%

Average Monthly EarningsAge 55 and Older
Industry Average EarningsFinancial Activities 5,255$ Professional and Business Services 4,506Information 4,372Construction 4,250Manufacturing 4,191Natural Resources and Mining 3,823Government 3,712Educational and Health Services 3,435Trade, Transportation, and Utilities 3,328Other Services 2,136Leisure and Hospitality 1,906

Average Monthly Earnings of Workers 55 and Older, by Industry
• Metropolitan Areas• Highest-paying: Financial Activities ($4,821)• Lowest-paying: Leisure and Hospitality ($1,723)
• Non-Metropolitan Areas• Highest-paying: Resources and Mining ($4,293)• Lowest-paying: Leisure and Hospitality ($1,492)
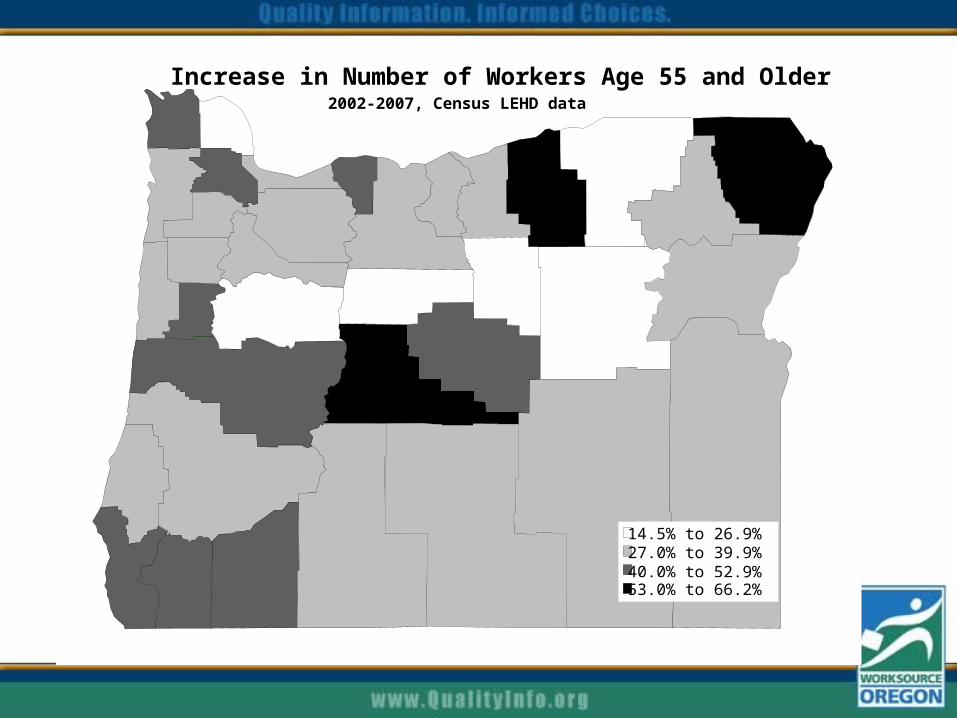
MAP: Increase in number of older workers, 2002-2007
Increase in Number of Workers Age 55 and Older2002-2007, Census LEHD data
14.5% to 26.9%27.0% to 39.9%40.0% to 52.9%53.0% to 66.2%

• Not much – yet• Are Baby Boomers retiring?
• Previous recession:• Stable separations went down while stable
hires went up• Largest drop off was in workers 55-64• Youth employment came back for girls
after recession, but not for boys
What Can LED Tell Us About the Recession?

Thank you for your time.
Questions or comments?
(541) 947-1267


