The Dynamics of Mahakam Delta - Indonesia, Based on Spatial and Temporal Variations of Grab Samples, Cores, and Salinity*
Andang Bachtiar1, Joko Wiyono1, Liyanto2, Mohammad Syaiful1, Yudi Satria Purnama1, Muhammad Rozalli2, Andi Krisyunianto2,
and A.S. Purnama2
Search and Discovery Article #50363 (2010)
Posted December 17, 2010
*Adapted from oral presentation at AAPG International Conference and Exhibition, September 12-15, 2010 1PT Exploration Think Tank Indonesia (ETTI), Jakarta, Indonesia ([email protected]) 2Geosciences Delta Andalan (GSA) Consulting, Jakarta, Indonesia
Abstract During years 2005-2009, observations on modern sediment of Mahakam Delta in the southern and the northern lobes were conducted using grab samples on the river bed in conjunction with echo sounding, shallow core sampling, and salinity measurements. The delta environments observed were head of passes, upper delta plain, lower delta plain, and delta front. The purpose was to try to develop analogues, as detailed as possible, for the Miocene/Pliocene deltas being explored and exploited in the area. Decreasing grain size on the river bed from the head of passes to delta front was observed in the northern lobe. Similar pattern, however, was not apparent in the southern lobe, where there was a distinct anomaly of coarser grain size from lower delta plain to delta front area. This indicates by-pass sedimentation or effect of relics of submerged previous lower delta delta plain sands which are now being transgressed. Most of the thalweg areas in the channels were devoid of sands; instead, grab samples usually found semi-consolidated clay. Active sand transportation and deposition locus were the slopes of the point bars and side bars. Shallow cores in the lower delta plain were generally characterized by clay drapes, both in the northern and the southern lobes, suggesting tidal processes were operational in almost the same intensity in both areas. Salinity measurements in the water and sediments both showed an increasing trend from upstream to downstream, with the northern lobe being more intruded by the seawater profiles. Variations of salinity with times were also observed to be controlled by tidal-activity periods. The implications of these new observations to the subsurface mapping of the Miocene/Pliocene delta are very interesting ones. Updip shale-out trap of delta front mouth-bar sands maybe worth pursuing, as well as a new model of fluvial sands, in contrast to delta plain sand geometry with respect to clay-plugs and edge-of-channel. Tidal-effect reservoir models may also be revisited in the context of lobe relative positions and formation-water salinity.
Alllen, G.P., 1991, Sedimentary processes and facies in the Gironde estuary; a Recent model for macrotidal estuarine systems; in Tidal Clastic Sedimentology; Rahmani, R. A. et al, editors, Can. Soc. Petroleum Geol. Memoir 16. Allen, G.P., 1989, Les deltas et les basins deltaiques, in Dynamique et Methodes d'Etudes des Bassins Sedimentaires, Association des Sedimentologistes Francais, Editions Technip, Paris, France, p. 383-421. Allen, G.P., and Chambers, J.L.C., 1996, Sedimentation in the Modern and Miocene Mahakam Delta, IPA Field Guide. Allen, G.P., and J.L.C. Chambers, 1998, Sedimentation in the modern and Miocene Mahakam delta: Indonesian Petroleum Association, 236 p. Allen, G.P., and F. Mercier, 1994, Reservoir facies and geometry in mixed tide and fluvial-dominated delta mouth bars: example from the modern Mahakam delta (East Kalimantan), Proc. Indonesian Petroleum Association, Twenty Third Annual Convention, October, 1994. Allen, G.P., and F. Mercier, 1988; Subsurface sedimentology of deltaic systems; Journal of the Petroleum Exploration Society of Australia, Adelaide, Australia, p. 30-46. Duval, B.C., G. Choppin de Janvry, and B. Loiret, 1992, The Mahakam Delta province: An ever-changing picture and a bright future: Proceedings of the 1992 Offshore Technology Conference, Houston Texas, USA, May 4-7.Duval et al. 1992. Moss, S.J. and J.L.C. Chambers, 1999. Tertiary facies architecture in the Kutei Basin, Kalimantan, Indonesia: Journal of Asian Earth Sciences, v. 17 (1999), p. 157-181. Moss, S.J., J. Chambers, I. Cloke, A. Carter, D. Staria, J.R. Ali, and S. Baker, 1997, New observations on the sedimentary and tectonic evolution of the Tertiary Kutai Basin, East Kalimantan, in A. Fraser, S. Matthews, and R.W. Murphy, eds., Petroleum geology of southeast Asia: Geological Society (London) Special Publication 106, p. 395 417.
GDA ConsultingGDA Consulting
The Dynamics of Mahakam Delta Components Based on Spatial and Temporal Variations of
Grab Samples, Cores, and Salinity
By :
Andang Bachtiar (1), Joko Wiyono(1), Liyanto (2), Mohammad Syaiful (1), Yudi Satria Purnama (1), Muhammad Rozalli (2) ,
Andi Krisyunianto (2), Purnama A S (2)(1) ETTI , (2) GDA Consulting
See notes following
1
Presenter’s Notes: I present a sedimentological study of a modern delta depositional system based on periodic sampling both in different components of delta morphology; namely, fluvial, delta plain, and delta front areas. Mahakam Delta is a very famous delta in Indonesia which has been receiving much attention from sedimentology researchers and has been used widely as an analogue for delta depositional model in the region. The number of co-authors here reflects the complexity of the field study operation and technical challenges that require expert management by good team of researchers.
Introduction
Methods
Results Conclusions
Content
Presenter’s Notes: First, I introduce the Mahakam Delta, both geologically and specifically sedimentologically.Then, I will briefly discuss the methodology that we used in conducting the field sedimentological study.A rather lengthy description of the results will follow.Finally I conclude the presentation with several statements regarding this continuing study
2
INTRODUCTION
KUTAI BASIN HOSTING
THE MAHAKAM DELTA
Mahakam Delta is located in the island of Kalimantan (Borneo), Indonesia
The tectonic setting is in the junction of three (3) major plates (Eurasia –Indian Australian – Pacific)
It is contained in the Kutai Basin of Kalimantan
Presenter’s Notes: Mahakam Delta is located in Kalimantan or Borneo, the second largest island in Indonesia.The tectonic setting is at the junction of 3 major plates, Eurasia with Sunda Microplate to the north and northwest, the Indian-Australian plate to the southwest, south and southeast, and the Pacific plate to the east.The delta is in the Kutai sedimentary Basin.
3
Balikpapan
Samarinda
South China Sea
Java Sea
Celebes Sea
N
KUCHING OROGENICCOMPLEX
KUTAI BASINMahakam Delta
KUTAI BASIN:Indonesia’s 2nd most hydrocarbon prolific basin
with its own, unique Mahakam
Delta
Presenter’s Notes: Kutai Basin is the second most hydrocarbon prolific basin in Indonesia, after the Central Sumatra Basin. It holds at least 11 Billion Barrels of Oil equivalent recoverable reserves, most concentrated in and around the Mahakam Delta area. From its surface morphology it is quite clear that the modern Mahakam Delta is a mixed fluvial-tidal delta.
4
INTRODUCTION
MAHAKAM DELTA IS LOCATED ON THE
DEPOCENTER OF KUTAI BASIN WHICH PILED UP TO
14 KM SEDIMENT ABOVE TRANSITIONAL /
ACCRETED BASEMENT
Presenter’s Notes: Kutai Basin, which hosts the Mahakam River delta, is a Tertiary Indonesian basin known to have thickest sediment accumulation. A total thickness of 14 km is interpreted at its depocenter. The deepest onshore well drilled in this delta area reached TD of 16,800 feet (+/- 5.1 km), and still in middle Miocene section; it did not reach the Oligocene or syn-rift Eocene section.
5
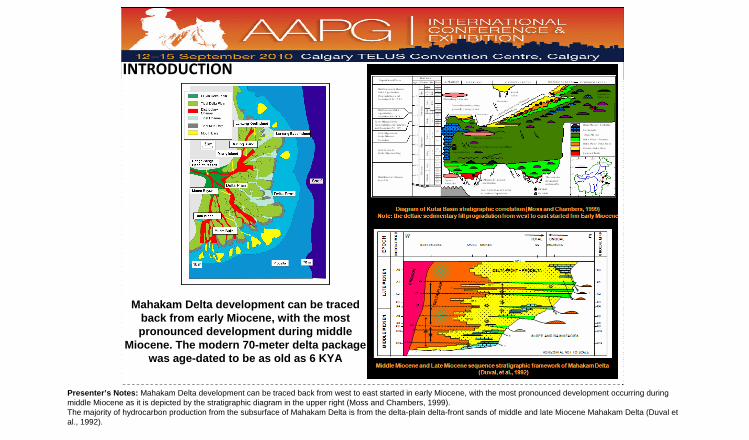
INTRODUCTION
Mahakam Delta development can be traced back from early Miocene, with the most pronounced development during middle
Miocene. The modern 70-meter delta package was age-dated to be as old as 6 KYA
Presenter’s Notes: Mahakam Delta development can be traced back from west to east started in early Miocene, with the most pronounced development occurring during middle Miocene as it is depicted by the stratigraphic diagram in the upper right (Moss and Chambers, 1999).The majority of hydrocarbon production from the subsurface of Mahakam Delta is from the delta-plain delta-front sands of middle and late Miocene Mahakam Delta (Duval et al., 1992).
6
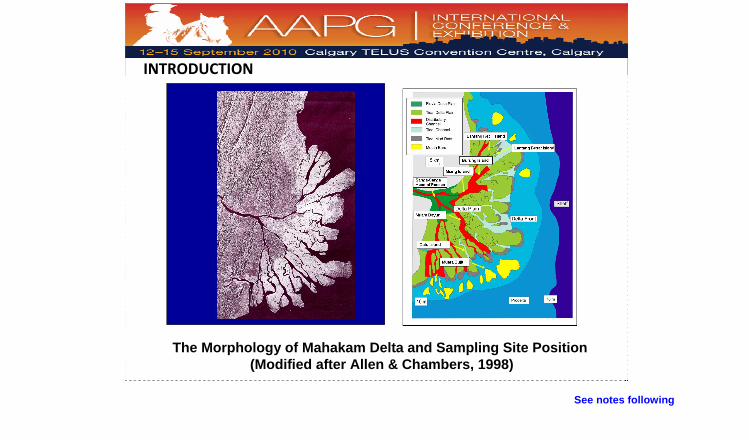
The Morphology of Mahakam Delta and Sampling Site Position (Modified after Allen & Chambers, 1998)
INTRODUCTION
See notes following
7
Presenter’s Notes: The surface morphology of Mahakam River and Delta captured by satellite image (left) indicates that the river (and delta) was in existence long before the latest structural development of the onshore area. The river cuts across the structures downstream from Samarinda area. The satelite image, however, does not suggest the state of lobe activity of the several lobes developed in the delta The map on the right depicts the development of mouth-bar sands (yellow colored) in front of distributary channels; it becomes apparent that the southern lobes are more active than the northern ones, as indicated by the better development of mouth-bar sands in the south compared to the north The components of the delta are: dark green is the upper delta plain which is mostly fluvial; light green is the lower delta plain which is more tidally influenced: red is the distributary channel. Very light blue is the delta front which contain the yellow distributary mouth bar sands; the moderate blue is the prodelta. The deep blue is the shelf area, seaward of prodelta, bounded by 70-meter bathymetric contour. The yellow arrows and the white flags indicate the locations (7) of sampling for this study, which covers fluvial, upper delta plain, lower delta plain, and delta front areas, both northern lobe and southern lobe.
BACKGROUND
‐ Observations on modern sediment of Mahakam Delta during years 2005 – 2010‐ Since publication of Allen and Chambers’ (1998) Mahakam Delta book, no more comprehensive research on Mahakam Delta has been conducted.
OBJECTIVE
‐ Initial results of a long term sedimentological study of the modern Mahakam Delta‐ Provide updated analogues of delta geological model in the subsurface
See notes following
8
Presenter’s Notes: This research is based on periodic visits to the delta up to three times a year with 2-3 day from 2005 to 2010, cruising along the delta. Most of the time the visit was in association with field trip programs for geoscientists and students, led by senior author. The research is needed because the last publication on Mahakam Delta was by the late George Allen and John Chambers in 1998. A research by Sallahudin and Lambiase (2004, 2006) gave some alternative insight into the initial hypothesis as to why the modern mouth bar sands are of better quality than the distributary channels. However, there has not been any follow-up to their work. The objective of this study is to present the initial results of a long-term sedimentological study of the modern Mahakam Delta and at the same time provide further analogues of delta geological models in the subsurface.
Lantang IslandMariam RiverLantang IslandMariam RiverLantang IslandMariam RiverLantang IslandMariam River
Northern Lobe
Northern Lobe
Southern Lobe
Southern Lobe
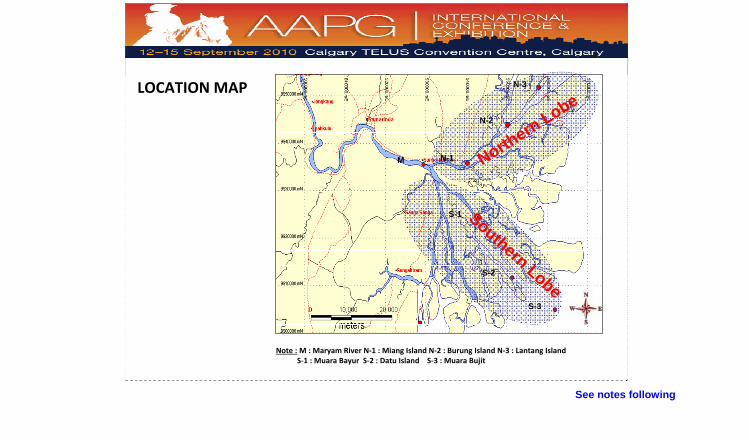
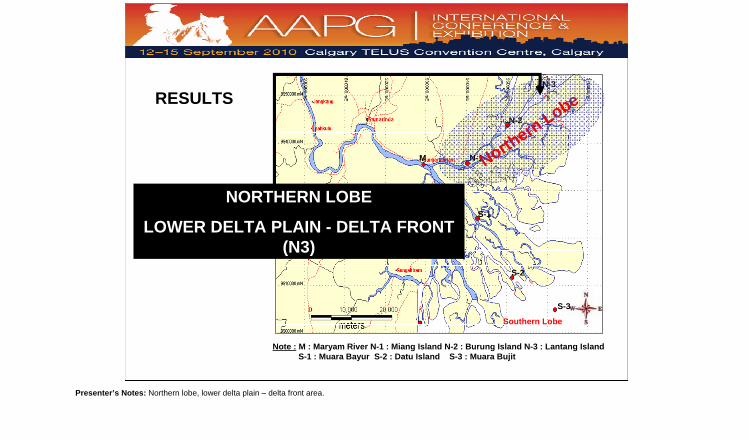
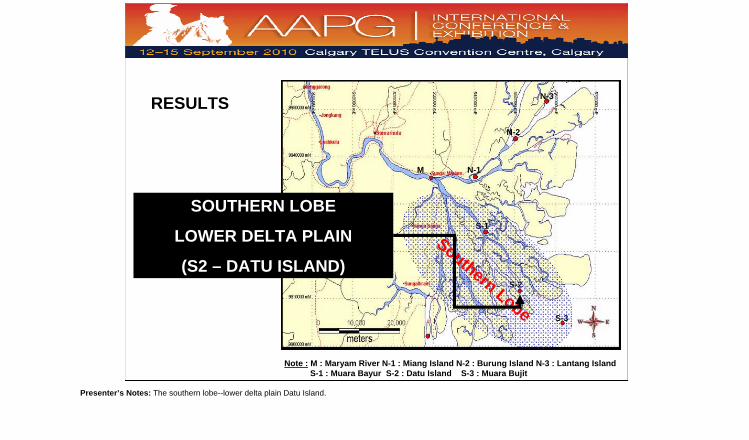
Note : M : Maryam River N‐1 : Miang Island N‐2 : Burung Island N‐3 : Lantang IslandS‐1 : Muara Bayur S‐2 : Datu Island S‐3 : Muara Bujit
N-1
N-2
N-3
S-1
S-2
S-3
M
LOCATION MAP
See notes following
9
Presenter’s Notes: This map shows our observation locations. We divided the area into the northern lobe and southern lobe. Location 1,Mariam River, includes the fluvial rather than the delta. It is slightly upstream of the head of passes. On the northern lobe are N1 Miang Island in upper delta plain, N2 Burung Island in lower delta plain, and N3 Lantang Island in lower delta plain – delta front area. On the southern lobe are S1 Muara Bayur in upper delta plain, S2 Datu Island in lower delta plain, and S3 Muara Bujit in delta-front setting. .
METHODS
Grab Samples SalinityCore Sample
Echo Sounding
River Bottom Profile
See notes following
10
Presenter’s Notes: The methods employed in the survey were :
1. Using echo sounder to get river bottom profile from our boat 2. Using grab sampler metal cone with-30 meter chain to grab bottom samples 3. Using PVC core barrel, 4-meters in length, with metal core catcher at the base to get sediment core. The core barrel
was pushed into the bottom sediments by using wooden hammer. 4. Measuring salinity of the river water as well as the sediment sampled, by using hand-held portable conductivity meter. 5. Visually describing all the sediments (grab and core) using loupes and microscopes. 6. Analyzing the distribution of grain size by using granulometric method in laboratory.
.
Lantang IslandMariam RiverLantang IslandMariam RiverLantang IslandMariam RiverLantang IslandMariam River
Northern Lobe
Northern Lobe
Southern Lobe
Southern Lobe
Note : M : Maryam River N-1 : Miang Island N-2 : Burung Island N-3 : Lantang IslandS-1 : Muara Bayur S-2 : Datu Island S-3 : Muara Bujit
N-1
N-2
N-3
S-1
S-2
S-3
M
RESULTS
HEAD OF PASSES – FLUVIAL
MARIAM RIVER
Presenter’s Notes: Sampling in fluvial setting of the Mahakam River, location number 1: Mariam River.
11
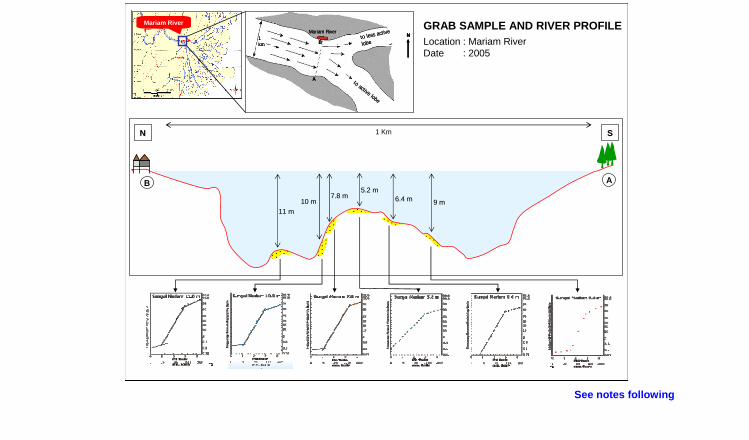
GRAB SAMPLE AND RIVER PROFILELocation : Mariam RiverDate : 2005
Lantang IslandMariam RiverLantang IslandMariam RiverLantang IslandMariam RiverLantang IslandMariam River
to less active
lobe
to active lobe
Mariam River
B
A
1 km
Nto less active
lobe
to active lobe
Mariam River
B
A
1 km
Nto less active
lobe
to active lobe
Mariam River
B
A
1 km
N
Mariam River
11 m11 m10 m10 m
7.8 m7.8 m5.2 m5.2 m
6.4 m6.4 m 9 m9 m
NN SS1 Km
B A
See notes following
12
Presenter’s Notes: In 2005, a river bottom profile indicated bifurcation of the thalweg, the northern being the deeper. A small bump on the northern thalweg was initially thought to be bedform actively migrating both toward the north (following lateral accretion) and toward the east (following overall current direction) The granulometric data indicate increasing grain size toward the northern thalweg and decreasing grain size, as well as more suspension, away from the river bar crest to the southern shallower thalweg. .
Lantang IslandMariam RiverLantang IslandMariam RiverLantang IslandMariam RiverLantang IslandMariam River
Very fine grained sand slightly muddy, quartz, mafic minerals,abundant organic matls
Conductivity test : 70 micro-siemens at 82.4º F � ± 1,400 ppm NaCl eq
Conductivity test : 40 micro-siemens at 81.3º F � ±1,200 ppm NaCl eq
Clay, organic materials,
Conductivity test : 40 micro-siemens at 81.3º F � ± 1,200 ppm NaCl eq
to less active
lobe
to active lobe
Mariam River
B
A
1 km
Nto less active
lobe
to active lobe
Mariam River
B
A
1 km
Nto less active
lobe
to active lobe
Mariam River
B
A
1 km
N
NN SS
8 m6 m7 m19 m14 m 12 m
Mariam River
1 Km
BA
GRAB SAMPLE AND RIVER PROFILE
See notes following
13
Presenter’s Notes: In 2009, a similar situation in bottom river profile, with the deepest thalweg in the north, which proved to be 19 meters; the grab sample on the edge of northern thalweg resulted in scraping off of semi-consolidated clay. Again there is increasing grain size toward the northern thalweg, but in this case, at the deepest part of the thalweg, no sediment was being deposited. The salinity of water and sediment in this area is 1200 ppm NaCl eq. .
Presenter’s Notes: In 2010, we found conglomerate-pebble grain size at a depth of 15 meters, close to the thalweg greatest depth. However, there was absence of sediment at the bottom of the greatest thalweg depth. The 6-year survey shows that the small undulation close to the thalweg area on the flank of the point bar is not really a sand-wave bedform because it did not move during that time. It might be related to irregularities in the bedrock controlled by structure. Salinity was measured as increasing, most recently 2200 ppm NaCl equivalent. .
R E S U L T S
5
5
10
4
5
6
BASED ON GRABBED BOTTOM SEDIMENTS & DEPTH CORRELATION
MEDIUM TO COARSE GRAINED SAND
CLAYORGANIC MATERIAL
SILTY TO VERY FINE GRAINED SAND
FINE TO MEDIUM GRAINED SAND
1000 0 1000 2000
METERS
DEPTH INTERVAL (M)
Mahakam Delta
Head of Passes – Fluvial
Sand Distribution Model
5
5
10
4
5
6
BASED ON GRABBED BOTTOM SEDIMENTS & DEPTH CORRELATION
MEDIUM TO COARSE GRAINED SAND
CLAYORGANIC MATERIAL
SILTY TO VERY FINE GRAINED SAND
FINE TO MEDIUM GRAINED SAND
1000 0 1000 2000
METERS
DEPTH INTERVAL (M)
Mahakam Delta
Head of Passes – Fluvial
Sand Distribution Model
5
5
15
4
5
6
1000 0 1000 2000
METERS
10
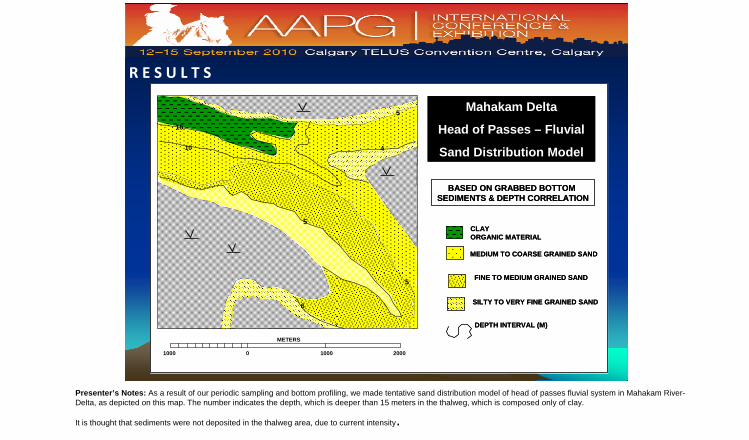
Presenter’s Notes: As a result of our periodic sampling and bottom profiling, we made tentative sand distribution model of head of passes fluvial system in Mahakam River-Delta, as depicted on this map. The number indicates the depth, which is deeper than 15 meters in the thalweg, which is composed only of clay.
It is thought that sediments were not deposited in the thalweg area, due to current intensity.
15
Lantang IslandMariam RiverLantang IslandMariam RiverLantang IslandMariam RiverLantang IslandMariam River
N-1
N-2
N-3
S-1
S-2
S-3
Northern Lobe
Southern Lobe
Note : M : Maryam River N-1 : Miang Island N-2 : Burung Island N-3 : Lantang Island S-1 : Muara Bayur S-2 : Datu Island S-3 : Muara Bujit
M
NORTHERN LOBE
DELTA PLAIN (N1-N2)
RESULTS
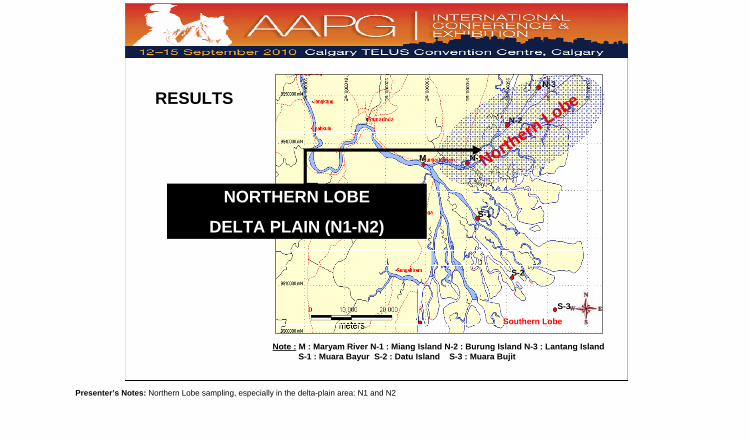
Presenter’s Notes: Northern Lobe sampling, especially in the delta-plain area: N1 and N2
16
Lantang IslandMariam RiverLantang IslandMariam RiverLantang IslandMariam RiverLantang IslandMariam RiverMiang Island
Location : Miang IslandDate : 2005
6 m8 m
5 m8 m
N S
3m5 m 6 m
Nipah vegetation
Nipah vegetation
GRAB SAMPLE AND RIVER PROFILE
Presenter’s Notes: The greatest depth in this upper delta plain distributary channel is 8 meters.The irregularities of the river bottom might be associated with the abandonment processes of the northern lobe.Suspension-laden deposition seems to be dominating the granulometric profile.On the surface of the mid-channel bar we also found some clay in grab samples, indicating very low energy.
17
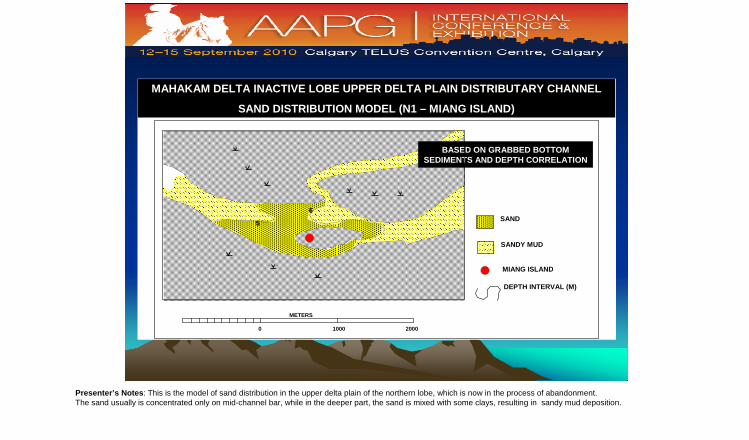
BASED ON GRABBED BOTTOMSEDIMENTS AND DEPTH CORRELATION
Presenter’s Notes: This is the model of sand distribution in the upper delta plain of the northern lobe, which is now in the process of abandonment.The sand usually is concentrated only on mid-channel bar, while in the deeper part, the sand is mixed with some clays, resulting in sandy mud deposition.
18
Lantang IslandMariam RiverLantang IslandMariam RiverLantang IslandMariam RiverLantang IslandMariam River
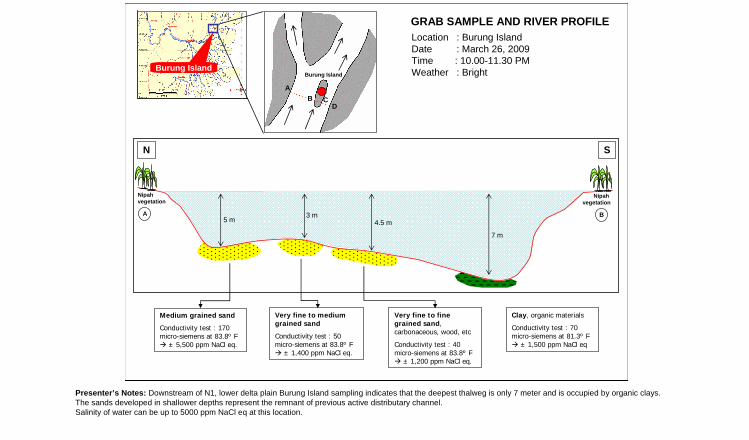
Location : Burung IslandDate : March 26, 2009Time : 10.00-11.30 PMWeather : Bright
AB C
D
Burung IslandBurung Island
Very fine to medium grained sand
Conductivity test : 50micro-siemens at 83.8º F ± 1,400 ppm NaCl eq.
Very fine to fine grained sand, carbonaceous, wood, etc
Conductivity test : 40micro-siemens at 83.8º F ± 1,200 ppm NaCl eq.
Clay, organic materials
Conductivity test : 70 micro-siemens at 81.3º F ± 1,500 ppm NaCl eq
Medium grained sand
Conductivity test : 170micro-siemens at 83.8º F ± 5,500 ppm NaCl eq.
N S
5 m3 m
4.5 m
7 m
GRAB SAMPLE AND RIVER PROFILE
A B
Nipah vegetation
Nipah vegetation
Presenter’s Notes: Downstream of N1, lower delta plain Burung Island sampling indicates that the deepest thalweg is only 7 meter and is occupied by organic clays.The sands developed in shallower depths represent the remnant of previous active distributary channel.Salinity of water can be up to 5000 ppm NaCl eq at this location.
19
CLAYORGANIC MUD
VERY FINE TO MEDIUM GRAINED SAND
BURUNG ISLAND
0 1000 2000
METERS
2
DEPTH INTERVAL (M)
7
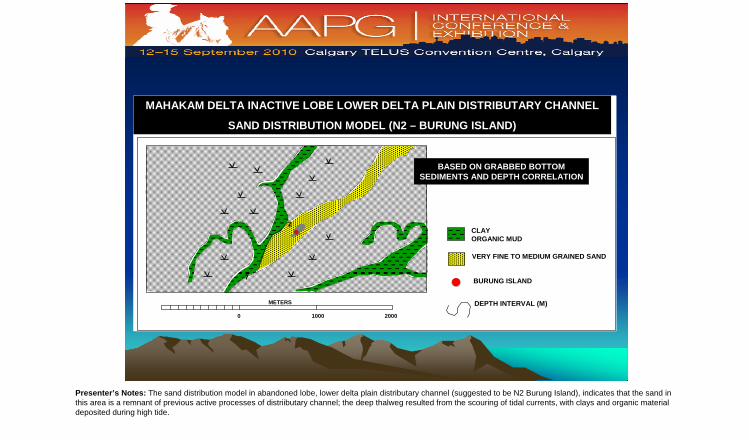
BASED ON GRABBED BOTTOMSEDIMENTS AND DEPTH CORRELATION
Presenter’s Notes: The sand distribution model in abandoned lobe, lower delta plain distributary channel (suggested to be N2 Burung Island), indicates that the sand in this area is a remnant of previous active processes of distriibutary channel; the deep thalweg resulted from the scouring of tidal currents, with clays and organic material deposited during high tide.
20
Lantang IslandMariam RiverLantang IslandMariam RiverLantang IslandMariam RiverLantang IslandMariam River
N-1
N-2
N-3
S-1
S-2
S-3
Northern Lobe
Southern Lobe
Note : M : Maryam River N-1 : Miang Island N-2 : Burung Island N-3 : Lantang Island S-1 : Muara Bayur S-2 : Datu Island S-3 : Muara Bujit
fine – medium grainedsand, light brown, quartz mineral, well sorted, sub-rounded, cross-beds, coarsening upward, clay inclined, organic material,clay nodule, clay drapes on foreset, carbonaceous mudstones intercalations
Conductivity test : 980 micro-siemens at 83.4º F � ± 19,000 ppm NaCl eq.
B
SE
A
Nipah vegetation
Nipah vegetation
Presenter’s Notes: In this lower delta plain area, the deepest thalweg is 6.8 meters and contains organic mud . The majority of the coring that we have managed to get in the submerged longitudinal bar of Lantang Island. The profile of coarsening upward sequence of fine- to medium-grained sands with abundant clay drapes both within the sand body and especially in the interbedded mud-siltstone.The salinity in this area is quite high, 19000ppm NaCl equivalent.
22
0
15
30
45
60
75
90
105
120
135
150
165
180
195
210
shsltvfgfgmgcgCM
very fine – medium grain sand, gray –light brown, loose, coarsening up, organic material, quartz mineral, interlamination with dark gray clay, carbonaceous.
very fine – fine grain sand, gray – dark gray, coarsening up, organic material, interlamination with dark gray clay, carbonaceous.
very fine – fine grain sand, dark gray, loose, coarsening up, organic material, interlamination with dark gray clay, carbonaceous.
very fine – fine grain sand, dark gray, coarsening up, organic material, interlamination with dark gray – black clay, carbonaceous.
very fine – fine grain sand, dark gray, coarsening up, organic material abundant, interlamination with black clayand dark gray silt, carbonaceous.
very fine – fine grain sand, dark gray, coarsening up, organic material abundant, interlamination with black clayand dark gray silt, carbonaceous.
Striping sand-silt formed because of tidal influencel
Conductivity test : 4.2 milli-siemens at 85.4º F ± 12000 ppm NaCl eq.
Lantang IslandMariam RiverLantang IslandMariam RiverLantang IslandMariam RiverLantang IslandMariam River
Lantang Island
CORE SAMPLE DESCRIPTIONLocation : Lantang IslandDate : June 2008
Presenter’s Notes: At the edge of the side bar, the core shows interbedded – interlaminated sand and silt and mudstone with abundant carbonaceous material in it. These indicate periodical processes of tidal action. Ripples and burrows were also observed as common features in this area.
23
Profile of intertidal flat – tidal bar upper estuary deposit in Lantang
Ichnofauna is not significantly developed, but the varieties occur at surface
Lantang IslandMariam RiverLantang IslandMariam RiverLantang IslandMariam RiverLantang IslandMariam River
Lantang Island
Date : 2005
See notes following
24
Presenter’s Notes: At the crest of the submerged longitudinal bar sand , we cored a very pronounced cross-bedded fine- to medium-grained sandstone at the top, with burrowing by organisms; at the base of the core is organic mud with sand-silt interbed, indicating tidal action. The megaripples developed at the surface of this bar clearly demonstrate the work of tidal action, with pronounced interference rounded top ripples, as shown on the photograph in the lower right. These bedforms were responsible of the development of cross-bedding in the upper sand in the core. .
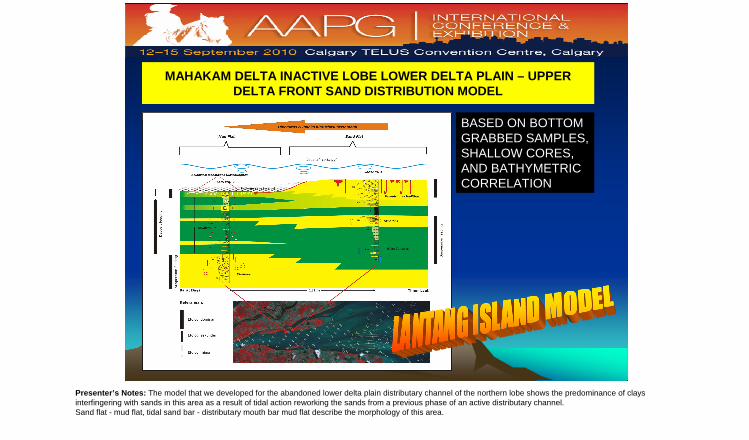
MAHAKAM DELTA INACTIVE LOBE LOWER DELTA PLAIN – UPPER DELTA FRONT SAND DISTRIBUTION MODEL
BASED ON BOTTOM GRABBED SAMPLES, SHALLOW CORES, AND BATHYMETRIC CORRELATION
Presenter’s Notes: The model that we developed for the abandoned lower delta plain distributary channel of the northern lobe shows the predominance of clays interfingering with sands in this area as a result of tidal action reworking the sands from a previous phase of an active distributary channel.Sand flat - mud flat, tidal sand bar - distributary mouth bar mud flat describe the morphology of this area.
25
N-1
N-2
N-3
S-1
S-2
S-3
Southern Lobe
Note : M : Maryam River N-1 : Miang Island N-2 : Burung Island N-3 : Lantang Island S-1 : Muara Bayur S-2 : Datu Island S-3 : Muara Bujit
M
SOUTHERN LOBE
UPPER DELTA PLAIN
(S1 – MUARA BAYUR)
RESULTS
Presenter’s Notes: The southern lobe -- the study in Muara Bayur, Datu Island, and Muara Bujit.
26
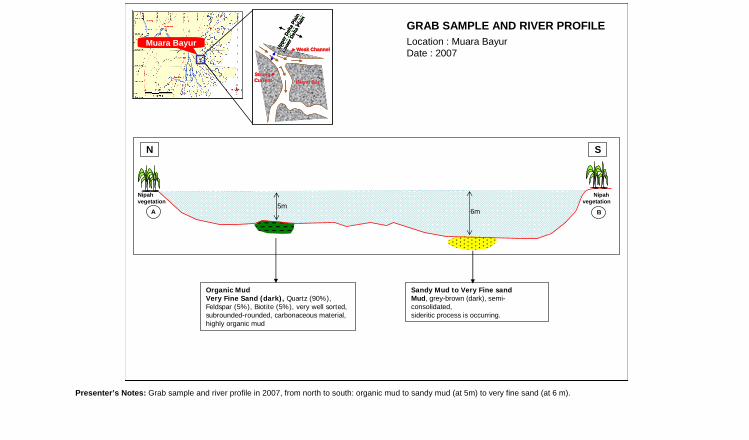
Sandy Mud to Very Fine sandMud, grey-brown (dark), semi-consolidated, sideritic process is occurring.
Organic MudVery Fine Sand (dark), Quartz (90%),Feldspar (5%), Biotite (5%), very well sorted, subrounded-rounded, carbonaceous material, highly organic mud
GRAB SAMPLE AND RIVER PROFILELocation : Muara BayurDate : 2007
N S
5m6mA B
Lantang IslandMariam RiverLantang IslandMariam RiverLantang IslandMariam RiverLantang IslandMariam River
Muara BayurWeak ChannelWeak Channel
Strong Strong CurrentCurrent Island BarIsland Bar
Upp
er D
elta
Pla
in
Low
er D
elta
Pla
in
Weak ChannelWeak Channel
Strong Strong CurrentCurrent Island BarIsland Bar
Upp
er D
elta
Pla
in
Low
er D
elta
Pla
in
Nipah vegetation
Nipah vegetation
Presenter’s Notes: Grab sample and river profile in 2007, from north to south: organic mud to sandy mud (at 5m) to very fine sand (at 6 m).
27
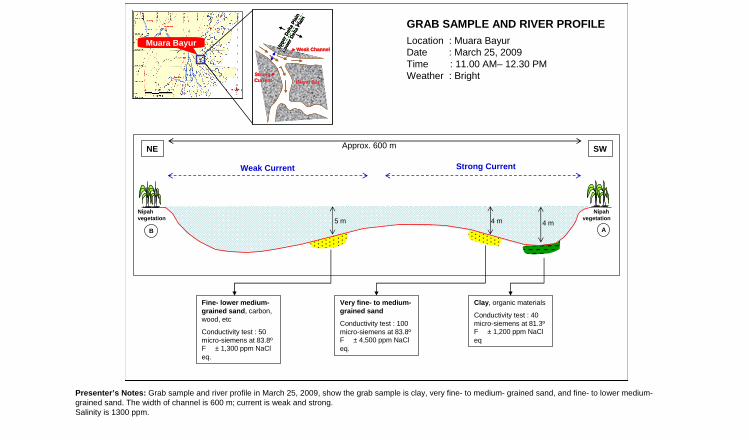
Very fine- to medium-grained sand
Conductivity test : 100micro-siemens at 83.8ºF � ± 4,500 ppm NaCl eq.
Conductivity test : 50micro-siemens at 83.8ºF � ± 1,300 ppm NaCl eq.
Clay, organic materials
Conductivity test : 40 micro-siemens at 81.3ºF � ± 1,200 ppm NaCl eq
Location : Muara BayurDate : March 25, 2009Time : 11.00 AM– 12.30 PMWeather : Bright
NE SWApprox. 600 m
Weak Current Strong Current
5 m 4 m 4 mAB
GRAB SAMPLE AND RIVER PROFILELantang IslandMariam RiverLantang IslandMariam RiverLantang IslandMariam RiverLantang IslandMariam River
Muara BayurWeak ChannelWeak Channel
Strong Strong CurrentCurrent Island BarIsland Bar
Upp
er D
elta
Pla
in
Low
er D
elta
Pla
in
Weak ChannelWeak Channel
Strong Strong CurrentCurrent Island BarIsland Bar
Upp
er D
elta
Pla
in
Low
er D
elta
Pla
in
Nipah vegetation
Nipah vegetation
Presenter’s Notes: Grab sample and river profile in March 25, 2009, show the grab sample is clay, very fine- to medium- grained sand, and fine- to lower medium-grained sand. The width of channel is 600 m; current is weak and strong.Salinity is 1300 ppm.
28
BASED ON GRABBED BOTTOM SEDIMENTS AND DEPTH CORRELATIONS
FINE TO LOWER MEDIUM SAND
VERY FINE TO MEDIUM GRAINED SAND
KELAMBU ISLAND
CLAYORGANIC MATERIAL
1000 0
METERS
1000
DEPTH INTERVAL (M)
2
5
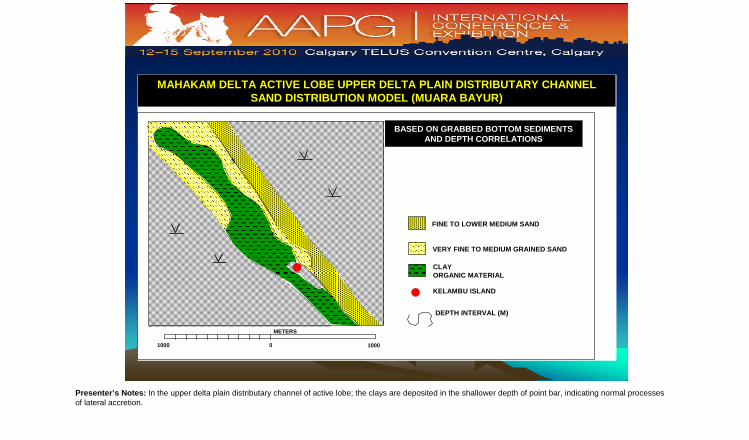
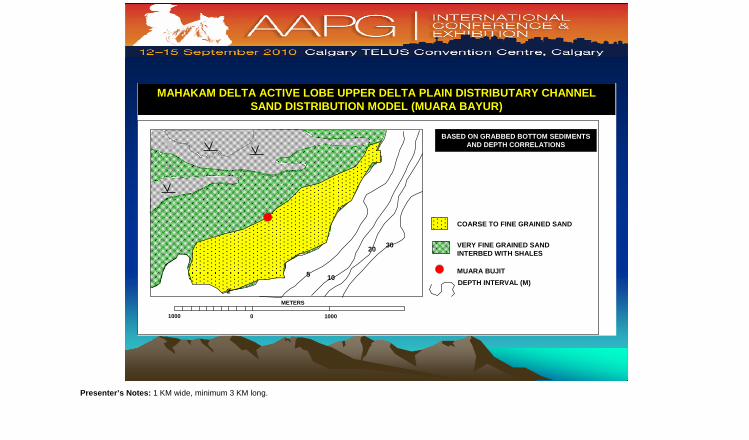
MAHAKAM DELTA ACTIVE LOBE UPPER DELTA PLAIN DISTRIBUTARY CHANNELSAND DISTRIBUTION MODEL (MUARA BAYUR)
Presenter’s Notes: In the upper delta plain distributary channel of active lobe; the clays are deposited in the shallower depth of point bar, indicating normal processes of lateral accretion.
29
N-1
N-2
N-3
S-1
S-2
S-3
Southern Lobe
Note : M : Maryam River N-1 : Miang Island N-2 : Burung Island N-3 : Lantang Island S-1 : Muara Bayur S-2 : Datu Island S-3 : Muara Bujit
M
SOUTHERN LOBE
LOWER DELTA PLAIN
(S2 – DATU ISLAND)
RESULTS
Presenter’s Notes: The southern lobe--lower delta plain Datu Island.
30
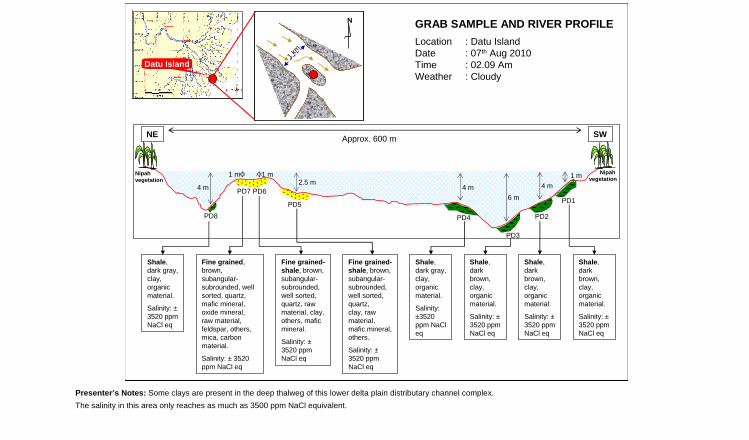
Location : Datu IslandDate : 07th Aug 2010Time : 02.09 AmWeather : Cloudy
5
PD1
PD2
PD3
PD4
PD5
PD6PD7
PD8
1 km
NNLantang IslandMariam RiverLantang IslandMariam RiverLantang IslandMariam RiverLantang IslandMariam River
Datu Island
Shale,dark gray, clay, organic material.
Salinity: ±3520 ppm NaCl eq
Fine grained,brown, subangular-subrounded, well sorted, quartz, mafic mineral, oxide mineral, raw material, feldspar, others, mica, carbon material.
Salinity: ± 3520ppm NaCl eq
Fine grained-shale, brown, subangular-subrounded, well sorted,quartz, raw material, clay, others, mafic mineral.
Salinity: ±3520 ppm NaCl eq
Fine grained-shale, brown, subangular-subrounded, well sorted,quartz, clay, raw material, mafic mineral, others.
Salinity: ±3520 ppm NaCl eq
Shale,dark gray, clay, organic material.
Salinity: ±3520ppm NaCl eq
Shale,dark brown, clay, organic material.
Salinity: ±3520 ppm NaCl eq
Shale,dark brown, clay, organic material.
Salinity: ±3520 ppm NaCl eq
Shale,dark brown, clay, organic material.
Salinity: ±3520 ppm NaCl eq
GRAB SAMPLE AND RIVER PROFILE
4 m
1 m 1 m2.5 m
4 m
6 m
4 m
1 m
NE SWApprox. 600 m
Nipah vegetation
Nipah vegetation
Presenter’s Notes: Some clays are present in the deep thalweg of this lower delta plain distributary channel complex.
The salinity in this area only reaches as much as 3500 ppm NaCl equivalent.
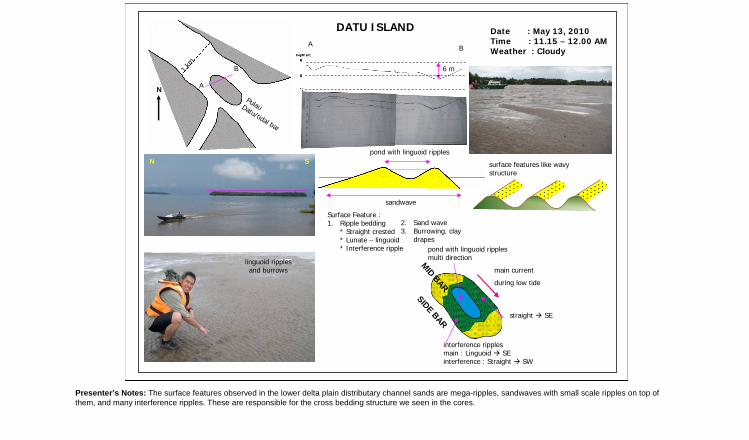
DATU ISLAND Date : May 13, 2010Time : 11.15 – 12.00 AMWeather : Cloudy
N S
linguoid ripples linguoid ripples and burrowsand burrows
MID BAR
SIDE BAR
Presenter’s Notes: The surface features observed in the lower delta plain distributary channel sands are mega-ripples, sandwaves with small scale ripples on top of them, and many interference ripples. These are responsible for the cross bedding structure we seen in the cores.
32
PROFILPROFILE OF E OF MID BARMID BAR ININ DATUDATU ISLANDISLANDDate : 2005
Presenter’s Notes: In the mid-bar core we found fining upward, cross-bedded sandstone with numerous burrows and clay drapes.
33
very fine – fine grain sand, dark gray, loose, cross-beds, coarsening upward, organic material, microfauna abundant, interlamination withdark gray clay, carbonaceous.
0
10
20
30
40
50
60
70
80
90
100
110
120
130
140
150
shsltvfgfgmgcgCM
very fine – fine grain sand, dark gray, loose, cross-beds, coarsening upward, organic material abundant, microfauna, interlamination withdark gray clay, carbonaceous.
very fine – fine grain sand, dark gray, loose, ripples, cross-beds, coarsening upward, clay nodule, organic material, burrowing, interlamination with dark gray clay, carbonaceous.
fine – medium grain sand, light brown, quartz mineral, well sorted, subrounded, loose, cross-beds, coarsening upward, clay inclined, organic material, clay nodule, clay drapes on foreset.
very fine – fine grain sand, dark gray, loose, cross-beds, coarsening upward, clay nodule, organic material, microfauna, interlamination withdark gray clay, carbonaceous.
Location : Datu IslandDate : 4 June 2008
CORE SAMPLE DESCRIPTIONSide Bar of Datu Island
Presenter’s Notes: Core sample description in June 4, 2008: coarsening upward, from bottom very fine- to fine-grained sand-microfauna abundant, very fine- to fine-grained sand-microfauna, very fine- fine-grained sand, very fine- fine-grained sand, fine- to medium-grained sand--clay drape.
34
FINE TO MEDIUM GRAINED SANDCLAY DRAPES
VERY FINE GRAINED SAND TO CLAY
DATU ISLAND
0 1000 2000
METERS
DEPTH INTERVAL (M)
5
1
1000
BASED ON GRABBED BOTTOM SEDIMENTS AND DEPTH CORRELATIONS
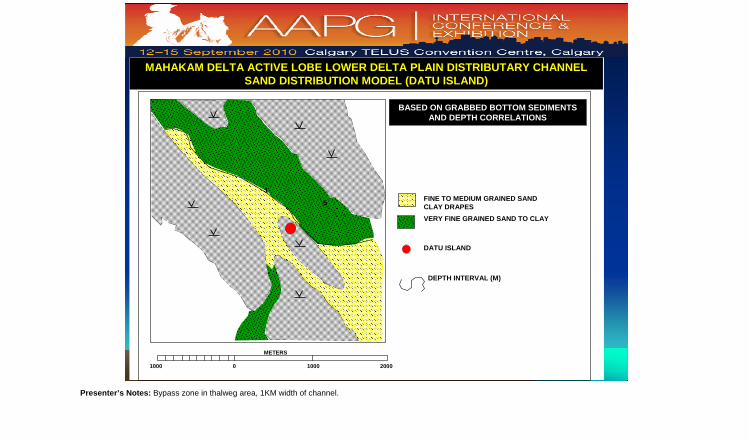
MAHAKAM DELTA ACTIVE LOBE LOWER DELTA PLAIN DISTRIBUTARY CHANNELSAND DISTRIBUTION MODEL (DATU ISLAND)
Presenter’s Notes: Bypass zone in thalweg area, 1KM width of channel.
35
N-1
N-2
N-3
S-1
S-2
S-3
Southern Lobe
Note : M : Maryam River N-1 : Miang Island N-2 : Burung Island N-3 : Lantang Island S-1 : Muara Bayur S-2 : Datu Island S-3 : Muara Bujit
M
SOUTHERN LOBE
DELTA FRONT
(S3 – MUARA BUJIT)
RESULTS
Presenter’s Notes: Muara Bujit (southern lobe – delta front).
36
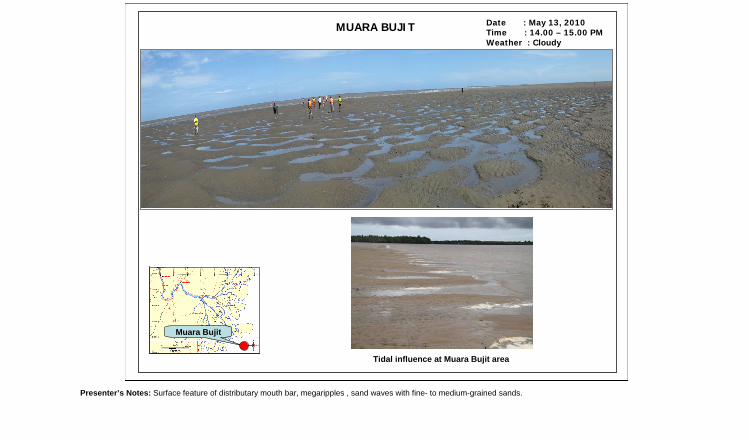
Date : May 13, 2010Time : 14.00 – 15.00 PMWeather : Cloudy
MUARA BUJIT
Tidal influence at Muara Bujit area
Lantang IslandMariam RiverLantang IslandMariam RiverLantang IslandMariam RiverLantang IslandMariam River
Muara Bujit
Presenter’s Notes: Surface feature of distributary mouth bar, megaripples , sand waves with fine- to medium-grained sands.
37
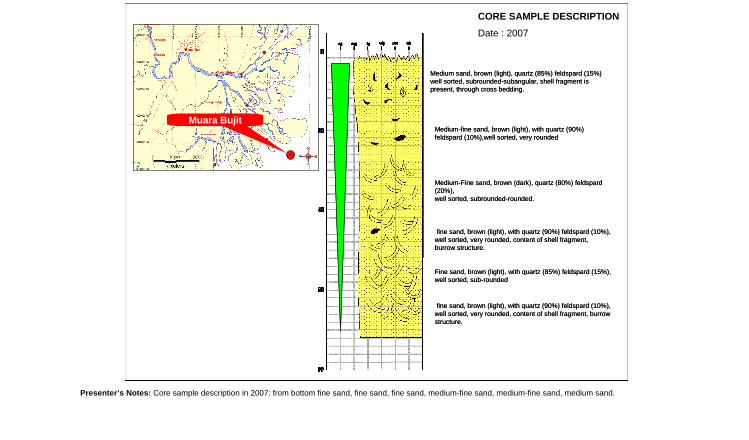
Medium sand, brown (light), quartz (85%) feldspard (15%)well sorted, subrounded-subangular, shell fragment is present, through cross bedding.
Medium-fine sand, brown (light), with quartz (90%) feldspard (10%),well sorted, very rounded
Medium-Fine sand, brown (dark), quartz (80%) feldspard(20%),well sorted, subrounded-rounded.
fine sand, brown (light), with quartz (90%) feldspard (10%),well sorted, very rounded, content of shell fragment, burrow structure.
Fine sand, brown (light), with quartz (85%) feldspard (15%),well sorted, sub-rounded
fine sand, brown (light), with quartz (90%) feldspard (10%),well sorted, very rounded, content of shell fragment, burrow structure.
Date : 2007
CORE SAMPLE DESCRIPTION
Lantang IslandMariam RiverLantang IslandMariam RiverLantang IslandMariam RiverLantang IslandMariam River
Muara Bujit
Presenter’s Notes: Core sample description in 2007: from bottom fine sand, fine sand, fine sand, medium-fine sand, medium-fine sand, medium sand.
38
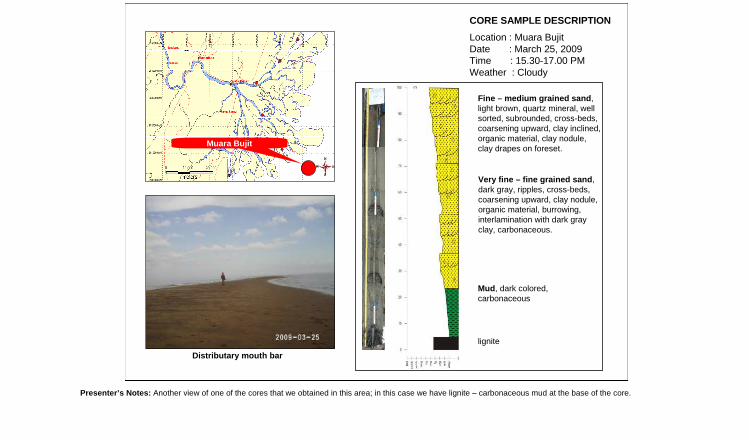
Location : Muara BujitDate : March 25, 2009Time : 15.30-17.00 PMWeather : Cloudy
Very fine – fine grained sand,dark gray, ripples, cross-beds, coarsening upward, clay nodule, organic material, burrowing, interlamination with dark gray clay, carbonaceous.
Fine – medium grained sand,light brown, quartz mineral, well sorted, subrounded, cross-beds, coarsening upward, clay inclined, organic material, clay nodule, clay drapes on foreset.
Mud, dark colored, carbonaceous
lignite
Distributary mouth bar
Lantang IslandMariam RiverLantang IslandMariam RiverLantang IslandMariam RiverLantang IslandMariam River
Muara Bujit
CORE SAMPLE DESCRIPTION
Presenter’s Notes: Another view of one of the cores that we obtained in this area; in this case we have lignite – carbonaceous mud at the base of the core.
39
MUARA BUJIT
VERY FINE GRAINED SANDINTERBED WITH SHALES
0 1000
METERS
DEPTH INTERVAL (M)
1000
5 10
2030
2
COARSE TO FINE GRAINED SAND
BASED ON GRABBED BOTTOM SEDIMENTS AND DEPTH CORRELATIONS
MAHAKAM DELTA ACTIVE LOBE UPPER DELTA PLAIN DISTRIBUTARY CHANNELSAND DISTRIBUTION MODEL (MUARA BAYUR)
Presenter’s Notes: 1 KM wide, minimum 3 KM long.
40
THE DYNAMICS OF
MAHAKAM DELTA COMPONENTS
41
M N-1
S-1
N-2
N-3
Mariam River Lantang Island
Muara Bayur
Burung Island
Miang Island
clay
vf-fg sandvf-mg sandmg sand
Conglomerate-pebbly
Medium grained
Medium grained
Fine grained
Fine grained
Shale-fine grained
5
SM2SM3SM4SM5SM6
SM7
N S
15 m11 m
5 m 6 m 8 m 8 mB A
1 Km
Shale
Fine grained
Fine grained-shale
Fine grained-shale
ShaleShale
ShaleShale
PD1PD2
PD3PD4
PD5PD6PD7
PD8
4 m1 m 1 m
2.5 m 4 m6 m
4 m1 m
NE SWApprox. 600 m
6.8 m
NW
Organic Mud
A B
SE
1.2 m
N S
5 m 3 m4.5 m
7 m
A B
6 m8 m
5 m8 m
N S
3m5 m 6 m
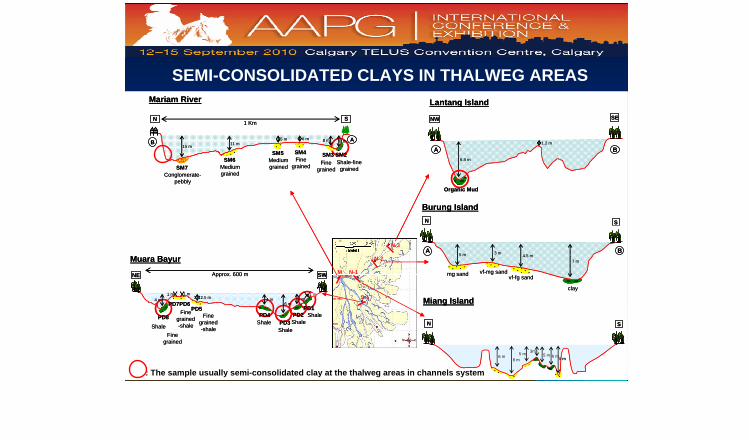
SEMI-CONSOLIDATED CLAYS IN THALWEG AREAS
: The sample usually semi-consolidated clay at the thalweg areas in channels system
42
Lantang IslandDatu Island
S-2
Muara Bujit
0
10
20
30
40
50
60
70
80
90
100
110
120
130
140
150
shsltvfgfgmgcgCM0
10
20
30
40
50
60
70
80
90
100
110
120
130
140
150
shsltvfgfgmgcgCM0
10
20
30
40
50
60
70
80
90
100
110
120
130
140
150
shsltvfgfgmgcgCM
0
15
30
45
60
75
90
105
120
135
150
165
180
195
210
shsltvfgfgmgcgCM
0
15
30
45
60
75
90
105
120
135
150
165
180
195
210
shsltvfgfgmgcgCM
0
15
30
45
60
75
90
105
120
135
150
165
180
195
210
shsltvfgfgmgcgCM
S-3
N-3
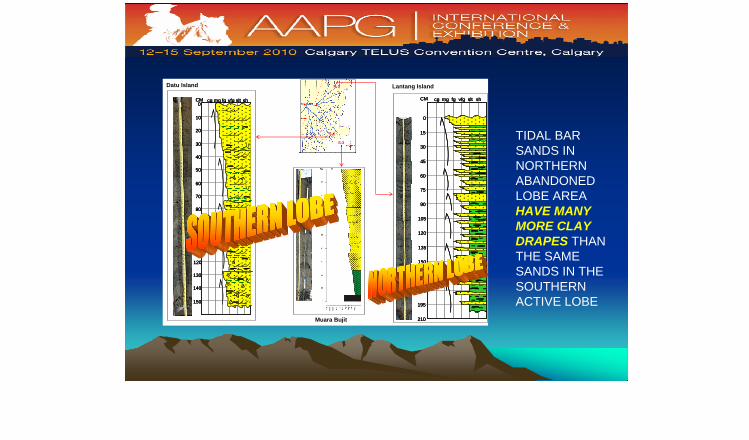
TIDAL BAR SANDS IN NORTHERN ABANDONED LOBE AREA HAVE MANY MORE CLAY DRAPES THAN THE SAME SANDS IN THE SOUTHERN ACTIVE LOBE
43
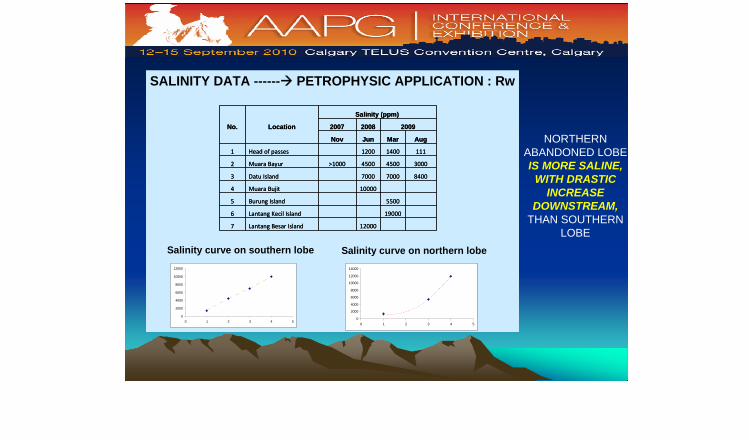
Salinity (ppm)
No. Location 2007 2008 2009
Nov Jun Mar Aug
1 Head of passes 1200 1400 111
2 Muara Bayur >1000 4500 4500 3000
3 Datu Island 7000 7000 8400
4 Muara Bujit 10000
5 Burung Island 5500
6 Lantang Kecil Island 19000
7 Lantang Besar Island 12000
Salinity (ppm)
No. Location 2007 2008 2009
Nov Jun Mar Aug
1 Head of passes 1200 1400 111
2 Muara Bayur >1000 4500 4500 3000
3 Datu Island 7000 7000 8400
4 Muara Bujit 10000
5 Burung Island 5500
6 Lantang Kecil Island 19000
7 Lantang Besar Island 12000
SALINITY DATA ------ PETROPHYSIC APPLICATION : Rw
0
2000
4000
6000
8000
10000
12000
14000
0 1 2 3 4 5
Salinity curve on northern lobe
0
2000
4000
6000
8000
10000
12000
0 1 2 3 4 5
Salinity curve on southern lobe
NORTHERN ABANDONED LOBE IS MORE SALINE,
WITH DRASTIC INCREASE
DOWNSTREAM,THAN SOUTHERN
LOBE
44
Lantang IslandMariam RiverLantang IslandMariam RiverLantang IslandMariam RiverLantang IslandMariam River
5500 ppm
Mariam RiverSalinity : 1400 ppm
Muara BujitSalinity : 10000 ppm
Inactive Lobe
Active Lobe
Lantang IslandSalinity : 12000 ppm
Burung IslandSalinity : 5500 ppm
Datu IslandSalinity : 7000 ppm
Muara BayurSalinity : 4500 ppm
Decreasing grain size
Decreasing grain size
Increasing grain size0
2000
4000
6000
8000
10000
12000
0 1 2 3 4 5
0
2000
4000
6000
8000
10000
12000
14000
0 1 2 3 4 5
Salinity curve on southern lobe
Salinity curve on northern lobe
LOBES DIFFERENT CHARACTERISTIC SUMMARY
45
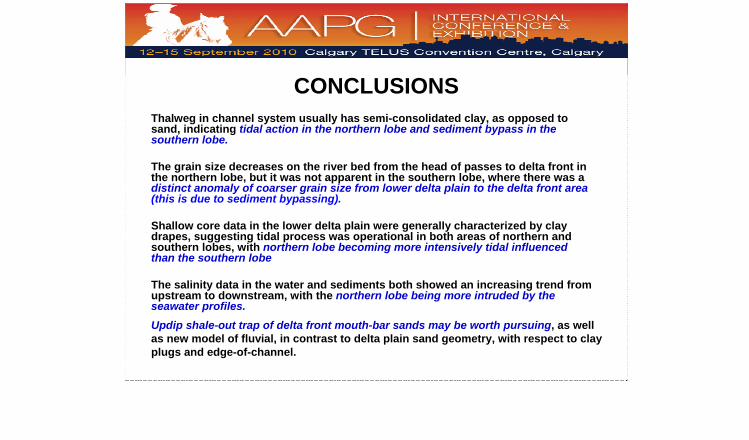
CONCLUSIONSThalweg in channel system usually has semi-consolidated clay, as opposed to sand, indicating tidal action in the northern lobe and sediment bypass in the southern lobe.
The grain size decreases on the river bed from the head of passes to delta front in the northern lobe, but it was not apparent in the southern lobe, where there was a distinct anomaly of coarser grain size from lower delta plain to the delta front area(this is due to sediment bypassing).
Shallow core data in the lower delta plain were generally characterized by clay drapes, suggesting tidal process was operational in both areas of northern and southern lobes, with northern lobe becoming more intensively tidal influenced than the southern lobe
The salinity data in the water and sediments both showed an increasing trend from upstream to downstream, with the northern lobe being more intruded by the seawater profiles.
Updip shale-out trap of delta front mouth-bar sands may be worth pursuing, as well as new model of fluvial, in contrast to delta plain sand geometry, with respect to clay plugs and edge-of-channel.
46
ACKNOWLEDGMENTS
We acknowledge to GDA and ETTI team for their support and contributions in this paper