Q4FY19 – Result Update May 17, 2019 Minda Industries Downside Scenario Current Price Price Target 398 24.8% Upside Scenario Strong Buy* 319 Trolled down by depressed sentiments | Stable outlook | Attractive valuations Temporary Blips Impacted Financials • Revenue in Q4FY19 was higher by 8% YoY to Rs. 1,486 crores (average of first three quarters growth is about 43% YoY) was majorly trolled down by depressed sentiments in the market. The OEMs volume sales fished down by a rise in the cost of ownership & uncertainty related to the elections. This we believe is a temporary blip and volume sales can surprise positively from July 2019 onwards. Based on our checks, we believe, post election uncertainty & expectation of a stable government would create positive vibes, and this, along with pre-buying, launch of newer models would pull the customers towards showrooms. • The 4 th quarter growth was lower on account of 5% YoY decline in its ‘Switches’ segment, which was primarily due to lower volume sales in 4W switches. The market share remains intact at about 65%. The ‘Lighting’ & ‘Horns’ segment reported reasonably better numbers & grew by 10.3% & 13.9% YoY respectively. The Horns segment revenues as well as margins have improved this time, led by an uplift in the performance of Clarton Horns. • On the expected lines, the ‘Others’ segment reported phenomenal growth of 25.6% even in tough times, led by the superior performance of alloy wheels. Several products in ‘Others’ segment are newer, however, has high potential for growth in the coming years. Immense Potential for Growth • As the industry is moving towards BS6 and new safety regulations are announced, hence the demand for certain products will shot up viz. Sensors (including engine related sensors), Advance Filtration, Air Bags, Seat Belt Reminders, Reverse Parking Sensors, etc. This, along with the premiumization which has been taken place viz. LEDs, ADAS, Alloy Wheels, Infotainment System, Telematics, Wireless Charges & AMT, has lot of potential and would uplift the Minda Industries revenues higher. All these products have huge potential and margins are higher as well. • The next leg of growth would be driven by premiumization, where the number of vehicles would remain same, but, Minda’s product value increases. Also, buyers are moving towards premium vehicles, where kit value per car is higher. The company keeps adding newer high margin products viz. Sensors, Controllers, Alloy Wheels, etc. Harita Seatings would add more than Rs. 1,000 crores in the top line from FY21E onwards. The cross selling opportunities gives confidence of outpacing the industry growth. Fortified Technical Tie-ups • Minda Industries have further strengthened its partnership with Sensata Technologies. It has made an agreement for five years to provide know-how, technical & engineering support for their businesses of Magnetic Speed & Position Sensors (Cam, Crank & TISS sensor products). • The Triple Combination of a ‘Large Customer Base’ + ‘Strong Tie-ups with the Global Technology Giants’ + ‘Diversified Product Portfolio’ with improving market share in the majority of the products provides a strong competitive advantage for Minda Industries. Minda Industries vs. SENSEX * 1) Incorporated Harita Seating financials. 2) Read last page for disclaimer & rating rationale Market Data Industry Auto Ancillary Sensex 37,393 Nifty 11,257 Bloomberg Code MNDA:IN Eq. Cap. (INR Crores) 52 Face Value (INR) 2 52-w H/L 455/256 Market Cap (INR Crores) 8,358 Valuation Data FY19 FY20E FY21E OPM 12.3% 12.5% 12.5% NPM 5.7% 5.9% 6.4% P/E (x) 29.5 25.4 18.0 EV/EBITDA (x) 10.3 9.0 7.2 Shareholding Pattern (%) Mar-18 Dec-18 Mar-19 Promoters 71% 71% 71% FIIs 9% 11% 11% DIIs 6% 4% 5% Others 13% 14% 14% Total 100% 100% 100% (INR Crores) FY17 FY18 FY19 FY20E FY21E* Revenue 3,386 4,471 5,908 6,675 8,654 Growth (%) 34.0% 32.0% 32.2% 13.0% 29.6% EBITDA 374 534 725 834 1,078 Growth (%) 57.3% 42.8% 35.8% 15.1% 29.2% EBITDA Margin (%) 11.0% 11.9% 12.3% 12.5% 12.5% PAT 185 331 339 394 557 Growth (%) 68.2% 78.8% 2.6% 16.1% 41.3% Adj. EPS (INR) 6.2 11.7 10.8 12.5 17.7 P/E (x) 15.6 25.2 29.5 25.4 18.0 EV/EBITDA (x) 6.6 13.8 10.3 9.0 7.2 Source: Company, NSPL Research Institutional Research Head of Research Vaibhav Chowdhry vaibhav.chowdhry @ nalandasecurities.com NALANDA SECURITIES PRIVATE LIMITED 310-311 Hubtown Solaris, NS Phadke Marg, Opp Teli Gali, Andheri East, Mumbai 69 +91-22-6281-9649 | [email protected] | www.nalandasecurities.com Analyst Amit Hiranandani amit.hiranandani @ nalandasecurities.com 0 100 200 300 400 500 600 700 800 04-2016 07-2016 10-2016 01-2017 04-2017 07-2017 10-2017 01-2018 04-2018 07-2018 10-2018 01-2019 04-2019 SENSEX MINDA INDUSTRIES
Transcript
Q4
FY1
9 –
Re
sult
Up
dat
e
May 17, 2019
Minda IndustriesDownside
Scenario
Current
Price
Price
Target
39824.8%
Upside
Scenario
Strong Buy*
319Trolled down by depressed sentiments | Stable outlook | Attractive valuationsTemporary Blips Impacted Financials• Revenue in Q4FY19 was higher by 8% YoY to Rs. 1,486 crores (average of first three
quarters growth is about 43% YoY) was majorly trolled down by depressed sentimentsin the market. The OEMs volume sales fished down by a rise in the cost of ownership& uncertainty related to the elections. This we believe is a temporary blip and volumesales can surprise positively from July 2019 onwards. Based on our checks, webelieve, post election uncertainty & expectation of a stable government would createpositive vibes, and this, along with pre-buying, launch of newer models would pull thecustomers towards showrooms.
• The 4th quarter growth was lower on account of 5% YoY decline in its ‘Switches’segment, which was primarily due to lower volume sales in 4W switches. The marketshare remains intact at about 65%. The ‘Lighting’ & ‘Horns’ segment reportedreasonably better numbers & grew by 10.3% & 13.9% YoY respectively. The Hornssegment revenues as well as margins have improved this time, led by an uplift in theperformance of Clarton Horns.
• On the expected lines, the ‘Others’ segment reported phenomenal growth of 25.6%even in tough times, led by the superior performance of alloy wheels. Severalproducts in ‘Others’ segment are newer, however, has high potential for growth inthe coming years.
Immense Potential for Growth• As the industry is moving towards BS6 and new safety regulations are announced,
hence the demand for certain products will shot up viz. Sensors (including enginerelated sensors), Advance Filtration, Air Bags, Seat Belt Reminders, Reverse ParkingSensors, etc. This, along with the premiumization which has been taken place viz.LEDs, ADAS, Alloy Wheels, Infotainment System, Telematics, Wireless Charges & AMT,has lot of potential and would uplift the Minda Industries revenues higher. All theseproducts have huge potential and margins are higher as well.
• The next leg of growth would be driven by premiumization, where the number ofvehicles would remain same, but, Minda’s product value increases. Also, buyers aremoving towards premium vehicles, where kit value per car is higher. The companykeeps adding newer high margin products viz. Sensors, Controllers, Alloy Wheels, etc.Harita Seatings would add more than Rs. 1,000 crores in the top line from FY21Eonwards. The cross selling opportunities gives confidence of outpacing the industrygrowth.
Fortified Technical Tie-ups• Minda Industries have further strengthened its partnership with Sensata
Technologies. It has made an agreement for five years to provide know-how,technical & engineering support for their businesses of Magnetic Speed & PositionSensors (Cam, Crank & TISS sensor products).
• The Triple Combination of a ‘Large Customer Base’ + ‘Strong Tie-ups with the GlobalTechnology Giants’ + ‘Diversified Product Portfolio’ with improving market share inthe majority of the products provides a strong competitive advantage for MindaIndustries.
Minda Industries vs. SENSEX
* 1) Incorporated Harita Seating financials. 2) Read last page for disclaimer & rating rationale
Market Data
Industry Auto Ancillary
Sensex 37,393
Nifty 11,257
Bloomberg Code MNDA:IN
Eq. Cap. (INR Crores) 52
Face Value (INR) 2
52-w H/L 455/256
Market Cap (INR Crores) 8,358
Valuation Data FY19 FY20E FY21E
OPM 12.3% 12.5% 12.5%
NPM 5.7% 5.9% 6.4%
P/E (x) 29.5 25.4 18.0
EV/EBITDA (x) 10.3 9.0 7.2
Shareholding Pattern (%)
Mar-18 Dec-18 Mar-19
Promoters 71% 71% 71%
FIIs 9% 11% 11%
DIIs 6% 4% 5%
Others 13% 14% 14%
Total 100% 100% 100%
(INR Crores) FY17 FY18 FY19 FY20E FY21E*
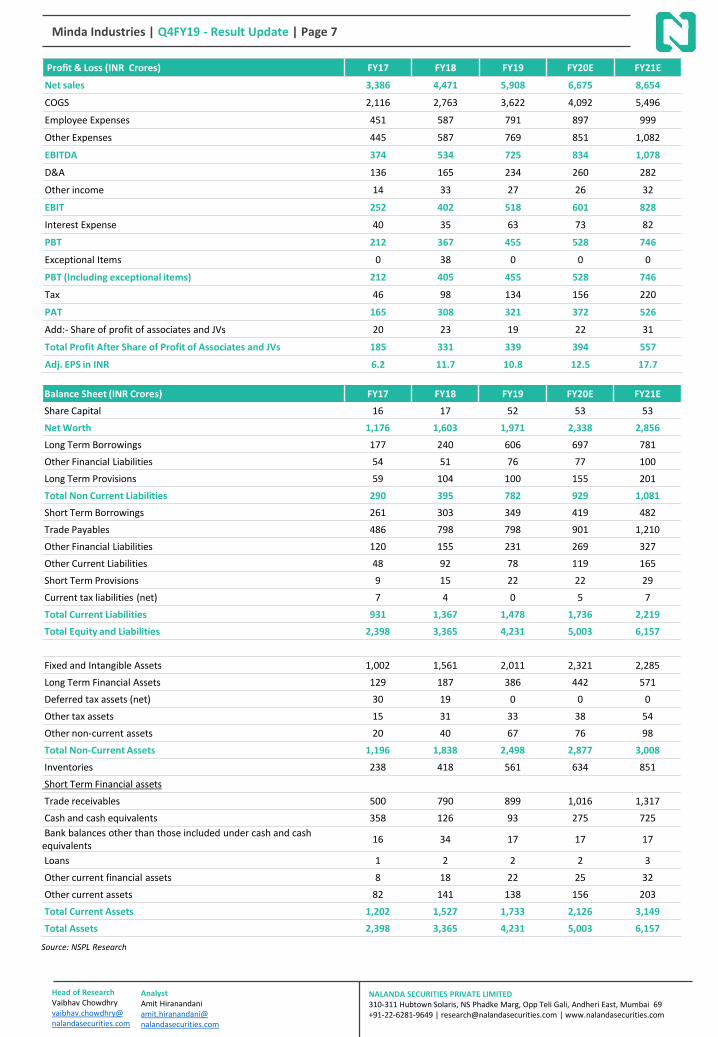
Revenue 3,386 4,471 5,908 6,675 8,654
Growth (%) 34.0% 32.0% 32.2% 13.0% 29.6%
EBITDA 374 534 725 834 1,078
Growth (%) 57.3% 42.8% 35.8% 15.1% 29.2%
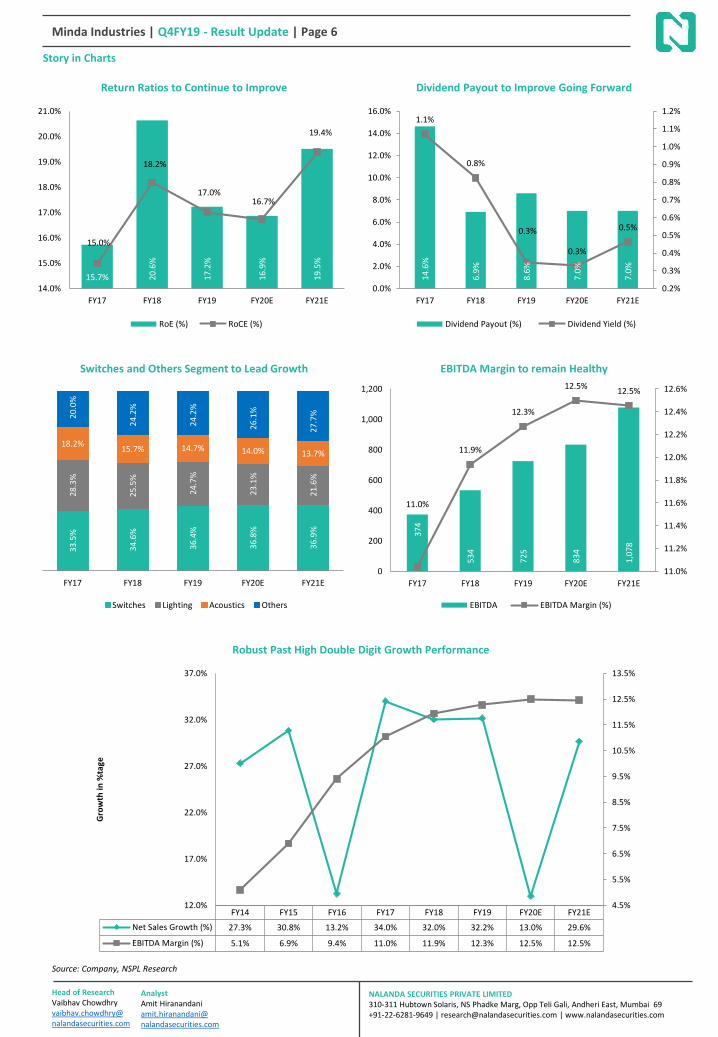
EBITDA Margin (%) 11.0% 11.9% 12.3% 12.5% 12.5%
PAT 185 331 339 394 557
Growth (%) 68.2% 78.8% 2.6% 16.1% 41.3%
Adj. EPS (INR) 6.2 11.7 10.8 12.5 17.7
P/E (x) 15.6 25.2 29.5 25.4 18.0
EV/EBITDA (x) 6.6 13.8 10.3 9.0 7.2
Source: Company, NSPL Research
Institutional Research
Head of ResearchVaibhav Chowdhry vaibhav.chowdhry@ nalandasecurities.com
Enormous Opportunity due to Changing Regulations• As the industry has mandated to move towards BS6, we see strong demand for Sensors (including engine related sensors),
Advance filtration, etc. Apart from this, the Enhanced Safety Norms to further push higher demand for Reverse Parking Sensors,Air Bags, Seat belts/reminders, etc. The company is already manufacturing all these products and has a strong collaboration withthe global technology leaders.
Margins Improved Even in Hard Times & would remain Stable• The EBITDA Margin in Q4FY19 improved by 11bps YoY to 12.5%, while it improved by 33bps YoY to 12.3% in FY19. This was
despite of a weak sentiments in OEM volume sales. The company’s RM costs to net sales was lower by 120bps YoY to 60.5% forthe quarter because of soft commodity prices. The capacity utilization of the few of its businesses were high, which has resultedin an improvement in the margins.
• On the other side, due to operating de-leverage, the employee as well as other expenses shot up by 80bps & 30bps respectively.The operating leverage benefits, the addition of new high margin products (safety related products & premiumization), this,along with stringent cost rationalization efforts would ensure stability in the margins for the next two years.
• Hence, we expect the margins in FY20E to grow marginally and would remain stable in FY21E as Harita Seatings incorporated inthe financials, which has a little lower margins vis-à-vis consolidated entity.
Continues to Receive New Set of Orders• Minda Industries has received several orders in different business divisions viz. in the lighting division, it has received orders of
Rs. 52 crores and Rs. 32 crores from M&M and Maruti respectively. While, Rs. 462 orders received for alloy wheel division fromBajaj Auto. In addition, under Switches division, it is approved as a supplier of CBS parts to Honda, Yamaha, Suzuki & TVS. Alsoreceived Rs. 50 crores of orders from Honda BS6 models.
Amalgamation of Four Subsidiaries• To strengthen standalone entity and to achieve high growth in the coming years, Minda Industries has announced amalgamation
of four domestic wholly owned subsidiaries with the company. These subsidiaries are Minda Rinder Pvt. Ltd., Minda Distribution& Services Ltd., Minda Auto Components Ltd., and M J Castings Ltd. The amalgamation is expected to get complete by end ofFY20.
Subsidiary Proposed to Be MergedFY19
Revenues Net Worth
Minda Rinder Pvt. Ltd 661 84
Minda Distribution & Services Ltd. 526 24
Minda Auto Components Ltd. 353 24
M J Castings Ltd. 315 81
Trading at Eye-Catching ValuationsWe strongly believe in the company’s business model and its potential growth in the medium to long term on account of itscompetitive positioning, this along with its continued strategy of introduction of newer products in its kitty. Minda Industries is adirect beneficiary of the automotive industry growth and has enormous opportunity led by the changing regulations andpremiumization. Overall, we trust that the combination of Regulatory Norms, Enhanced Safety Requirements, Premiumization andElectrification will eventually have a positive impact on the company’s performance.
At CMP of 319, the stock is trading at a attractive level of 18.0x FY21E EPS of Rs. 17.7. We have adjusted the financials looking at thepoor demand outlook of OEMs in domestic as well as overseas. We recommend a Strong Buy on Minda Industries with an averagetarget price of Rs. 398 per share, valuing the company with DCF and EV/EBITDA Methodology. We have assigned 10.3x to its FY21EEBITDA, in-line to its last three years average EV/EBITDA on account of huge potential and growth opportunities in the $49+ bndomestic auto ancillary industry.
Minda Industries | Q4FY19 - Result Update | Page 4
Source: Company, NSPL Research
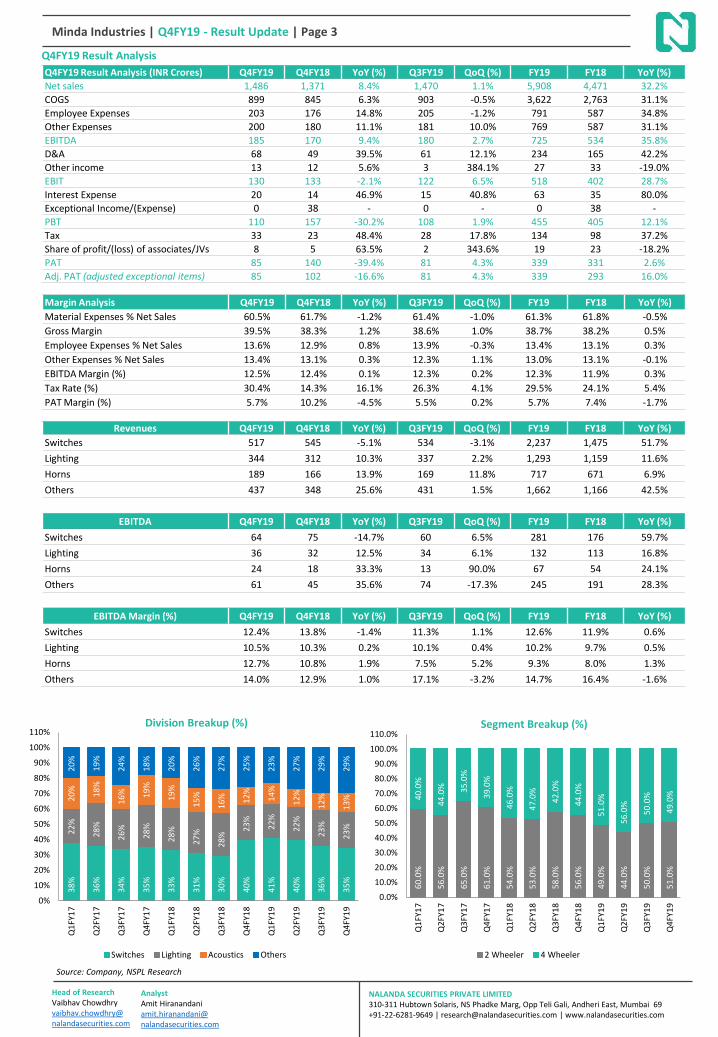
Quarterly Performance Analysis
• Topline: The revenue growth was lower, led by depressed sentiments in the automobile industry. The ‘Switches’ segment wasthe only segment, which registered a degrowth of 5.1% YoY.
• Margin Performance: The RM costs came down on account of softening of commodity prices, while due to operatingdeleverage, the employee & other expenses looks higher as a percentage of net sales. Overall, margins improved a little for thequarter. The margins for the ‘Switches’ division decelerated by 140bps YoY, which has impacted the overall marginperformance for the quarter.
• Interest costs shot up by 47% YoY to Rs. 20 crores for the quarter, was on account of increase in the borrowings towardsfinancing of KPIT, Sensata and a few of the projects. Additionally, the management has mentioned that there was someexchange gain received in the base quarter, which was not available in Q4FY19.
• The D&A expense were higher by ~40% YoY to Rs. 68 crores in Q4FY19 as the new plants were set up & assets were capitalized.• Capital Expenditure: Minda Industries incurred capex of Rs. 450 crores in FY19 and expect Rs. 400 crores in FY20E, while lower
for FY21E.• The debt level increased in FY19 and D/E stands at 0.54x. We think this level would more or less maintain as the company is in
a growth phase and keeps hunting for inorganic opportunities. However, due to strong cash flow generation, the net D/E wouldcome down from 0.49x in FY19 to 0.20x in FY21E.
• The tax rate would be little higher at 30-31% in FY20E as one R&D tax benefit expired in March 2019. In case receivedextension, the tax rate would be similar in FY20E vs. last year.
• Exceptional Items: The net exceptional gain of Rs. 38.24 crores in the base quarter (Q4FY18) was majorly due to Rs. 70.12crores of gain on fair valuation of pre-existing shareholding of an associate on conversion into subsidiary, as per IndAS. This wasoffset by an exceptional expense of Rs. 31.88 crores was w.r.t. provision for contingencies relating to export obligation inrespect of a subsidiary company.
• Dividend: The BoD has declared a final dividend of Rs. 0.65, this along with, Rs. 0.45 paid as an interim dividend. In total, thecompany has paid Rs. 1.10 per equity share for FY19.
Head of ResearchVaibhav Chowdhry vaibhav.chowdhry@ nalandasecurities.com
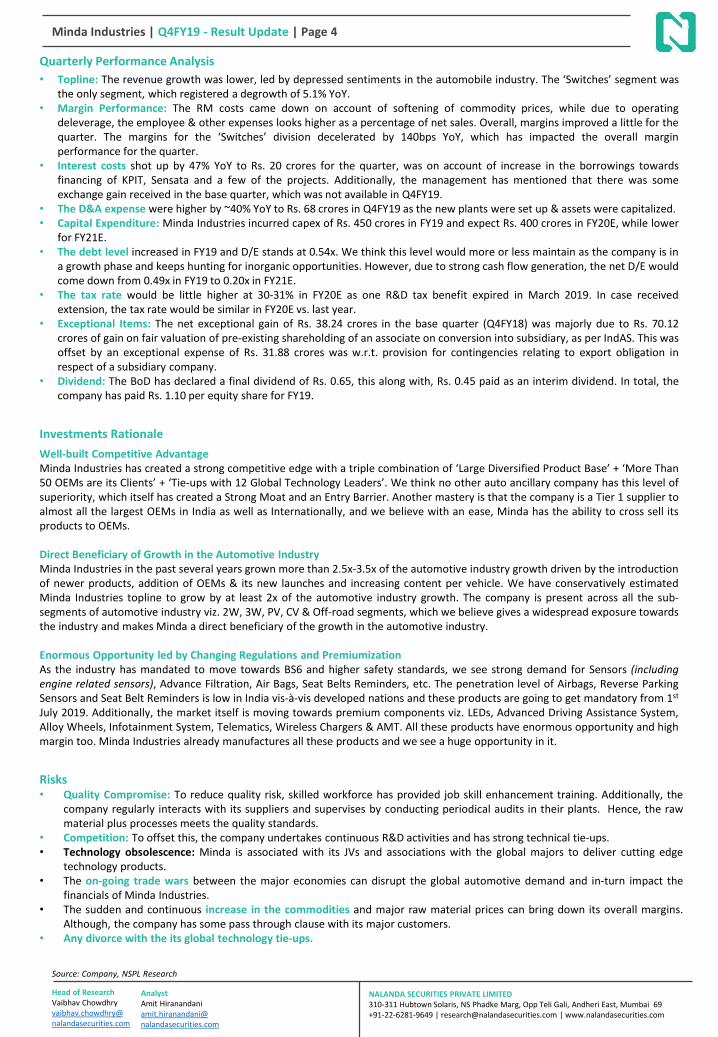
Well-built Competitive AdvantageMinda Industries has created a strong competitive edge with a triple combination of ‘Large Diversified Product Base’ + ‘More Than50 OEMs are its Clients’ + ‘Tie-ups with 12 Global Technology Leaders’. We think no other auto ancillary company has this level ofsuperiority, which itself has created a Strong Moat and an Entry Barrier. Another mastery is that the company is a Tier 1 supplier toalmost all the largest OEMs in India as well as Internationally, and we believe with an ease, Minda has the ability to cross sell itsproducts to OEMs.
Direct Beneficiary of Growth in the Automotive IndustryMinda Industries in the past several years grown more than 2.5x-3.5x of the automotive industry growth driven by the introductionof newer products, addition of OEMs & its new launches and increasing content per vehicle. We have conservatively estimatedMinda Industries topline to grow by at least 2x of the automotive industry growth. The company is present across all the sub-segments of automotive industry viz. 2W, 3W, PV, CV & Off-road segments, which we believe gives a widespread exposure towardsthe industry and makes Minda a direct beneficiary of the growth in the automotive industry.
Enormous Opportunity led by Changing Regulations and PremiumizationAs the industry has mandated to move towards BS6 and higher safety standards, we see strong demand for Sensors (includingengine related sensors), Advance Filtration, Air Bags, Seat Belts Reminders, etc. The penetration level of Airbags, Reverse ParkingSensors and Seat Belt Reminders is low in India vis-à-vis developed nations and these products are going to get mandatory from 1st
July 2019. Additionally, the market itself is moving towards premium components viz. LEDs, Advanced Driving Assistance System,Alloy Wheels, Infotainment System, Telematics, Wireless Chargers & AMT. All these products have enormous opportunity and highmargin too. Minda Industries already manufactures all these products and we see a huge opportunity in it.
Risks• Quality Compromise: To reduce quality risk, skilled workforce has provided job skill enhancement training. Additionally, the
company regularly interacts with its suppliers and supervises by conducting periodical audits in their plants. Hence, the rawmaterial plus processes meets the quality standards.
• Competition: To offset this, the company undertakes continuous R&D activities and has strong technical tie-ups.• Technology obsolescence: Minda is associated with its JVs and associations with the global majors to deliver cutting edge
technology products.• The on-going trade wars between the major economies can disrupt the global automotive demand and in-turn impact the
financials of Minda Industries.• The sudden and continuous increase in the commodities and major raw material prices can bring down its overall margins.
Although, the company has some pass through clause with its major customers.• Any divorce with the its global technology tie-ups.
Minda Industries | Q4FY19 - Result Update | Page 5
Source: Company, NSPL Research
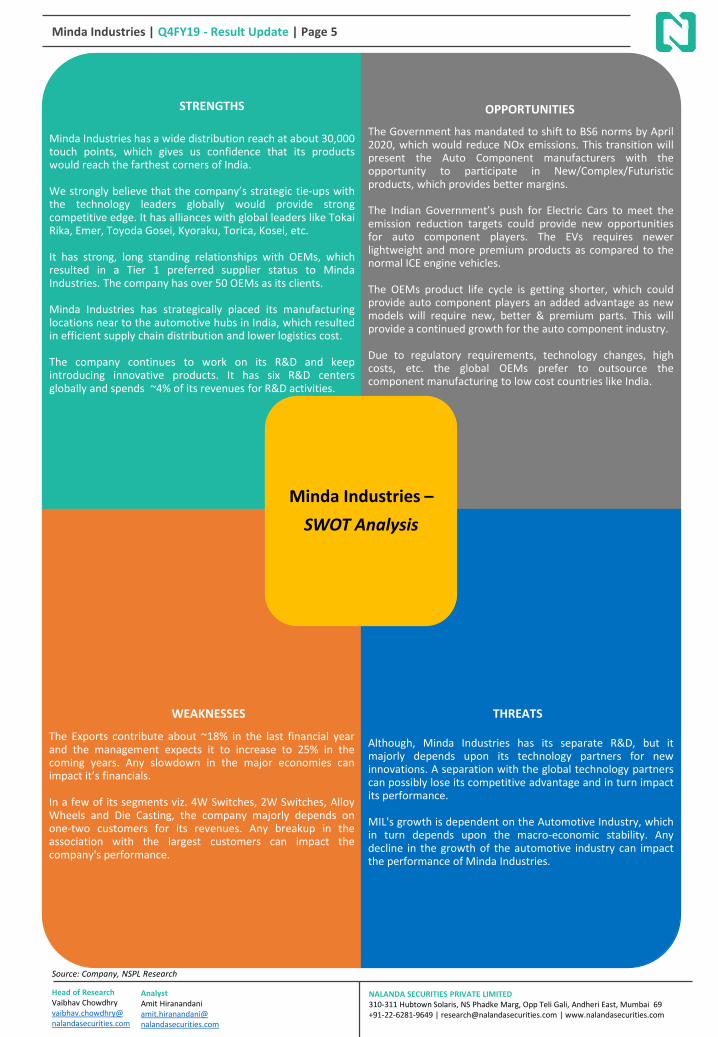
Minda Industries has a wide distribution reach at about 30,000touch points, which gives us confidence that its productswould reach the farthest corners of India.
We strongly believe that the company’s strategic tie-ups withthe technology leaders globally would provide strongcompetitive edge. It has alliances with global leaders like TokaiRika, Emer, Toyoda Gosei, Kyoraku, Torica, Kosei, etc.
It has strong, long standing relationships with OEMs, whichresulted in a Tier 1 preferred supplier status to MindaIndustries. The company has over 50 OEMs as its clients.
Minda Industries has strategically placed its manufacturinglocations near to the automotive hubs in India, which resultedin efficient supply chain distribution and lower logistics cost.
The company continues to work on its R&D and keepintroducing innovative products. It has six R&D centersglobally and spends ~4% of its revenues for R&D activities.
The Government has mandated to shift to BS6 norms by April2020, which would reduce NOx emissions. This transition willpresent the Auto Component manufacturers with theopportunity to participate in New/Complex/Futuristicproducts, which provides better margins.
The Indian Government’s push for Electric Cars to meet theemission reduction targets could provide new opportunitiesfor auto component players. The EVs requires newerlightweight and more premium products as compared to thenormal ICE engine vehicles.
The OEMs product life cycle is getting shorter, which couldprovide auto component players an added advantage as newmodels will require new, better & premium parts. This willprovide a continued growth for the auto component industry.
Due to regulatory requirements, technology changes, highcosts, etc. the global OEMs prefer to outsource thecomponent manufacturing to low cost countries like India.
The Exports contribute about ~18% in the last financial yearand the management expects it to increase to 25% in thecoming years. Any slowdown in the major economies canimpact it’s financials.
In a few of its segments viz. 4W Switches, 2W Switches, AlloyWheels and Die Casting, the company majorly depends onone-two customers for its revenues. Any breakup in theassociation with the largest customers can impact thecompany's performance.
Although, Minda Industries has its separate R&D, but itmajorly depends upon its technology partners for newinnovations. A separation with the global technology partnerscan possibly lose its competitive advantage and in turn impactits performance.
MIL's growth is dependent on the Automotive Industry, whichin turn depends upon the macro-economic stability. Anydecline in the growth of the automotive industry can impactthe performance of Minda Industries.
Minda Industries –
SWOT Analysis
STRENGTHS OPPORTUNITIES
WEAKNESSES THREATS
Head of ResearchVaibhav Chowdhry vaibhav.chowdhry@ nalandasecurities.com
Disclaimer:This report has been prepared by Nalanda Securities Pvt. Ltd(“NSPL”) and published in accordance with the provisions of Regulation 18 of the Securities and Exchange Board of India(Research Analysts) Regulations, 2014, for use by the recipient as information only and is not for circulation or public distribution. NSPL includes subsidiaries, group and associatecompanies, promoters, directors, employees and affiliates. This report is not to be altered, transmitted, reproduced, copied, redistributed, uploaded, published or made available toothers, in any form, in whole or in part, for any purpose without prior written permission from NSPL. The projections and the forecasts described in this report are based upon anumber of estimates and assumptions and are inherently subject to significant uncertainties and contingencies. Projections and forecasts are necessarily speculative in nature, and itcan be expected that one or more of the estimates on which the projections are forecasts were based will not materialize or will vary significantly from actual results and suchvariations will likely increase over the period of time. All the projections and forecasts described in this report have been prepared solely by authors of this report independently.None of the forecasts were prepared with a view towards compliance with published guidelines or generally accepted accounting principles.This report should not be construed as an offer to sell or the solicitation of an offer to buy, purchase or subscribe to any securities, and neither this report nor anything containedtherein shall form the basis of or be relied upon in connection with any contract or commitment whatsoever. It does not constitute a personal recommendation or take into accountthe particular investment objective, financial situation or needs of individual clients. The research analysts of NSPL have adhered to the code of conduct under Regulation 24 (2) ofthe Securities and Exchange Board of India (Research Analysts) Regulations, 2014. The recipients of this report must make their own investment decisions, based on their owninvestment objectives, financial situation or needs and other factors. The recipients should consider and independently evaluate whether it is suitable for its/ his/ her/their particularcircumstances and if necessary, seek professional / financial advice as there is substantial risk of loss. NSPL does not take any responsibility thereof. Any such recipient shall beresponsible for conducting his/her/its/their own investigation and analysis of the information contained or referred to in this report and of evaluating the merits and risks involved insecurities forming the subject matter of this report. The price and value of the investment referred to in this report and income from them may go up as well as down, and investorsmay realize profit/loss on their investments. Past performance is not a guide for future performance. Actual results may differ materially from those set forth in the projection.Except for the historical information contained herein, statements in this report, which contain words such as ‘will’, ‘would’, etc., and similar expressions or variations of such wordsmay constitute ‘forward‐looking statements’. These forward‐looking statements involve a number of risks, uncertainties and other factors that could cause actual results to differmaterially from those suggested by the forward‐looking statements. Forward‐looking statements are not predictions and may be subject to change without notice. NSPL undertakesno obligation to update forward‐looking statements to reflect events or circumstances after the date thereof. NSPL accepts no liabilities for any loss or damage of any kind arising outof use of this report.This report has been prepared by NSPL based upon the information available in the public domain and other public sources believed to be reliable. Though utmost care has beentaken to ensure its accuracy and completeness, no representation or warranty, express or implied is made by NSPL that such information is accurate or complete and/or isindependently verified. The contents of this report represent the assumptions and projections of NSPL and NSPL does not guarantee the accuracy or reliability of any projection,assurances or advice made herein. Nothing in this report constitutes investment, legal, accounting and/or tax advice or a representation that any investment or strategy is suitable orappropriate to recipients’ specific circumstances. This report is based / focused on fundamentals of the Company and forward‐looking statements as such, may not match with areport on a company’s technical analysis report. This report may not be followed by any specific event update/ follow‐up.
Following table contains the disclosure of interest in order to adhere to utmost transparency in the matter;
Disclosure of Interest Statement
Details of Nalanda Securities Pvt. Limited (NSPL)
• NSPL is a Stock Broker registered with BSE, NSE and MCX ‐ SX in all the major
segments viz. Cash, F & O and CDS segments. Further, NSPL is a Registered
Portfolio Manager and is registered with SEBI
• SEBI Registration Number: INH000004617
Details of Disciplinary History of NSPL No disciplinary action is / was running / initiated against NSPL
Research analyst or NSPL or its relatives'/associates' financial interest in
the subject company and nature of such financial interest
No (except to the extent of shares held by Research analyst or NSPL or its
relatives'/associates')
Whether Research analyst or NSPL or its relatives'/associates' is holding
the securities of the subject companyNO
Research analyst or NSPL or its relatives'/associates' actual/beneficial
ownership of 1% or more in securities of the subject company, at the
end of the month immediately preceding the date of publication of the
document
NO
Research analyst or NSPL or its relatives'/associates' any other material
conflict of interest at the time of publication of the documentNO
Has research analyst or NSPL or its associates received any compensation
from the subject company in the past 12 monthsNO
Has research analyst or NSPL or its associates managed or co‐managed
public offering of securities for the subject company in the past 12 monthNO
Has research analyst or NSPL or its associates received any compensation
for investment banking or merchant banking or brokerage services from
the subject company in the past 12 months
NO
Has research analyst or NSPL or its associates received any compensation
for products or services other than investment banking or merchant
banking or brokerage services from the subject company in the past 12
months
NO
Has research analyst or NSPL or its associates received any compensation
or other benefits from the subject company or third party in connection
with the document.
NO
Has research analyst served as an officer, director or employee of the
subject companyNO
Has research analyst or NSPL engaged in market making activity for the
subject companyNO
Other disclosures NO
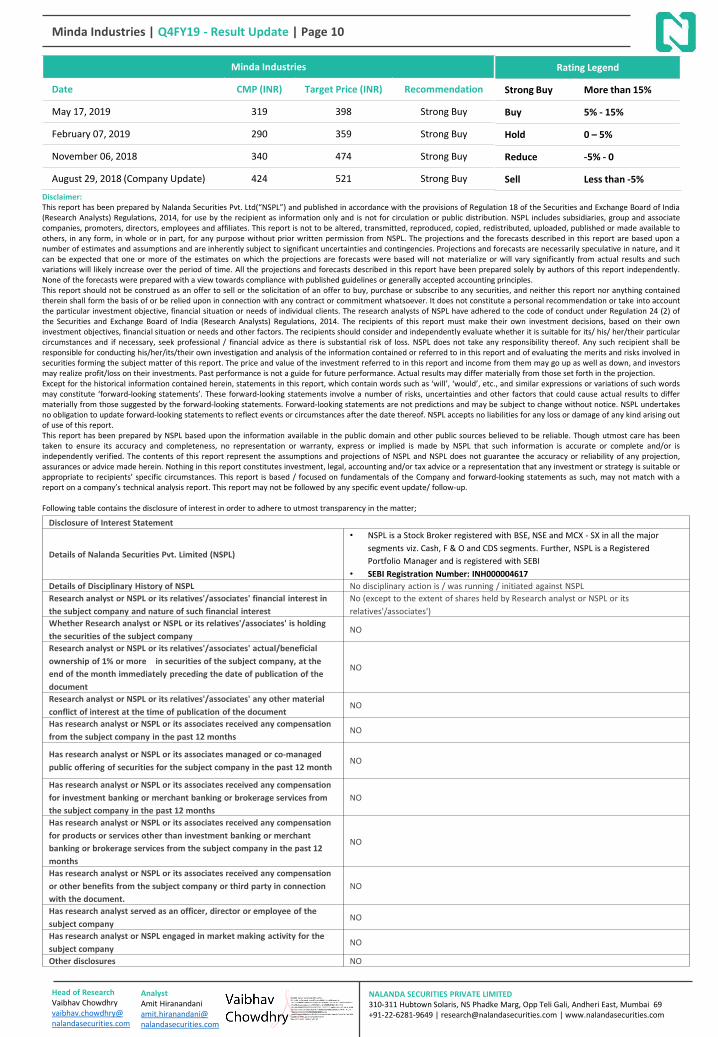
Rating Legend
Strong Buy More than 15%
Buy 5% - 15%
Hold 0 – 5%
Reduce -5% - 0
Sell Less than -5%
Minda Industries
Date CMP (INR) Target Price (INR) Recommendation
May 17, 2019 319 398 Strong Buy
February 07, 2019 290 359 Strong Buy
November 06, 2018 340 474 Strong Buy
August 29, 2018 (Company Update) 424 521 Strong Buy
Minda Industries | Q4FY19 - Result Update | Page 10
Head of ResearchVaibhav Chowdhry vaibhav.chowdhry@ nalandasecurities.com


![Minda Industries Ltd Product Mix ... Diversified OEM Mix* [FY15] Bajaj 33% HMSI 10% MSIL 9% TVS 8% RE 4% Mahindra 4% ... FY11 –Horns division was not a part of Minda ...](https://static.documents.pub/doc/80x56/5ae273337f8b9ae74a8c7a69/minda-industries-ltd-product-mix-diversified-oem-mix-fy15-bajaj-33-hmsi.jpg)


![Minda Industries Ltd. UNOlm]lJ](https://static.documents.pub/doc/80x56/617e3bc246274612c845954f/minda-industries-ltd-unolmlj.jpg)


![Minda Industries Ltd. •[MINDA]€¦ · of the Shareholders and Unsecured Creditors of Minda Industries Limited held on 19 November, 2019, signed by Mr. Raj iv Shankar Dvivedi, Chairman](https://static.documents.pub/doc/80x56/5e99efc05d23463bf8297f0b/minda-industries-ltd-aminda-of-the-shareholders-and-unsecured-creditors-of.jpg)