42
Edelweiss Professional Investor Research Insightful. Independent. Decisive. Minda Industries Ltd Date: 16th April 2019 Vishal Srivastav Research Analyst [email protected]
Edelweiss Professional Investor Research Insightful. Independent. Decisive.
Minda Industries Ltd
Date: 16th April 2019
Vishal Srivastav
Research Analyst
Edelweiss Professional Investor Research
Long Term Recommendation
Minda Industries Ltd Fast and Furious Growth Ahead…
5
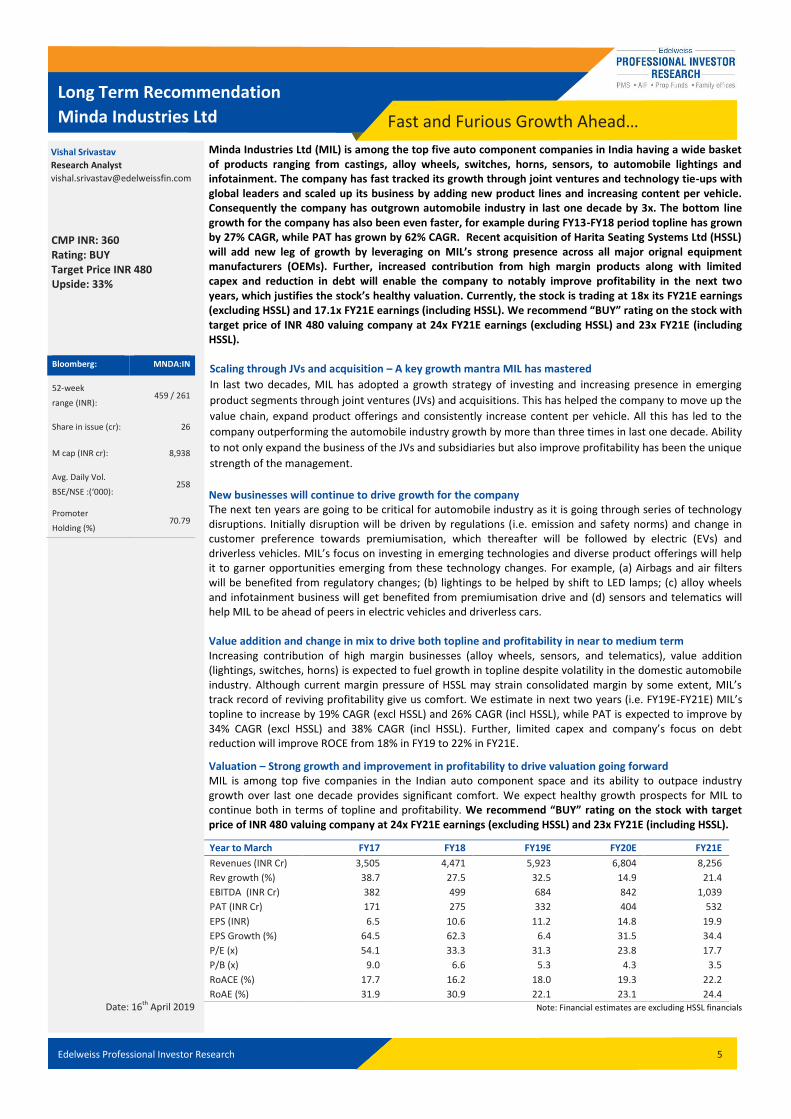
Minda Industries Ltd (MIL) is among the top five auto component companies in India having a wide basket of products ranging from castings, alloy wheels, switches, horns, sensors, to automobile lightings and infotainment. The company has fast tracked its growth through joint ventures and technology tie-ups with global leaders and scaled up its business by adding new product lines and increasing content per vehicle. Consequently the company has outgrown automobile industry in last one decade by 3x. The bottom line growth for the company has also been even faster, for example during FY13-FY18 period topline has grown by 27% CAGR, while PAT has grown by 62% CAGR. Recent acquisition of Harita Seating Systems Ltd (HSSL) will add new leg of growth by leveraging on MIL’s strong presence across all major orignal equipment manufacturers (OEMs). Further, increased contribution from high margin products along with limited capex and reduction in debt will enable the company to notably improve profitability in the next two years, which justifies the stock’s healthy valuation. Currently, the stock is trading at 18x its FY21E earnings (excluding HSSL) and 17.1x FY21E earnings (including HSSL). We recommend “BUY” rating on the stock with target price of INR 480 valuing company at 24x FY21E earnings (excluding HSSL) and 23x FY21E (including HSSL). Scaling through JVs and acquisition – A key growth mantra MIL has mastered
In last two decades, MIL has adopted a growth strategy of investing and increasing presence in emerging
product segments through joint ventures (JVs) and acquisitions. This has helped the company to move up the
value chain, expand product offerings and consistently increase content per vehicle. All this has led to the
company outperforming the automobile industry growth by more than three times in last one decade. Ability
to not only expand the business of the JVs and subsidiaries but also improve profitability has been the unique
strength of the management.
New businesses will continue to drive growth for the company The next ten years are going to be critical for automobile industry as it is going through series of technology disruptions. Initially disruption will be driven by regulations (i.e. emission and safety norms) and change in customer preference towards premiumisation, which thereafter will be followed by electric (EVs) and driverless vehicles. MIL’s focus on investing in emerging technologies and diverse product offerings will help it to garner opportunities emerging from these technology changes. For example, (a) Airbags and air filters will be benefited from regulatory changes; (b) lightings to be helped by shift to LED lamps; (c) alloy wheels and infotainment business will get benefited from premiumisation drive and (d) sensors and telematics will help MIL to be ahead of peers in electric vehicles and driverless cars. Value addition and change in mix to drive both topline and profitability in near to medium term Increasing contribution of high margin businesses (alloy wheels, sensors, and telematics), value addition (lightings, switches, horns) is expected to fuel growth in topline despite volatility in the domestic automobile industry. Although current margin pressure of HSSL may strain consolidated margin by some extent, MIL’s track record of reviving profitability give us comfort. We estimate in next two years (i.e. FY19E-FY21E) MIL’s topline to increase by 19% CAGR (excl HSSL) and 26% CAGR (incl HSSL), while PAT is expected to improve by 34% CAGR (excl HSSL) and 38% CAGR (incl HSSL). Further, limited capex and company’s focus on debt reduction will improve ROCE from 18% in FY19 to 22% in FY21E.
Valuation – Strong growth and improvement in profitability to drive valuation going forward MIL is among top five companies in the Indian auto component space and its ability to outpace industry growth over last one decade provides significant comfort. We expect healthy growth prospects for MIL to continue both in terms of topline and profitability. We recommend “BUY” rating on the stock with target price of INR 480 valuing company at 24x FY21E earnings (excluding HSSL) and 23x FY21E (including HSSL).
Year to March FY17 FY18 FY19E FY20E FY21E
Revenues (INR Cr) 3,505 4,471 5,923 6,804 8,256
Rev growth (%) 38.7 27.5 32.5 14.9 21.4
EBITDA (INR Cr) 382 499 684 842 1,039
PAT (INR Cr) 171 275 332 404 532
EPS (INR) 6.5 10.6 11.2 14.8 19.9
EPS Growth (%) 64.5 62.3 6.4 31.5 34.4
P/E (x) 54.1 33.3 31.3 23.8 17.7
P/B (x) 9.0 6.6 5.3 4.3 3.5
RoACE (%) 17.7 16.2 18.0 19.3 22.2
RoAE (%) 31.9 30.9 22.1 23.1 24.4 Note: Financial estimates are excluding HSSL financials
Vishal Srivastav
Research Analyst
CMP INR: 360 Rating: BUY Target Price INR 480 Upside: 33%
Bloomberg: MNDA:IN
52-week
range (INR): 459 / 261
Share in issue (cr): 26
M cap (INR cr): 8,938
Avg. Daily Vol.
BSE/NSE :(‘000): 258
Promoter
Holding (%) 70.79
Date: 16th April 2019
Edelweiss Professional Investor Research 5
Long Term Recommendation
Minda Industries Ltd Table of Contents
Structure ................................................................................................................................. 5
Focus Charts 1 ......................................................................................................................... 6
Focus Charts 2 ......................................................................................................................... 7
Focus Charts 3 ......................................................................................................................... 8
I. Success Mantras.................................................................................................................... 9
II. Business’ Growth Drivers ..................................................................................................... 13
III. Financial Performance ........................................................................................................ 32
IV. Valuation and Peer Analysis ............................................................................................... 35
Business Model ........................................................................................................................ 37
Financials ................................................................................................................................. 38
Edelweiss Professional Investor Research 5
Long Term Recommendation
Minda Industries Ltd Structure
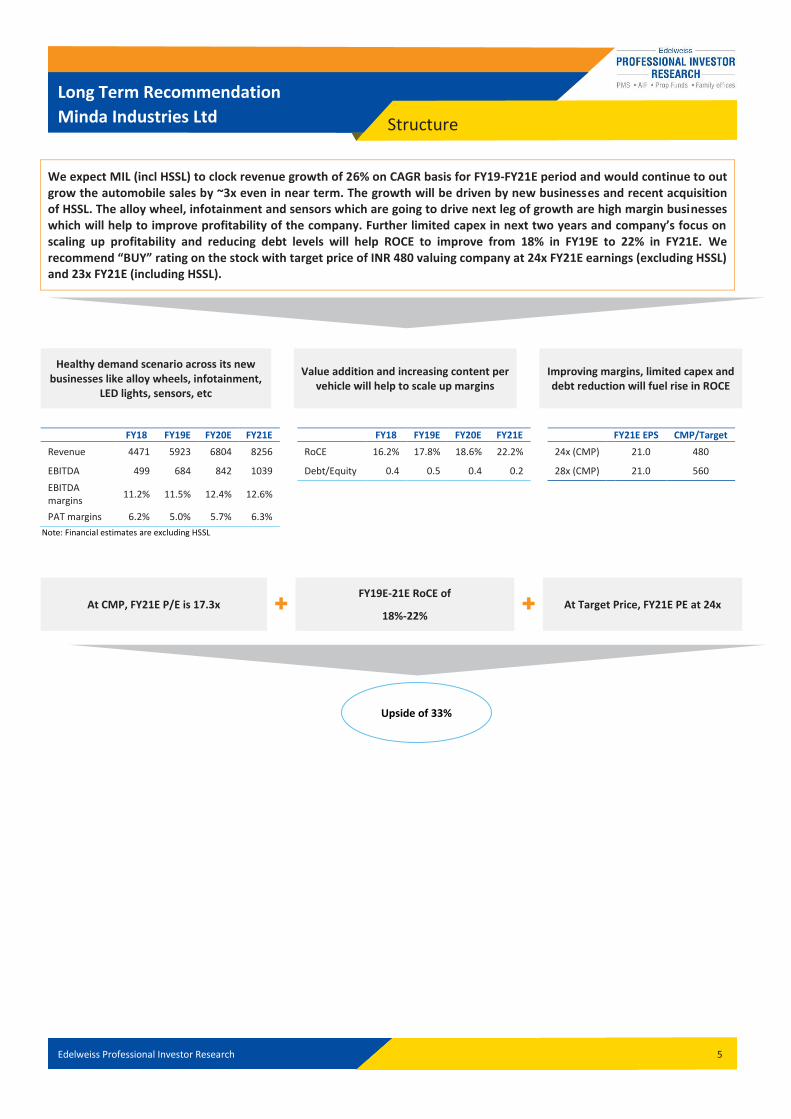
We expect MIL (incl HSSL) to clock revenue growth of 26% on CAGR basis for FY19-FY21E period and would continue to out grow the automobile sales by ~3x even in near term. The growth will be driven by new businesses and recent acquisition of HSSL. The alloy wheel, infotainment and sensors which are going to drive next leg of growth are high margin businesses which will help to improve profitability of the company. Further limited capex in next two years and company’s focus on scaling up profitability and reducing debt levels will help ROCE to improve from 18% in FY19E to 22% in FY21E. We recommend “BUY” rating on the stock with target price of INR 480 valuing company at 24x FY21E earnings (excluding HSSL) and 23x FY21E (including HSSL).
Healthy demand scenario across its new businesses like alloy wheels, infotainment,
LED lights, sensors, etc
Value addition and increasing content per vehicle will help to scale up margins
Improving margins, limited capex and debt reduction will fuel rise in ROCE
FY18 FY19E FY20E FY21E FY18 FY19E FY20E FY21E FY21E EPS CMP/Target
Revenue 4471 5923 6804 8256 RoCE 16.2% 17.8% 18.6% 22.2% 24x (CMP) 21.0 480
EBITDA 499 684 842 1039 Debt/Equity 0.4 0.5 0.4 0.2 28x (CMP) 21.0 560
EBITDA margins
11.2% 11.5% 12.4% 12.6%
PAT margins 6.2% 5.0% 5.7% 6.3%
Note: Financial estimates are excluding HSSL
At CMP, FY21E P/E is 17.3x FY19E-21E RoCE of
18%-22% At Target Price, FY21E PE at 24x
Upside of 33%
Edelweiss Professional Investor Research 6
Minda Industries Limited Focus Charts
I. BUSINESS MODEL
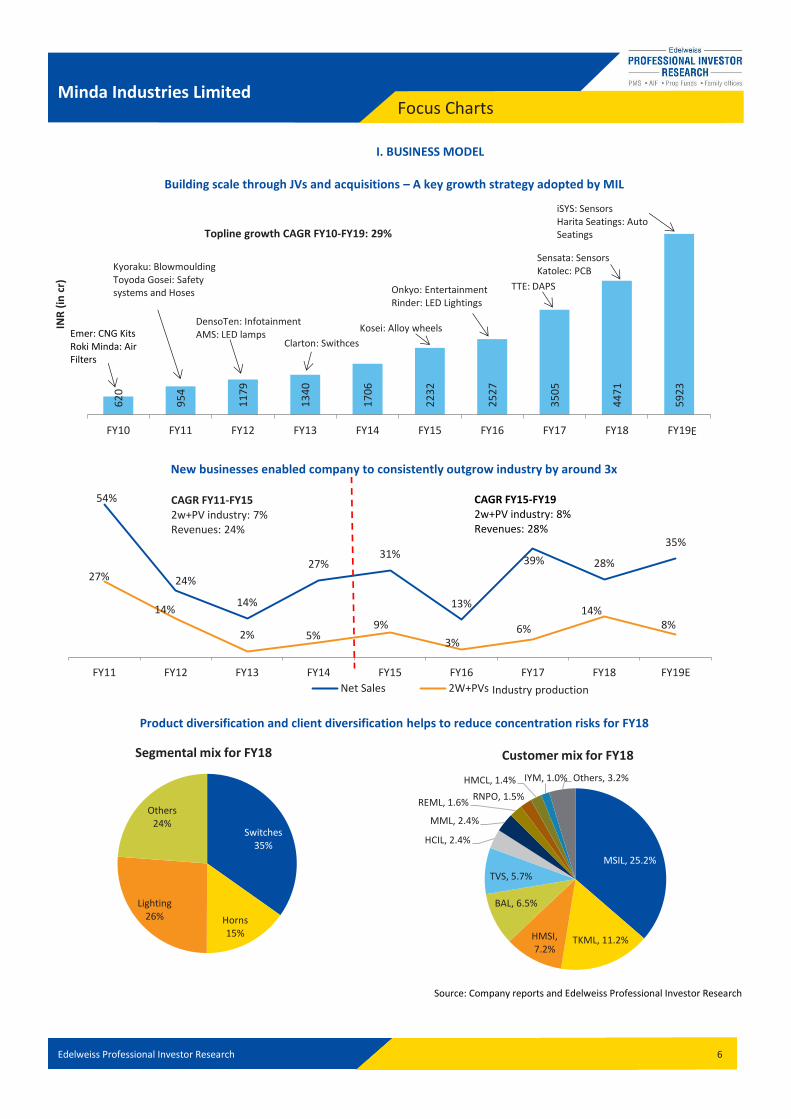
Building scale through JVs and acquisitions – A key growth strategy adopted by MIL
New businesses enabled company to consistently outgrow industry by around 3x
Product diversification and client diversification helps to reduce concentration risks for FY18
Source: Company reports and Edelweiss Professional Investor Research
62
0
95
4
11
79
13
40
17
06
22
32
25
27
35
05
44
71
59
23
FY10 FY11 FY12 FY13 FY14 FY15 FY16 FY17 FY18 FY19
INR
(in
cr)
Emer: CNG Kits Roki Minda: Air Filters
Kyoraku: Blowmoulding Toyoda Gosei: Safety systems and Hoses
DensoTen: Infotainment AMS: LED lamps
Kosei: Alloy wheels
Onkyo: Entertainment Rinder: LED Lightings
TTE: DAPS
Sensata: Sensors Katolec: PCB
iSYS: Sensors Harita Seatings: Auto Seatings
Clarton: Swithces
Topline growth CAGR FY10-FY19: 29%
54%
24%
14%
27% 31%
13%
39% 28%
35%
27%
14%
2% 5% 9%
3% 6%
14% 8%
FY11 FY12 FY13 FY14 FY15 FY16 FY17 FY18 FY19E
Net Sales 2W+PVs
CAGR FY15-FY19 2w+PV industry: 8% Revenues: 28%
CAGR FY11-FY15 2w+PV industry: 7% Revenues: 24%
Industry production
Switches 35%
Horns 15%
Lighting 26%
Others 24%
Segmental mix for FY18
MSIL, 25.2%
TKML, 11.2% HMSI, 7.2%
BAL, 6.5%
TVS, 5.7%
HCIL, 2.4%
MML, 2.4%
REML, 1.6% RNPO, 1.5%
HMCL, 1.4% IYM, 1.0% Others, 3.2%
Customer mix for FY18
E
Edelweiss Professional Investor Research 7
Minda Industries Limited Focus Charts
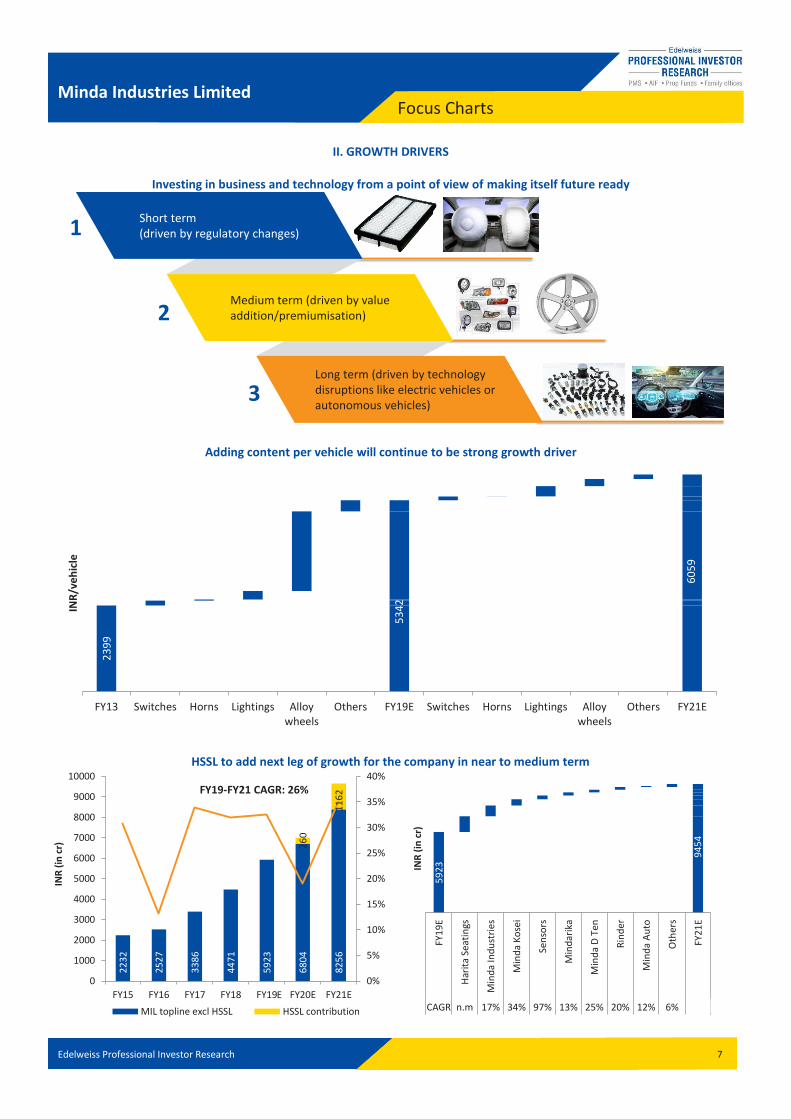
II. GROWTH DRIVERS
Investing in business and technology from a point of view of making itself future ready
Adding content per vehicle will continue to be strong growth driver
HSSL to add next leg of growth for the company in near to medium term
Medium term (driven by value addition/premiumisation)
Short term (driven by regulatory changes)
Long term (driven by technology disruptions like electric vehicles or autonomous vehicles)
1
2
3
23
99
FY13 Switches Horns Lightings Alloywheels
Others FY19E Switches Horns Lightings Alloywheels
Others FY21E
INR
/ve
hic
le
53
42
60
59
22
32
25
27
33
86
44
71
59
23
68
04
82
56
26
0
11
62
0%
5%
10%
15%
20%
25%
30%
35%
40%
0
1000
2000
3000
4000
5000
6000
7000
8000
9000
10000
FY15 FY16 FY17 FY18 FY19 FY20E FY21E
INR
(in
cr)
MIL topline excl HSSL HSSL contribution
FY19-FY21 CAGR: 26%
E
59
23
FY
19
E
Har
ita
Seat
ings
Min
da
Ind
ust
ries
Min
da
Ko
sei
Sen
sors
Min
dar
ika
Min
da
D T
en
Rin
der
Min
da
Au
to
Oth
ers
FY2
1E
CAGR n.m 17% 34% 97% 13% 25% 20% 12% 6% 0%
INR
(in
cr)
94
54
Edelweiss Professional Investor Research 8
Minda Industries Limited Focus Charts
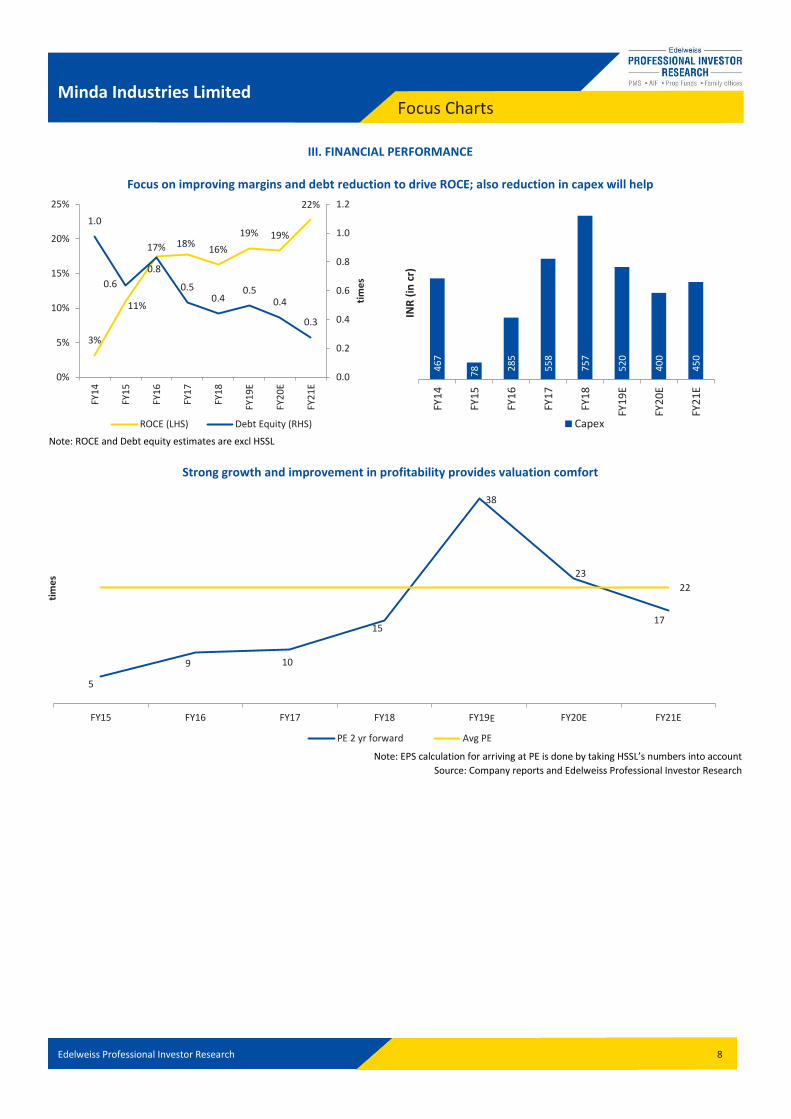
III. FINANCIAL PERFORMANCE
Focus on improving margins and debt reduction to drive ROCE; also reduction in capex will help
Note: ROCE and Debt equity estimates are excl HSSL
Strong growth and improvement in profitability provides valuation comfort
Note: EPS calculation for arriving at PE is done by taking HSSL’s numbers into account
Source: Company reports and Edelweiss Professional Investor Research
3%
11%
17% 18% 16%
19% 19%
22%
1.0
0.6
0.8
0.5 0.4
0.5 0.4
0.3
0.0
0.2
0.4
0.6
0.8
1.0
1.2
0%
5%
10%
15%
20%
25%
FY1
4
FY1
5
FY1
6
FY1
7
FY1
8
FY1
9E
FY2
0E
FY2
1E
tim
es
ROCE (LHS) Debt Equity (RHS)4
67
78
28
5
55
8
75
7
52
0
40
0
45
0
FY1
4
FY1
5
FY1
6
FY1
7
FY1
8
FY1
9E
FY2
0E
FY2
1E
INR
(in
cr)
Capex
5
9 10
15
38
23
17
22
FY15 FY16 FY17 FY18 FY19 FY20E FY21E
tim
es
PE 2 yr forward Avg PE
E
Edelweiss Professional Investor Research 9
Minda Industries Limited Investment Hypothesis
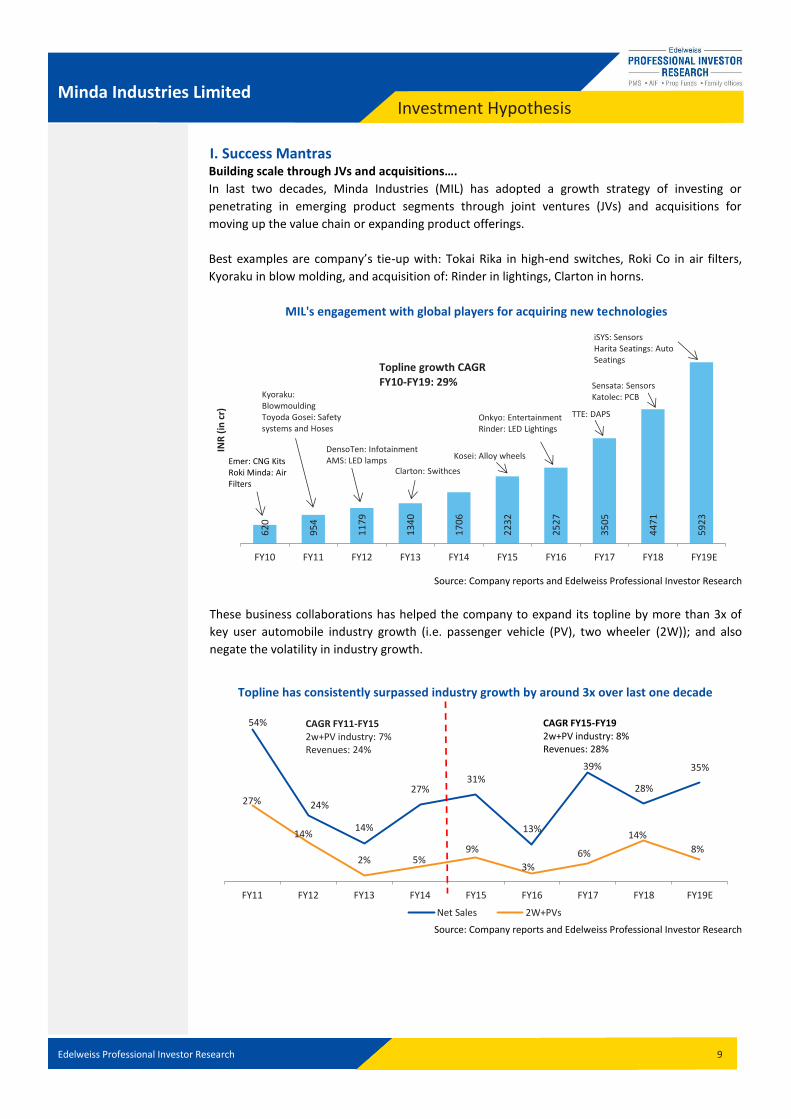
I. Success Mantras Building scale through JVs and acquisitions….
In last two decades, Minda Industries (MIL) has adopted a growth strategy of investing or
penetrating in emerging product segments through joint ventures (JVs) and acquisitions for
moving up the value chain or expanding product offerings.
Best examples are company’s tie-up with: Tokai Rika in high-end switches, Roki Co in air filters,
Kyoraku in blow molding, and acquisition of: Rinder in lightings, Clarton in horns.
MIL's engagement with global players for acquiring new technologies
Source: Company reports and Edelweiss Professional Investor Research
These business collaborations has helped the company to expand its topline by more than 3x of
key user automobile industry growth (i.e. passenger vehicle (PV), two wheeler (2W)); and also
negate the volatility in industry growth.
Topline has consistently surpassed industry growth by around 3x over last one decade
Source: Company reports and Edelweiss Professional Investor Research
62
0
95
4
11
79
13
40
17
06
22
32
25
27
35
05
44
71
59
23
FY10 FY11 FY12 FY13 FY14 FY15 FY16 FY17 FY18 FY19
INR
(in
cr)
Emer: CNG Kits Roki Minda: Air Filters
Kyoraku: Blowmoulding Toyoda Gosei: Safety systems and Hoses
DensoTen: Infotainment AMS: LED lamps Kosei: Alloy wheels
Onkyo: Entertainment Rinder: LED Lightings
TTE: DAPS
Sensata: Sensors Katolec: PCB
iSYS: Sensors Harita Seatings: Auto Seatings
Clarton: Swithces
Topline growth CAGR FY10-FY19: 29%
E
54%
24%
14%
27% 31%
13%
39%
28%
35%
27%
14%
2% 5% 9%
3%
6%
14%
8%
FY11 FY12 FY13 FY14 FY15 FY16 FY17 FY18 FY19E
Net Sales 2W+PVs
CAGR FY15-FY19 2w+PV industry: 8% Revenues: 28%
CAGR FY11-FY15 2w+PV industry: 7% Revenues: 24%
Edelweiss Professional Investor Research 10
Minda Industries Limited Investment Hypothesis
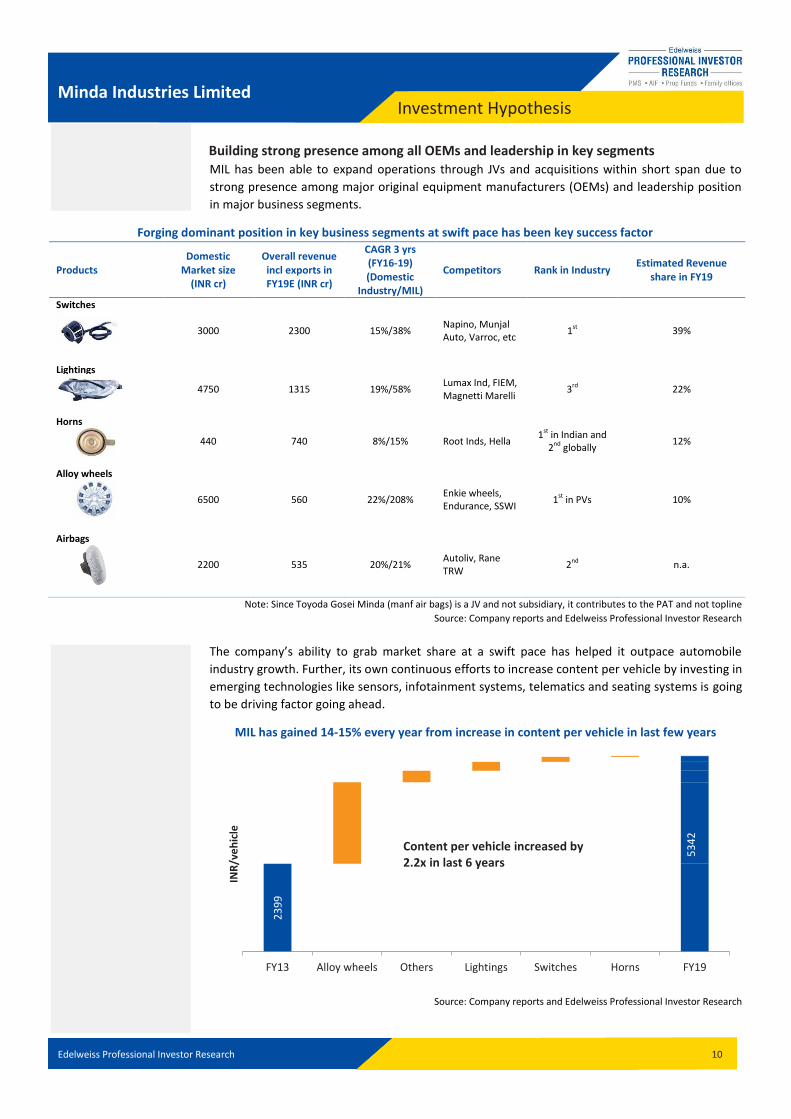
Building strong presence among all OEMs and leadership in key segments MIL has been able to expand operations through JVs and acquisitions within short span due to
strong presence among major original equipment manufacturers (OEMs) and leadership position
in major business segments.
Forging dominant position in key business segments at swift pace has been key success factor
Products Domestic
Market size (INR cr)
Overall revenue incl exports in FY19E (INR cr)
CAGR 3 yrs (FY16-19) (Domestic
Industry/MIL)
Competitors Rank in Industry Estimated Revenue
share in FY19
Switches
3000 2300 15%/38% Napino, Munjal Auto, Varroc, etc
1st 39%
Lightings
4750 1315 19%/58% Lumax Ind, FIEM, Magnetti Marelli
3rd 22%
Horns
440 740 8%/15% Root Inds, Hella 1st in Indian and
2nd globally 12%
Alloy wheels
6500 560 22%/208% Enkie wheels, Endurance, SSWI
1st in PVs 10%
Airbags
2200 535 20%/21% Autoliv, Rane TRW
2nd n.a.
Note: Since Toyoda Gosei Minda (manf air bags) is a JV and not subsidiary, it contributes to the PAT and not topline
Source: Company reports and Edelweiss Professional Investor Research
The company’s ability to grab market share at a swift pace has helped it outpace automobile
industry growth. Further, its own continuous efforts to increase content per vehicle by investing in
emerging technologies like sensors, infotainment systems, telematics and seating systems is going
to be driving factor going ahead.
MIL has gained 14-15% every year from increase in content per vehicle in last few years
Source: Company reports and Edelweiss Professional Investor Research
23
99
FY13 Alloy wheels Others Lightings Switches Horns FY19
INR
/ve
hic
le
Content per vehicle increased by 2.2x in last 6 years
53
42
Edelweiss Professional Investor Research 11
Minda Industries Limited Investment Hypothesis
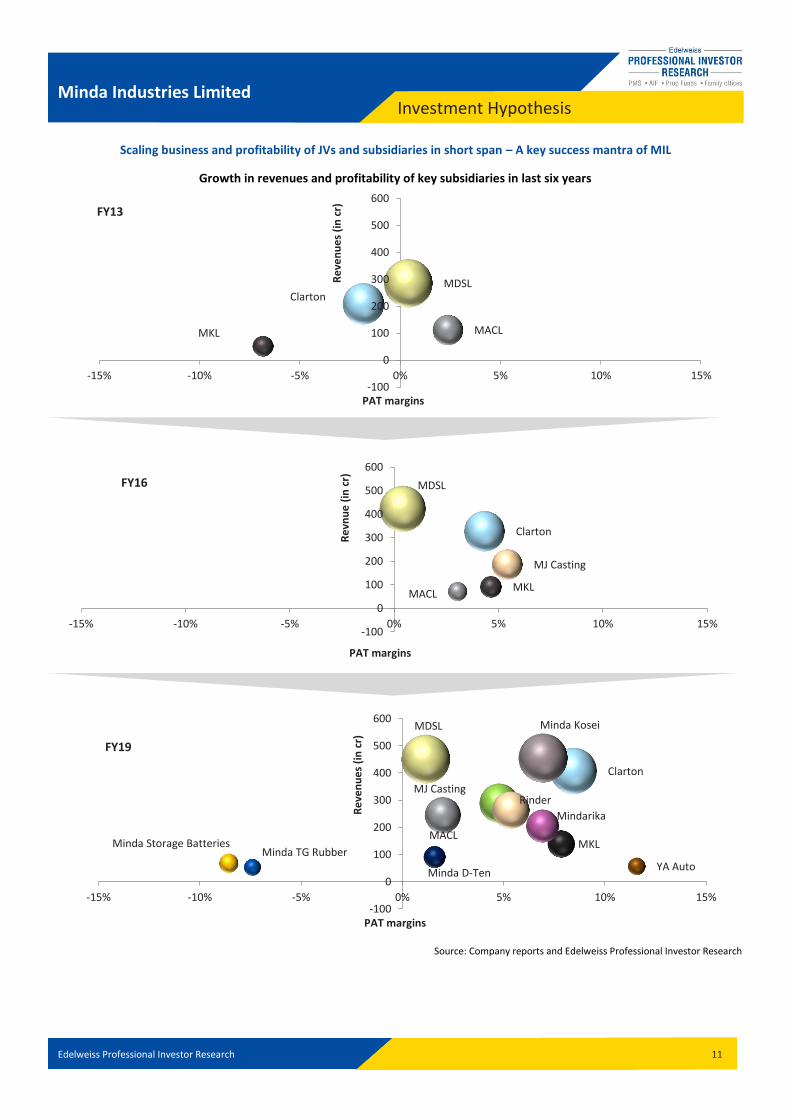
Scaling business and profitability of JVs and subsidiaries in short span – A key success mantra of MIL
Growth in revenues and profitability of key subsidiaries in last six years
Source: Company reports and Edelweiss Professional Investor Research
MACL MKL
MDSL Clarton
-100
0
100
200
300
400
500
600
-15% -10% -5% 0% 5% 10% 15%
Re
ven
ue
s (i
n c
r)
PAT margins
FY13
MACL MKL
MDSL
Clarton
MJ Casting
-100
0
100
200
300
400
500
600
-15% -10% -5% 0% 5% 10% 15%
Re
vnu
e (
in c
r)
PAT margins
FY16
MACL MKL
MDSL
Clarton
Minda TG Rubber
Minda Kosei
MJ Casting
YA Auto
Rinder
Minda Storage Batteries
Minda D-Ten
Mindarika
-100
0
100
200
300
400
500
600
-15% -10% -5% 0% 5% 10% 15%
Re
ven
ue
s (i
n c
r)
PAT margins
FY19
Edelweiss Professional Investor Research 12
Minda Industries Limited Investment Hypothesis
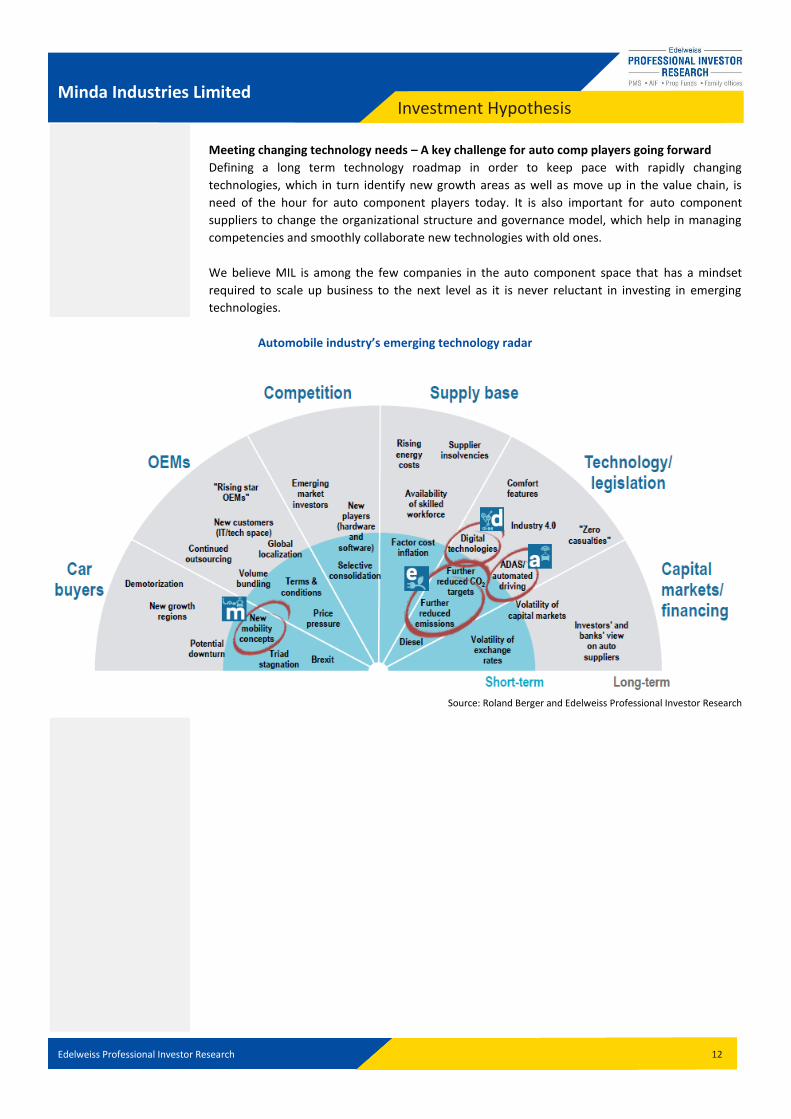
Meeting changing technology needs – A key challenge for auto comp players going forward
Defining a long term technology roadmap in order to keep pace with rapidly changing
technologies, which in turn identify new growth areas as well as move up in the value chain, is
need of the hour for auto component players today. It is also important for auto component
suppliers to change the organizational structure and governance model, which help in managing
competencies and smoothly collaborate new technologies with old ones.
We believe MIL is among the few companies in the auto component space that has a mindset
required to scale up business to the next level as it is never reluctant in investing in emerging
technologies.
Automobile industry’s emerging technology radar
Source: Roland Berger and Edelweiss Professional Investor Research

Edelweiss Professional Investor Research 13
Minda Industries Limited Investment Hypothesis
II. Business’ Growth Drivers
MIL’s diverse product basket in emerging/ new technologies will help to garner the benefits of
potential growth drivers across different time spans. Also, its focus on emerging technologies at
an early stage will help to reduce “go to market” time and consequently gain market share at an
early stage.
MIL getting ready to reap the benefits from different technology changes going forward
Source: Roland Berger and Edelweiss Professional Investor Research
A. Upcoming regulatory changes to drive growth for MIL’s air bags and air filters
business
Domestic automobile industry will be going through slew of regulatory in next one year. Alarming
number of road accidents i.e. 55 accidents out of which 17 deaths every hour forced government
of implement series of regulations related to installation of safety equipment in cars (for example
air bags, reverse parking, sensors, seat belts, etc).
Implementation of emission and safety regulations and timelines
Source: Society of Indian Automobile Manufacturers (SIAM)
Medium term (driven by value addition/premiumisation)
Short term (driven by regulatory changes)
Long term (driven by technology disruptions like electric vehicles or autonomous vehicles)
1
2
3
Edelweiss Professional Investor Research 14
Minda Industries Limited Investment Hypothesis
In addition to safety norms, implementation of BS VI by April 2020 will lead to increased demand
for components that helps in reducing emission levels and also components that helps in
conserving energy.
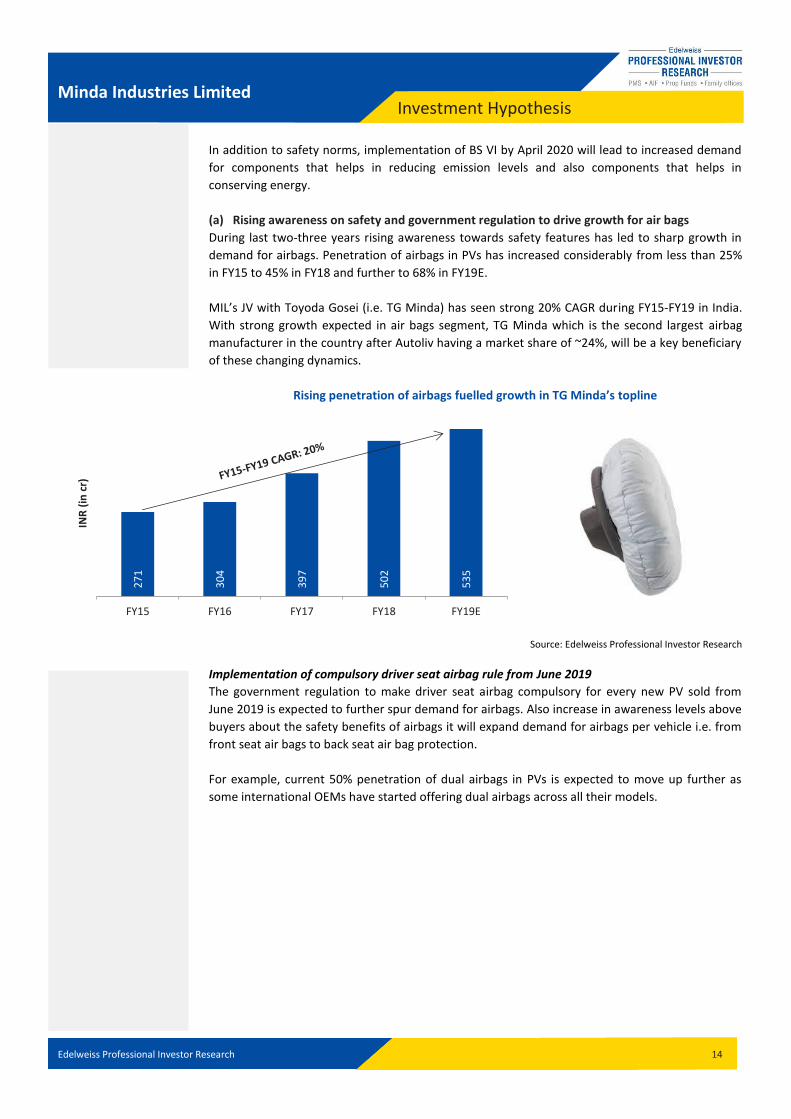
(a) Rising awareness on safety and government regulation to drive growth for air bags
During last two-three years rising awareness towards safety features has led to sharp growth in
demand for airbags. Penetration of airbags in PVs has increased considerably from less than 25%
in FY15 to 45% in FY18 and further to 68% in FY19E.
MIL’s JV with Toyoda Gosei (i.e. TG Minda) has seen strong 20% CAGR during FY15-FY19 in India.
With strong growth expected in air bags segment, TG Minda which is the second largest airbag
manufacturer in the country after Autoliv having a market share of ~24%, will be a key beneficiary
of these changing dynamics.
Rising penetration of airbags fuelled growth in TG Minda’s topline
Source: Edelweiss Professional Investor Research
Implementation of compulsory driver seat airbag rule from June 2019
The government regulation to make driver seat airbag compulsory for every new PV sold from
June 2019 is expected to further spur demand for airbags. Also increase in awareness levels above
buyers about the safety benefits of airbags it will expand demand for airbags per vehicle i.e. from
front seat air bags to back seat air bag protection.
For example, current 50% penetration of dual airbags in PVs is expected to move up further as
some international OEMs have started offering dual airbags across all their models.
27
1
30
4
39
7
50
2
53
5
FY15 FY16 FY17 FY18 FY19E
INR
(in
cr)
Edelweiss Professional Investor Research 15
Minda Industries Limited Investment Hypothesis
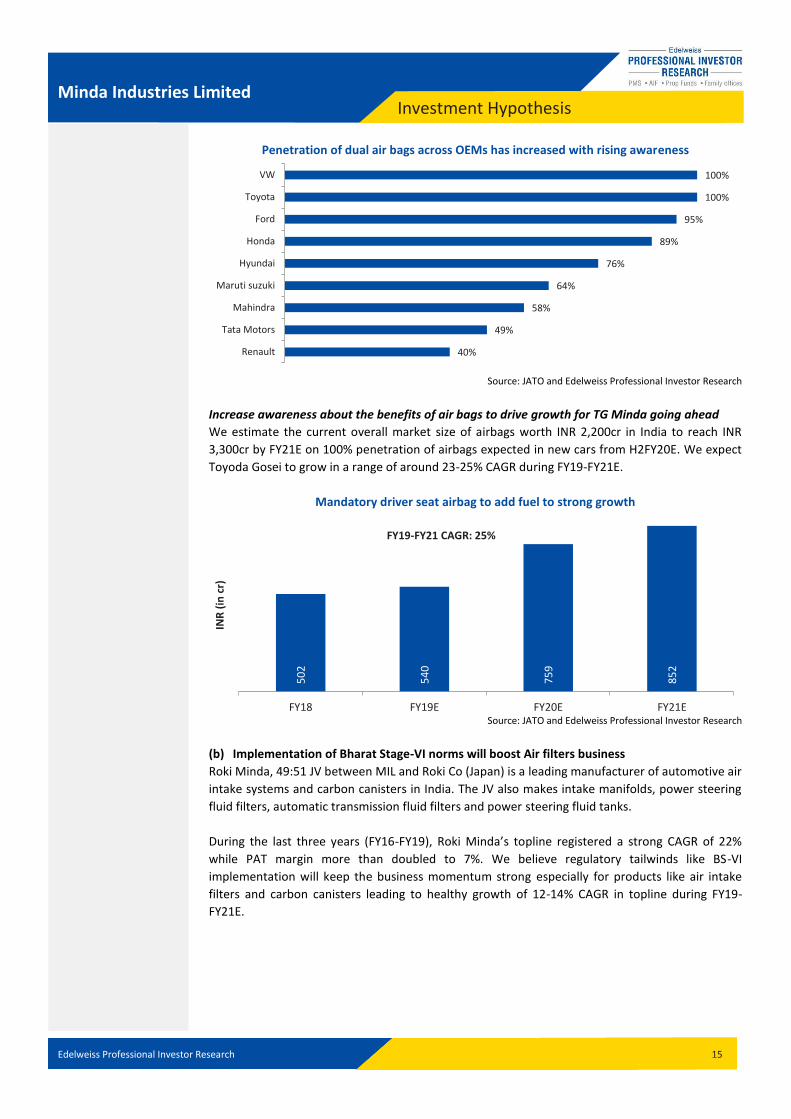
Penetration of dual air bags across OEMs has increased with rising awareness
Source: JATO and Edelweiss Professional Investor Research
Increase awareness about the benefits of air bags to drive growth for TG Minda going ahead
We estimate the current overall market size of airbags worth INR 2,200cr in India to reach INR
3,300cr by FY21E on 100% penetration of airbags expected in new cars from H2FY20E. We expect
Toyoda Gosei to grow in a range of around 23-25% CAGR during FY19-FY21E.
Mandatory driver seat airbag to add fuel to strong growth
Source: JATO and Edelweiss Professional Investor Research
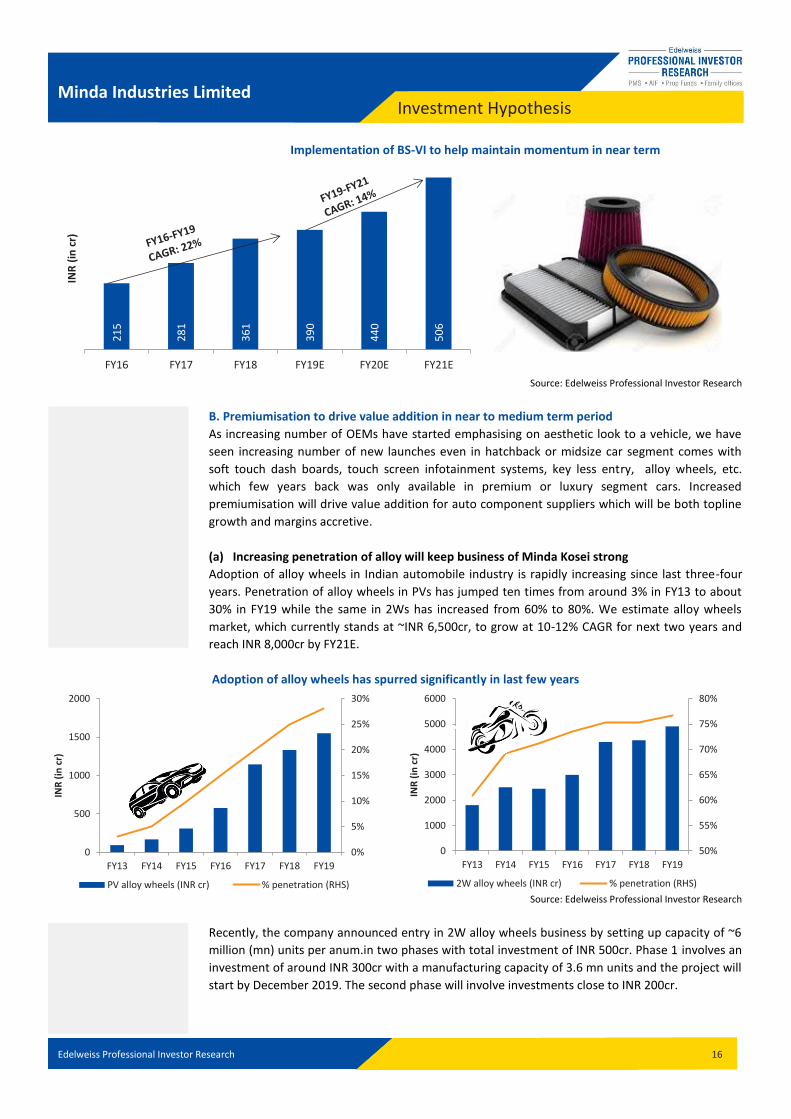
(b) Implementation of Bharat Stage-VI norms will boost Air filters business
Roki Minda, 49:51 JV between MIL and Roki Co (Japan) is a leading manufacturer of automotive air
intake systems and carbon canisters in India. The JV also makes intake manifolds, power steering
fluid filters, automatic transmission fluid filters and power steering fluid tanks.
During the last three years (FY16-FY19), Roki Minda’s topline registered a strong CAGR of 22%
while PAT margin more than doubled to 7%. We believe regulatory tailwinds like BS-VI
implementation will keep the business momentum strong especially for products like air intake
filters and carbon canisters leading to healthy growth of 12-14% CAGR in topline during FY19-
FY21E.
40%
49%
58%
64%
76%
89%
95%
100%
100%
Renault
Tata Motors
Mahindra
Maruti suzuki
Hyundai
Honda
Ford
Toyota
VW
50
2
54
0
75
9
85
2
FY18 FY19E FY20E FY21E
INR
(in
cr)
FY19-FY21 CAGR: 25%
Edelweiss Professional Investor Research 16
Minda Industries Limited Investment Hypothesis
Implementation of BS-VI to help maintain momentum in near term
Source: Edelweiss Professional Investor Research
B. Premiumisation to drive value addition in near to medium term period
As increasing number of OEMs have started emphasising on aesthetic look to a vehicle, we have
seen increasing number of new launches even in hatchback or midsize car segment comes with
soft touch dash boards, touch screen infotainment systems, key less entry, alloy wheels, etc.
which few years back was only available in premium or luxury segment cars. Increased
premiumisation will drive value addition for auto component suppliers which will be both topline
growth and margins accretive.
(a) Increasing penetration of alloy will keep business of Minda Kosei strong
Adoption of alloy wheels in Indian automobile industry is rapidly increasing since last three-four
years. Penetration of alloy wheels in PVs has jumped ten times from around 3% in FY13 to about
30% in FY19 while the same in 2Ws has increased from 60% to 80%. We estimate alloy wheels
market, which currently stands at ~INR 6,500cr, to grow at 10-12% CAGR for next two years and
reach INR 8,000cr by FY21E.
Adoption of alloy wheels has spurred significantly in last few years
Source: Edelweiss Professional Investor Research
Recently, the company announced entry in 2W alloy wheels business by setting up capacity of ~6
million (mn) units per anum.in two phases with total investment of INR 500cr. Phase 1 involves an
investment of around INR 300cr with a manufacturing capacity of 3.6 mn units and the project will
start by December 2019. The second phase will involve investments close to INR 200cr.
21
5
28
1
36
1
39
0
44
0
50
6
FY16 FY17 FY18 FY19E FY20E FY21E
INR
(in
cr)
0%
5%
10%
15%
20%
25%
30%
0
500
1000
1500
2000
FY13 FY14 FY15 FY16 FY17 FY18 FY19
INR
(in
cr)
PV alloy wheels (INR cr) % penetration (RHS)
50%
55%
60%
65%
70%
75%
80%
0
1000
2000
3000
4000
5000
6000
FY13 FY14 FY15 FY16 FY17 FY18 FY19
INR
(in
cr)
2W alloy wheels (INR cr) % penetration (RHS)
Edelweiss Professional Investor Research 17
Minda Industries Limited Investment Hypothesis
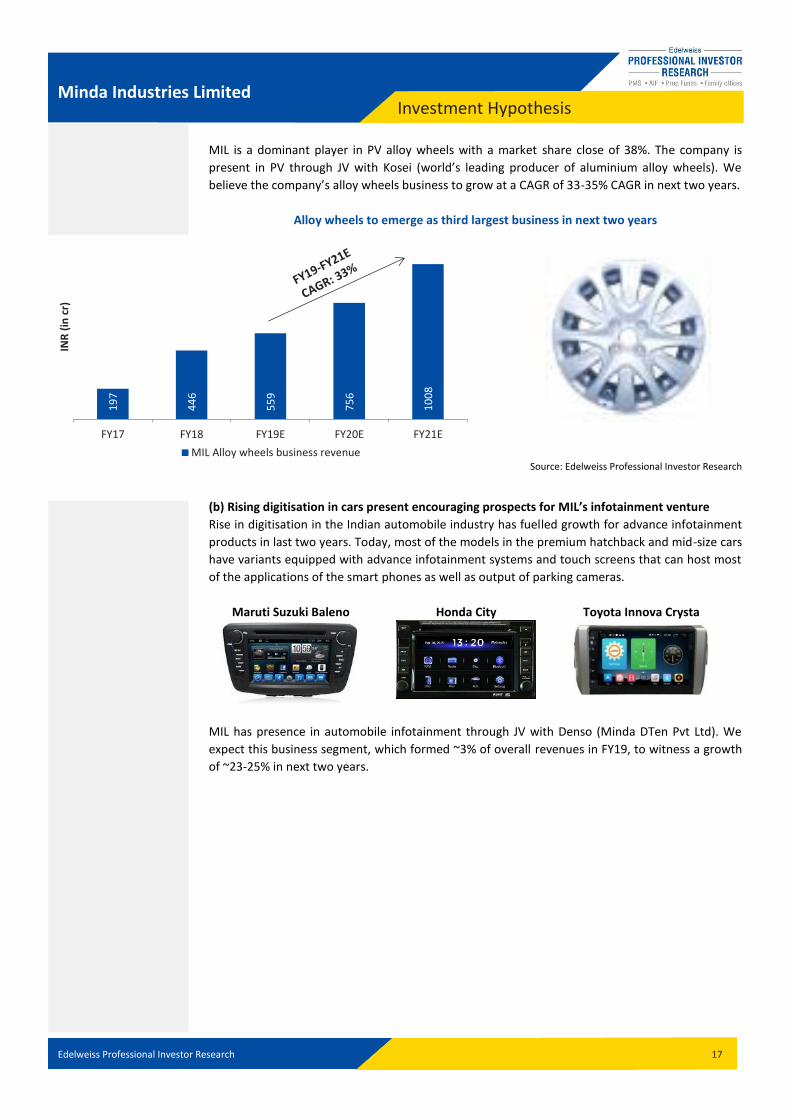
MIL is a dominant player in PV alloy wheels with a market share close of 38%. The company is
present in PV through JV with Kosei (world’s leading producer of aluminium alloy wheels). We
believe the company’s alloy wheels business to grow at a CAGR of 33-35% CAGR in next two years.
Alloy wheels to emerge as third largest business in next two years
Source: Edelweiss Professional Investor Research
(b) Rising digitisation in cars present encouraging prospects for MIL’s infotainment venture
Rise in digitisation in the Indian automobile industry has fuelled growth for advance infotainment
products in last two years. Today, most of the models in the premium hatchback and mid-size cars
have variants equipped with advance infotainment systems and touch screens that can host most
of the applications of the smart phones as well as output of parking cameras.
Maruti Suzuki Baleno
Honda City
Toyota Innova Crysta
MIL has presence in automobile infotainment through JV with Denso (Minda DTen Pvt Ltd). We
expect this business segment, which formed ~3% of overall revenues in FY19, to witness a growth
of ~23-25% in next two years.
19
7
44
6
55
9
75
6
10
08
FY17 FY18 FY19E FY20E FY21E
INR
(in
cr)
MIL Alloy wheels business revenue
Edelweiss Professional Investor Research 18
Minda Industries Limited Investment Hypothesis
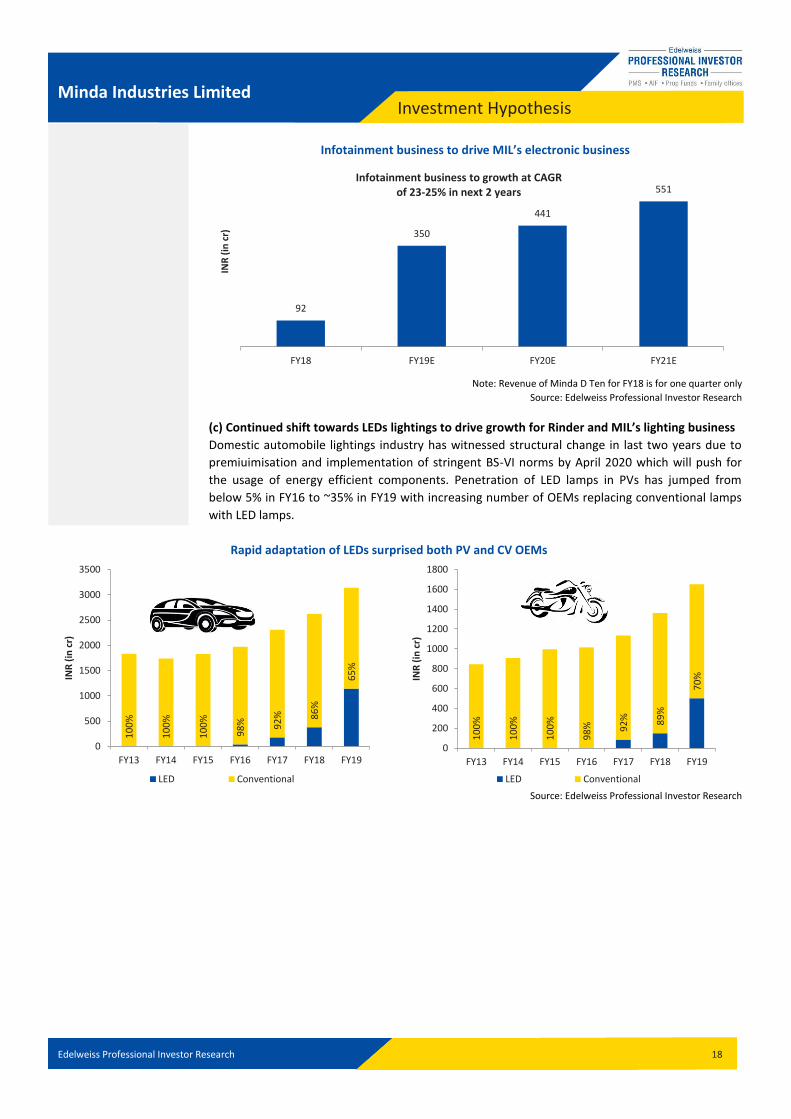
Infotainment business to drive MIL’s electronic business
Note: Revenue of Minda D Ten for FY18 is for one quarter only
Source: Edelweiss Professional Investor Research
(c) Continued shift towards LEDs lightings to drive growth for Rinder and MIL’s lighting business
Domestic automobile lightings industry has witnessed structural change in last two years due to
premiuimisation and implementation of stringent BS-VI norms by April 2020 which will push for
the usage of energy efficient components. Penetration of LED lamps in PVs has jumped from
below 5% in FY16 to ~35% in FY19 with increasing number of OEMs replacing conventional lamps
with LED lamps.
Rapid adaptation of LEDs surprised both PV and CV OEMs
Source: Edelweiss Professional Investor Research
92
350
441
551
FY18 FY19E FY20E FY21E
INR
(in
cr)
Infotainment business to growth at CAGR of 23-25% in next 2 years
10
0%
10
0%
10
0%
98
%
92
%
86
%
65
%
0
500
1000
1500
2000
2500
3000
3500
FY13 FY14 FY15 FY16 FY17 FY18 FY19
INR
(in
cr)
LED Conventional
10
0%
10
0%
10
0%
98
%
92
%
89
%
70
%
0
200
400
600
800
1000
1200
1400
1600
1800
FY13 FY14 FY15 FY16 FY17 FY18 FY19
INR
(in
cr)
LED Conventional
Edelweiss Professional Investor Research 19
Minda Industries Limited Investment Hypothesis
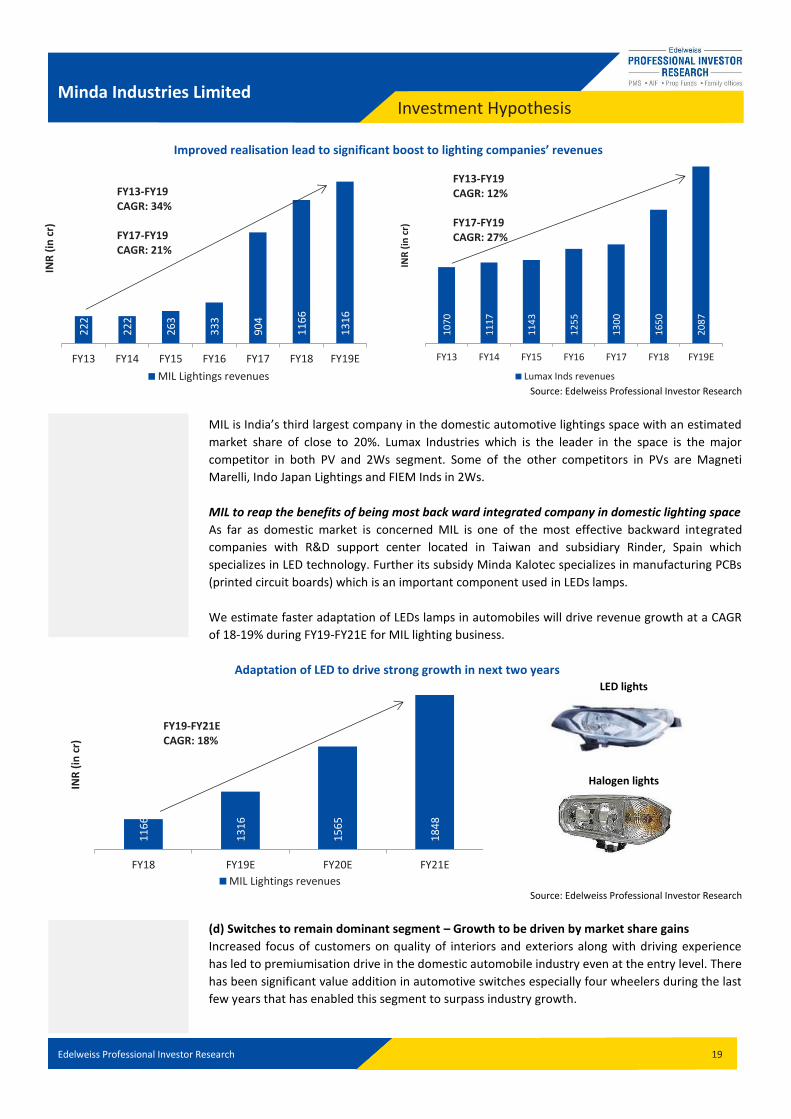
Improved realisation lead to significant boost to lighting companies’ revenues
Source: Edelweiss Professional Investor Research
MIL is India’s third largest company in the domestic automotive lightings space with an estimated
market share of close to 20%. Lumax Industries which is the leader in the space is the major
competitor in both PV and 2Ws segment. Some of the other competitors in PVs are Magneti
Marelli, Indo Japan Lightings and FIEM Inds in 2Ws.
MIL to reap the benefits of being most back ward integrated company in domestic lighting space
As far as domestic market is concerned MIL is one of the most effective backward integrated
companies with R&D support center located in Taiwan and subsidiary Rinder, Spain which
specializes in LED technology. Further its subsidy Minda Kalotec specializes in manufacturing PCBs
(printed circuit boards) which is an important component used in LEDs lamps.
We estimate faster adaptation of LEDs lamps in automobiles will drive revenue growth at a CAGR
of 18-19% during FY19-FY21E for MIL lighting business.
Adaptation of LED to drive strong growth in next two years
LED lights
Halogen lights
Source: Edelweiss Professional Investor Research
(d) Switches to remain dominant segment – Growth to be driven by market share gains
Increased focus of customers on quality of interiors and exteriors along with driving experience
has led to premiumisation drive in the domestic automobile industry even at the entry level. There
has been significant value addition in automotive switches especially four wheelers during the last
few years that has enabled this segment to surpass industry growth.
10
70
11
17
11
43
12
55
13
00
16
50
20
87
FY13 FY14 FY15 FY16 FY17 FY18 FY19E
INR
(in
cr)
Lumax Inds revenues
FY13-FY19 CAGR: 12% FY17-FY19 CAGR: 27%
22
2
22
2
26
3
33
3
90
4
11
66
13
16
FY13 FY14 FY15 FY16 FY17 FY18 FY19E
INR
(in
cr)
MIL Lightings revenues
FY13-FY19 CAGR: 34% FY17-FY19 CAGR: 21%
11
66
13
16
15
65
18
48
FY18 FY19E FY20E FY21E
INR
(in
cr)
MIL Lightings revenues
FY19-FY21E CAGR: 18%
Edelweiss Professional Investor Research 20
Minda Industries Limited Investment Hypothesis
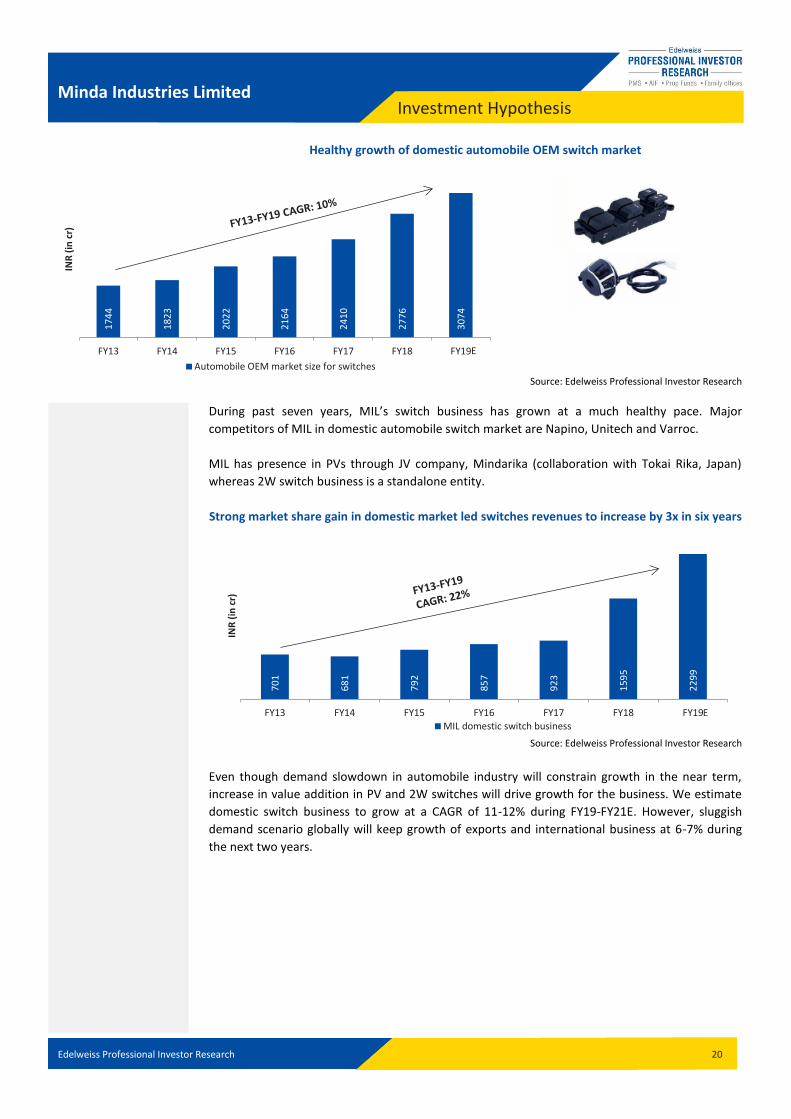
Healthy growth of domestic automobile OEM switch market
Source: Edelweiss Professional Investor Research
During past seven years, MIL’s switch business has grown at a much healthy pace. Major
competitors of MIL in domestic automobile switch market are Napino, Unitech and Varroc.
MIL has presence in PVs through JV company, Mindarika (collaboration with Tokai Rika, Japan)
whereas 2W switch business is a standalone entity.
Strong market share gain in domestic market led switches revenues to increase by 3x in six years
Source: Edelweiss Professional Investor Research
Even though demand slowdown in automobile industry will constrain growth in the near term,
increase in value addition in PV and 2W switches will drive growth for the business. We estimate
domestic switch business to grow at a CAGR of 11-12% during FY19-FY21E. However, sluggish
demand scenario globally will keep growth of exports and international business at 6-7% during
the next two years.
17
44
18
23
20
22
21
64
24
10
27
76
30
74
FY13 FY14 FY15 FY16 FY17 FY18 FY19
INR
(in
cr)
Automobile OEM market size for switches
E
70
1
68
1
79
2
85
7
92
3
15
95
22
99
FY13 FY14 FY15 FY16 FY17 FY18 FY19
INR
(in
cr)
MIL domestic switch businessE
Edelweiss Professional Investor Research 21
Minda Industries Limited Investment Hypothesis
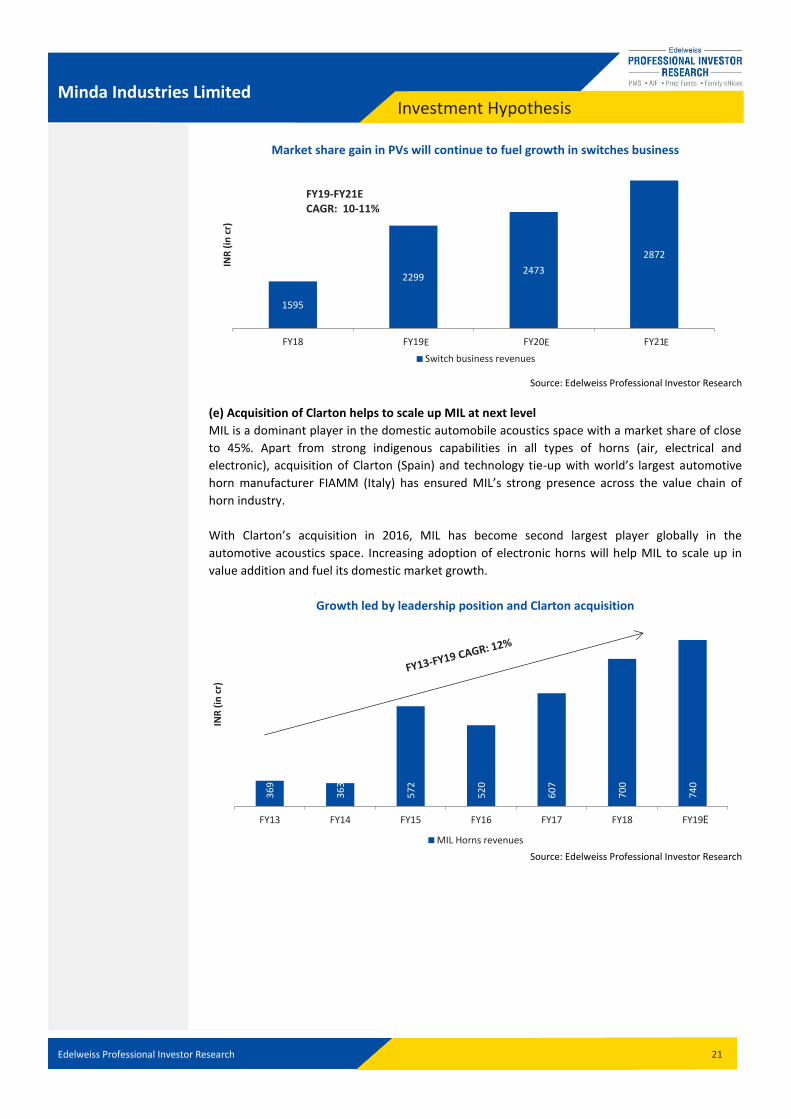
Market share gain in PVs will continue to fuel growth in switches business
Source: Edelweiss Professional Investor Research
(e) Acquisition of Clarton helps to scale up MIL at next level
MIL is a dominant player in the domestic automobile acoustics space with a market share of close
to 45%. Apart from strong indigenous capabilities in all types of horns (air, electrical and
electronic), acquisition of Clarton (Spain) and technology tie-up with world’s largest automotive
horn manufacturer FIAMM (Italy) has ensured MIL’s strong presence across the value chain of
horn industry.
With Clarton’s acquisition in 2016, MIL has become second largest player globally in the
automotive acoustics space. Increasing adoption of electronic horns will help MIL to scale up in
value addition and fuel its domestic market growth.
Growth led by leadership position and Clarton acquisition
Source: Edelweiss Professional Investor Research
36
9
36
3
57
2
52
0
60
7
70
0
74
0
FY13 FY14 FY15 FY16 FY17 FY18 FY19
INR
(in
cr)
MIL Horns revenues
E
1595
2299 2473
2872
FY18 FY19 FY20 FY21
INR
(in
cr)
Switch business revenues
FY19-FY21E CAGR: 10-11%
E E E
Edelweiss Professional Investor Research 22
Minda Industries Limited Investment Hypothesis
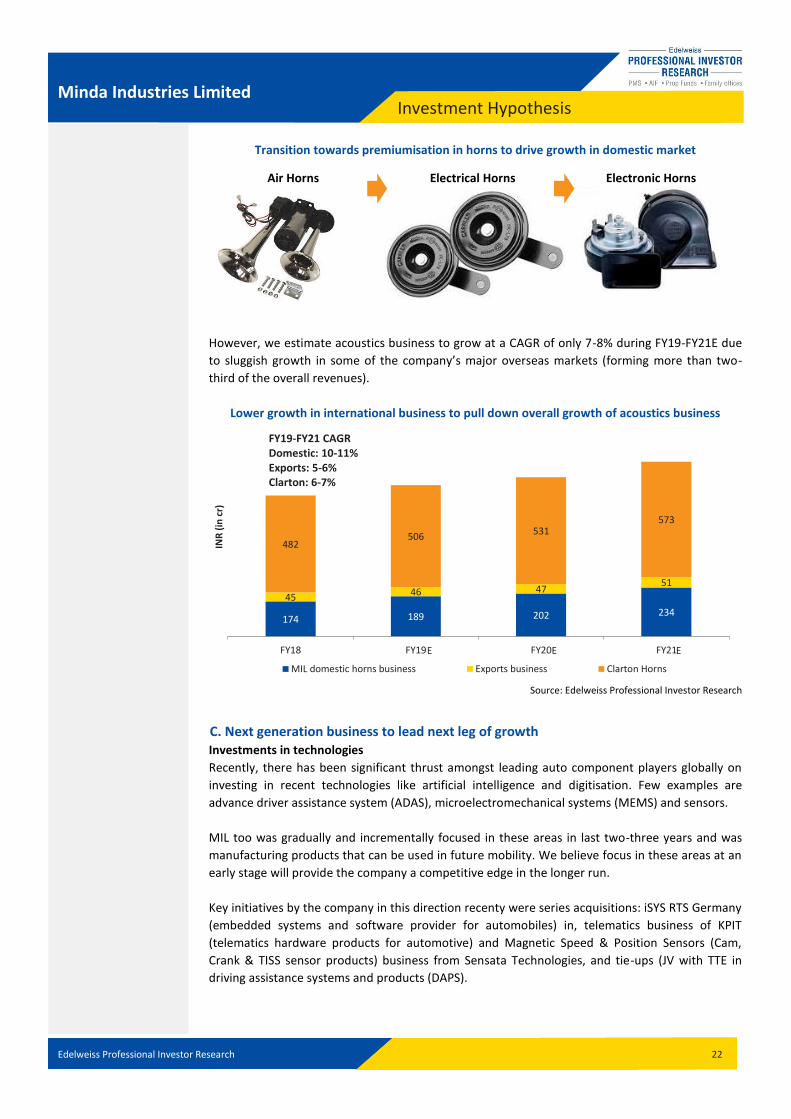
Transition towards premiumisation in horns to drive growth in domestic market
Air Horns
Electrical Horns
Electronic Horns
However, we estimate acoustics business to grow at a CAGR of only 7-8% during FY19-FY21E due
to sluggish growth in some of the company’s major overseas markets (forming more than two-
third of the overall revenues).
Lower growth in international business to pull down overall growth of acoustics business
Source: Edelweiss Professional Investor Research
C. Next generation business to lead next leg of growth Investments in technologies
Recently, there has been significant thrust amongst leading auto component players globally on
investing in recent technologies like artificial intelligence and digitisation. Few examples are
advance driver assistance system (ADAS), microelectromechanical systems (MEMS) and sensors.
MIL too was gradually and incrementally focused in these areas in last two-three years and was
manufacturing products that can be used in future mobility. We believe focus in these areas at an
early stage will provide the company a competitive edge in the longer run.
Key initiatives by the company in this direction recenty were series acquisitions: iSYS RTS Germany
(embedded systems and software provider for automobiles) in, telematics business of KPIT
(telematics hardware products for automotive) and Magnetic Speed & Position Sensors (Cam,
Crank & TISS sensor products) business from Sensata Technologies, and tie-ups (JV with TTE in
driving assistance systems and products (DAPS).
174 189 202 234
45 46 47
51
482 506
531 573
FY18 FY19 FY20 FY21
INR
(in
cr)
MIL domestic horns business Exports business Clarton Horns
FY19-FY21 CAGR Domestic: 10-11% Exports: 5-6% Clarton: 6-7%
E E E
Edelweiss Professional Investor Research 23
Minda Industries Limited Investment Hypothesis
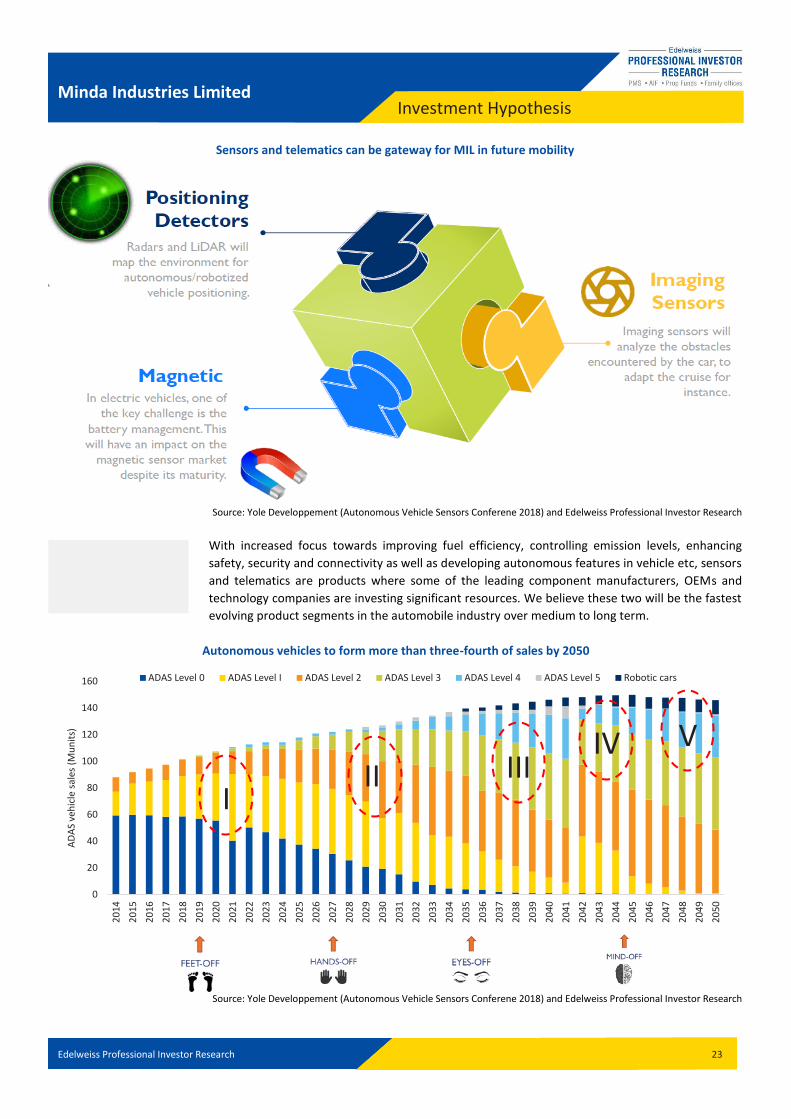
Sensors and telematics can be gateway for MIL in future mobility
Source: Yole Developpement (Autonomous Vehicle Sensors Conferene 2018) and Edelweiss Professional Investor Research
With increased focus towards improving fuel efficiency, controlling emission levels, enhancing
safety, security and connectivity as well as developing autonomous features in vehicle etc, sensors
and telematics are products where some of the leading component manufacturers, OEMs and
technology companies are investing significant resources. We believe these two will be the fastest
evolving product segments in the automobile industry over medium to long term.
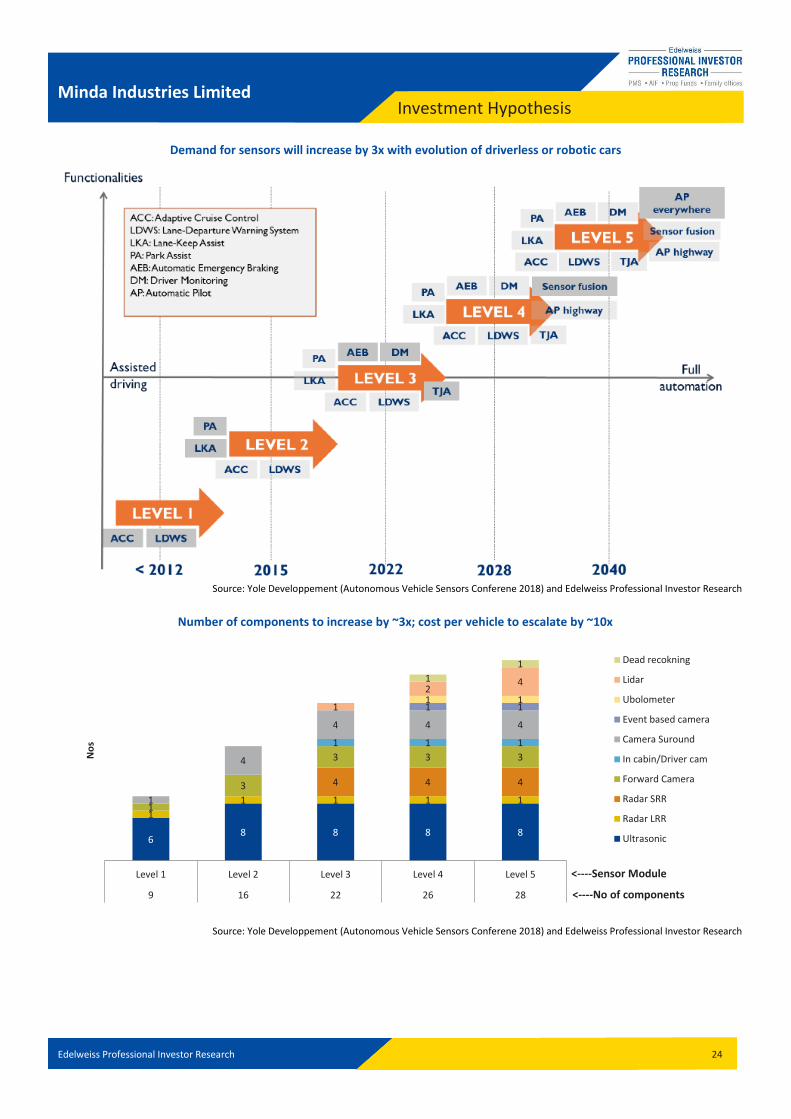
Autonomous vehicles to form more than three-fourth of sales by 2050
Source: Yole Developpement (Autonomous Vehicle Sensors Conferene 2018) and Edelweiss Professional Investor Research
0
20
40
60
80
100
120
140
160
20
14
20
15
20
16
20
17
20
18
20
19
20
20
20
21
20
22
20
23
20
24
20
25
20
26
20
27
20
28
20
29
20
30
20
31
20
32
20
33
20
34
20
35
20
36
20
37
20
38
20
39
20
40
20
41
20
42
20
43
20
44
20
45
20
46
20
47
20
48
20
49
20
50
AD
AS
veh
icle
sal
es (
Mu
nit
s)
ADAS Level 0 ADAS Level I ADAS Level 2 ADAS Level 3 ADAS Level 4 ADAS Level 5 Robotic cars
I II III
IV V
Edelweiss Professional Investor Research 24
Minda Industries Limited Investment Hypothesis
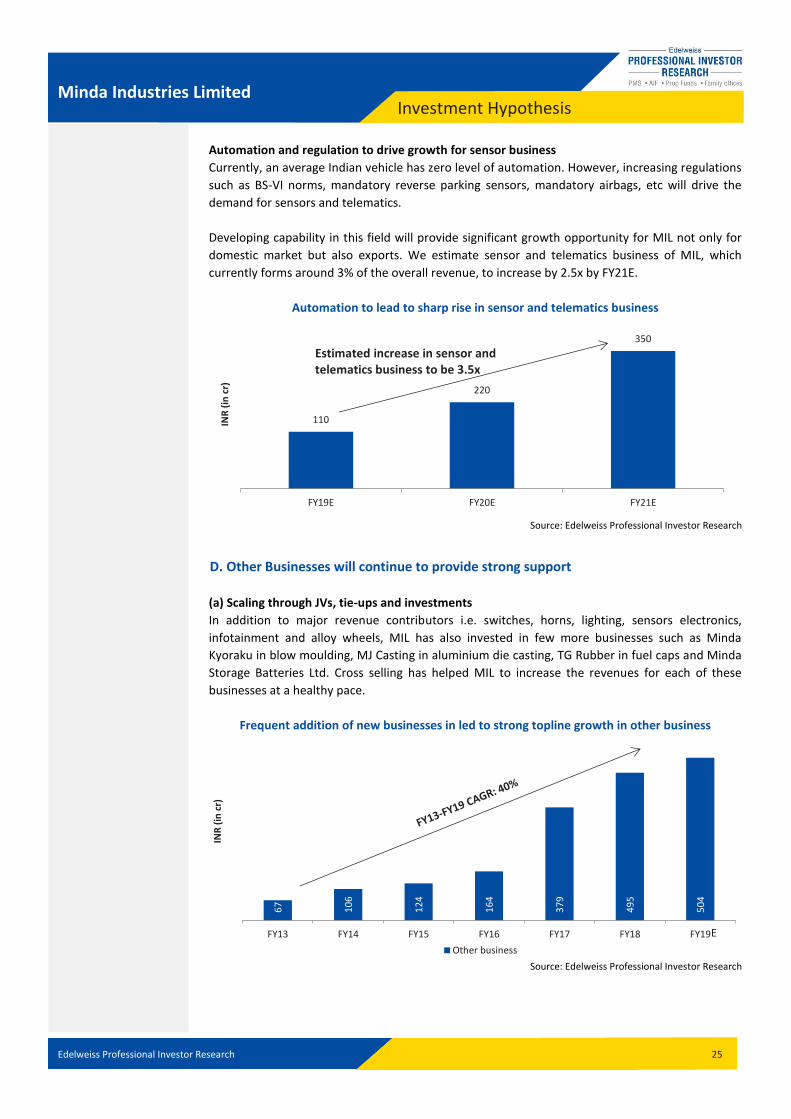
Demand for sensors will increase by 3x with evolution of driverless or robotic cars
Source: Yole Developpement (Autonomous Vehicle Sensors Conferene 2018) and Edelweiss Professional Investor Research
Number of components to increase by ~3x; cost per vehicle to escalate by ~10x
Source: Yole Developpement (Autonomous Vehicle Sensors Conferene 2018) and Edelweiss Professional Investor Research
6 8 8 8 8
1
1 1 1 1
4 4 4
1
3
3 3 3
1 1 1
1
4
4 4 4
1 1 1 1
1
2 4 1
1
Level 1 Level 2 Level 3 Level 4 Level 5
9 16 22 26 28
No
s
Dead recokning
Lidar
Ubolometer
Event based camera
Camera Suround
In cabin/Driver cam
Forward Camera
Radar SRR
Radar LRR
Ultrasonic
<----Sensor Module
<----No of components
Edelweiss Professional Investor Research 25
Minda Industries Limited Investment Hypothesis
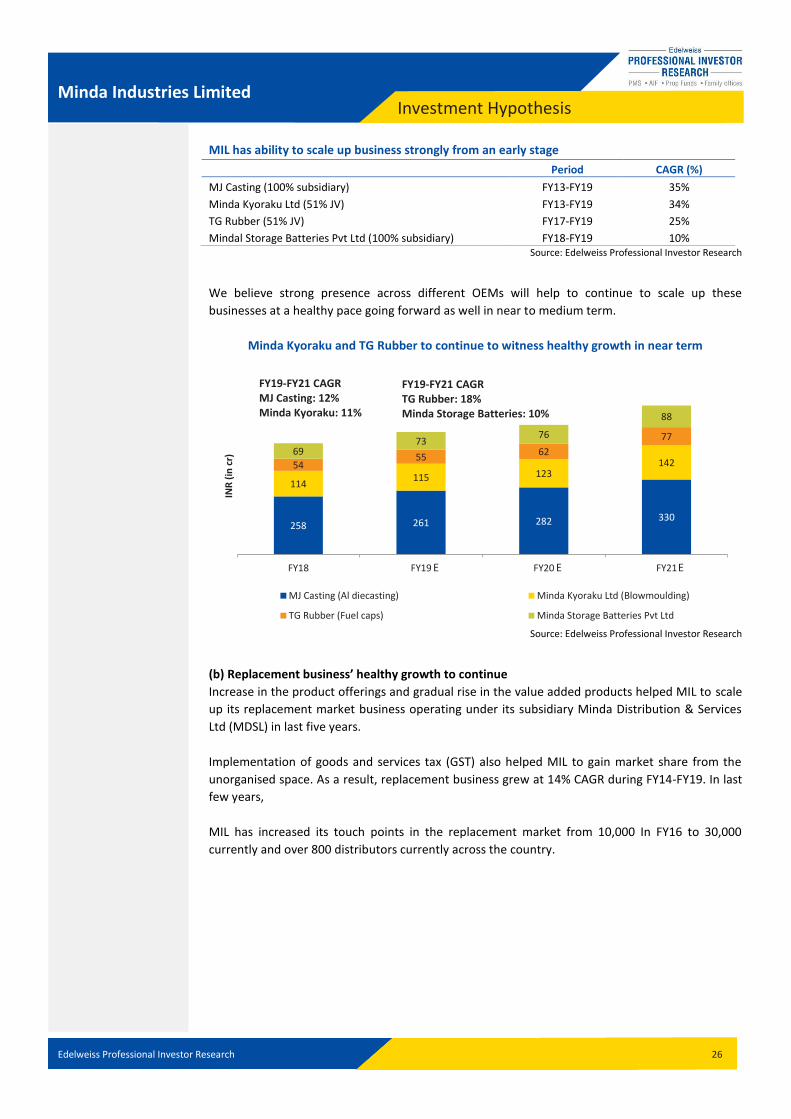
Automation and regulation to drive growth for sensor business
Currently, an average Indian vehicle has zero level of automation. However, increasing regulations
such as BS-VI norms, mandatory reverse parking sensors, mandatory airbags, etc will drive the
demand for sensors and telematics.
Developing capability in this field will provide significant growth opportunity for MIL not only for
domestic market but also exports. We estimate sensor and telematics business of MIL, which
currently forms around 3% of the overall revenue, to increase by 2.5x by FY21E.
Automation to lead to sharp rise in sensor and telematics business
Source: Edelweiss Professional Investor Research
D. Other Businesses will continue to provide strong support
(a) Scaling through JVs, tie-ups and investments
In addition to major revenue contributors i.e. switches, horns, lighting, sensors electronics,
infotainment and alloy wheels, MIL has also invested in few more businesses such as Minda
Kyoraku in blow moulding, MJ Casting in aluminium die casting, TG Rubber in fuel caps and Minda
Storage Batteries Ltd. Cross selling has helped MIL to increase the revenues for each of these
businesses at a healthy pace.
Frequent addition of new businesses in led to strong topline growth in other business
Source: Edelweiss Professional Investor Research
110
220
350
FY19E FY20E FY21E
INR
(in
cr)
Estimated increase in sensor and telematics business to be 3.5x
67
10
6
12
4
16
4
37
9
49
5
50
4
FY13 FY14 FY15 FY16 FY17 FY18 FY19
INR
(in
cr)
Other business
E
Edelweiss Professional Investor Research 26
Minda Industries Limited Investment Hypothesis
MIL has ability to scale up business strongly from an early stage
Period CAGR (%)
MJ Casting (100% subsidiary) FY13-FY19 35%
Minda Kyoraku Ltd (51% JV) FY13-FY19 34%
TG Rubber (51% JV) FY17-FY19 25%
Mindal Storage Batteries Pvt Ltd (100% subsidiary) FY18-FY19 10% Source: Edelweiss Professional Investor Research
We believe strong presence across different OEMs will help to continue to scale up these
businesses at a healthy pace going forward as well in near to medium term.
Minda Kyoraku and TG Rubber to continue to witness healthy growth in near term
Source: Edelweiss Professional Investor Research
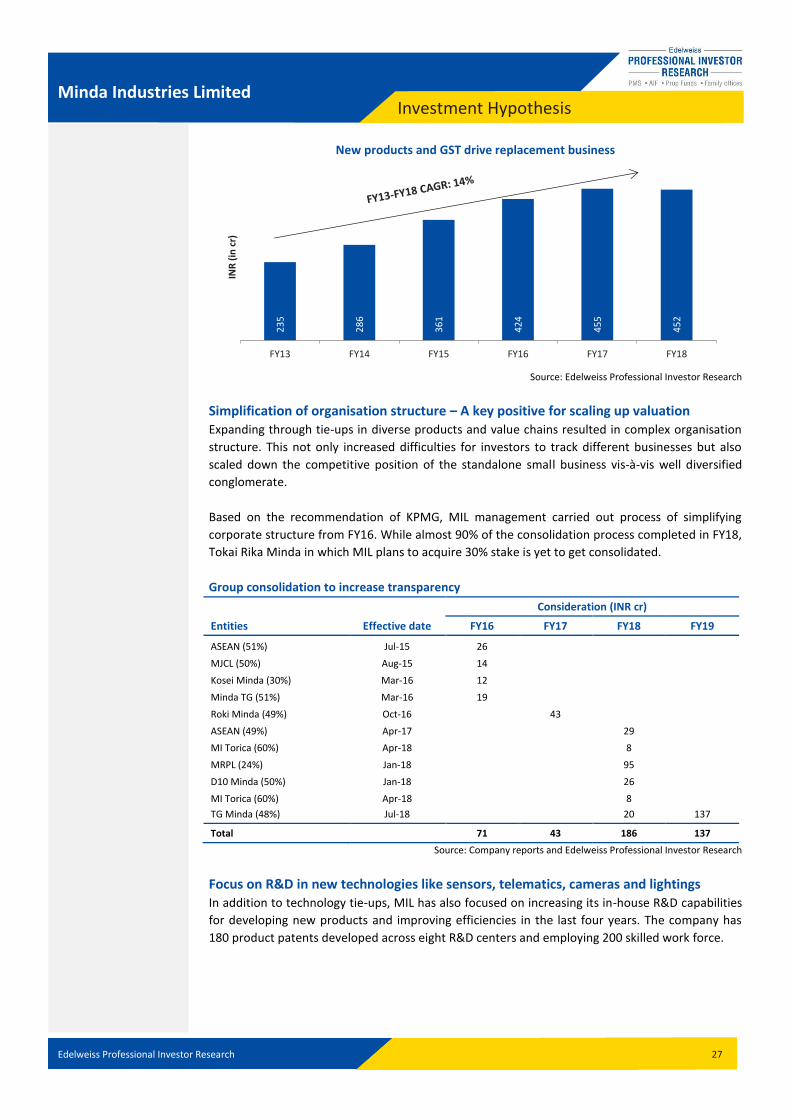
(b) Replacement business’ healthy growth to continue
Increase in the product offerings and gradual rise in the value added products helped MIL to scale
up its replacement market business operating under its subsidiary Minda Distribution & Services
Ltd (MDSL) in last five years.
Implementation of goods and services tax (GST) also helped MIL to gain market share from the
unorganised space. As a result, replacement business grew at 14% CAGR during FY14-FY19. In last
few years,
MIL has increased its touch points in the replacement market from 10,000 In FY16 to 30,000
currently and over 800 distributors currently across the country.
258 261 282 330
114 115 123
142 54 55
62
77
69 73
76
88
FY18 FY19 FY20 FY21
INR
(in
cr)
MJ Casting (Al diecasting) Minda Kyoraku Ltd (Blowmoulding)
TG Rubber (Fuel caps) Minda Storage Batteries Pvt Ltd
FY19-FY21 CAGR MJ Casting: 12% Minda Kyoraku: 11%
FY19-FY21 CAGR TG Rubber: 18% Minda Storage Batteries: 10%
E E E
Edelweiss Professional Investor Research 27
Minda Industries Limited Investment Hypothesis
New products and GST drive replacement business
Source: Edelweiss Professional Investor Research
Simplification of organisation structure – A key positive for scaling up valuation Expanding through tie-ups in diverse products and value chains resulted in complex organisation
structure. This not only increased difficulties for investors to track different businesses but also
scaled down the competitive position of the standalone small business vis-à-vis well diversified
conglomerate.
Based on the recommendation of KPMG, MIL management carried out process of simplifying
corporate structure from FY16. While almost 90% of the consolidation process completed in FY18,
Tokai Rika Minda in which MIL plans to acquire 30% stake is yet to get consolidated.
Group consolidation to increase transparency
Consideration (INR cr)
Entities Effective date FY16 FY17 FY18 FY19
ASEAN (51%) Jul-15 26 MJCL (50%) Aug-15 14 Kosei Minda (30%) Mar-16 12 Minda TG (51%) Mar-16 19 Roki Minda (49%) Oct-16
43
ASEAN (49%) Apr-17
29 MI Torica (60%) Apr-18
8
MRPL (24%) Jan-18
95 D10 Minda (50%) Jan-18
26
MI Torica (60%) Apr-18
8 TG Minda (48%) Jul-18 20 137
Total 71 43 186 137
Source: Company reports and Edelweiss Professional Investor Research
Focus on R&D in new technologies like sensors, telematics, cameras and lightings In addition to technology tie-ups, MIL has also focused on increasing its in-house R&D capabilities
for developing new products and improving efficiencies in the last four years. The company has
180 product patents developed across eight R&D centers and employing 200 skilled work force.
23
5
28
6
36
1
42
4
45
5
45
2
FY13 FY14 FY15 FY16 FY17 FY18
INR
(in
cr)
Edelweiss Professional Investor Research 28
Minda Industries Limited Investment Hypothesis
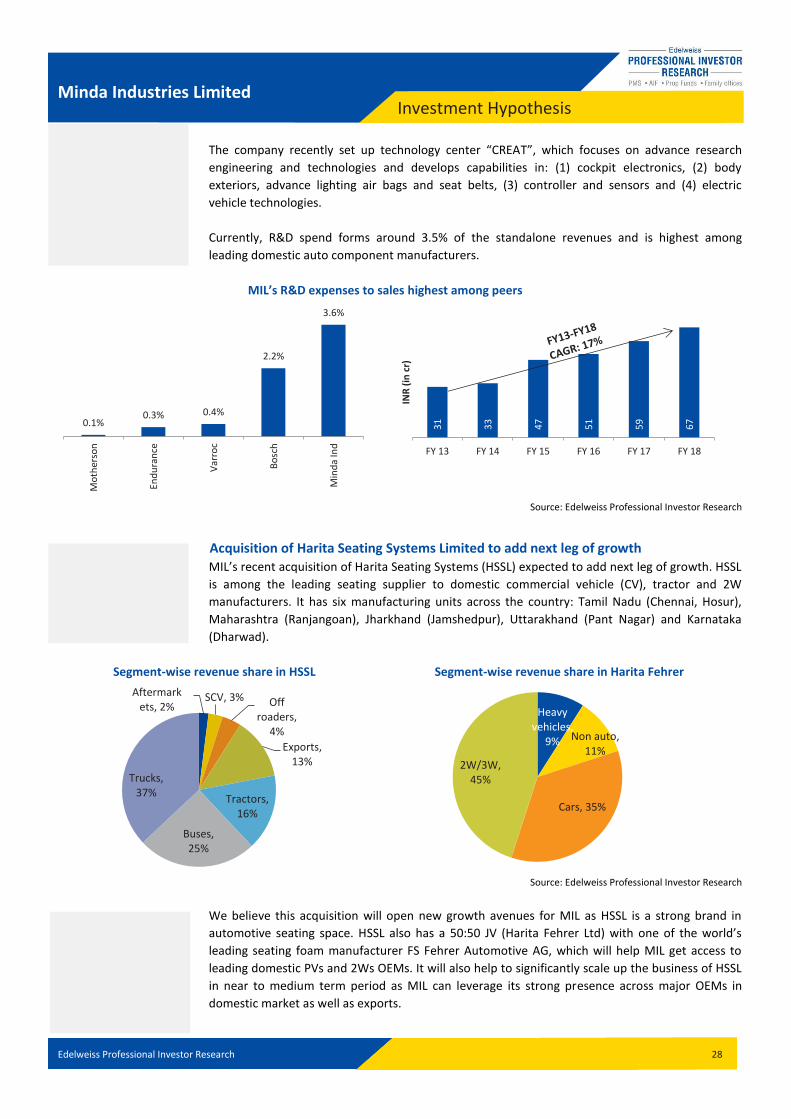
The company recently set up technology center “CREAT”, which focuses on advance research
engineering and technologies and develops capabilities in: (1) cockpit electronics, (2) body
exteriors, advance lighting air bags and seat belts, (3) controller and sensors and (4) electric
vehicle technologies.
Currently, R&D spend forms around 3.5% of the standalone revenues and is highest among
leading domestic auto component manufacturers.
MIL’s R&D expenses to sales highest among peers
Source: Edelweiss Professional Investor Research
Acquisition of Harita Seating Systems Limited to add next leg of growth
MIL’s recent acquisition of Harita Seating Systems (HSSL) expected to add next leg of growth. HSSL
is among the leading seating supplier to domestic commercial vehicle (CV), tractor and 2W
manufacturers. It has six manufacturing units across the country: Tamil Nadu (Chennai, Hosur),
Maharashtra (Ranjangoan), Jharkhand (Jamshedpur), Uttarakhand (Pant Nagar) and Karnataka
(Dharwad).
Segment-wise revenue share in HSSL Segment-wise revenue share in Harita Fehrer
Source: Edelweiss Professional Investor Research
We believe this acquisition will open new growth avenues for MIL as HSSL is a strong brand in
automotive seating space. HSSL also has a 50:50 JV (Harita Fehrer Ltd) with one of the world’s
leading seating foam manufacturer FS Fehrer Automotive AG, which will help MIL get access to
leading domestic PVs and 2Ws OEMs. It will also help to significantly scale up the business of HSSL
in near to medium term period as MIL can leverage its strong presence across major OEMs in
domestic market as well as exports.
0.1% 0.3% 0.4%
2.2%
3.6%
Mo
ther
son
End
ura
nce
Var
roc
Bo
sch
Min
da
Ind
31
33
47
51
59
67
FY 13 FY 14 FY 15 FY 16 FY 17 FY 18
INR
(in
cr)
Aftermarkets, 2%
SCV, 3% Off roaders,
4%
Exports, 13%
Tractors, 16%
Buses, 25%
Trucks, 37%
Heavy vehicles,
9% Non auto, 11%
Cars, 35%
2W/3W, 45%
Edelweiss Professional Investor Research 29
Minda Industries Limited Investment Hypothesis
Key financial ratios of HSSL
(INR Cr) FY14 FY15 FY16 FY17 FY18 FY19E FY20E FY21E
Income from operations 512 579 637 711 885 1026 1047 1162
YoY Grth% -3% 13% 10% 12% 25% 16% 2% 11%
EBITDA 37 36 50 62 85 74 87 101
EBITDA Margin% 0.1 0.1 0.1 0.1 0.1 0.1 0.1 0.1
Profit after tax 8 10 22 24 34 26 32 40
YoY Grth% -33% 22% 131% 10% 39% -23% 22% 26%
EPS 10.0 11.8 28.2 31.0 43.2 33.4 40.8 51.6
ROAE (%) 11% 12% 29% 24% 25% 16% 17% 19%
ROACE adj for cash (%) 12% 15% 25% 28% 30% 20% 22% 25%
Debt equity 0.7 0.5 0.1 0.1 0.1 0.1 0.1 0.1
P/E 46.0 39.0 16.4 14.9 10.7 13.8 11.3 8.9
EV/EBITDA 11.0 10.7 7.1 5.8 4.5 5.2 4.3 3.6
FA to turnover 3.8 4.6 5.5 5.1 5.5 6.1 6.4 7.4
Source: Edelweiss Professional Investor Research
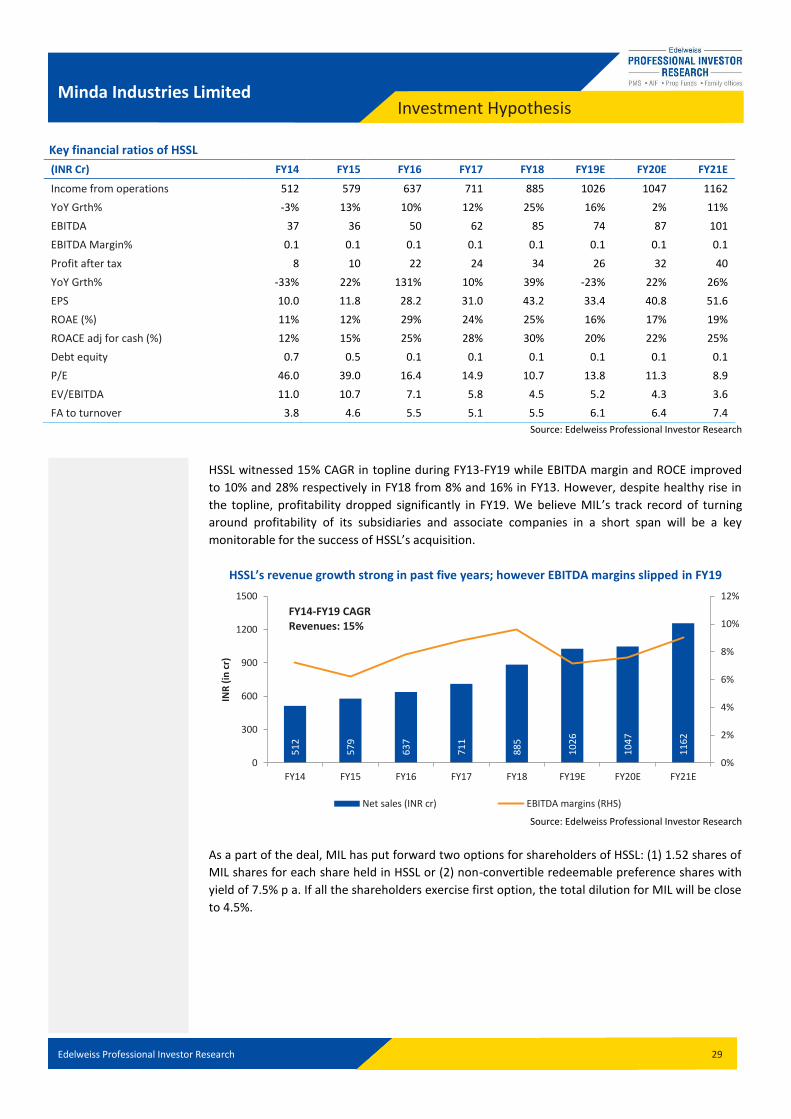
HSSL witnessed 15% CAGR in topline during FY13-FY19 while EBITDA margin and ROCE improved
to 10% and 28% respectively in FY18 from 8% and 16% in FY13. However, despite healthy rise in
the topline, profitability dropped significantly in FY19. We believe MIL’s track record of turning
around profitability of its subsidiaries and associate companies in a short span will be a key
monitorable for the success of HSSL’s acquisition.
HSSL’s revenue growth strong in past five years; however EBITDA margins slipped in FY19
Source: Edelweiss Professional Investor Research
As a part of the deal, MIL has put forward two options for shareholders of HSSL: (1) 1.52 shares of
MIL shares for each share held in HSSL or (2) non-convertible redeemable preference shares with
yield of 7.5% p a. If all the shareholders exercise first option, the total dilution for MIL will be close
to 4.5%.
51
2
57
9
63
7
71
1
88
5
10
26
10
47
11
62
0%
2%
4%
6%
8%
10%
12%
0
300
600
900
1200
1500
FY14 FY15 FY16 FY17 FY18 FY19E FY20E FY21E
INR
(in
cr)
Net sales (INR cr) EBITDA margins (RHS)
FY14-FY19 CAGR Revenues: 15%
Edelweiss Professional Investor Research 30
Minda Industries Limited Investment Hypothesis
Estimated financials incl. HSSL merger
INR cr FY14 FY15 FY16 FY17 FY18 FY19E FY20E FY21E
Sales 1706 2232 2527 3386 4471 5923 7073 9418
YoY Grth% 27% 31% 13% 34% 32% 33% 19% 33%
EBITDA 78 154 237 372 499 702 861 1162
EBITDA Margin% 5% 7% 9% 11% 11% 12% 12% 12%
Profit after tax 6 53 104 162 277 294 367 564
YoY Grth% -81% 1017% 85% 49% 87% 10% 20% 44%
EPS 0.2 2.6 4.0 6.2 10.6 11.2 13.4 20.6
ROAE (%) 2% 20% 29% 31% 31% 23% 22% 24%
ROACE (%) 3% 11% 17% 17% 16% 19% 19% 23%
P/E n.m 139.3 91.0 58.2 34.1 32.0 26.9 17.5
Source: Edelweiss Professional Investor Research
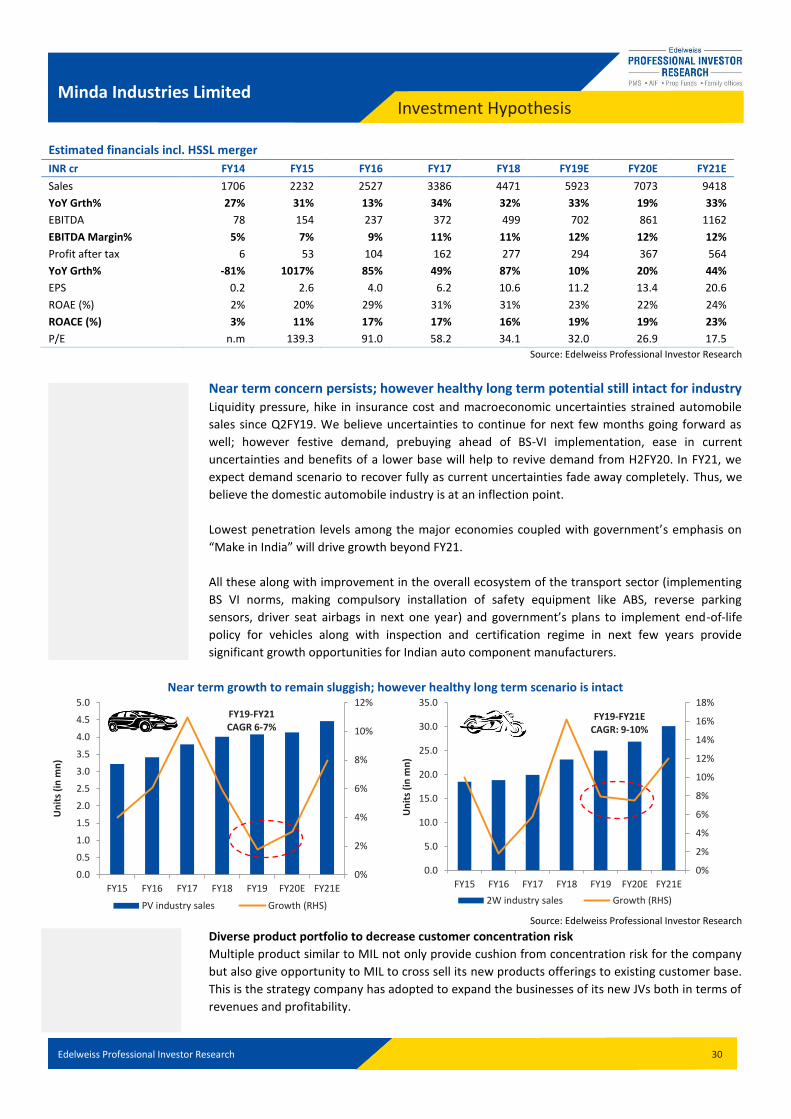
Near term concern persists; however healthy long term potential still intact for industry
Liquidity pressure, hike in insurance cost and macroeconomic uncertainties strained automobile
sales since Q2FY19. We believe uncertainties to continue for next few months going forward as
well; however festive demand, prebuying ahead of BS-VI implementation, ease in current
uncertainties and benefits of a lower base will help to revive demand from H2FY20. In FY21, we
expect demand scenario to recover fully as current uncertainties fade away completely. Thus, we
believe the domestic automobile industry is at an inflection point.
Lowest penetration levels among the major economies coupled with government’s emphasis on
“Make in India” will drive growth beyond FY21.
All these along with improvement in the overall ecosystem of the transport sector (implementing
BS VI norms, making compulsory installation of safety equipment like ABS, reverse parking
sensors, driver seat airbags in next one year) and government’s plans to implement end-of-life
policy for vehicles along with inspection and certification regime in next few years provide
significant growth opportunities for Indian auto component manufacturers.
Near term growth to remain sluggish; however healthy long term scenario is intact
Source: Edelweiss Professional Investor Research
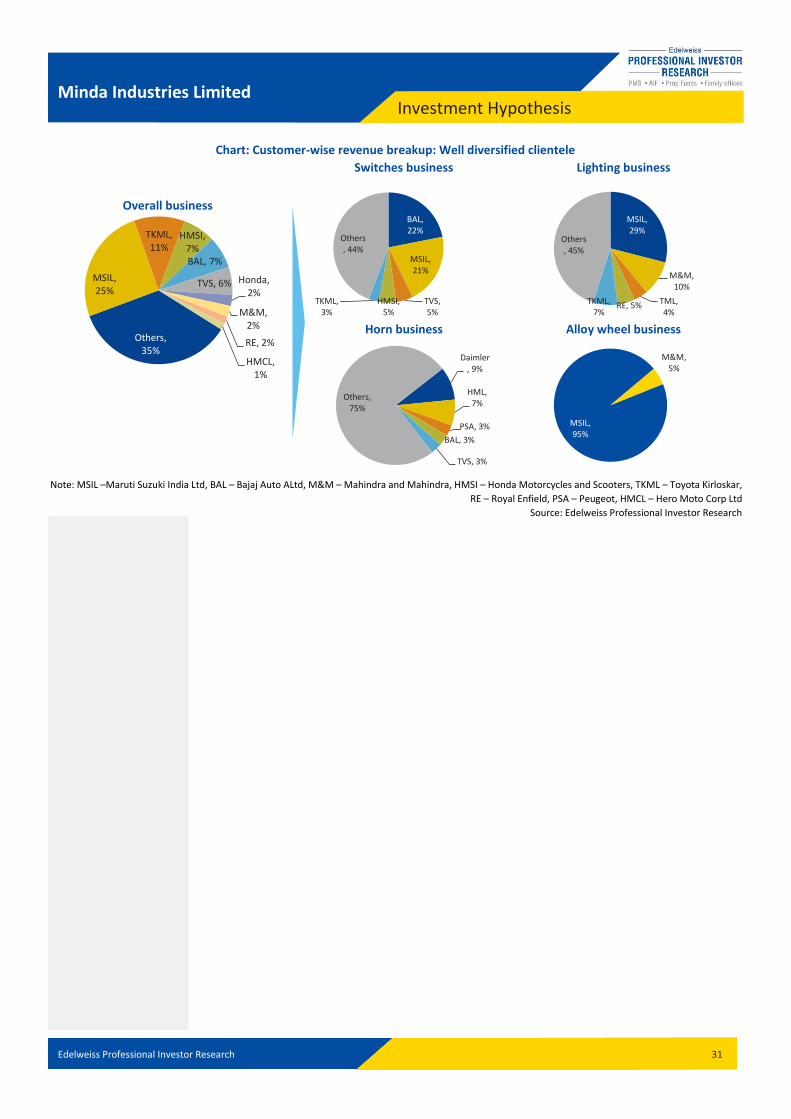
Diverse product portfolio to decrease customer concentration risk
Multiple product similar to MIL not only provide cushion from concentration risk for the company
but also give opportunity to MIL to cross sell its new products offerings to existing customer base.
This is the strategy company has adopted to expand the businesses of its new JVs both in terms of
revenues and profitability.
0%
2%
4%
6%
8%
10%
12%
0.0
0.5
1.0
1.5
2.0
2.5
3.0
3.5
4.0
4.5
5.0
FY15 FY16 FY17 FY18 FY19 FY20E FY21E
Un
its
(in
mn
)
PV industry sales Growth (RHS)
FY19-FY21 CAGR 6-7%
0%
2%
4%
6%
8%
10%
12%
14%
16%
18%
0.0
5.0
10.0
15.0
20.0
25.0
30.0
35.0
FY15 FY16 FY17 FY18 FY19 FY20E FY21E
Un
its
(in
mn
)
2W industry sales Growth (RHS)
FY19-FY21E CAGR: 9-10%
Edelweiss Professional Investor Research 31
Minda Industries Limited Investment Hypothesis
Chart: Customer-wise revenue breakup: Well diversified clientele
Overall business
Switches business Lighting business
Horn business Alloy wheel business
Note: MSIL –Maruti Suzuki India Ltd, BAL – Bajaj Auto ALtd, M&M – Mahindra and Mahindra, HMSI – Honda Motorcycles and Scooters, TKML – Toyota Kirloskar,
RE – Royal Enfield, PSA – Peugeot, HMCL – Hero Moto Corp Ltd
Source: Edelweiss Professional Investor Research
BAL, 22%
MSIL, 21%
TVS, 5%
HMSI, 5%
TKML, 3%
Others, 44%
MSIL, 29%
M&M, 10%
TML, 4%
RE, 5% TKML, 7%
Others, 45%
Daimler, 9%
HML, 7%
PSA, 3%
BAL, 3%
TVS, 3%
Others, 75%
MSIL, 95%
M&M, 5%
Others, 35%
MSIL, 25%
TKML, 11%
HMSI, 7% BAL, 7%
TVS, 6% Honda, 2%
M&M, 2%
RE, 2%
HMCL, 1%
Edelweiss Professional Investor Research 32
Minda Industries Limited Investment Hypothesis
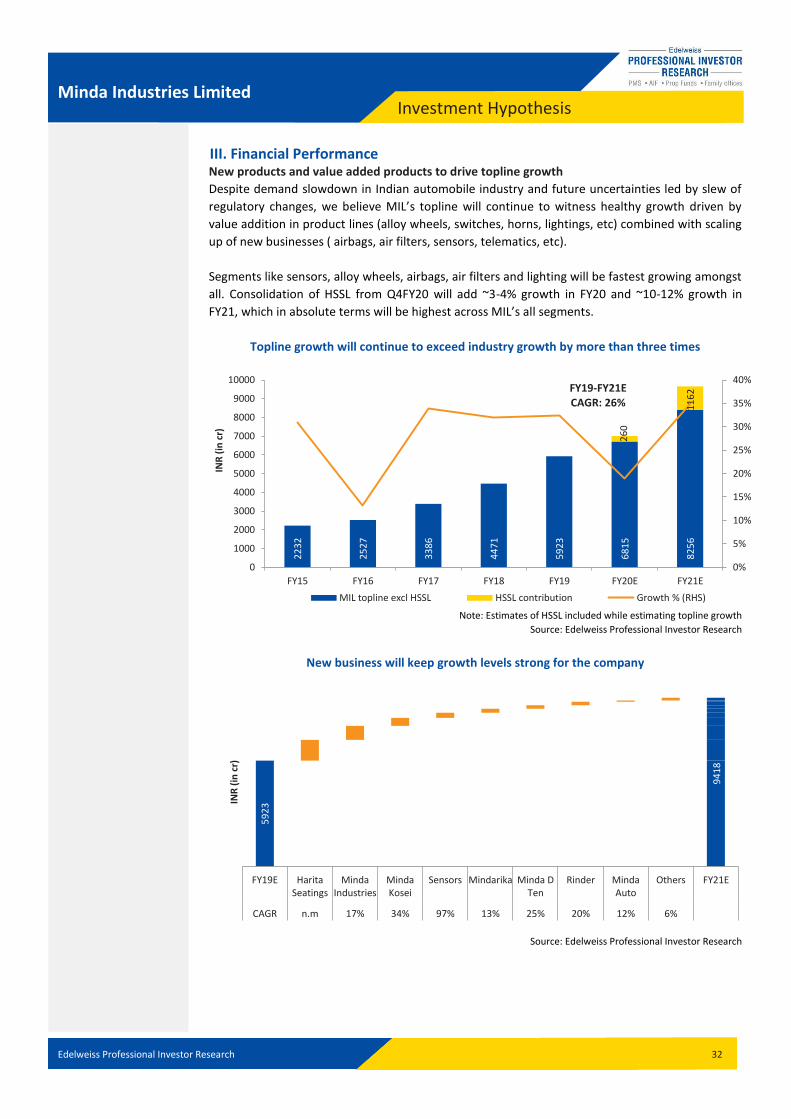
III. Financial Performance New products and value added products to drive topline growth
Despite demand slowdown in Indian automobile industry and future uncertainties led by slew of
regulatory changes, we believe MIL’s topline will continue to witness healthy growth driven by
value addition in product lines (alloy wheels, switches, horns, lightings, etc) combined with scaling
up of new businesses ( airbags, air filters, sensors, telematics, etc).
Segments like sensors, alloy wheels, airbags, air filters and lighting will be fastest growing amongst
all. Consolidation of HSSL from Q4FY20 will add ~3-4% growth in FY20 and ~10-12% growth in
FY21, which in absolute terms will be highest across MIL’s all segments.
Topline growth will continue to exceed industry growth by more than three times
Note: Estimates of HSSL included while estimating topline growth
Source: Edelweiss Professional Investor Research
New business will keep growth levels strong for the company
Source: Edelweiss Professional Investor Research
22
32
25
27
33
86
44
71
59
23
68
15
82
56
26
0
11
62
0%
5%
10%
15%
20%
25%
30%
35%
40%
0
1000
2000
3000
4000
5000
6000
7000
8000
9000
10000
FY15 FY16 FY17 FY18 FY19 FY20E FY21E
INR
(in
cr)
MIL topline excl HSSL HSSL contribution Growth % (RHS)
FY19-FY21E CAGR: 26%
59
23
FY19E HaritaSeatings
MindaIndustries
MindaKosei
Sensors Mindarika Minda DTen
Rinder MindaAuto
Others FY21E
CAGR n.m 17% 34% 97% 13% 25% 20% 12% 6% 0%
INR
(in
cr)
94
18
Edelweiss Professional Investor Research 33
Minda Industries Limited Investment Hypothesis
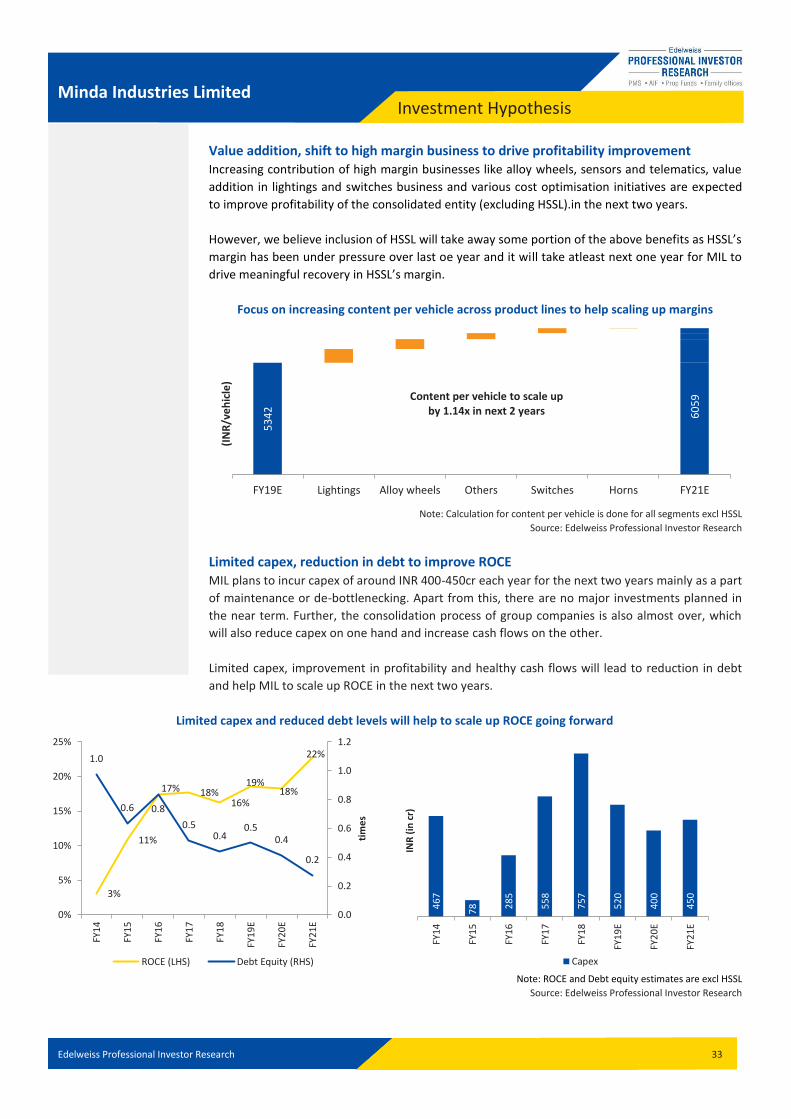
Value addition, shift to high margin business to drive profitability improvement Increasing contribution of high margin businesses like alloy wheels, sensors and telematics, value
addition in lightings and switches business and various cost optimisation initiatives are expected
to improve profitability of the consolidated entity (excluding HSSL).in the next two years.
However, we believe inclusion of HSSL will take away some portion of the above benefits as HSSL’s
margin has been under pressure over last oe year and it will take atleast next one year for MIL to
drive meaningful recovery in HSSL’s margin.
Focus on increasing content per vehicle across product lines to help scaling up margins
Note: Calculation for content per vehicle is done for all segments excl HSSL
Source: Edelweiss Professional Investor Research
Limited capex, reduction in debt to improve ROCE MIL plans to incur capex of around INR 400-450cr each year for the next two years mainly as a part
of maintenance or de-bottlenecking. Apart from this, there are no major investments planned in
the near term. Further, the consolidation process of group companies is also almost over, which
will also reduce capex on one hand and increase cash flows on the other.
Limited capex, improvement in profitability and healthy cash flows will lead to reduction in debt
and help MIL to scale up ROCE in the next two years.
Limited capex and reduced debt levels will help to scale up ROCE going forward
Note: ROCE and Debt equity estimates are excl HSSL
Source: Edelweiss Professional Investor Research
53
42
FY19E Lightings Alloy wheels Others Switches Horns FY21E
(IN
R/v
eh
icle
)
60
59
Content per vehicle to scale up by 1.14x in next 2 years
3%
11%
17% 18% 16%
19% 18%
22% 1.0
0.6 0.8
0.5 0.4
0.5 0.4
0.2
0.0
0.2
0.4
0.6
0.8
1.0
1.2
0%
5%
10%
15%
20%
25%
FY1
4
FY1
5
FY1
6
FY1
7
FY1
8
FY1
9E
FY2
0E
FY2
1E
tim
es
ROCE (LHS) Debt Equity (RHS)
46
7
78
28
5
55
8
75
7
52
0
40
0
45
0
FY1
4
FY1
5
FY1
6
FY1
7
FY1
8
FY1
9E
FY2
0E
FY2
1E
INR
(in
cr)
Capex
Edelweiss Professional Investor Research 34
Minda Industries Limited Investment Hypothesis
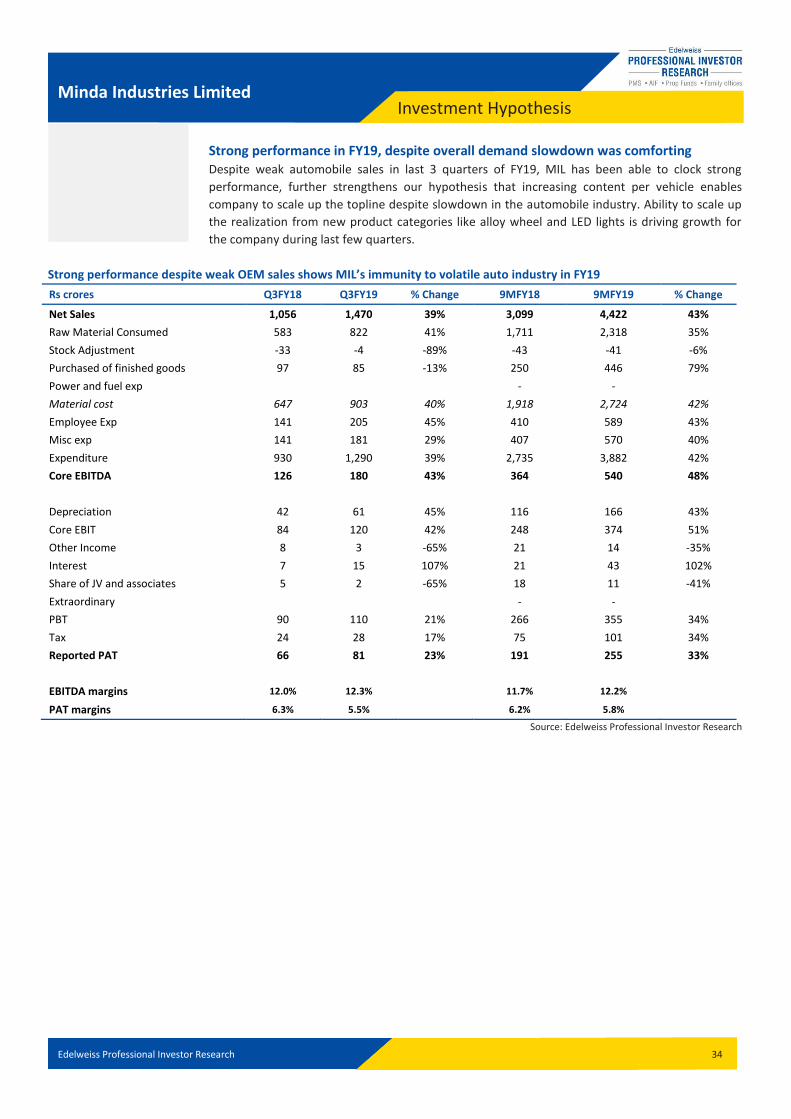
Strong performance in FY19, despite overall demand slowdown was comforting Despite weak automobile sales in last 3 quarters of FY19, MIL has been able to clock strong
performance, further strengthens our hypothesis that increasing content per vehicle enables
company to scale up the topline despite slowdown in the automobile industry. Ability to scale up
the realization from new product categories like alloy wheel and LED lights is driving growth for
the company during last few quarters.
Strong performance despite weak OEM sales shows MIL’s immunity to volatile auto industry in FY19
Rs crores Q3FY18 Q3FY19 % Change 9MFY18 9MFY19 % Change
Net Sales 1,056 1,470 39% 3,099 4,422 43%
Raw Material Consumed 583 822 41% 1,711 2,318 35%
Stock Adjustment -33 -4 -89% -43 -41 -6%
Purchased of finished goods 97 85 -13% 250 446 79%
Power and fuel exp
- -
Material cost 647 903 40% 1,918 2,724 42%
Employee Exp 141 205 45% 410 589 43%
Misc exp 141 181 29% 407 570 40%
Expenditure 930 1,290 39% 2,735 3,882 42%
Core EBITDA 126 180 43% 364 540 48%
Depreciation 42 61 45% 116 166 43%
Core EBIT 84 120 42% 248 374 51%
Other Income 8 3 -65% 21 14 -35%
Interest 7 15 107% 21 43 102%
Share of JV and associates 5 2 -65% 18 11 -41%
Extraordinary
- -
PBT 90 110 21% 266 355 34%
Tax 24 28 17% 75 101 34%
Reported PAT 66 81 23% 191 255 33%
EBITDA margins 12.0% 12.3%
11.7% 12.2%
PAT margins 6.3% 5.5%
6.2% 5.8%
Source: Edelweiss Professional Investor Research
Edelweiss Professional Investor Research 35
Minda Industries Limited Peer Comparison - Valuations
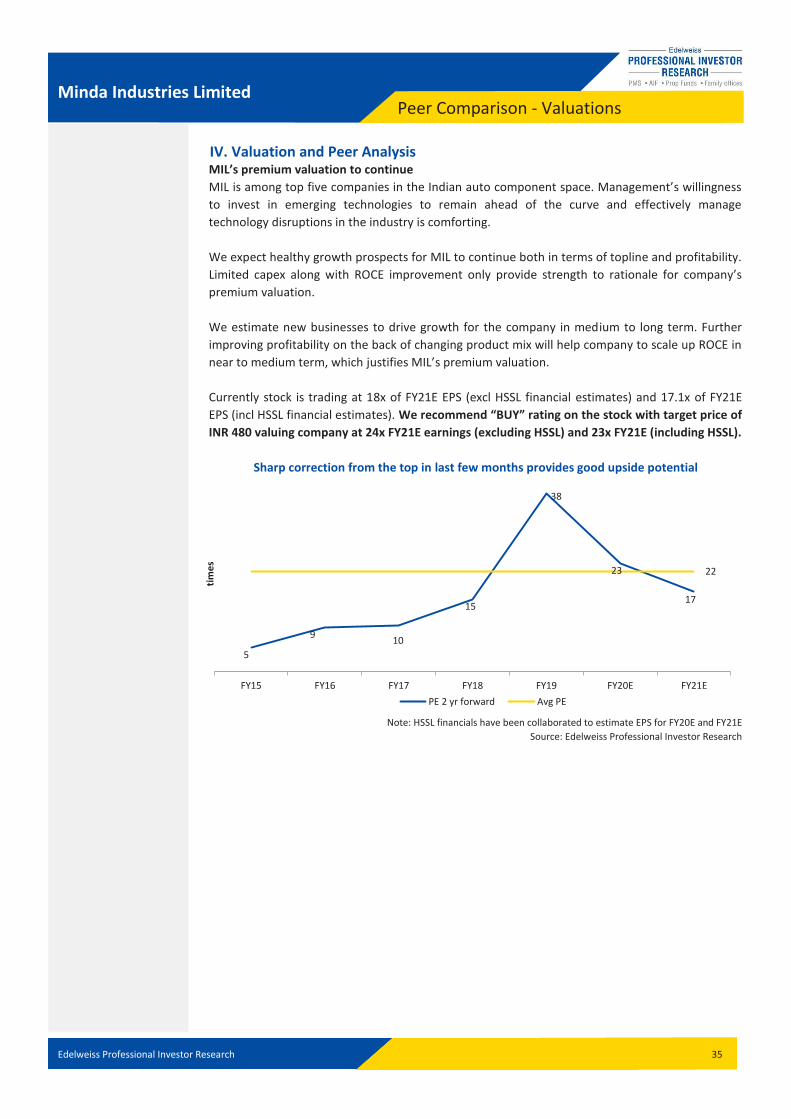
IV. Valuation and Peer Analysis MIL’s premium valuation to continue
MIL is among top five companies in the Indian auto component space. Management’s willingness
to invest in emerging technologies to remain ahead of the curve and effectively manage
technology disruptions in the industry is comforting.
We expect healthy growth prospects for MIL to continue both in terms of topline and profitability.
Limited capex along with ROCE improvement only provide strength to rationale for company’s
premium valuation.
We estimate new businesses to drive growth for the company in medium to long term. Further
improving profitability on the back of changing product mix will help company to scale up ROCE in
near to medium term, which justifies MIL’s premium valuation.
Currently stock is trading at 18x of FY21E EPS (excl HSSL financial estimates) and 17.1x of FY21E
EPS (incl HSSL financial estimates). We recommend “BUY” rating on the stock with target price of
INR 480 valuing company at 24x FY21E earnings (excluding HSSL) and 23x FY21E (including HSSL).
Sharp correction from the top in last few months provides good upside potential
Note: HSSL financials have been collaborated to estimate EPS for FY20E and FY21E
Source: Edelweiss Professional Investor Research
5
9 10
15
38
23
17
22
FY15 FY16 FY17 FY18 FY19 FY20E FY21E
tim
es
PE 2 yr forward Avg PE
Edelweiss Professional Investor Research 36
Minda Industries Limited Peer Comparison - Valuations
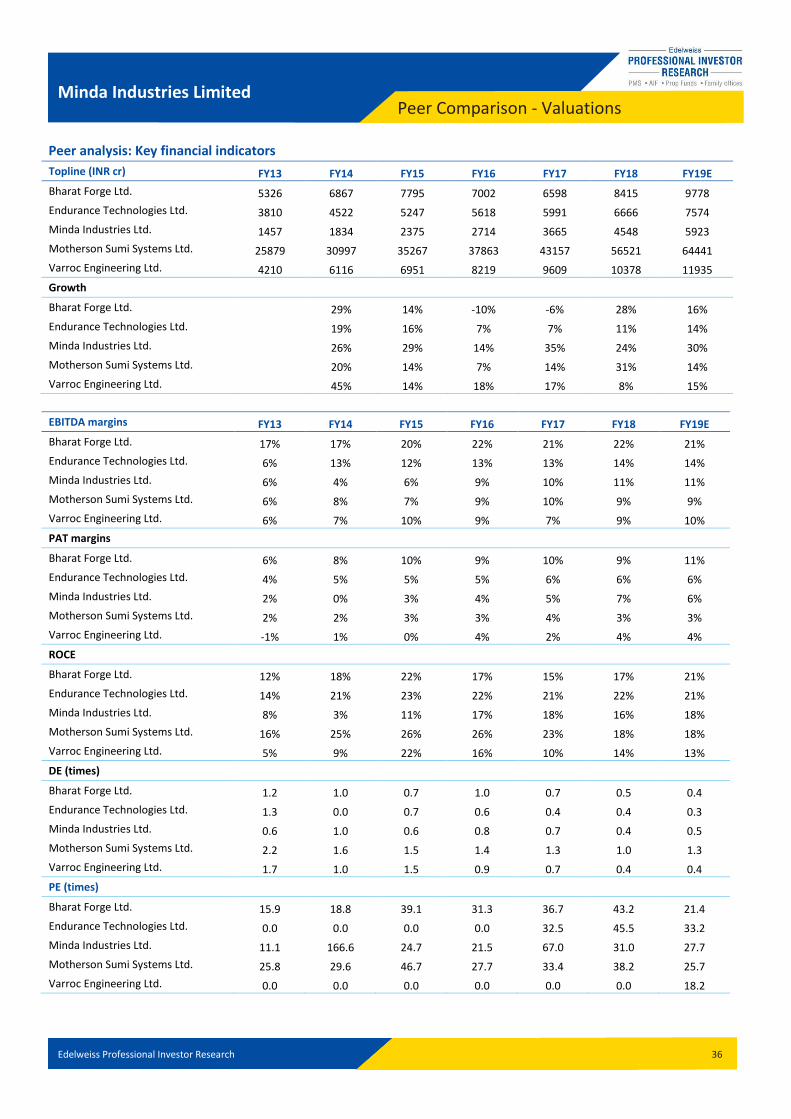
Peer analysis: Key financial indicators
Topline (INR cr) FY13 FY14 FY15 FY16 FY17 FY18 FY19E
Bharat Forge Ltd. 5326 6867 7795 7002 6598 8415 9778
Endurance Technologies Ltd. 3810 4522 5247 5618 5991 6666 7574
Minda Industries Ltd. 1457 1834 2375 2714 3665 4548 5923
Motherson Sumi Systems Ltd. 25879 30997 35267 37863 43157 56521 64441
Varroc Engineering Ltd. 4210 6116 6951 8219 9609 10378 11935
Growth
Bharat Forge Ltd.
29% 14% -10% -6% 28% 16%
Endurance Technologies Ltd.
19% 16% 7% 7% 11% 14%
Minda Industries Ltd.
26% 29% 14% 35% 24% 30%
Motherson Sumi Systems Ltd.
20% 14% 7% 14% 31% 14%
Varroc Engineering Ltd.
45% 14% 18% 17% 8% 15%
EBITDA margins FY13 FY14 FY15 FY16 FY17 FY18 FY19E
Bharat Forge Ltd. 17% 17% 20% 22% 21% 22% 21%
Endurance Technologies Ltd. 6% 13% 12% 13% 13% 14% 14%
Minda Industries Ltd. 6% 4% 6% 9% 10% 11% 11%
Motherson Sumi Systems Ltd. 6% 8% 7% 9% 10% 9% 9%
Varroc Engineering Ltd. 6% 7% 10% 9% 7% 9% 10%
PAT margins
Bharat Forge Ltd. 6% 8% 10% 9% 10% 9% 11%
Endurance Technologies Ltd. 4% 5% 5% 5% 6% 6% 6%
Minda Industries Ltd. 2% 0% 3% 4% 5% 7% 6%
Motherson Sumi Systems Ltd. 2% 2% 3% 3% 4% 3% 3%
Varroc Engineering Ltd. -1% 1% 0% 4% 2% 4% 4%
ROCE
Bharat Forge Ltd. 12% 18% 22% 17% 15% 17% 21%
Endurance Technologies Ltd. 14% 21% 23% 22% 21% 22% 21%
Minda Industries Ltd. 8% 3% 11% 17% 18% 16% 18%
Motherson Sumi Systems Ltd. 16% 25% 26% 26% 23% 18% 18%
Varroc Engineering Ltd. 5% 9% 22% 16% 10% 14% 13%
DE (times)
Bharat Forge Ltd. 1.2 1.0 0.7 1.0 0.7 0.5 0.4
Endurance Technologies Ltd. 1.3 0.0 0.7 0.6 0.4 0.4 0.3
Minda Industries Ltd. 0.6 1.0 0.6 0.8 0.7 0.4 0.5
Motherson Sumi Systems Ltd. 2.2 1.6 1.5 1.4 1.3 1.0 1.3
Varroc Engineering Ltd. 1.7 1.0 1.5 0.9 0.7 0.4 0.4
PE (times)
Bharat Forge Ltd. 15.9 18.8 39.1 31.3 36.7 43.2 21.4
Endurance Technologies Ltd. 0.0 0.0 0.0 0.0 32.5 45.5 33.2
Minda Industries Ltd. 11.1 166.6 24.7 21.5 67.0 31.0 27.7
Motherson Sumi Systems Ltd. 25.8 29.6 46.7 27.7 33.4 38.2 25.7
Varroc Engineering Ltd. 0.0 0.0 0.0 0.0 0.0 0.0 18.2
Edelweiss Professional Investor Research 37
Minda Industries Limited Business Model
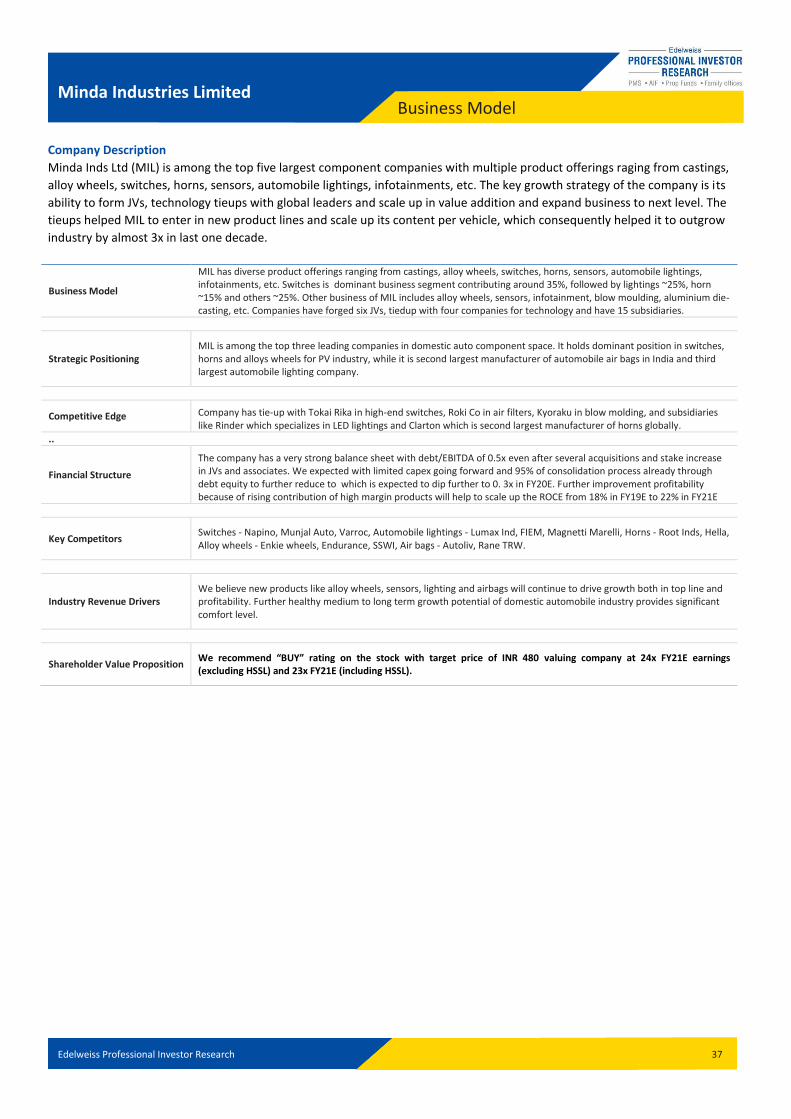
Company Description
Minda Inds Ltd (MIL) is among the top five largest component companies with multiple product offerings raging from castings,
alloy wheels, switches, horns, sensors, automobile lightings, infotainments, etc. The key growth strategy of the company is its
ability to form JVs, technology tieups with global leaders and scale up in value addition and expand business to next level. The
tieups helped MIL to enter in new product lines and scale up its content per vehicle, which consequently helped it to outgrow
industry by almost 3x in last one decade.
Business Model
MIL has diverse product offerings ranging from castings, alloy wheels, switches, horns, sensors, automobile lightings, infotainments, etc. Switches is dominant business segment contributing around 35%, followed by lightings ~25%, horn ~15% and others ~25%. Other business of MIL includes alloy wheels, sensors, infotainment, blow moulding, aluminium die-casting, etc. Companies have forged six JVs, tiedup with four companies for technology and have 15 subsidiaries.
Strategic Positioning MIL is among the top three leading companies in domestic auto component space. It holds dominant position in switches, horns and alloys wheels for PV industry, while it is second largest manufacturer of automobile air bags in India and third largest automobile lighting company.
Competitive Edge Company has tie-up with Tokai Rika in high-end switches, Roki Co in air filters, Kyoraku in blow molding, and subsidiaries like Rinder which specializes in LED lightings and Clarton which is second largest manufacturer of horns globally.
..
Financial Structure
The company has a very strong balance sheet with debt/EBITDA of 0.5x even after several acquisitions and stake increase in JVs and associates. We expected with limited capex going forward and 95% of consolidation process already through debt equity to further reduce to which is expected to dip further to 0. 3x in FY20E. Further improvement profitability because of rising contribution of high margin products will help to scale up the ROCE from 18% in FY19E to 22% in FY21E
Key Competitors Switches - Napino, Munjal Auto, Varroc, Automobile lightings - Lumax Ind, FIEM, Magnetti Marelli, Horns - Root Inds, Hella, Alloy wheels - Enkie wheels, Endurance, SSWI, Air bags - Autoliv, Rane TRW.
Industry Revenue Drivers We believe new products like alloy wheels, sensors, lighting and airbags will continue to drive growth both in top line and profitability. Further healthy medium to long term growth potential of domestic automobile industry provides significant comfort level.
Shareholder Value Proposition We recommend “BUY” rating on the stock with target price of INR 480 valuing company at 24x FY21E earnings (excluding HSSL) and 23x FY21E (including HSSL).
Edelweiss Professional Investor Research 38
Financials Minda Industries Limited
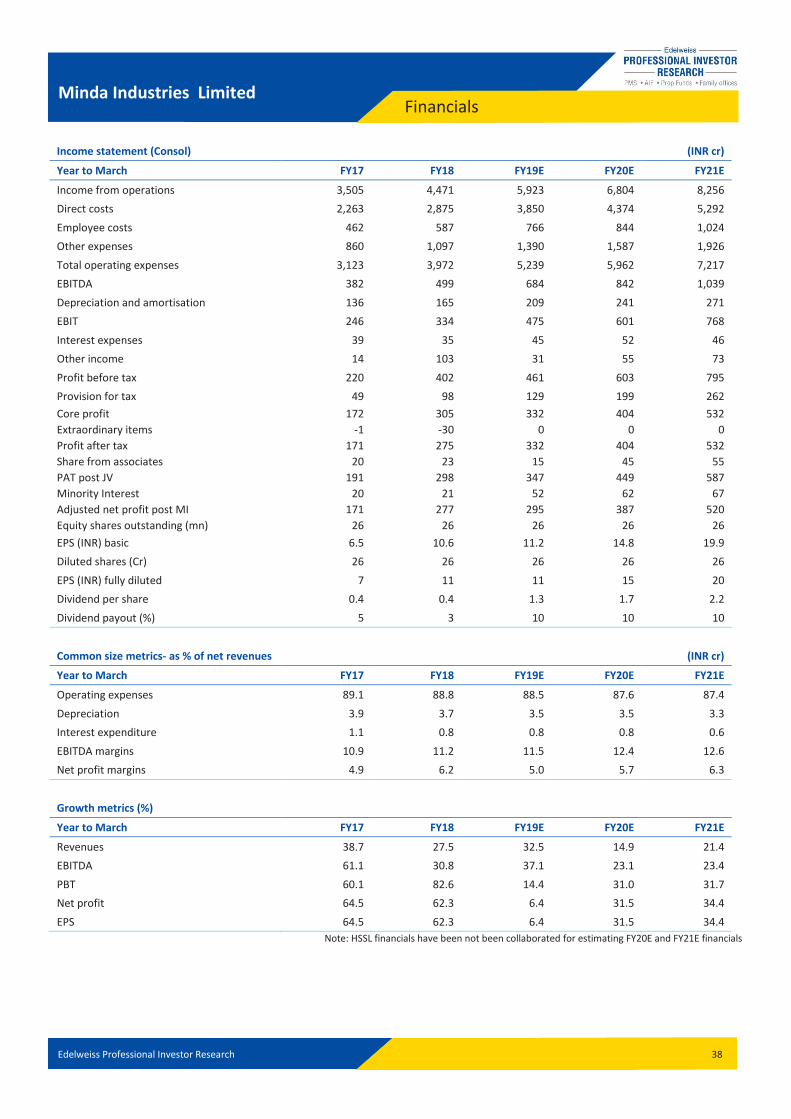
Income statement (Consol)
(INR cr)
Year to March FY17 FY18 FY19E FY20E FY21E
Income from operations 3,505 4,471 5,923 6,804 8,256
Direct costs 2,263 2,875 3,850 4,374 5,292
Employee costs 462 587 766 844 1,024
Other expenses 860 1,097 1,390 1,587 1,926
Total operating expenses 3,123 3,972 5,239 5,962 7,217
EBITDA 382 499 684 842 1,039
Depreciation and amortisation 136 165 209 241 271
EBIT 246 334 475 601 768
Interest expenses 39 35 45 52 46
Other income 14 103 31 55 73
Profit before tax 220 402 461 603 795
Provision for tax 49 98 129 199 262
Core profit 172 305 332 404 532
Extraordinary items -1 -30 0 0 0
Profit after tax 171 275 332 404 532
Share from associates 20 23 15 45 55
PAT post JV 191 298 347 449 587
Minority Interest 20 21 52 62 67
Adjusted net profit post MI 171 277 295 387 520
Equity shares outstanding (mn) 26 26 26 26 26
EPS (INR) basic 6.5 10.6 11.2 14.8 19.9
Diluted shares (Cr) 26 26 26 26 26
EPS (INR) fully diluted 7 11 11 15 20
Dividend per share 0.4 0.4 1.3 1.7 2.2
Dividend payout (%) 5 3 10 10 10
Common size metrics- as % of net revenues
(INR cr)
Year to March FY17 FY18 FY19E FY20E FY21E
Operating expenses 89.1 88.8 88.5 87.6 87.4
Depreciation 3.9 3.7 3.5 3.5 3.3
Interest expenditure 1.1 0.8 0.8 0.8 0.6
EBITDA margins 10.9 11.2 11.5 12.4 12.6
Net profit margins 4.9 6.2 5.0 5.7 6.3
Growth metrics (%)
Year to March FY17 FY18 FY19E FY20E FY21E
Revenues 38.7 27.5 32.5 14.9 21.4
EBITDA 61.1 30.8 37.1 23.1 23.4
PBT 60.1 82.6 14.4 31.0 31.7
Net profit 64.5 62.3 6.4 31.5 34.4
EPS 64.5 62.3 6.4 31.5 34.4
Note: HSSL financials have been not been collaborated for estimating FY20E and FY21E financials
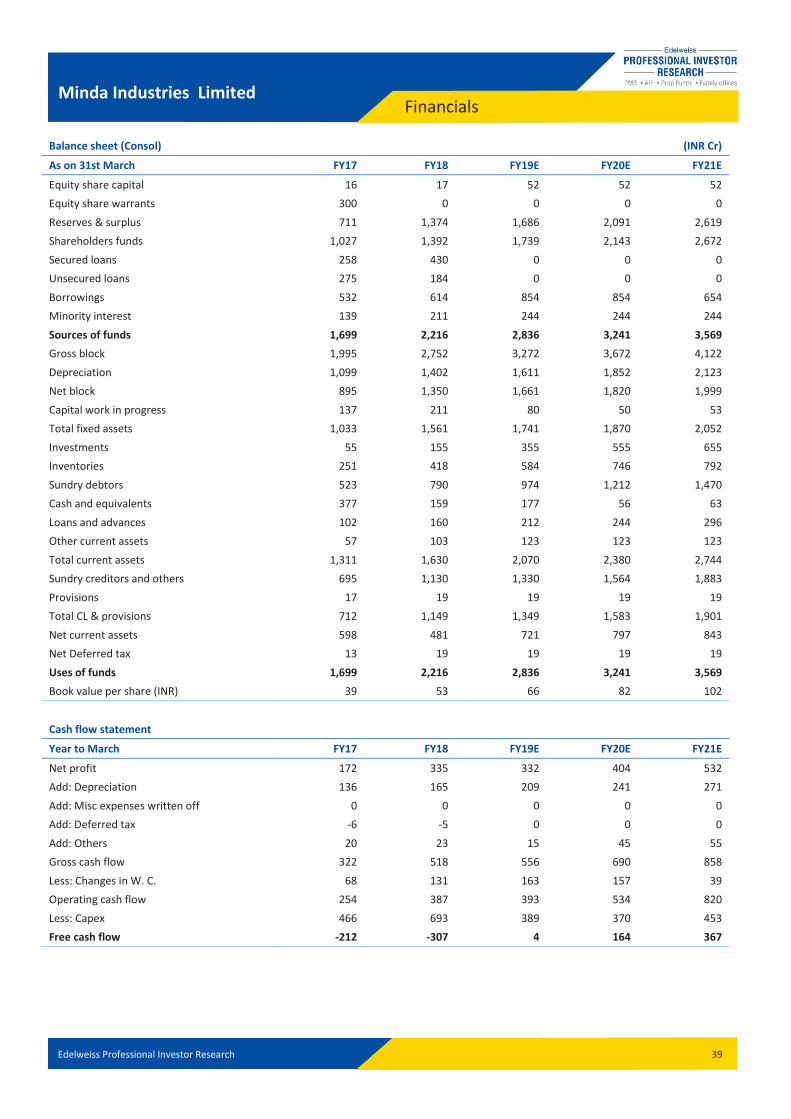
Edelweiss Professional Investor Research 39
Financials Minda Industries Limited
Balance sheet (Consol)
(INR Cr)
As on 31st March FY17 FY18 FY19E FY20E FY21E
Equity share capital 16 17 52 52 52
Equity share warrants 300 0 0 0 0
Reserves & surplus 711 1,374 1,686 2,091 2,619
Shareholders funds 1,027 1,392 1,739 2,143 2,672
Secured loans 258 430 0 0 0
Unsecured loans 275 184 0 0 0
Borrowings 532 614 854 854 654
Minority interest 139 211 244 244 244
Sources of funds 1,699 2,216 2,836 3,241 3,569
Gross block 1,995 2,752 3,272 3,672 4,122
Depreciation 1,099 1,402 1,611 1,852 2,123
Net block 895 1,350 1,661 1,820 1,999
Capital work in progress 137 211 80 50 53
Total fixed assets 1,033 1,561 1,741 1,870 2,052
Investments 55 155 355 555 655
Inventories 251 418 584 746 792
Sundry debtors 523 790 974 1,212 1,470
Cash and equivalents 377 159 177 56 63
Loans and advances 102 160 212 244 296
Other current assets 57 103 123 123 123
Total current assets 1,311 1,630 2,070 2,380 2,744
Sundry creditors and others 695 1,130 1,330 1,564 1,883
Provisions 17 19 19 19 19
Total CL & provisions 712 1,149 1,349 1,583 1,901
Net current assets 598 481 721 797 843
Net Deferred tax 13 19 19 19 19
Uses of funds 1,699 2,216 2,836 3,241 3,569
Book value per share (INR) 39 53 66 82 102
0 -0 0 0 0
Cash flow statement
Year to March FY17 FY18 FY19E FY20E FY21E
Net profit 172 335 332 404 532
Add: Depreciation 136 165 209 241 271
Add: Misc expenses written off 0 0 0 0 0
Add: Deferred tax -6 -5 0 0 0
Add: Others 20 23 15 45 55
Gross cash flow 322 518 556 690 858
Less: Changes in W. C. 68 131 163 157 39
Operating cash flow 254 387 393 534 820
Less: Capex 466 693 389 370 453
Free cash flow -212 -307 4 164 367
Edelweiss Professional Investor Research 40
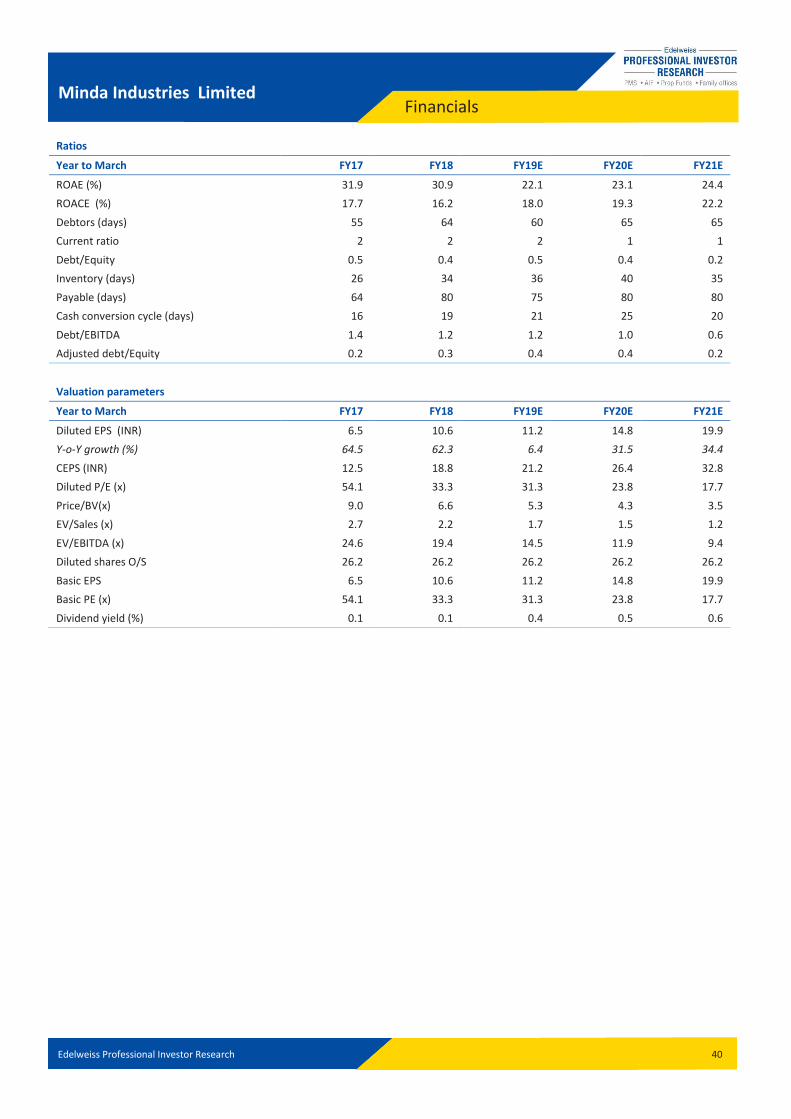
Financials Minda Industries Limited
Ratios
Year to March FY17 FY18 FY19E FY20E FY21E
ROAE (%) 31.9 30.9 22.1 23.1 24.4
ROACE (%) 17.7 16.2 18.0 19.3 22.2
Debtors (days) 55 64 60 65 65
Current ratio 2 2 2 1 1
Debt/Equity 0.5 0.4 0.5 0.4 0.2
Inventory (days) 26 34 36 40 35
Payable (days) 64 80 75 80 80
Cash conversion cycle (days) 16 19 21 25 20
Debt/EBITDA 1.4 1.2 1.2 1.0 0.6
Adjusted debt/Equity 0.2 0.3 0.4 0.4 0.2
Valuation parameters
Year to March FY17 FY18 FY19E FY20E FY21E
Diluted EPS (INR) 6.5 10.6 11.2 14.8 19.9
Y-o-Y growth (%) 64.5 62.3 6.4 31.5 34.4
CEPS (INR) 12.5 18.8 21.2 26.4 32.8
Diluted P/E (x) 54.1 33.3 31.3 23.8 17.7
Price/BV(x) 9.0 6.6 5.3 4.3 3.5
EV/Sales (x) 2.7 2.2 1.7 1.5 1.2
EV/EBITDA (x) 24.6 19.4 14.5 11.9 9.4
Diluted shares O/S 26.2 26.2 26.2 26.2 26.2
Basic EPS 6.5 10.6 11.2 14.8 19.9
Basic PE (x) 54.1 33.3 31.3 23.8 17.7
Dividend yield (%) 0.1 0.1 0.4 0.5 0.6
Edelweiss Professional Investor Research 41
Edelweiss Broking Limited, 1st Floor, Tower 3, Wing B, Kohinoor City Mall, Kohinoor City, Kirol Road, Kurla(W)
Board: (91-22) 4272 2200
Vinay Khattar
Head Research
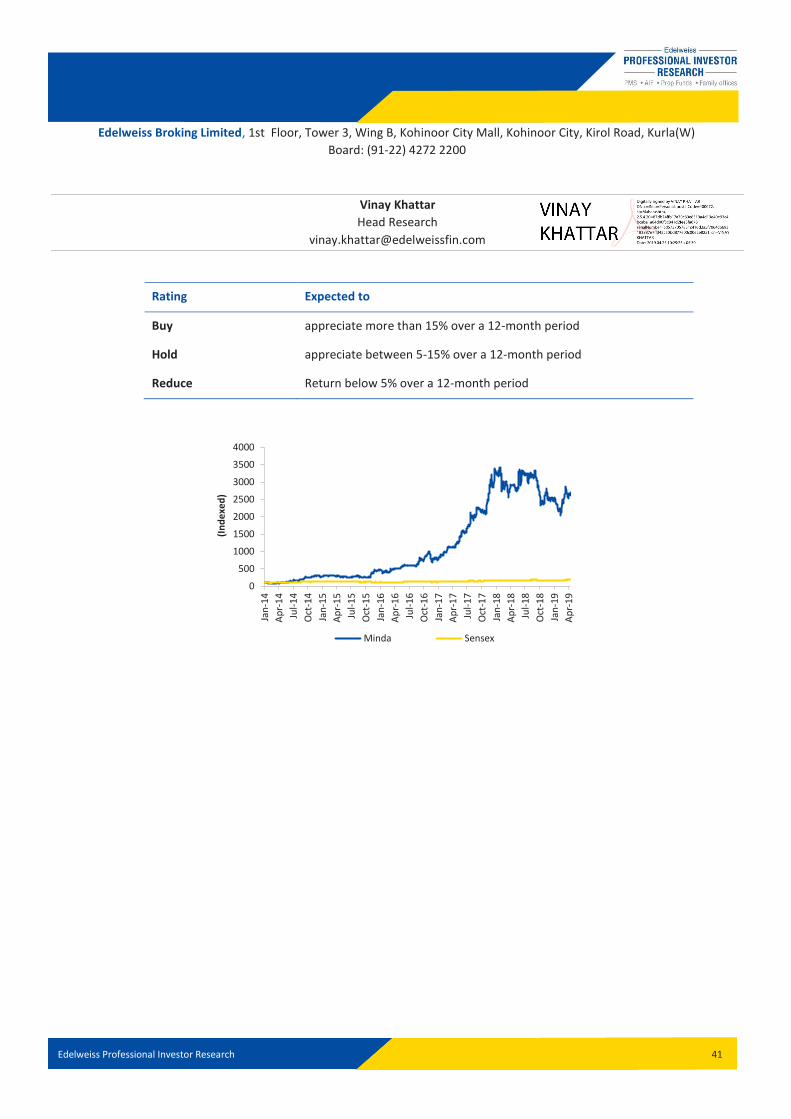
Rating Expected to
Buy appreciate more than 15% over a 12-month period
Hold appreciate between 5-15% over a 12-month period
Reduce Return below 5% over a 12-month period
0
500
1000
1500
2000
2500
3000
3500
4000
Jan
-14
Ap
r-1
4
Jul-
14
Oct
-14
Jan
-15
Ap
r-1
5
Jul-
15
Oct
-15
Jan
-16
Ap
r-1
6
Jul-
16
Oct
-16
Jan
-17
Ap
r-1
7
Jul-
17
Oct
-17
Jan
-18
Ap
r-1
8
Jul-
18
Oct
-18
Jan
-19
Ap
r-1
9
(In
de
xed
)
Minda Sensex
Edelweiss Professional Investor Research 42
Disclaimer Edelweiss Broking Limited (“EBL” or “Research Entity”) is regulated by the Securities and Exchange Board of India (“SEBI”) and is licensed to carry on the business of broking, depository
services and related activities. The business of EBL and its Associates (list available on www.edelweissfin.com) are organized around five broad business groups – Credit including
Housing and SME Finance, Commodities, Financial Markets, Asset Management and Life Insurance.
Broking services offered by Edelweiss Broking Limited under SEBI Registration No.: INZ000005231; Name of the Compliance Officer: Mr. Brijmohan Bohra, Email ID:
[email protected] Corporate Office: Edelweiss House, Off CST Road, Kalina, Mumbai - 400098; Tel. 18001023335/022-42722200/022-40094279
This Report has been prepared by Edelweiss Broking Limited in the capacity of a Research Analyst having SEBI Registration No.INH000000172 and distributed as per SEBI (Research
Analysts) Regulations 2014. This report does not constitute an offer or solicitation for the purchase or sale of any financia l instrument or as an official confirmation of any transaction.
The information contained herein is from publicly available data or other sources believed to be reliable. This report is pro vided for assistance only and is not intended to be and must
not alone be taken as the basis for an investment decision. The user assumes the entire risk of any use made of this information. Each recipient of this report should make such
investigation as it deems necessary to arrive at an independent evaluation of an investment in the securities of companies referred to in this document (including the merits and risks
involved), and should consult his own advisors to determine the merits and risks of such investment. The investment discussed or views expressed may not be suitable for all investors.
This information is strictly confidential and is being furnished to you solely for your information. This information should not be reproduced or redistributed or passed on directly or
indirectly in any form to any other person or published, copied, in whole or in part, for any purpose. This report is not directed or intended for distribution to, or use by, any person or
entity who is a citizen or resident of or located in any locality, state, country or other jurisdiction, where such distribut ion, publication, availability or use would be contrary to law,
regulation or which would subject EBL and associates / group companies to any registration or licensing requirements within such jurisdiction. The distribution of this report in certain
jurisdictions may be restricted by law, and persons in whose possession this report comes, should observe, any such restrictions. The information given in this report is as of the date
of this report and there can be no assurance that future results or events will be consistent with this information. This information is subject to change without any prior notice. EBL
reserves the right to make modifications and alterations to this statement as may be required from time to time. EBL or any of its associates / group companies shall not be in any way
responsible for any loss or damage that may arise to any person from any inadvertent error in the information contained in th is report. EBL is committed to providing independent and
transparent recommendation to its clients. Neither EBL nor any of its associates, group companies, directors, employees, agents or representatives shall be liable for any damages
whether direct, indirect, special or consequential including loss of revenue or lost profits that may arise from or in connection with the use of the information. Our proprietary trading
and investment businesses may make investment decisions that are inconsistent with the recommendations expressed herein. Past performance is not necessarily a guide to future
performance .The disclosures of interest statements incorporated in this report are provided solely to enhance the transparency and should not be treated as endorsement of the
views expressed in the report. The information provided in these reports remains, unless otherwise stated, the copyright of EBL. All layout, design, original artwork, concepts and other
Intellectual Properties, remains the property and copyright of EBL and may not be used in any form or for any purpose whatsoever by any party without the express written permission
of the copyright holders.
EBL shall not be liable for any delay or any other interruption which may occur in presenting the data due to any reason including network (Internet) reasons or snags in the system,
break down of the system or any other equipment, server breakdown, maintenance shutdown, breakdown of communication services or inability of the EBL to present the data. In no
event shall EBL be liable for any damages, including without limitation direct or indirect, special, incidental, or consequential damages, losses or expenses arising in connection with the
data presented by the EBL through this report.
We offer our research services to clients as well as our prospects. Though this report is disseminated to all the customers simultaneously, not all customers may receive this report at
the same time. We will not treat recipients as customers by virtue of their receiving this report.
EBL and its associates, officer, directors, and employees, research analyst (including relatives) worldwide may: (a) from time to time, have long or short positions in, and buy or sell the
securities thereof, of company(ies), mentioned herein or (b) be engaged in any other transaction involving such securities and earn brokerage or other compensation or act as a
market maker in the financial instruments of the subject company/company(ies) discussed herein or act as advisor or lender/borrower to such company(ies) or have other
potential/material conflict of interest with respect to any recommendation and related information and opinions at the time of publication of research report or at the time of public
appearance. EBL may have proprietary long/short position in the above mentioned scrip(s) and therefore should be considered as interested. The views provided herein are general in
nature and do not consider risk appetite or investment objective of any particular investor; readers are requested to take independent professional advice before investing. This should
not be construed as invitation or solicitation to do business with EBL.
EBL or its associates may have received compensation from the subject company in the past 12 months. EBL or its associates may have managed or co-managed public offering of
securities for the subject company in the past 12 months. EBL or its associates may have received compensation for investment banking or merchant banking or brokerage services
from the subject company in the past 12 months. EBL or its associates may have received any compensation for products or serv ices other than investment banking or merchant
banking or brokerage services from the subject company in the past 12 months. EBL or its associates have not received any compensation or other benefits from the Subject Company
or third party in connection with the research report. Research analyst or his/her relative or EBL’s associates may have financial interest in the subject company. EBL, its associates,
research analyst and his/her relative may have other potential/material conflict of interest with respect to any recommendation and related information and opinions at the time of
publication of research report or at the time of public appearance.
Participants in foreign exchange transactions may incur risks arising from several factors, including the following: ( i) exchange rates can be volatile and are subject to large
fluctuations; ( ii) the value of currencies may be affected by numerous market factors, including world and national economic, political and regulatory events, events in equity and debt
markets and changes in interest rates; and (iii) currencies may be subject to devaluation or government imposed exchange controls which could affect the value of the currency.
Investors in securities such as ADRs and Currency Derivatives, whose values are affected by the currency of an underlying security, effectively assume currency risk.
Research analyst has served as an officer, director or employee of subject Company: No
EBL has financial interest in the subject companies: No
EBL’s Associates may have actual / beneficial ownership of 1% or more securities of the subject company at the end of the month immediately preceding the date of publication of
research report.
Research analyst or his/her relative has actual/beneficial ownership of 1% or more securities of the subject company at the end of the month immediately preceding the date of
publication of research report: No
EBL has actual/beneficial ownership of 1% or more securities of the subject company at the end of the month immediately preceding the date of publication of research report: No
Subject company may have been client during twelve months preceding the date of distribution of the research report.
There were no instances of non-compliance by EBL on any matter related to the capital markets, resulting in significant and material disciplinary action during the last three years.
A graph of daily closing prices of the securities is also available at www.nseindia.com
Analyst Certification:
Edelweiss Professional Investor Research 43
Disclaimer The analyst for this report certifies that all of the views expressed in this report accurately reflect his or her personal views about the subject company or companies and its or their
securities, and no part of his or her compensation was, is or will be, directly or indirectly related to specific recommendations or views expressed in this report.
Additional Disclaimer for U.S. Persons
Edelweiss is not a registered broker – dealer under the U.S. Securities Exchange Act of 1934, as amended (the“1934 act”) and under applicable state laws in the United States. In
addition Edelweiss is not a registered investment adviser under the U.S. Investment Advisers Act of 1940, as amended (the "Advisers Act" and together with the 1934 Act, the "Acts),
and under applicable state laws in the United States. Accordingly, in the absence of specific exemption under the Acts, any brokerage and investment services provided by Edelweiss,
including the products and services described herein are not available to or intended for U.S. persons.
This report does not constitute an offer or invitation to purchase or subscribe for any securities or solicitation of any investments or investment services and/or shall not be considered
as an advertisement tool. "U.S. Persons" are generally defined as a natural person, residing in the United States or any entity organized or incorporated under the laws of the United
States. US Citizens living abroad may also be deemed "US Persons" under certain rules.
Transactions in securities discussed in this research report should be effected through Edelweiss Financial Services Inc.
Additional Disclaimer for U.K. Persons
The contents of this research report have not been approved by an authorised person within the meaning of the Financial Services and Markets Act 2000 ("FSMA").
In the United Kingdom, this research report is being distributed only to and is directed only at (a) persons who have professional experience in matters relating to investments falling
within Article 19(5) of the FSMA (Financial Promotion) Order 2005 (the “Order”); (b) persons falling within Article 49(2)(a) to (d) of the Order (including high net worth companies and
unincorporated associations); and (c) any other persons to whom it may otherwise lawfully be communicated (all such persons together being referred to as “relevant persons”).
This research report must not be acted on or relied on by persons who are not relevant persons. Any investment or investment activity to which this research report relates is available
only to relevant persons and will be engaged in only with relevant persons. Any person who is not a relevant person should not act or rely on this research report or any of its contents.
This research report must not be distributed, published, reproduced or disclosed (in whole or in part) by recipients to any other person.
Additional Disclaimer for Canadian Persons
Edelweiss is not a registered adviser or dealer under applicable Canadian securities laws nor has it obtained an exemption from the adviser and/or dealer registration requirements
under such law. Accordingly, any brokerage and investment services provided by Edelweiss, including the products and services described herein, are not available to or intended for
Canadian persons.
This research report and its respective contents do not constitute an offer or invitation to purchase or subscribe for any securities or solicitation of any investments or investment
services.
Disclosures under the provisions of SEBI (Research Analysts) Regulations 2014 (Regulations)
Edelweiss Broking Limited ("EBL" or "Research Entity") is regulated by the Securities and Exchange Board of India ("SEBI") and is licensed to carry on the business of broking, depository
services and related activities. The business of EBL and its associates are organized around five broad business groups – Credit including Housing and SME Finance, Commodities,
Financial Markets, Asset Management and Life Insurance. There were no instances of non-compliance by EBL on any matter related to the capital markets, resulting in significant and
material disciplinary action during the last three years. This research report has been prepared and distributed by Edelweiss Broking Limited ("Edelweiss") in the capacity of a Research
Analyst as per Regulation 22(1) of SEBI (Research Analysts) Regulations 2014 having SEBI Registration No.INH000000172.


![Minda Industries Ltd. •[MINDA]€¦ · of the Shareholders and Unsecured Creditors of Minda Industries Limited held on 19 November, 2019, signed by Mr. Raj iv Shankar Dvivedi, Chairman](https://static.documents.pub/doc/80x56/5e99efc05d23463bf8297f0b/minda-industries-ltd-aminda-of-the-shareholders-and-unsecured-creditors-of.jpg)
![Minda Industries Ltd. UNOlm]lJ](https://static.documents.pub/doc/80x56/617e3bc246274612c845954f/minda-industries-ltd-unolmlj.jpg)


