IOSR Journal of Engineering (IOSRJEN) www.iosrjen.org ISSN (e): 2250-3021, ISSN (p): 2278-8719 Vol. 04, Issue 04 (April. 2014), ||V1|| PP 30-40 International organization of Scientific Research 30 | P a g e Topping Process Using Different Methodologies. J. Martínez 1 , L.Ale Ruiz 2 , J.M. Vega 1 , M.C. Carrera 1 , E. Erdmann 3 y E.E. Tarifa 4 1 (Instituto de Investigaciones para la Industria Química - INIQUI-CONICET, Consejo de Investigaciones- CIUNSa, Facultad de Ingeniería- UNSa. Avda. Bolivia 5150. 4400 Salta – Argentina) 2 (Universidad Nacional de Salta. Facultad de Ingeniería. Avda. Bolivia 5150. 4400. Salta – Argentina) 3 (Instituto Tecnológico de Buenos Aires- ITBA, Instituto de Investigaciones para la Industria Química - INIQUI (CONICET-UNSa). Av. Eduardo Madero 399 (C1106ACD) – Buenos Aires – Argentina) 4 (CONICET. Universidad Nacional de Jujuy. Facultad de Ingeniería. Gorriti 237. 4600 San Salvador de Jujuy - Argentina) Abstract: - The first process which crude oil undergoes in a refinery is the atmospheric distillation o topping, whose aim is to fraction the crude oil in their products: naphtha, kerosene, gas oil, etc. The stages involved are: process analysis, carrying out laboratory analysis, identification of parameters, determination of operating conditions and analysis of operating procedures, data processing, stationary simulation and development of results. The column to simulate consists of a rectification column with three side separators and a condenser. For modeling this process a conventional procedure was performed using the Excel spreadsheet. And for simulating stationary was used HYSYS software. First the crude was characterized by laboratory analysis. Starting from these analyses, the TBP curve was built and global properties of crude were defined. Resolved the crude oil physicochemical, a model of the column was built. The stationary states found from simulation were compared with the results of the conventional procedure; the comparison had an acceptable degree of consistency. Finally, a series of alternatives were studied for the design and operating conditions. By resolving the designing process of the topping column, the advantages and disadvantages of a simulator can be compared with a conventional resolution method. Keywords: - Atmospheric Distillation, Crude Oil Plant, HYSYS, Model, Simulation I. INTRODUCTION The topping is the initial distillation of crude oil or petroleum, and consists in fractioning crude oil into the following cuts: gas, naphtha, JP or kerosene, light and heavy gas oil and atmospheric residue. Generally, it used to make the separation in one single column, which operates under a pressure slightly higher than the atmospheric one, possessing side extractions. Nowadays, distillation unit of crude oil is a fractionation single unit, on contrast with a set of units that were the first fractionation units. The crude oil feed to a fractional distillation tower is heated by flow through pipe arranged within a large furnace. The heating unit is known as a pipe-still furnace, and the heating unit and the fractional distillation tower make up the essential parts of a distillation unit or pipe-still. The crude oil feed is heated by furnace to a predetermined temperature. The vapor is held under pressure in the pipe-still furnace until it discharges as a foaming stream into the fractional distillation tower. Here the vapors pass up the tower to be fractionated into light and heavy gas oil, JP or kerosene, and naphtha. While the nonvolatile or liquid portion of the feed descends to the bottom of the tower to be pumped away as a bottom product. The stripping section is the part of the tower below the point at which the feed is introduced, the more volatile components are stripped from the descending liquid. Above the feed point, the rectifying section, the concentration of the less volatile components in the vapor is reduced. The tower is divided into a number of horizontal sections by metal trays, and each of them is equivalent to a distillation unit. The feed to a tower may be at any point from top to bottom with trays above and below the entry point, depending on the kind of feedstock and the characteristics desired in the products. The temperature of the trays is progressively cooler from bottom to top. The bottom tray is heated by the incoming heated crude oil feed. As the hot vapors pass upward in the tower, condensation occurs onto the trays until refluxing (simultaneous boiling of a liquid and condensing of the vapor) occurs on the trays. Vapors pass upward through the tower, whereas the liquids spill onto the tray below, and so on. Until the heat at a particular point is too intense for that fluid to remain in liquid condition; then it becomes vapor and joins the other vapors passing upward through the tower. The whole tower thus simulates a set of several distillers, with the composition of the liquid at any point or any tray remained fairly constant. This allows part of the refluxing liquid can be collected at various points as side stream product.
Transcript
IOSR Journal of Engineering (IOSRJEN) www.iosrjen.org
ISSN (e): 2250-3021, ISSN (p): 2278-8719
Vol. 04, Issue 04 (April. 2014), ||V1|| PP 30-40
International organization of Scientific Research 30 | P a g e
Topping Process Using Different Methodologies.
J. Martínez1, L.Ale Ruiz2, J.M. Vega1, M.C. Carrera1, E. Erdmann3 y E.E. Tarifa4 1(Instituto de Investigaciones para la Industria Química - INIQUI-CONICET, Consejo de Investigaciones-
CIUNSa, Facultad de Ingeniería- UNSa. Avda. Bolivia 5150. 4400 Salta – Argentina) 2(Universidad Nacional de Salta. Facultad de Ingeniería. Avda. Bolivia 5150. 4400. Salta – Argentina)
3 (Instituto Tecnológico de Buenos Aires- ITBA, Instituto de Investigaciones para la Industria Química -
INIQUI (CONICET-UNSa). Av. Eduardo Madero 399 (C1106ACD) – Buenos Aires – Argentina) 4(CONICET. Universidad Nacional de Jujuy. Facultad de Ingeniería. Gorriti 237. 4600 San Salvador de Jujuy -
Argentina)
Abstract: - The first process which crude oil undergoes in a refinery is the atmospheric distillation o topping,
whose aim is to fraction the crude oil in their products: naphtha, kerosene, gas oil, etc. The stages involved are:
process analysis, carrying out laboratory analysis, identification of parameters, determination of operating
conditions and analysis of operating procedures, data processing, stationary simulation and development of
results. The column to simulate consists of a rectification column with three side separators and a condenser. For
modeling this process a conventional procedure was performed using the Excel spreadsheet. And for simulating stationary was used HYSYS software. First the crude was characterized by laboratory analysis. Starting from
these analyses, the TBP curve was built and global properties of crude were defined. Resolved the crude oil
physicochemical, a model of the column was built. The stationary states found from simulation were compared
with the results of the conventional procedure; the comparison had an acceptable degree of consistency. Finally,
a series of alternatives were studied for the design and operating conditions. By resolving the designing process
of the topping column, the advantages and disadvantages of a simulator can be compared with a conventional
I. INTRODUCTION The topping is the initial distillation of crude oil or petroleum, and consists in fractioning crude oil into
the following cuts: gas, naphtha, JP or kerosene, light and heavy gas oil and atmospheric residue. Generally, it
used to make the separation in one single column, which operates under a pressure slightly higher than the
atmospheric one, possessing side extractions.
Nowadays, distillation unit of crude oil is a fractionation single unit, on contrast with a set of units that
were the first fractionation units.
The crude oil feed to a fractional distillation tower is heated by flow through pipe arranged within a
large furnace. The heating unit is known as a pipe-still furnace, and the heating unit and the fractional
distillation tower make up the essential parts of a distillation unit or pipe-still. The crude oil feed is heated by
furnace to a predetermined temperature. The vapor is held under pressure in the pipe-still furnace until it discharges as a foaming stream into the fractional distillation tower. Here the vapors pass up the tower to be
fractionated into light and heavy gas oil, JP or kerosene, and naphtha. While the nonvolatile or liquid portion of
the feed descends to the bottom of the tower to be pumped away as a bottom product.
The stripping section is the part of the tower below the point at which the feed is introduced, the more
volatile components are stripped from the descending liquid. Above the feed point, the rectifying section, the
concentration of the less volatile components in the vapor is reduced. The tower is divided into a number of
horizontal sections by metal trays, and each of them is equivalent to a distillation unit. The feed to a tower may
be at any point from top to bottom with trays above and below the entry point, depending on the kind of
feedstock and the characteristics desired in the products.
The temperature of the trays is progressively cooler from bottom to top. The bottom tray is heated by
the incoming heated crude oil feed. As the hot vapors pass upward in the tower, condensation occurs onto the
trays until refluxing (simultaneous boiling of a liquid and condensing of the vapor) occurs on the trays. Vapors pass upward through the tower, whereas the liquids spill onto the tray below, and so on. Until the heat at a
particular point is too intense for that fluid to remain in liquid condition; then it becomes vapor and joins the
other vapors passing upward through the tower. The whole tower thus simulates a set of several distillers, with
the composition of the liquid at any point or any tray remained fairly constant. This allows part of the refluxing
liquid can be collected at various points as side stream product.
Topping Process Using Different Methodologies
International organization of Scientific Research 31 | P a g e
The fractional distillation tower is characterized by the chemical complexity charge. The existence of
multiple side streams of product whose tenor of light hydrocarbon is adjusted in stripping columns. The heat
needed to vaporize the products are given with feeding to through to load furnace and exchange with products of
tower[1][2][3].
Two towers types are analyzed in this paper, Type I and Type II Towers. In Type I Tower all the heat is
extracted in the condenser head, so that the condensate does not have appropriate heat level to achieve a good
heat recovery. Because of the reflux is generated in head, liquid and vapor internal charges in the towers are increased from the bottom to the top substantially. To overcome this problem using a Type II Tower, where is
extracted fluid from a plate between two side extractions of product, it makes exchange heat with another stream
of the process (usually crude oil) and return to introduce some trays above; in the same tower section, this is a
circulating reflux. This operation reduces the area for the condenser head, the fuel consumption of load furnace,
internal charges of liquid and vapor above the return of circulating reflux in the tower, thus enabling the use of a
minor section tower in that zone. By allow standardization of internal flow and that the diameter of the tower is
the most suitable for the entire length of the said tower.
To model a process containing crude oil, the properties of the oil must be known or at least estimated.
Determining the exact composition of crude oils is not feasible because of the enormous number of components
comprising these mixtures. The crude oil is characterized then by a distillation curve done according to standard
procedures (TBP, ASTM D86 or D1160 distillation, etc.). Then, existing correlations are used to estimate the physical properties of crude oil from temperatures that conform the distillation curve. In this way, a crude oil
mixture may be modelled as a group of hypothetical components whose properties are estimated from different
portions of the boiling distillation curve. Experimental measurements such as density, viscosity, etc. generate
new curves that allow adjustment of crude oil estimates. To complete the characterization, molecular weight and
density are measured for the overall crude oil sample.
This paper describes the development of a topping stationary simulation, for Type I and Type II Tower.
The method is presented by using HYSYS simulator. Starting from the True Boiling Point (TBP) distillation
curve obtained on experimental basis global properties of crude oil were defined. With TBP curve and the
global properties, defined the hypothetical components required for HYSYS (University License. Version 7.3-
2013) were defined to model physicochemical crude oil. Once the physicochemical was determined, the tower
model was built. The results were compared with those obtained by conventional method[3] using Excel
spreadsheet.
II. METHODOLOGY 2.1 PETROLEUM CHARACTERIZATION
Laboratory standard methods for distillation of crude oil and fractions are of great value in refining and
formulating fuels. Three of the most important assays are [4] [5] [6] ASTM (considered the universal, normalized
method), TBP (whose results are difficult to reproduce), and Flash (instantaneous vaporization) [7].
2.1.1 The American Society for Testing and Materials (ASTM) curve
The ASTM distillation employs batch fractionation apparatus using non-refluxed Engler flasks, which possesses
standard dimensions. The heat flow is adjusted to produce 5 cm3 of distillate per minute. The temperature is registered when the first drop of distillate falls, and then every time that 10% of distillate is collected.
2.1.2 The TBP distillation curve
The TBP distillation is not standardized. The distilled is obtained from the division into fractions of the
load components. A getter device for crude oil and its derived products is used, which is loaded with 1000 to
5000 cm3 of liquid. The fractioning column is surrounded by a heater that compensates the lost heat. A
condenser at the top produces the vapor condensation, and the condensate descends; when it makes contact with
the vapor, the separation takes place. The temperature of the first drop, as well as for each 10% of distillate, is
registered.
2.1.3 The Equilibrium Flash Vaporization (EFV) distillation curve The sample is loaded on a receptacle; from there it is sent to a serpentine that is in a hot enclosure. The
vapors that are generated do not separate the liquid and remain in contact with it, until equilibrium is reached.
Then, the liquid is picked up and the vapor is condensed. Different operations are made with the same sample
amount and time period; but at different temperatures. The curve is obtained by plotting the corresponding the
liquid-vapor equilibrium temperature vs. percentage of distilled liquid volume.
2.2 TOPPING PROCESS
The designing of a topping column involves process design and equipment dimensionally. The process
design understands to calculate all operation conditions: head, bottom and feeding pressures; temperature of side
Topping Process Using Different Methodologies
International organization of Scientific Research 32 | P a g e
streams, feeding and products flows. Matter and energy balances should be performed. The column to be
analyzed is composed by a reflux absorber, with three lateral separators and a condenser head.
The analysis is carried out using two methods: conventional procedure and simulation with HYSYS. In
the first place, crude oil is characterized through laboratory analysis execution. Starting from these analyses, the
corresponding TBP curved is built (to 760 mmHg). This curve is presented in the Fig. 1.
Fig. 1. TBP DISTILLATION CURVE.
2.2.1 CONVENTIONAL PROCEDURE
For topping design by conventional procedure is necessary to transform the data distillation curve from
TBP to EFV, Tarifa et al. (2009) [7] presents a new method to estimate the equilibrium flash vaporization (EFV)
distillation curve from standard laboratory analytical assay procedures. The cuts of this process should take place with ASTM maximum temperature specifications presented in Table 1.
Table 1. ASTM Maximum Temperatures Of Cuts. Cuts
Max Temperature
N NAPHTHA 170°C-338°F
JP JP (kerossene) 245°C-473°F
GOL GAS OIL (Light) 300°C-572°F
GOP GAS OIL (Heavy) 345°C-653°F
2.2.1.1 Tower Design
A Type I Tower serves as basis. The number of tray is defined after having found the cutting
temperatures and performance; for this problem the adopted trays quantity is 29. The head pressure is adopted in
5.5 to 6 psi keeping in mind that between the last tray and the separator there is a load loss of 5 psi and, a load
loss 0.2 psi per tray.
2.2.1.2 Products Characterization
The TBP cut point is determined following the Watkins method on the crude TBP curve, obtaining the
products volumetric performances starting from the specifications given. Afterwards, the following tasks are
accomplished:
Construction of products TBP curves. Verification of products specifications.
Determination of products properties.
Realization of matter balance.
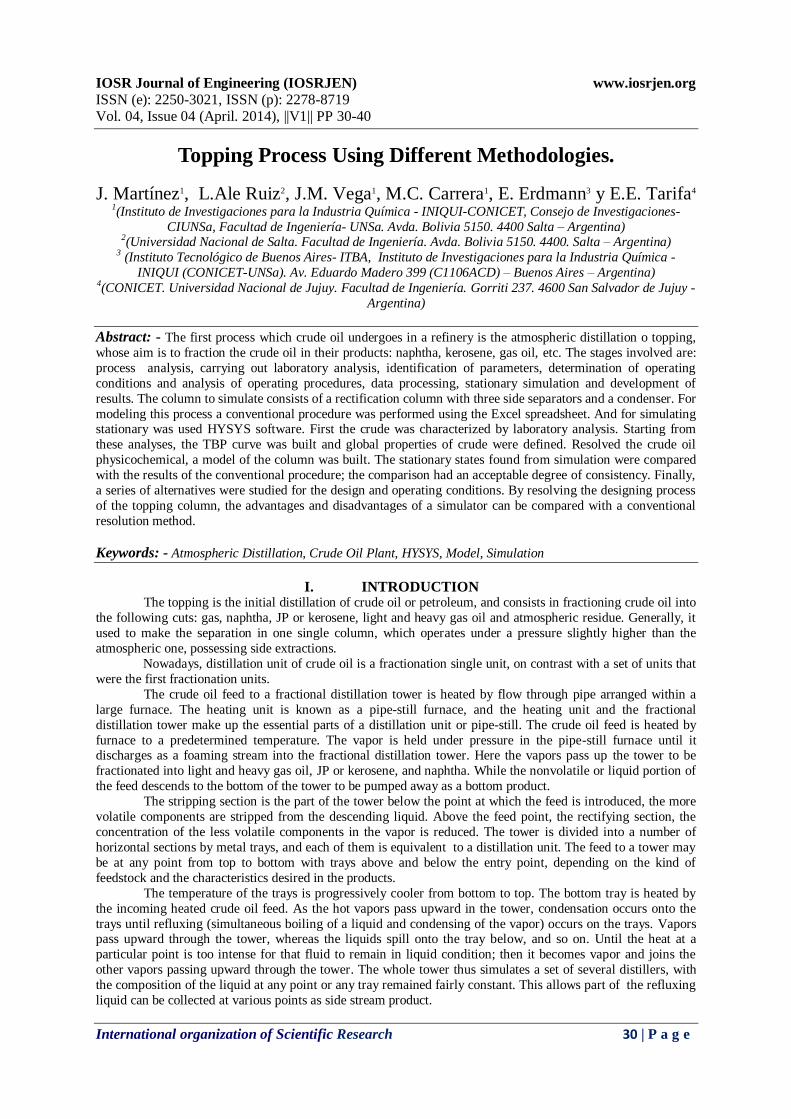
Once the products properties are obtained, the calculations by zones are begum. The involved areas are
those shown in the Fig. 2.
Topping Process Using Different Methodologies
International organization of Scientific Research 33 | P a g e
Fig. 2. TOPPING TOWER ZONES.
2.2.1.3 Flash Zone
This zone has direct connection with the exterior. The crude oil feed (F) enters in the feeding tray that
corresponds, in this case, to tray 4, to a temperature that does not exceed the 350 ºC (660 ºF), to avoid cracking.
The temperature (tZF) should be such that allows that the products to obtain for head, for lateral strippers and a
certain crude oil additional quantity (call over flash: OF) are vaporized. The calculation procedure is presented
below:
Data: F (crude oil flow) and B (residual flow).
Unknown Variables: SB (water vapor of stripping), VSB (pulled hydrocarbons by bottom vapor), OF (over
flash), V0 (vaporized crude oil), tZF (flash zone temperature), Lo (crude oil without vaporizing), LZF (liquid that enters to stripper), VZF (vapor that enters to washing area), t4 (tray 4 temperature) and t5 (tray 5 temperature).
Equations of matter balances, (1) (2) (3).
VZF = V0 + VSB (1)
VZF = N + JP + GOL + GOP + OF (2)
V0 = N + JP (3)
2.2.1.4 Bottom Stripper Calculation Matter and energy balances are established in the bottom tower with the purpose of calculating the
bottom temperature, tB.
Data: F; B; SB; VSB, OF, V0, tZF, Lo, LZF, VZF, t4, t5. Unknown Variables: tSB (temperature of water vapor of the stripping), tB (residual (B) temperature).
Knowing the properties and the temperatures corresponding to each flow, the required enthalpies are
obtained to solve the energy balance in the zone and to find tB.
2.2.1.5 Washing Zone
The washing zone is comprised between the feeding and the last side stream (from tray 5 to tray 7).
Unknown Variables: Si (water vapor of lateral stripping), VSi (despoiled vapor in the lateral stripping), t7
(temperature of the side stream tray), t6 (vapor temperature that ascends toward extraction tray), L7 (liquid flow
that leaves the extraction tray). Equations of matter balances, (4) (5)
𝑉𝑍𝐹 = 𝑁 + 𝐽𝑃 + 𝐺𝑂𝐿 + 𝐺𝑂𝑃 + 𝑂𝐹 (4)
𝑉6 = 𝑁 + 𝐽𝑃 + 𝐺𝑂𝐿 + 𝐺𝑂𝑃 + 𝐿7 (5)
Equation of energy balance, (6)
𝑄𝑆𝐵 = 𝑄𝑉𝑍𝐹 + 𝑄𝐿7 = 𝑄𝑉6 + 𝑄𝑆𝐵 + 𝑄𝑂𝐹 (6)
To obtain t7, the range of this current (VSGOP + GOP), is extended from 0 - 100%, starting from the TBP
curve of the crude oil. The 0% atmospheric Flash temperature of the current is obtained; with this value (starting
from graphics) we obtain the value of the lateral extraction temperature, t7. For lineal interpolation between t5 and t7, t6 is calculated. The variable L7 is determined making an enthalpy balance in the lateral stripper.
Knowing the properties and temperatures corresponding to each flow it is possible to obtain the necessary
enthalpies to solve this energy balance.
2.2.1.6 GOP – GOL Extraction Zone
The calculation procedure is presented below: equations of matter balance, (7) (8) and equations of
energy balance, (9).
Topping Process Using Different Methodologies
International organization of Scientific Research 34 | P a g e
Estimate of GOL extraction temperature, t14: to obtain t14 (bubble temperature), the range of this current
(VSGOL + GOL) is extended from 0 - 100%, starting from the TBP curve of the crude oil. The 0% atmospheric
Flash temperature of the current is obtained, with this value (starting from graphics) is obtained the value of the
lateral extraction temperature, t14. For lineal interpolation between t7 and t14, t13 is calculated. The variable L14 is
determined making an enthalpy balance in the lateral stripper. Knowing the properties and temperatures
corresponding to each flow is possible to obtain the necessary enthalpies to solve this energy balance.
2.2.1.7 GOL - JP Extraction Zone
The calculation procedure is presented below: equations of matter balance, (10) (11).
V19 = N + JP + L20 (10)
V13 = N + JP + GOL + L14 (11)
In order to estimate the extraction temperature of JP, t20, the procedure is identical to the previous
extraction zone, the same as the energy balance to find L20. All the estimated temperatures should be verified, if
the calculated temperature and the estimated one differ by 10 ºF, the calculation should be restarted, which is
iterative until obtaining the difference of permissible temperature.
2.2.1.8 Upper Zone.
For appreciation of TD, it is proposed t28 = tD, corresponding to the dew point temperature of the head
product: Naphtha (N), that is to say the 100% EFV (atm) curve temperature of the cut N.
The calculation procedure is presented below:
A head temperature, somehow lower than the dew point temperature of the head product (t100%) is adopted.
For interpolation with t20, t27 can be calculated.
The heat and mass balances is carried out to calculate internal reflux (Ri), that flows from the plate 28.
It is considered that the properties of Ri are similar to N.
For the external reflux (Re) calculation an enthalpy balance in the last tray is carried out, fixing a
temperature in the condenser. It is considered that Re has the same composition that N.
The thermal loads of condenser (Qc) is the heat that should be extracted of the condenser. By means an
enthalpy balance in the condenser, the Qc is obtained.
2.2.1.9 Modification Type II Tower
Circulating refluxes between two lateral extractions are incorporated to the basic Tower. Choosing the introduction place of circulating reflux where the vapor flows upward and the descending liquid manifest a
change of considerable slope. The action of the circulating reflux produces a decrease of liquid load and internal
vapor on top of the reflux return to the tower.
The temperature from the immediate superior extraction tray at the recycle return is estimated; the trays
temperatures involved in the recycle are calculated by lineal profile, the mass of circulating reflux and the
extracted heat are fixed. The liquid current flow that leaves of superior immediate lateral extraction tray (will
appear much smaller as greater is the extracted heat) is calculated by thermal balance. The calculations are
repeated in similar form to those carried out for the Type I Tower to find the rest of the flows and temperatures.
The conventional calculation procedure is very long and tedious, having to read permanently petroleum industry
characteristic graphic and abacus. A simple change implies a great work for to turn to find flows values,
temperatures and pressures again for up of this change.
2.2.2 PROCEDURE WITH HYSYS SIMULATOR
The hypothetical components that HYSYS requires to model the physical-chemistry of the petroleum
were defined with TBP data and global properties. The main flowsheet of the simulator of processes HYSYS is
shown in Fig. 3. For this model, the properties package choosing to be used in the fluid package is Peng
Robinson [8]. The crude oil example is fed to the pre-flash drum, modeled as a separator, where vapor are
separated from the crude oil liquid. The liquids are then heated to 350 ºC (660 ºF) in the crude oil furnace,
modeled as a heater. The pre-flash vapors bypass the furnace and re-combined, using a mixer, with the hot crude
stream. The combined stream is then fed to the atmospheric column for separation. The crude oil column is
modeled as a refluxed absorber, equipped with three side-stripper operations.
Topping Process Using Different Methodologies
International organization of Scientific Research 35 | P a g e
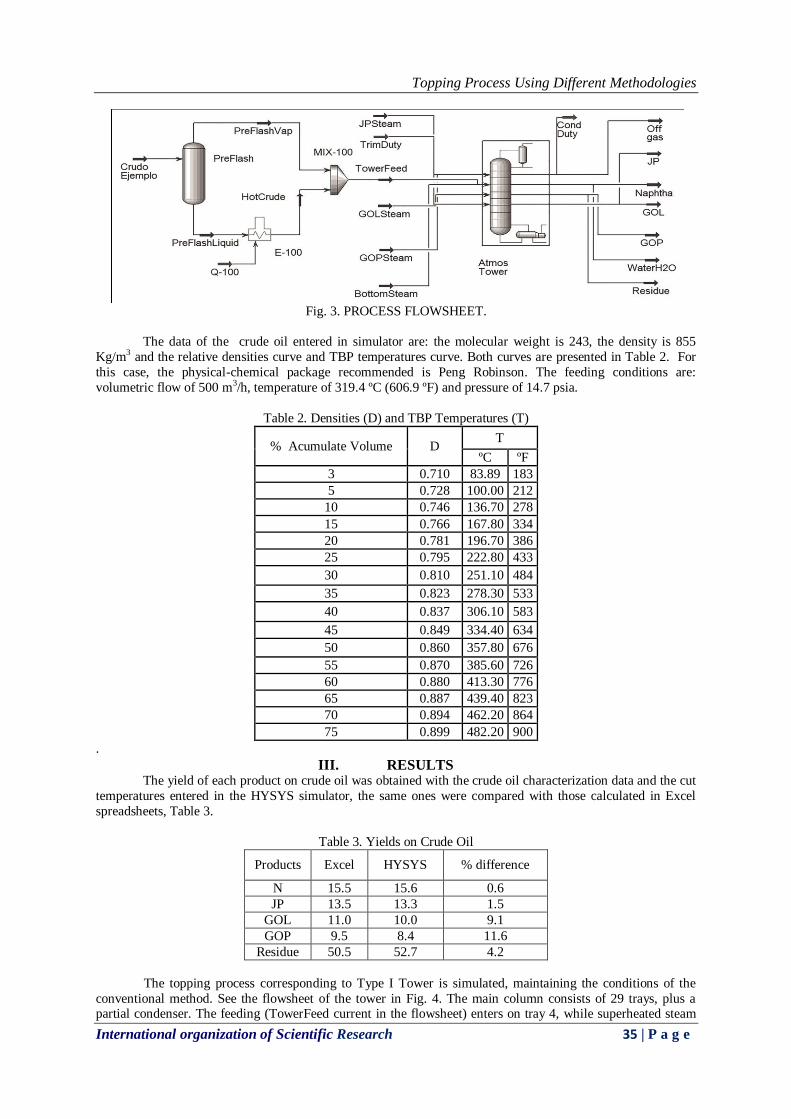
Fig. 3. PROCESS FLOWSHEET.
The data of the crude oil entered in simulator are: the molecular weight is 243, the density is 855
Kg/m3 and the relative densities curve and TBP temperatures curve. Both curves are presented in Table 2. For
this case, the physical-chemical package recommended is Peng Robinson. The feeding conditions are:
volumetric flow of 500 m3/h, temperature of 319.4 ºC (606.9 ºF) and pressure of 14.7 psia.
Table 2. Densities (D) and TBP Temperatures (T)
% Acumulate Volume D T
ºC ºF
3 0.710 83.89 183
5 0.728 100.00 212
10 0.746 136.70 278
15 0.766 167.80 334
20 0.781 196.70 386
25 0.795 222.80 433
30 0.810 251.10 484
35 0.823 278.30 533
40 0.837 306.10 583
45 0.849 334.40 634
50 0.860 357.80 676
55 0.870 385.60 726
60 0.880 413.30 776
65 0.887 439.40 823
70 0.894 462.20 864
75 0.899 482.20 900
.
III. RESULTS The yield of each product on crude oil was obtained with the crude oil characterization data and the cut
temperatures entered in the HYSYS simulator, the same ones were compared with those calculated in Excel
spreadsheets, Table 3.
Table 3. Yields on Crude Oil
Products Excel HYSYS % difference
N 15.5 15.6 0.6
JP 13.5 13.3 1.5
GOL 11.0 10.0 9.1
GOP 9.5 8.4 11.6
Residue 50.5 52.7 4.2
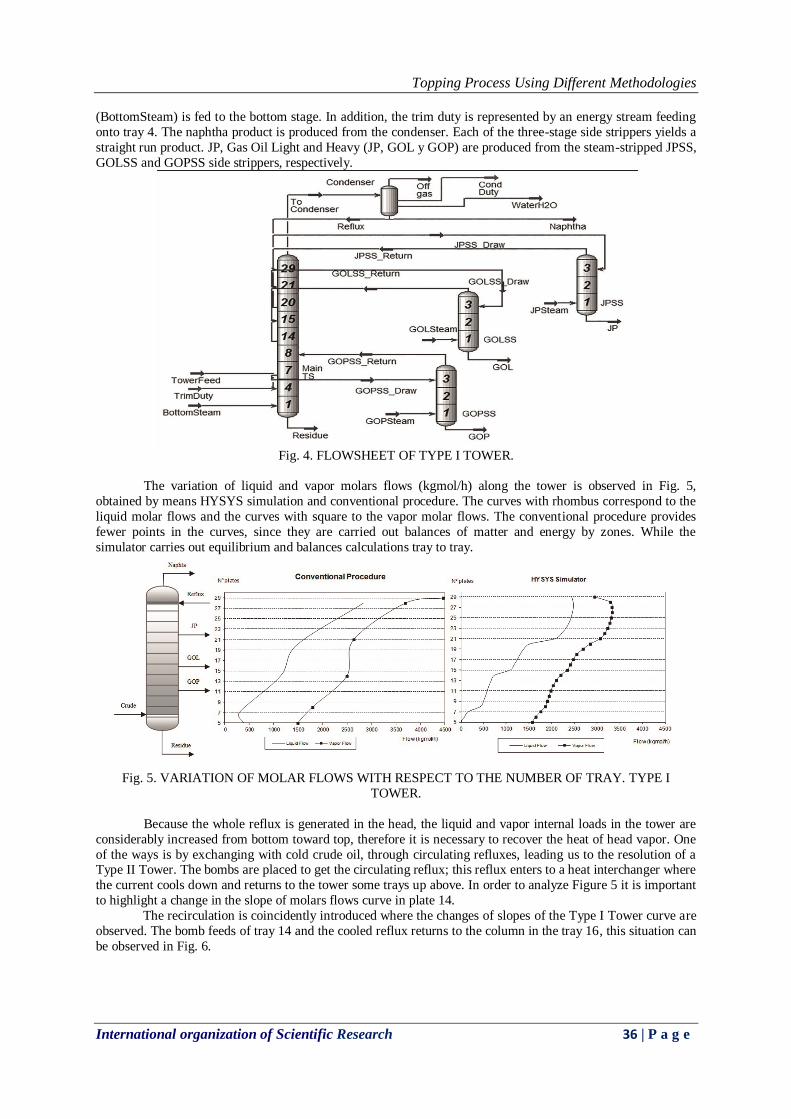
The topping process corresponding to Type I Tower is simulated, maintaining the conditions of the
conventional method. See the flowsheet of the tower in Fig. 4. The main column consists of 29 trays, plus a partial condenser. The feeding (TowerFeed current in the flowsheet) enters on tray 4, while superheated steam
Topping Process Using Different Methodologies
International organization of Scientific Research 36 | P a g e
(BottomSteam) is fed to the bottom stage. In addition, the trim duty is represented by an energy stream feeding
onto tray 4. The naphtha product is produced from the condenser. Each of the three-stage side strippers yields a
straight run product. JP, Gas Oil Light and Heavy (JP, GOL y GOP) are produced from the steam-stripped JPSS,
GOLSS and GOPSS side strippers, respectively.
Fig. 4. FLOWSHEET OF TYPE I TOWER.
The variation of liquid and vapor molars flows (kgmol/h) along the tower is observed in Fig. 5,
obtained by means HYSYS simulation and conventional procedure. The curves with rhombus correspond to the
liquid molar flows and the curves with square to the vapor molar flows. The conventional procedure provides
fewer points in the curves, since they are carried out balances of matter and energy by zones. While the
simulator carries out equilibrium and balances calculations tray to tray.
Fig. 5. VARIATION OF MOLAR FLOWS WITH RESPECT TO THE NUMBER OF TRAY. TYPE I
TOWER.
Because the whole reflux is generated in the head, the liquid and vapor internal loads in the tower are
considerably increased from bottom toward top, therefore it is necessary to recover the heat of head vapor. One
of the ways is by exchanging with cold crude oil, through circulating refluxes, leading us to the resolution of a Type II Tower. The bombs are placed to get the circulating reflux; this reflux enters to a heat interchanger where
the current cools down and returns to the tower some trays up above. In order to analyze Figure 5 it is important
to highlight a change in the slope of molars flows curve in plate 14.
The recirculation is coincidently introduced where the changes of slopes of the Type I Tower curve are
observed. The bomb feeds of tray 14 and the cooled reflux returns to the column in the tray 16, this situation can
be observed in Fig. 6.
Topping Process Using Different Methodologies
International organization of Scientific Research 37 | P a g e
Fig. 6. FLOWSHEET OF TYPE II TOWER WITH A RECIRCULATING FLOW.
The data required to install a bomb in the tower are the recirculating flow and temperature drop (∆T)
among the entrance current to the bomb and the current that returns to the tower, is considered as recirculating
flow to 40% of liquid volumetric flow that these tray and a temperature drop of 100 ºC.
A marked slope change in the curves of the flows of Type II Tower in tray 20 is also observed. Thus, a second bomb is added, Fig. 7. This bomb feeds from tray 20 and the cooled reflux returns to the column in tray
22.
Fig. 7. FLOWSHEET OF TYPE II TOWER WITH TWO CIRCULATING REFLUXES.
The same considerations as in the first one are carried out to install this second bomb. A Type II Tower
with two bombs by HYSYS simulator is solved, the flow variation with respect to number of trays for a Type II
Tower with 2 pumps can be seen in Fig. 8.
Topping Process Using Different Methodologies
International organization of Scientific Research 38 | P a g e
Fig. 8. VARIATION OF MOLAR FLOW WITH RESPECT TO THE NUMBER OF TRAY. TYPE II TOWER.
The differences between the molar flow values can be compared in Figures 9a and 9b with respect to
the number of trays for Type I and II Towers. An improvement in the curve slope of Type II Tower with regard
to Type I in trays 14 and 20 is seen, coincident with the introduction of the respective circulating reflux.
Fig. 9a. Variation Of Liquid Flow With Respect To The Number Of Trays For Type I And Type Ii Towers.
Fig. 9b. Variation Of Vapor Flow With Respect To The Number Of Trays For Type I And Type Ii Towers.
Topping Process Using Different Methodologies
International organization of Scientific Research 39 | P a g e
The purpose of carrying out a modification of Type I to Type II is reflected in Fig. 9, where a decrease
in the flow slope in function of the tower height can be seen. This means that the liquid and vapor internal
decrease beyond the return from circulating reflux to the tower, thus allowing the possibility of using a smaller
section in this area. The temperatures of vapor - liquid equilibrium (Equilibrium Flash Vaporization EFV) are
shown in Table 4, both the Type I and Type II are very similar. The molar flow of products obtained by
simulation and conventional procedure (HYSYS and Excel) for Type I and II Towers are presented in Table 5.
Table 4. Products Temperatures (ºF).
Products
Type I Tower. Without Recirculation.
HYSYS Excel
Naphtha 273 283
JP 399 371
GOL 539 498
GOP 663 598
Table 5. Products molar flow (kgmol/h).
In the conventional calculus the specified temperatures are the starting point for the calculation of both
towers. These temperatures are taken as the final temperatures of the product and they give the yields of the
crude for the later calculation of molar flow values. The difference between Type I and II Tower can be seen
mainly in the variation of internal flows and in the energy requirement of each condenser. It can be observed
that the Type II tower requires less energy.
The HYSYS simulator can calculate a Type I and Type II Tower and the temperatures of the final
products obtained by simulation fulfill the specifications given in Table 1. The values obtained in the simulation
are not very different from those calculated by conventional procedure. The TBP curves of each product of topping must be transformed into EFV curves in order to verify if
the simulation produces the commercial cuts previously defined. By definition, the EFV curve is generated by a
serie of experiments carried out at constant pressure (usually at 1 atm). The result linking equilibrium
temperature with percentage of distilled liquid volume where the total vapor is in equilibrium with the liquid
that is not evaporated. This curve is widely used in the design of equipment for the petrochemical industry [6].
The experimental procedure for obtain the EFV curve is complicated; this curve is usually estimated from other
curves that involve simpler experimental procedures. The Edmister and Maxwell methods are commonly used to
estimate the EFV curve. These methods use a graphic procedure which require data obtained from diagrams and
tables.
The comparison of EFV curves of each products obtained from the conventional method and
simulation (Tarifa et al. (2009) [7]) was performed. The EFV curve of naphtha is presented in Fig.10, where a small difference between the two methodologies is observed, matching in the 100% value of the mentioned
curve.
Fig. 10. Efv Curves Of Naphtha. (H) Obtained From Hysys (C) Obtained From Conventional Procedure.
Products
Type I Tower.
Without Recirculation.
Type II Tower.
With Recirculation.
HYSYS Excel HYSYS Excel
Naphtha 553.9 543.7 553.6 543.7
JP 335.8 326.9 335.9 326.9
GOL 211.1 213.6 211.3 213.6
GOP 142.6 154.5 144.0 154.5
Topping Process Using Different Methodologies
International organization of Scientific Research 40 | P a g e
IV. CONCLUSION The distillation is a fundamental process in the crude oil refining industry. It allows fractioning
hydrocarbons of a crude cut taking advantage of their different boiling points. The first process which crude oil
undergoes in a refinery is the atmospheric distillation. In that stage, crude oil is separated in fractions which, after some additional processing, will give origin to the main products that are sold in the market: LP gas (used
in domestic furnaces), gasoline for automobiles, turbosina for airplanes jet, gas oil for automobiles. Another
process related to topping is vacuum distillation of the bottom product of atmospheric distillation.
The designing of a Type I tower allows, furthermore, the analysis of the internal flows and uniform
them through a Type II tower, with the purpose of obtaining an adequate diameter of the tower.
Working with the HYSYS simulator allows, without mayor efforts, to carry out changes, for example,
something very usual in the industry, the exchanging the properties of the crude oil to be processed and, at the
end, the distillation curve.
The process design of the Type I and Type II topping columns is performed using conventional
methods and a process simulator. In this work, the advantages and disadvantages of each method have been
analyzed.
The simulation can be applied to carry out a parametric sensibility study in order to fractionate a crude oil, from a petroleum characterization curve.
[8] Aspen Hysys v. 7.3.2.- Aspentech. Aspen Technology, Inc. Cambridge, USA. 2012.
[9] Speight, J. The Chemestry and Technology of Petroleum. Marcel Dekker Inc. New York. 1999.
[10] J.P.Wauquier, El Refino del petróleo. Petróleo Crudo. Productos Petrolíferos. Esquemas de
Fabricación. 1era edición. Instituto Superior de la Energía, ISE. Ed. Diaz de Santos. 2004.
[11] M. S. Lopes, M Saviolo Lopes, R. Maciel Filho, M.R. Maciel, L. C. Medina. Extension of the TBP
curve of petroleum using the correlation DESTMOL. Procedia Engineering 42 (2012) 726- 732. [12] V. Kumar, A. Sharma, I. R. Chowdhury, S.Ganguly, D. N. Saraf. A crude distillation unit model
suitable for online applications. Fuel Processing Technology 73 (2001) 1-21.
[13] T. Cheatterjee, D. N. Saraf. On-line estimation of product properties for crude distillation units. Journal
of Process Control 14 (2004) 61-77.
[14] M. Errico, G. Tola, M. Mascia. Energy saving in a crude distillation unit by a preflash implementation.
Applied Thermal Engineering 29 (2009) 1642- 1647.
[15] G. Argirov, S. Ivanov, G. Chalokov. Estimation of crude oil TBP from crude viscosity. Fuel 97 (2012)
358- 365.
[16] M. A. Fahim, T. A. Alsahhaf and A. Elkilani, Fundamentals of Petroleum Refining. (Imprint Elsevier