Page 1
LIFULL Co., Ltd.
Disclaimer
The opinions and projections, etc. contained herein represent the judgment of LIFULL Co., Ltd. at the time this document was prepared. We provide no guarantees regarding the accuracy of
the information. Please keep in mind that actual performance and results may vary significantly due to fluctuations in various factors.
Earnings Presentation IFRS
Third Quarter of the Fiscal Year Ending September 30, 2018
(October 2017 to June 2018)
Copyright(c) LIFULL Co., Ltd. All Rights Reserved.
Page 2
1. Key Points P.02
2. Consolidated Results for FY2018/9 Q3 P.03
3. Progress of Business Forecast P.11
4. HOME’S Services Business P.22
5. Overseas Business P.32
6. Others Business P.48
7. Appendix P.52
8. IR Office Information P.69
Index
1
Page 3
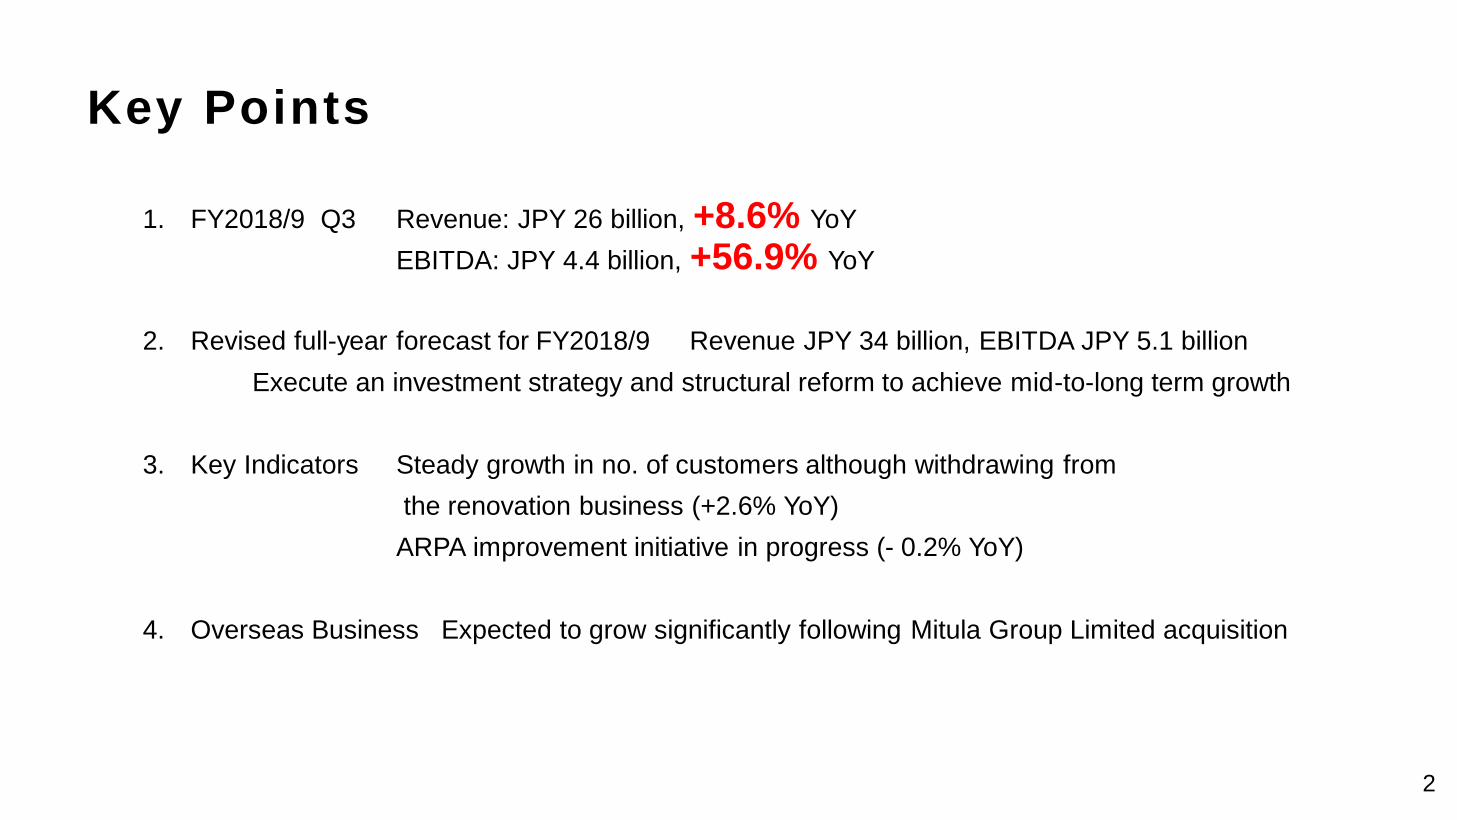
Key Points
1. FY2018/9 Q3 Revenue: JPY 26 billion, +8.6% YoY
EBITDA: JPY 4.4 billion, +56.9% YoY
2. Revised full-year forecast for FY2018/9 Revenue JPY 34 billion, EBITDA JPY 5.1 billion
Execute an investment strategy and structural reform to achieve mid-to-long term growth
3. Key Indicators Steady growth in no. of customers although withdrawing from
the renovation business (+2.6% YoY)
ARPA improvement initiative in progress (- 0.2% YoY)
4. Overseas Business Expected to grow significantly following Mitula Group Limited acquisition
2
Page 4
Consolidated Results for
FY2018/9 Q3
Copyright(c) LIFULL Co., Ltd. All Rights Reserved. 3
Page 5
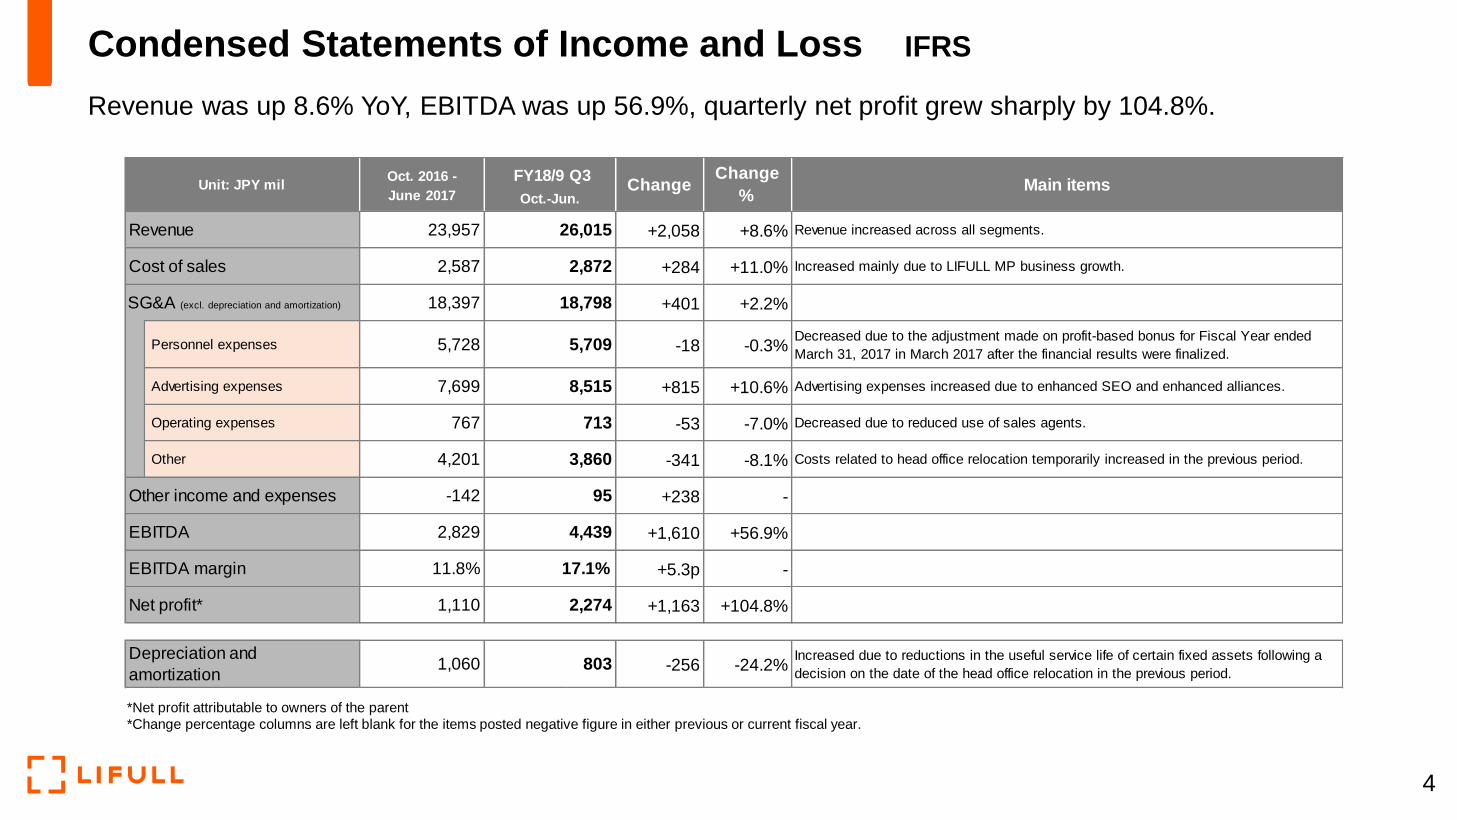
Condensed Statements of Income and Loss IFRS
Revenue was up 8.6% YoY, EBITDA was up 56.9%, quarterly net profit grew sharply by 104.8%.
4
*Net profit attributable to owners of the parent
*Change percentage columns are left blank for the items posted negative figure in either previous or current fiscal year.
FY18/9 Q3
+2,058 +8.6% Revenue increased across all segments.
+284 +11.0% Increased mainly due to LIFULL MP business growth.
+401 +2.2%
Personnel expenses -18 -0.3%Decreased due to the adjustment made on profit-based bonus for Fiscal Year ended
March 31, 2017 in March 2017 after the financial results were finalized.
Advertising expenses +815 +10.6% Advertising expenses increased due to enhanced SEO and enhanced alliances.
Operating expenses -53 -7.0% Decreased due to reduced use of sales agents.
Other -341 -8.1% Costs related to head office relocation temporarily increased in the previous period.
+238 -
+1,610 +56.9%
+5.3p -
+1,163 +104.8%
-256 -24.2%Increased due to reductions in the useful service life of certain fixed assets following a
decision on the date of the head office relocation in the previous period.
Revenue
Unit: JPY mil
23,957
2,587
18,397
Net profit*
Depreciation and
amortization
Cost of sales
SG&A (excl. depreciation and amortization)
Other income and expenses
EBITDA
EBITDA margin
ChangeChange
%Main items
Oct. 2016 -
Oct.-Jun.
1,060
26,015
2,872
18,798
5,709
8,515
713
3,860
95
4,439
17.1%
2,274
803
2,829
11.8%
1,110
4,201
-142
5,728
7,699
767
June 2017
Page 6
Cost of sales and other SG&A
Advertising expenses
Personnel expenses
EBITDA margin
Expense-to-Revenue Ratio IFRS
Despite an increase in the ratio of advertising expenses, the EBITDA margin improved thanks to lower ratios of cost of sales
and other SG&A and personnel expenses
5
19.5% 19.2%11.8%
17.1%
24.1% 25.2%
23.9%
21.9%
31.6% 26.7%
32.1%32.7%
24.8%29.0%
32.1%28.3%
14.10-15.6 15.10-16.6 16.10-17.6 FY18/9 Q3(17.10-18.6)
+4.2p
-5.0p
+1.1p
+3.2p
+5.5p
-1.3p
-0.3p -7.4p
-2.0p
+0.6p
-3.9p
+5.3p
Page 7
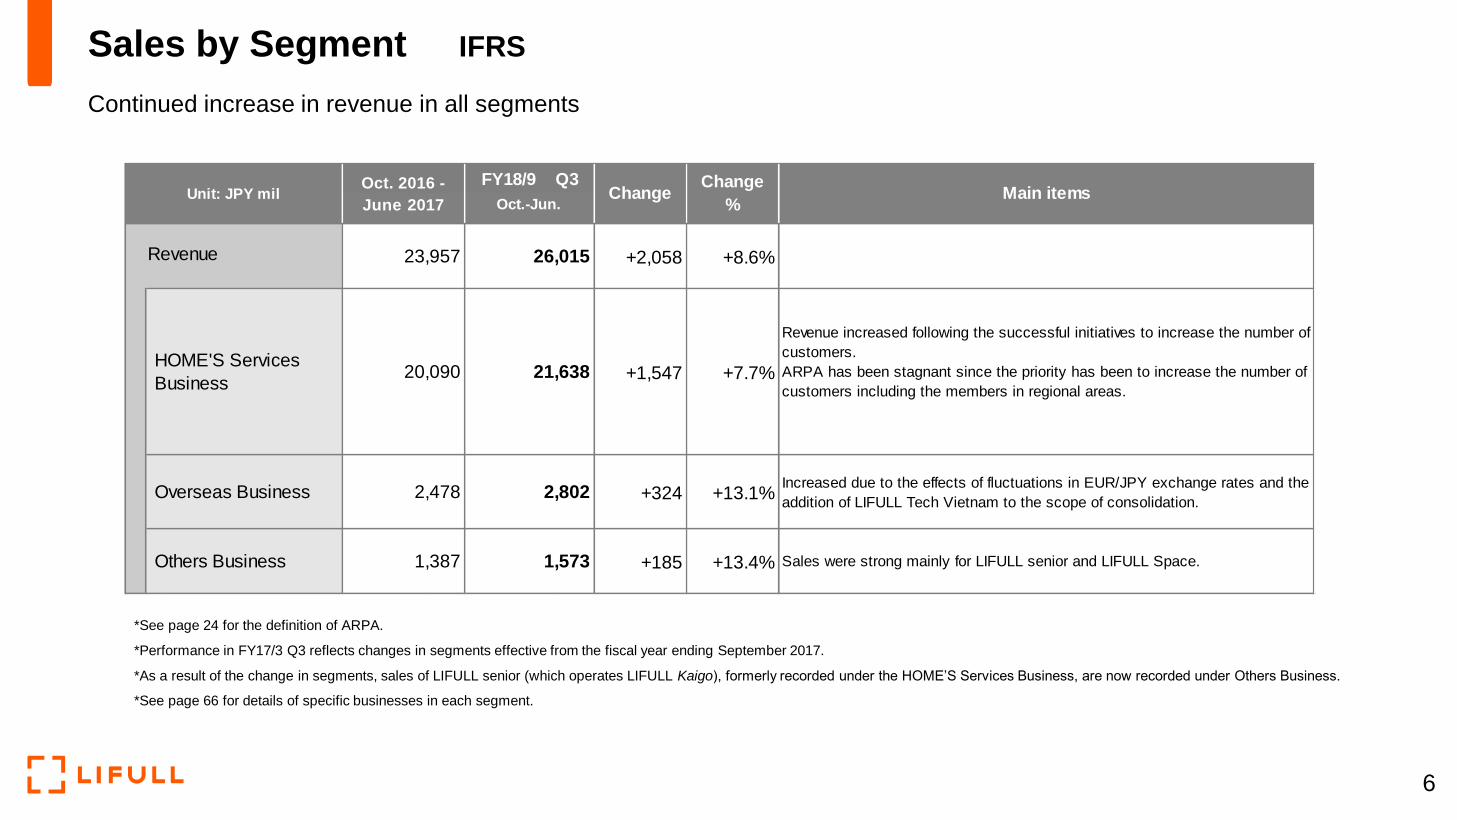
*See page 24 for the definition of ARPA.
*Performance in FY17/3 Q3 reflects changes in segments effective from the fiscal year ending September 2017.
*As a result of the change in segments, sales of LIFULL senior (which operates LIFULL Kaigo), formerly recorded under the HOME’S Services Business, are now recorded under Others Business.
*See page 66 for details of specific businesses in each segment.
Sales by Segment IFRS
Continued increase in revenue in all segments
6
FY18/9 Q3
+2,058 +8.6%
+1,547 +7.7%
Revenue increased following the successful initiatives to increase the number of
customers.
ARPA has been stagnant since the priority has been to increase the number of
customers including the members in regional areas.
+324 +13.1%Increased due to the effects of fluctuations in EUR/JPY exchange rates and the
addition of LIFULL Tech Vietnam to the scope of consolidation.
+185 +13.4% Sales were strong mainly for LIFULL senior and LIFULL Space.
ChangeChange
%Main items
Revenue
HOME'S Services
Business
Overseas Business
Others Business
Unit: JPY milOct. 2016 -
June 2017 Oct.-Jun.
1,387
2,478
20,090
23,957
1,573
2,802
21,638
26,015
Page 8
*Performance in FY17/3 Q3 reflects changes in segments effective from the fiscal year ending September 2017.
*As a result of the change in segments, sales of LIFULL senior (which operates LIFULL Kaigo), formerly recorded under the HOME’S Services Business, are now recorded under Others Business.
*Change percentage columns are left blank for the items posted negative figure in either previous or current fiscal year.
FY18/9 Q3
+1,628 +85.2%
HOME'S Services Business +1,564 +90.9%
Profit increased due to temporary costs associated with
head office relocation in the previous period and efforts to
minimize SG&A expenses this period.
Overseas Business +118 +81.9%
Profit increased due to improvements in personnel
expenses at Trovit and fluctuations in foreign-currency
exchange rates.
Others Business -44 -
Costs Increased due mainly to rising personnel expenses
and indirect costs, both associated with business
development.
Inter-segment transactions -9 -13.0%
Change
%Main items
66
-74
264
3,284
Change
3,539
75
-30
145
1,719
1,910Segment income and loss
Unit: JPY milOct. 2016 -
Oct.-Jun.June 2017
Segment Income and Loss IFRS
HOME’S Services achieved a substantial increase in profit as a result of decrease in one-off expenses and by making effort to reduce costs.
Overseas also achieved a substantial increase in profit, mostly due to decrease in Trovit’s personnel expenses
7
Page 9
(ref.) Condensed Statements of Profit and Loss (quarterly) IFRS
Strategy to increase ARPA to accelerate business growth in the HOME’S Services is still in progress, but profitability has improved considerably
Overseas profit grew significantly without incorporating the expenses related to Mitula acquisition (JPY 200 million).
*Net profit attributable to owners of the parent
*Change percentage columns are left blank for the items posted negative figure in either previous or current fiscal year.
FY17/9 FY18/9 FY17/9 FY18
Q1 Q3 Q1 Q3
Apr.-Jun. Apr.-Jun. Apr.-Jun. Apr.-Jun.
7,793 8,345 +551 +7.1% 278 1,136 +858 +308.9%
6,472 6,833 +361 +5.6% HOME'S Services 264 1,060 +796 +300.6%
859 983 +123 +14.4% Overseas 65 55 -9 -13.9%
461 528 +66 +14.4% Others -74 -1 +72 -
915 996 +80 +8.8% Inter-segment transaction 22 21 +0 -3.2%
6,346 5,948 -397 -6.3%
1,993 1,963 -30 -1.5%
2,719 2,431 -288 -10.6%
240 209 -30 -12.5%
1,393 1,344 -49 -3.5%
-72 6 +78 -
458 1,406 +947 +206.4%
5.9% 16.9% +11.0p -
22 702 +680 +3,088.5%
253 263 +9 +3.8%
Change
%Unit JPY mil
Revenue
HOME'S Services
Unit: JPY mil Change
Segment income and loss
Change
Depreciation and amortization
Change
%
Other revenues and expenses
EBITDA
EBITDA ratio
Net profit*
Others
Cost of sales
SG&A (excl. depreciation)
Personnel expenses
Advertising expenses
Operating expenses
Other
Overseas
8
Page 10
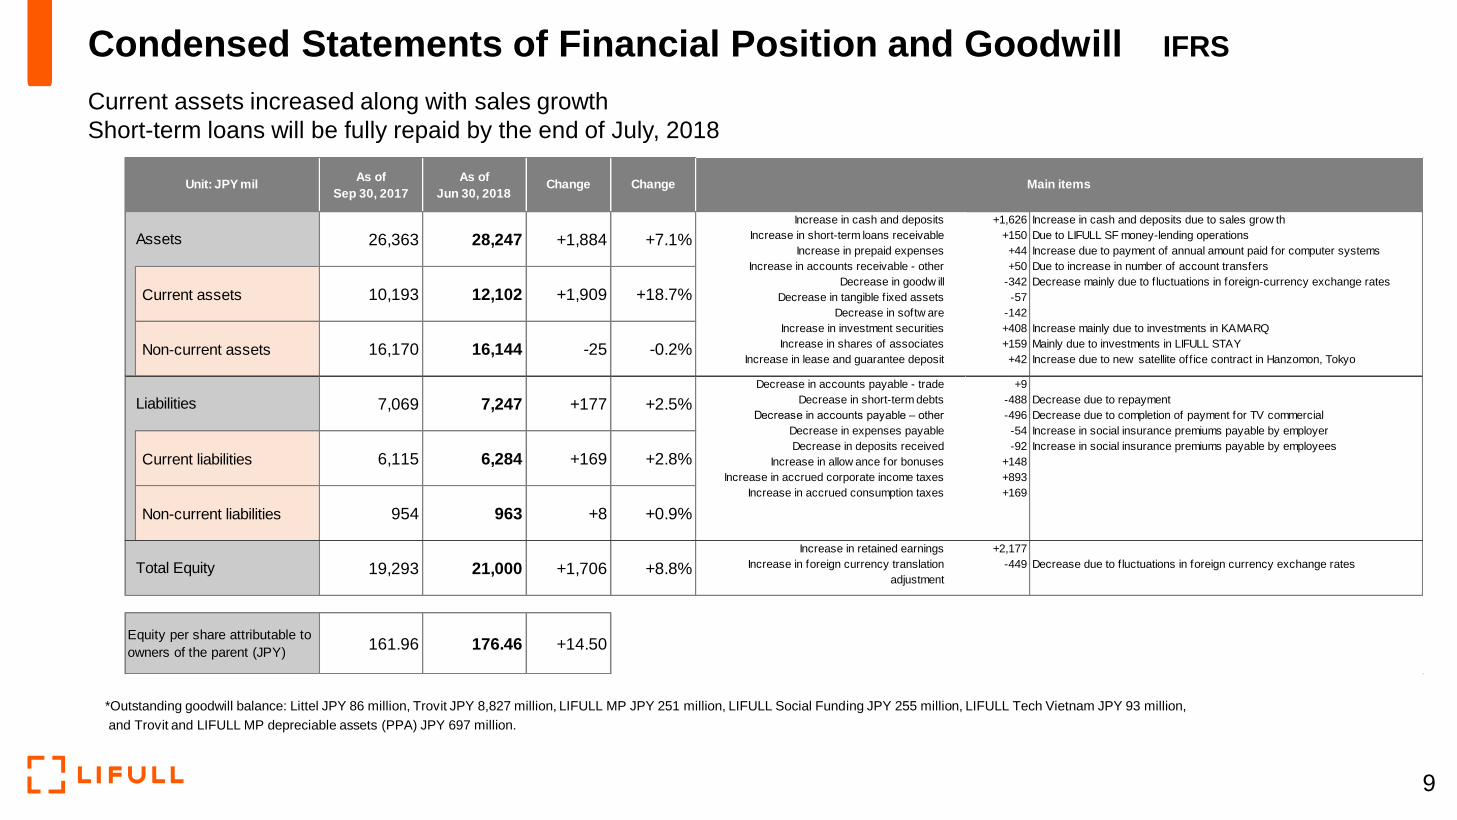
Condensed Statements of Financial Position and Goodwill IFRS
9
*Outstanding goodwill balance: Littel JPY 86 million, Trovit JPY 8,827 million, LIFULL MP JPY 251 million, LIFULL Social Funding JPY 255 million, LIFULL Tech Vietnam JPY 93 million,
and Trovit and LIFULL MP depreciable assets (PPA) JPY 697 million.
As of As of
Sep 30, 2017 Jun 30, 2018
26,363 28,247 +1,884 +7.1%
Current assets 10,193 12,102 +1,909 +18.7%
Non-current assets 16,170 16,144 -25 -0.2%
7,069 7,247 +177 +2.5%
Current liabilities 6,115 6,284 +169 +2.8%
Non-current liabilities 954 963 +8 +0.9%
19,293 21,000 +1,706 +8.8%
Increase in retained earnings
Increase in foreign currency translation
adjustment
+2,177
-449
161.96 176.46 +14.50
Change Main items
Total Equity
Equity per share attributable to
owners of the parent (JPY)
Assets
Liabilities
Decrease due to f luctuations in foreign currency exchange rates
+1,626
+150
+44
+50
-342
-57
-142
+408
+159
+42
Increase in cash and deposits due to sales grow th
Due to LIFULL SF money-lending operations
Increase due to payment of annual amount paid for computer systems
Due to increase in number of account transfers
Decrease mainly due to f luctuations in foreign-currency exchange rates
Increase mainly due to investments in KAMARQ
Mainly due to investments in LIFULL STAY
Increase due to new satellite off ice contract in Hanzomon, Tokyo
Increase in cash and deposits
Increase in short-term loans receivable
Increase in prepaid expenses
Increase in accounts receivable - other
Decrease in goodw ill
Decrease in tangible f ixed assets
Decrease in softw are
Increase in investment securities
Increase in shares of associates
Increase in lease and guarantee deposit
Decrease in accounts payable - trade
Decrease in short-term debts
Decrease in accounts payable – other
Decrease in expenses payable
Decrease in deposits received
Increase in allow ance for bonuses
Increase in accrued corporate income taxes
Increase in accrued consumption taxes
+9
-488
-496
-54
-92
+148
+893
+169
Decrease due to repayment
Decrease due to completion of payment for TV commercial
Increase in social insurance premiums payable by employer
Increase in social insurance premiums payable by employees
ChangeUnit: JPY mil
Current assets increased along with sales growth
Short-term loans will be fully repaid by the end of July, 2018
Page 11
Condensed Statements of Cash Flows IFRS
Cash and cash equivalents increased by JPY2.1 billion to JPY 7.1 billion
10
FY18/9 Q3
Items YoY FY18/9 Q3
Profit for the period before tax +1,772
Depreciation and amortization +1,064
Impairment loss +14
Increase/decrease in accounts receivable - trade and other
current receivables-309
Increase/decrease in accounts payable - trade and other current
payables+382
Tax payments -1,348
Others +567
Purchase of available-for-sale financial assets -60
Purchase of property, plant and equipment -1,519
Outlays for the acquisition of intangible fixed assets -398
Outlays for acquisition of shares of associates -239
Proceeds from repayment of lease and guarantee deposit +439
Outlays for acquisition of shares of subsidiaries -240
Proceeds from sale of shares of associates -
Payents for loans receivalbe -
Repayment of long-term loans -501
Purchase of shares in subsidiaries -390
Dividends paid -671
Change in cash
and cash
equivalents
Balance of cash
and cash
equivalents
+2,123
-97
+3,552
-438
-
-454
-189
-317
-
-150
-11
-499
+135
-317
-
Main items
+1,442
Oct.-Jun.June 2017
3,5892,148
+822
-71
-484
+242
Oct. 2016 -
Operating
cash flow
Financing
cash flow+985
Investing
cash flow+738
7,1365,509
-635,013
-580-1,565
-1,312-2,050
Unit: JPY mil Change
Page 12
Progress of
Business Forecast
Copyright(c) LIFULL Co., Ltd. All Rights Reserved. 11
Page 13
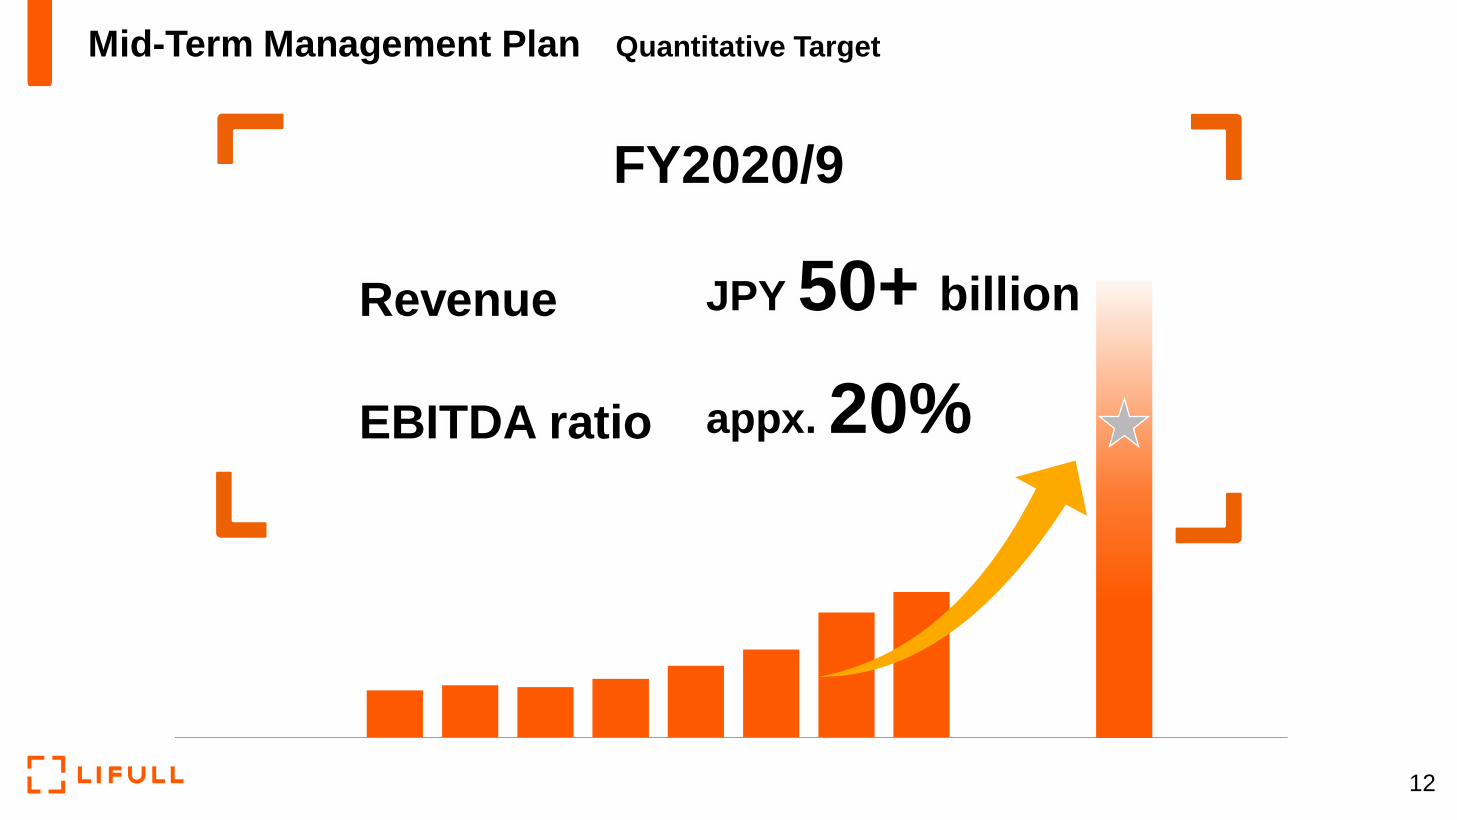
FY2020/9
Revenue
EBITDA ratio
JPY 50+ billion
appx. 20%
Mid-Term Management Plan Quantitative Target
12
Page 14
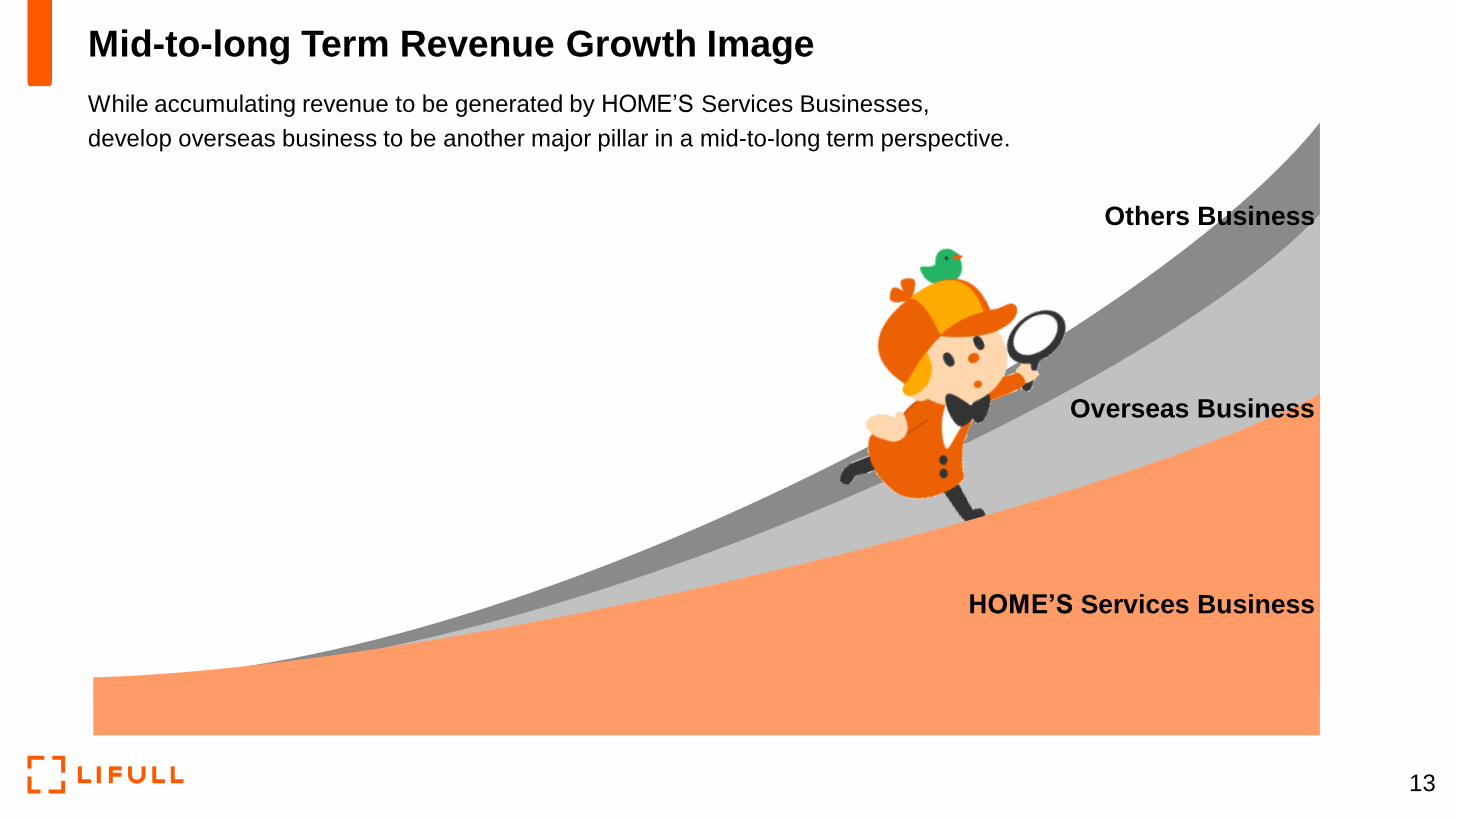
Mid-to-long Term Revenue Growth Image
While accumulating revenue to be generated by HOME’S Services Businesses,
develop overseas business to be another major pillar in a mid-to-long term perspective.
HOME’S Services Business
Others Business
Overseas Business
13
Page 15
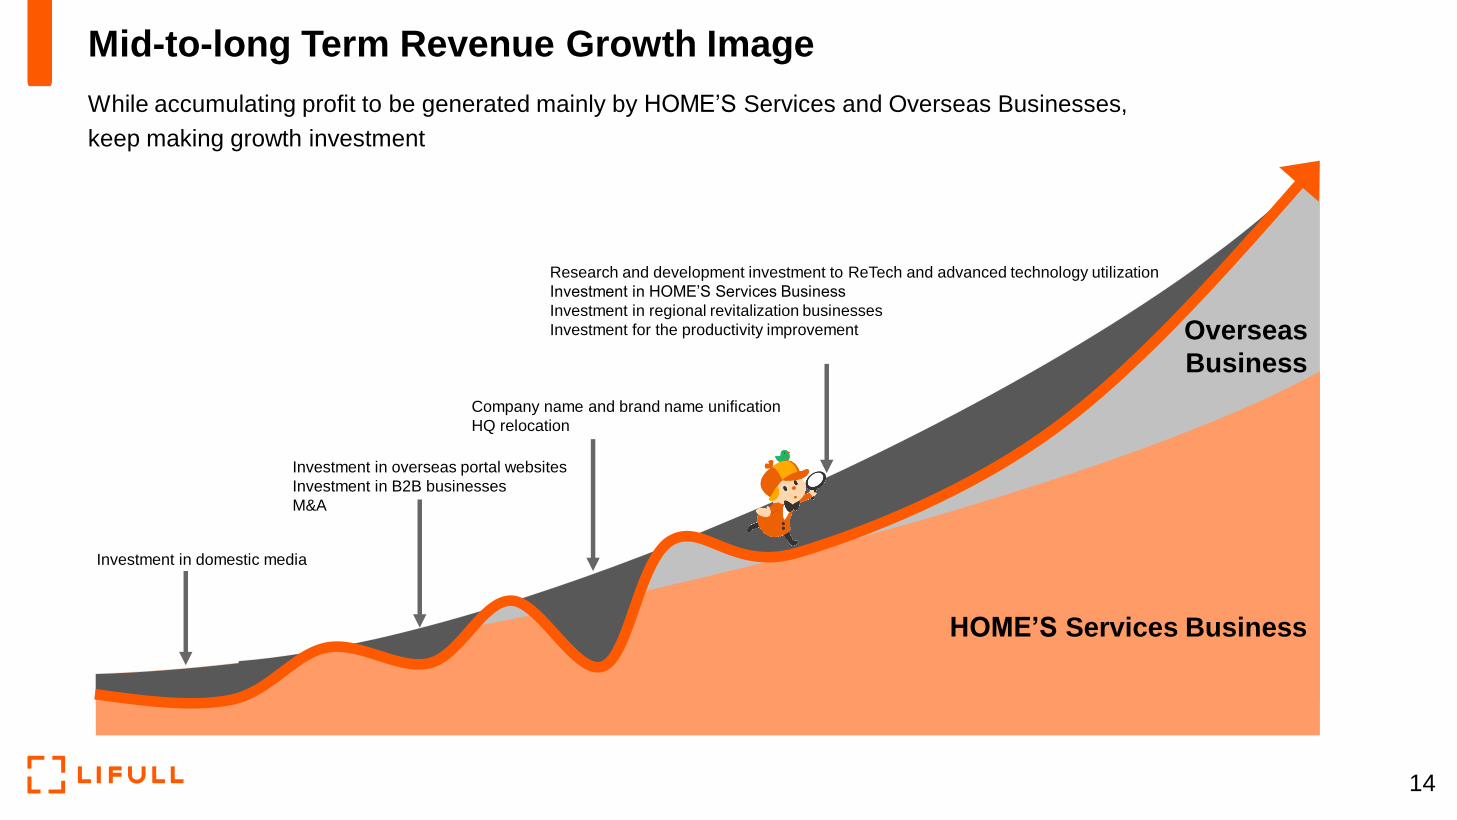
Mid-to-long Term Revenue Growth Image
While accumulating profit to be generated mainly by HOME’S Services and Overseas Businesses,
keep making growth investment
Company name and brand name unification
HQ relocation
Investment in overseas portal websites
Investment in B2B businesses
M&A
Research and development investment to ReTech and advanced technology utilization
Investment in HOME’S Services Business
Investment in regional revitalization businesses
Investment for the productivity improvement
Investment in domestic media
Overseas
Business
HOME’S Services Business
14
Page 16
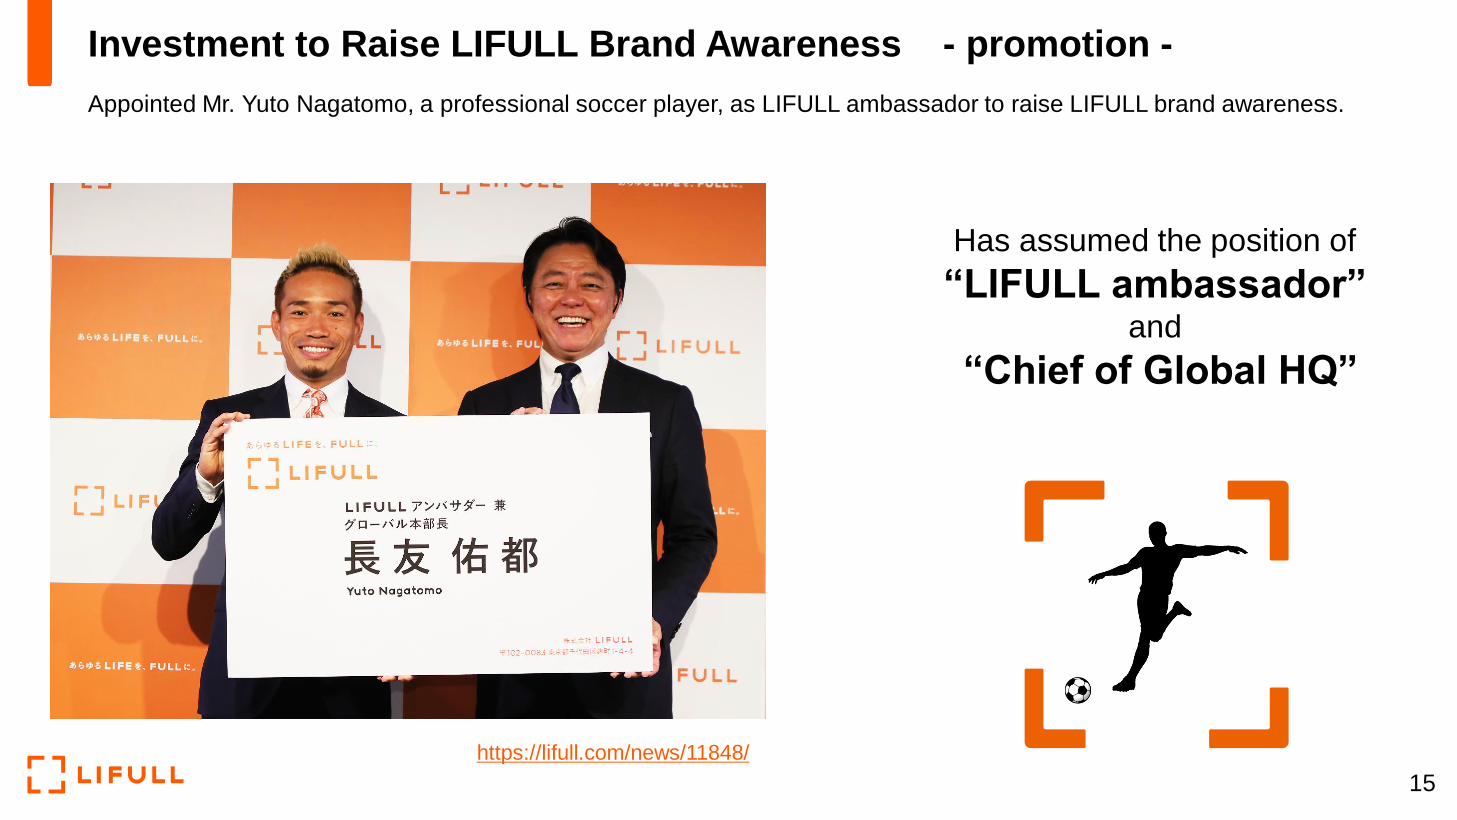
Investment to Raise LIFULL Brand Awareness - promotion -
Appointed Mr. Yuto Nagatomo, a professional soccer player, as LIFULL ambassador to raise LIFULL brand awareness.
15
Has assumed the position of
“LIFULL ambassador” and
“Chief of Global HQ”
https://lifull.com/news/11848/
Page 17
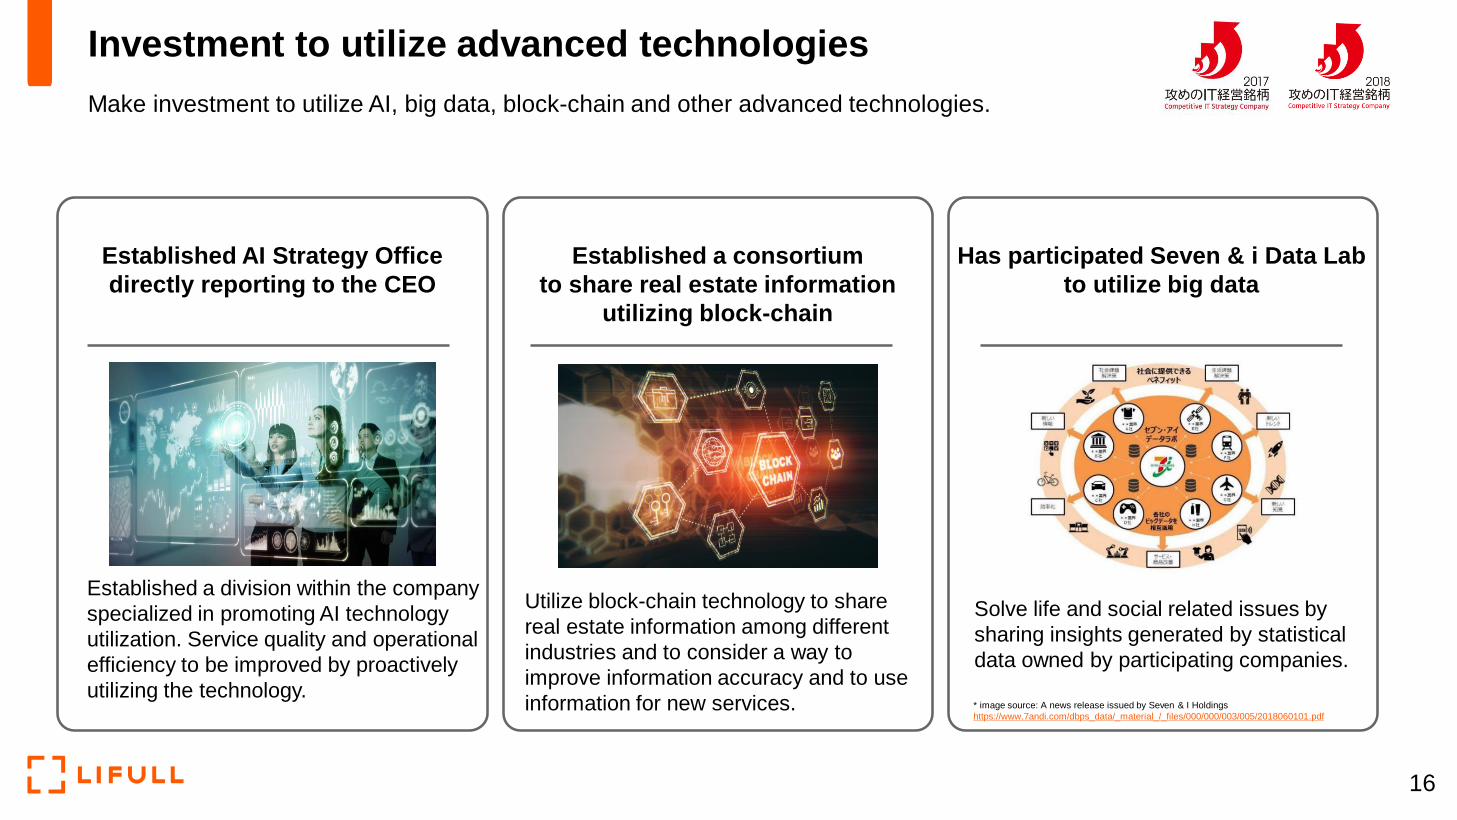
Investment to utilize advanced technologies
Make investment to utilize AI, big data, block-chain and other advanced technologies.
16
Established AI Strategy Office
directly reporting to the CEO
Established a consortium
to share real estate information
utilizing block-chain
Has participated Seven & i Data Lab
to utilize big data
Solve life and social related issues by
sharing insights generated by statistical
data owned by participating companies.
Utilize block-chain technology to share
real estate information among different
industries and to consider a way to
improve information accuracy and to use
information for new services.
Established a division within the company
specialized in promoting AI technology
utilization. Service quality and operational
efficiency to be improved by proactively
utilizing the technology.* image source: A news release issued by Seven & I Holdings
https://www.7andi.com/dbps_data/_material_/_files/000/000/003/005/2018060101.pdf
Page 18
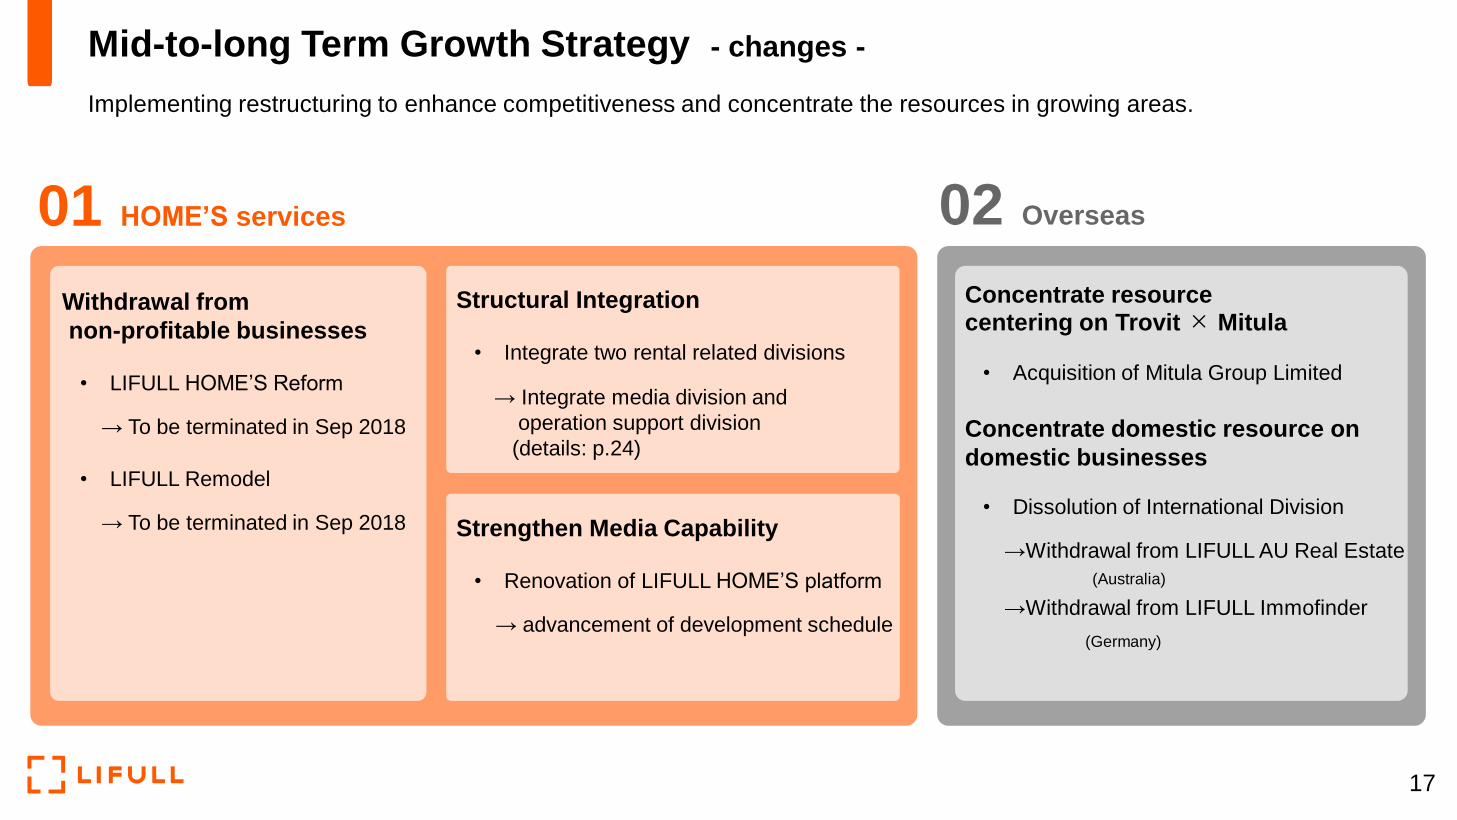
Mid-to-long Term Growth Strategy - changes -
Implementing restructuring to enhance competitiveness and concentrate the resources in growing areas.
01 HOME’S services
Withdrawal from
non-profitable businesses
• LIFULL HOME’S Reform
→ To be terminated in Sep 2018
• LIFULL Remodel
→ To be terminated in Sep 2018
Structural Integration
• Integrate two rental related divisions
→ Integrate media division and
operation support division
(details: p.24)
Strengthen Media Capability
• Renovation of LIFULL HOME’S platform
→ advancement of development schedule
02 Overseas
Concentrate resourcecentering on Trovit × Mitula
• Acquisition of Mitula Group Limited
Concentrate domestic resource on
domestic businesses
• Dissolution of International Division
→Withdrawal from LIFULL AU Real Estate
(Australia)
→Withdrawal from LIFULL Immofinder
(Germany)
17
Page 19
4574
89108 107 103
120147
182
257
299
159
340
1997 2001 2006 2011 2016 2020
* Fiscal year ended Sep 2017 was a six-month transition period (from April 2017 to September 2017) due to the change in fiscal-year end.
*
(unit: JPY 100 million)
Business Forecast for the Fiscal Year Ending September 2018
Implementing structural reform to achieve the Mid-term Management Plan
Revenue JPY 34.0 billion
EBITDA JPY 5.1 billion
50+ billion JPY
FY2018/9 Full-Year Forecast
18
Page 20
To achieve the Mid-term Management Plan, execute structural reform internally
and respond to changes in the external environment
Structural reform to
strengthen competitiveness
Respond to changes in
the external environment×
〈 Optimize the structure 〉・Integrate divisions
・Enhance sales capability
〈 Improve productivity 〉・Introduce daily profitability managing system
(To be introduced in October)
〈 Improve efficiency 〉・Optimize marketing activities
・Utilize AI
・Renew the website to improve CVR
〈 Improve ability to attract more customers 〉・Strengthen countermeasures against SEO
Structural Reform
19
Page 21
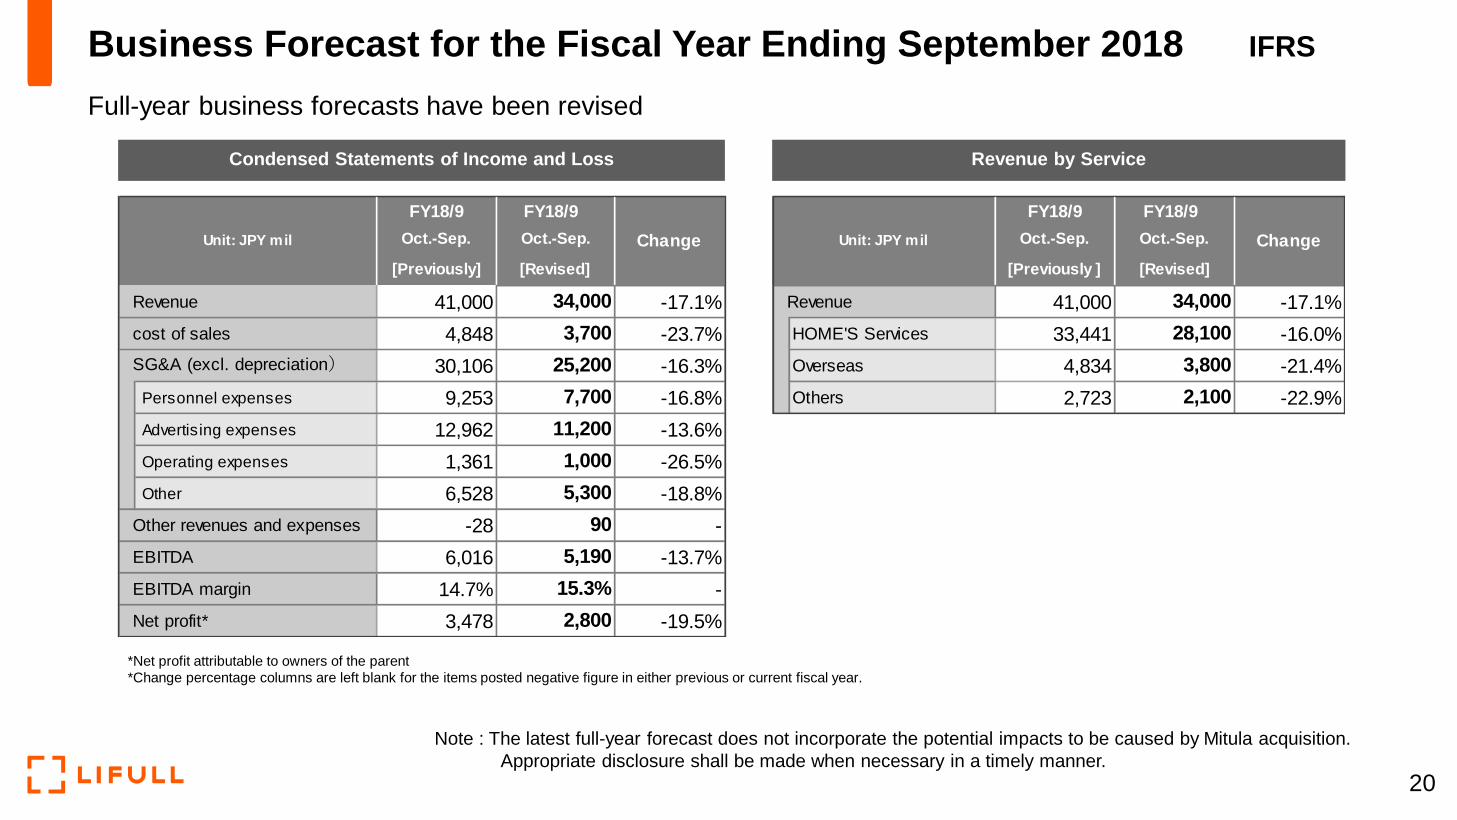
Condensed Statements of Income and Loss Revenue by Service
Note : The latest full-year forecast does not incorporate the potential impacts to be caused by Mitula acquisition.
Appropriate disclosure shall be made when necessary in a timely manner.
Business Forecast for the Fiscal Year Ending September 2018 IFRS
Full-year business forecasts have been revised
20
FY18/9 FY18/9 FY18/9 FY18/9
Oct.-Sep. Oct.-Sep.
[Previously] [Previously ]
41,000 -17.1% 41,000 -17.1%
4,848 -23.7% 33,441 -16.0%
30,106 -16.3% 4,834 -21.4%
Personnel expenses 9,253 -16.8% 2,723 -22.9%
Advertising expenses 12,962 -13.6%
Operating expenses 1,361 -26.5%
Other 6,528 -18.8%
-28 -
6,016 -13.7%
14.7% -
3,478 -19.5%
EBITDA margin 15.3%
Net profit* 2,800
5,300
Other revenues and expenses 90
Revenue 34,000
Unit: JPY mil
EBITDA 5,190
SG&A (excl. depreciation) 25,200 Overseas 3,800
7,700 Others 2,100
11,200
1,000
Revenue 34,000
cost of sales 3,700 HOME'S Services 28,100
Change Unit: JPY mil ChangeOct.-Sep. Oct.-Sep.
[Revised] [Revised]
*Net profit attributable to owners of the parent
*Change percentage columns are left blank for the items posted negative figure in either previous or current fiscal year.
Page 22
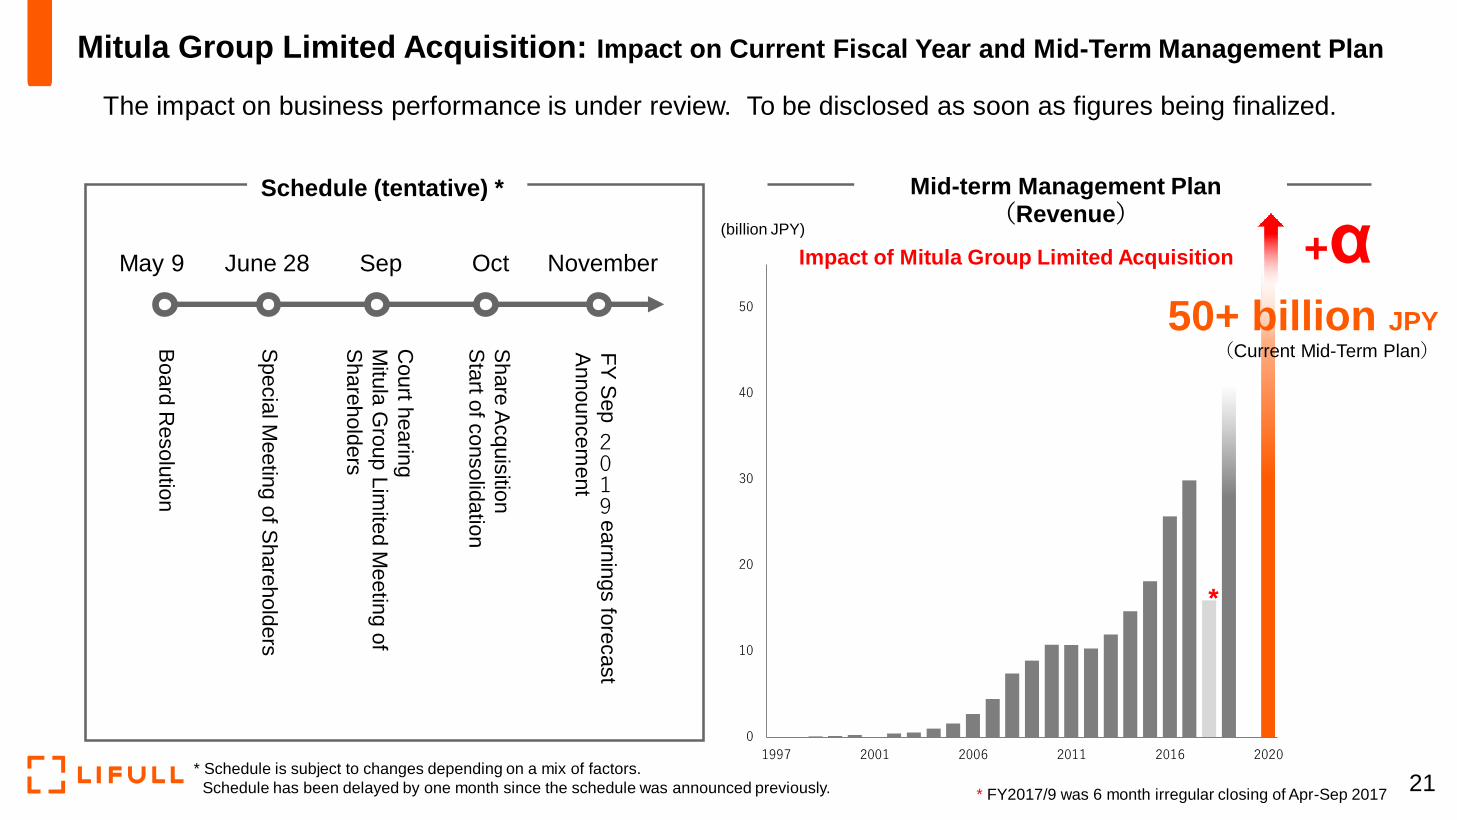
Mitula Group Limited Acquisition: Impact on Current Fiscal Year and Mid-Term Management Plan
The impact on business performance is under review. To be disclosed as soon as figures being finalized.
May 9
Board
Resolu
tion
June 28
Specia
l Meetin
g o
f Share
hold
ers
Sep November
FY
Sep
2019e
arn
ings fo
recast
Announcem
ent
Schedule (tentative) *
Court h
earin
g
Mitu
la G
roup L
imite
d M
eetin
g o
f
Share
hold
ers
Mid-term Management Plan(Revenue)
0
10
20
30
40
50
1997 2001 2006 2011 2016 2020
+α50+ billion JPY
(Current Mid-Term Plan)
Impact of Mitula Group Limited Acquisition
* FY2017/9 was 6 month irregular closing of Apr-Sep 2017
*
(billion JPY)
Oct
Share
Acquis
ition
Sta
rt of c
onsolid
atio
n
* Schedule is subject to changes depending on a mix of factors.
Schedule has been delayed by one month since the schedule was announced previously. 21
Page 23
HOME’S Services
Business
22Copyright(c) LIFULL Co., Ltd. All Rights Reserved.
Page 24
22,511 22,969
23,629 24,010
26,040 26,492
27,042 27,411
26,728
15,000
17,000
19,000
21,000
23,000
25,000
27,000
29,000
Q1 Q2 Q3 Q4 Q1 Q2 Q1 Q2 Q3
83,326 83,620 83,074
112,492
83,212 87,329
84,049
105,824
83,044
0
20,000
40,000
60,000
80,000
100,000
120,000
Q1 Q2 Q3 Q4 Q1 Q2 Q1 Q2 Q3
No. of Clients(円)
2017年3月期
ARPA
FY2017/3 FY2017/9 FY2017/3 FY2017/9FY2018/9 FY2018/9
(JPY)
*FY2018/9 Q3 is preliminary figure. The final figure will be released in the earnings presentation of FY2018/9 Q3.
Expanding the Client Network
Number of clients: Increased from last year but decreased from Q2 following the withdrawal from the renovation business.
ARPA: Has been almost flat.
23
Page 25
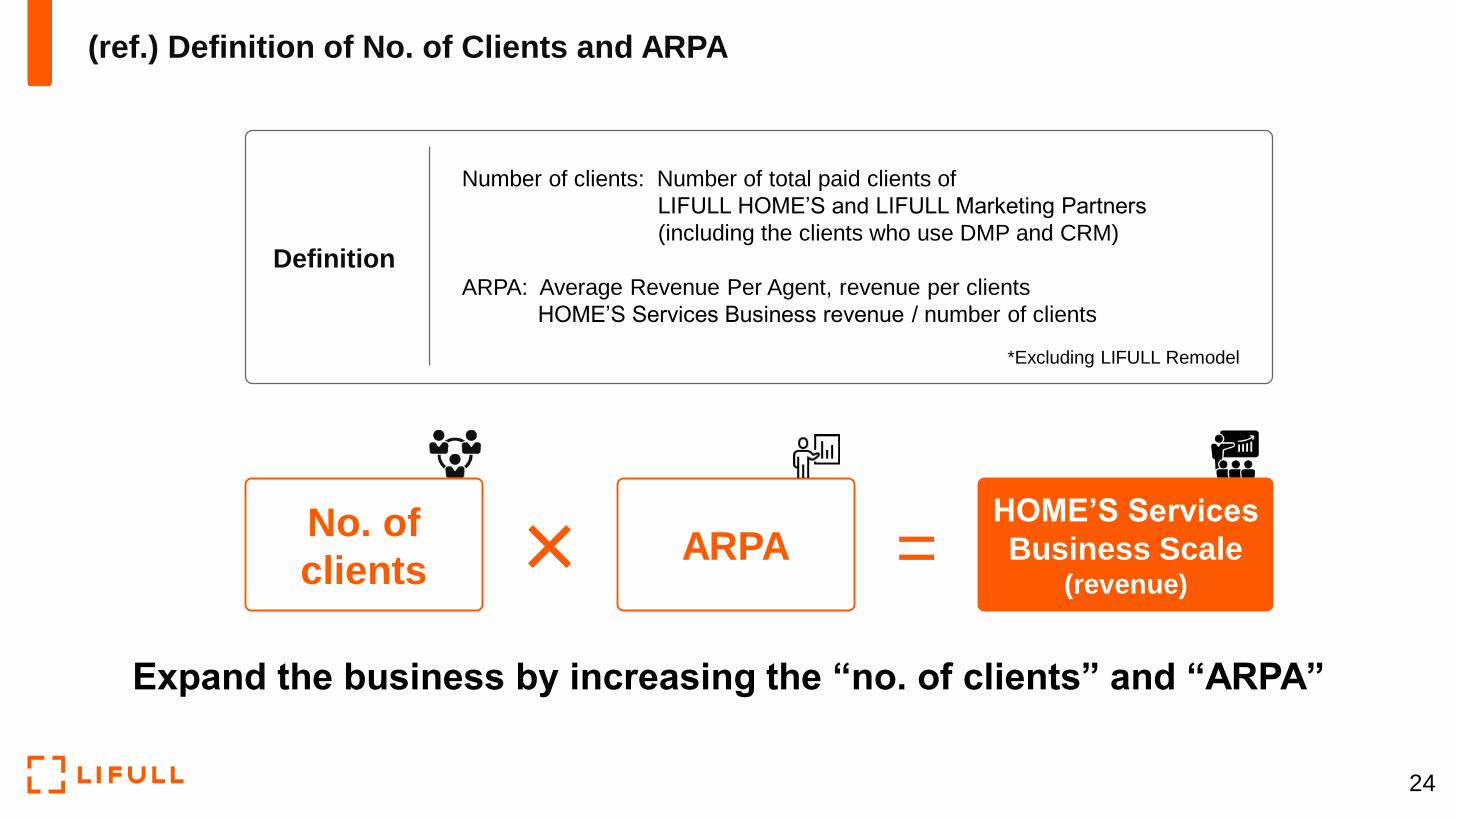
(ref.) Definition of No. of Clients and ARPA
Definition
Number of clients: Number of total paid clients of
LIFULL HOME’S and LIFULL Marketing Partners
(including the clients who use DMP and CRM)
ARPA: Average Revenue Per Agent, revenue per clients
HOME’S Services Business revenue / number of clients
*Excluding LIFULL Remodel
Expand the business by increasing the “no. of clients” and “ARPA”
HOME’S Services
Business Scale(revenue)
✕No. of
clients =ARPA
24
Page 26
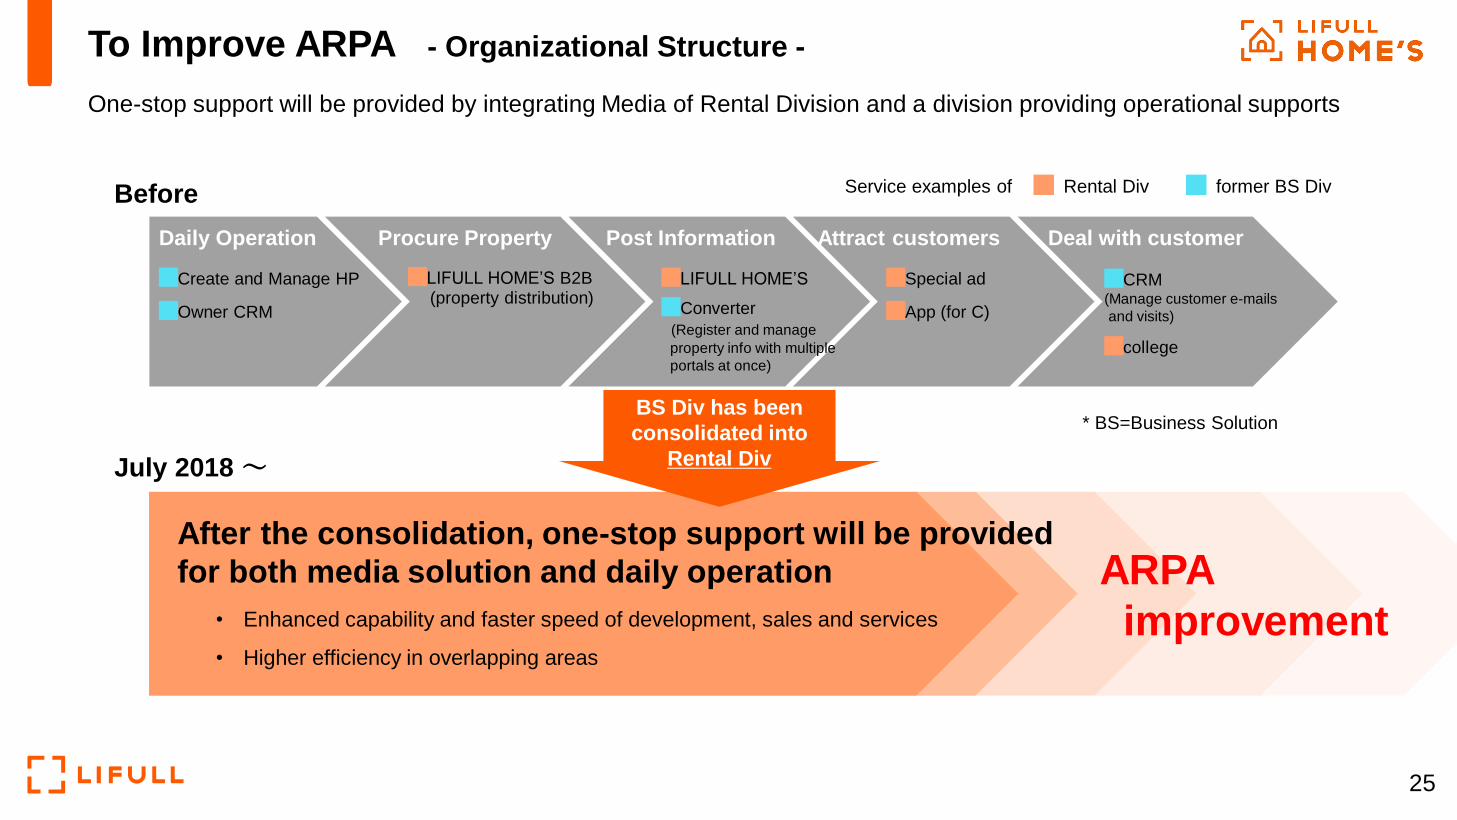
Procure PropertyDaily Operation Post Information Attract customers Deal with customer
To Improve ARPA - Organizational Structure -
One-stop support will be provided by integrating Media of Rental Division and a division providing operational supports
ARPA
improvement
Before
July 2018 ~
█Create and Manage HP
█Owner CRM
█LIFULL HOME’S B2B(property distribution)
█LIFULL HOME’S
█Converter
(Register and manage
property info with multiple
portals at once)
█Special ad
█App (for C)
█CRM(Manage customer e-mails
and visits)
█college
█ former BS Div█ Rental Div
After the consolidation, one-stop support will be provided
for both media solution and daily operation
• Enhanced capability and faster speed of development, sales and services
• Higher efficiency in overlapping areas
BS Div has been
consolidated into
Rental Div
Service examples of
* BS=Business Solution
25
Page 27
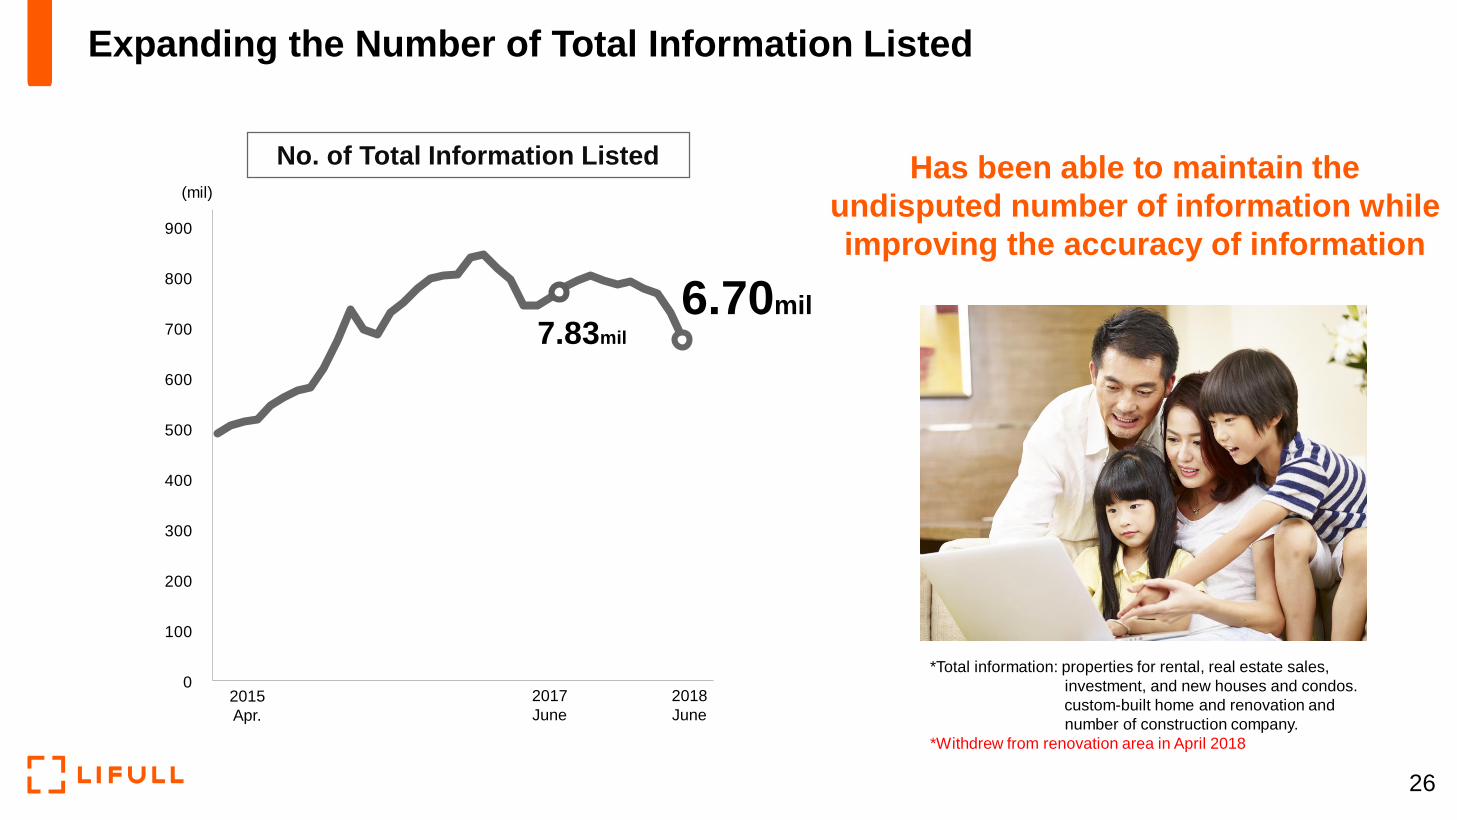
2018
June
6.70mil7.83mil
2015
Apr.
Expanding the Number of Total Information Listed
No. of Total Information Listed
*Total information: properties for rental, real estate sales,
investment, and new houses and condos.
custom-built home and renovation and
number of construction company.
*Withdrew from renovation area in April 2018
(mil)
2017
June
0
100
200
300
400
500
600
700
800
900
Has been able to maintain the
undisputed number of information while
improving the accuracy of information
26
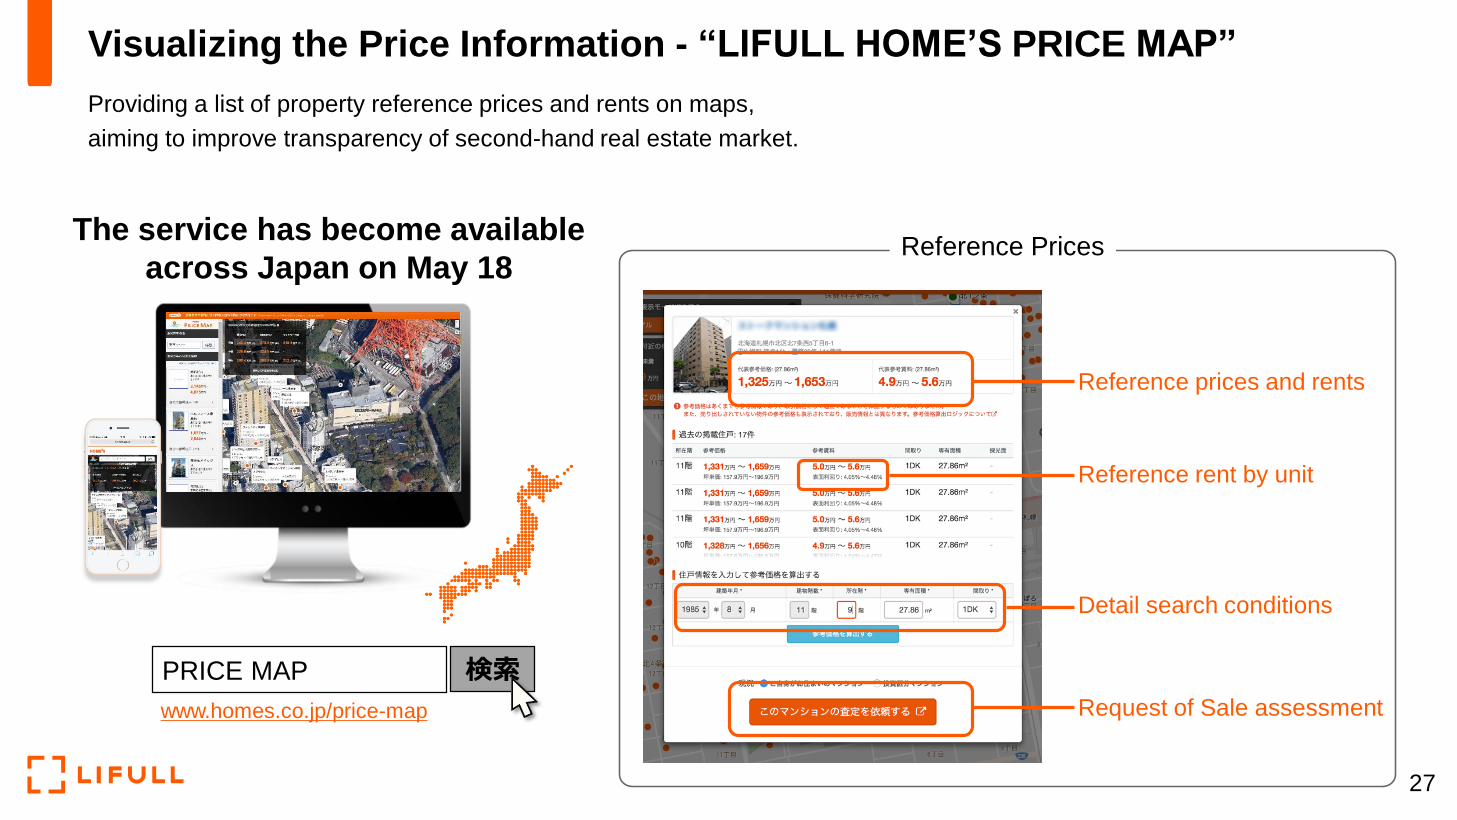
Page 28
The service has become available
across Japan on May 18
PRICE MAP 検索
www.homes.co.jp/price-map
Visualizing the Price Information - “LIFULL HOME’S PRICE MAP”
Providing a list of property reference prices and rents on maps,
aiming to improve transparency of second-hand real estate market.
Reference prices and rents
Reference rent by unit
Detail search conditions
Request of Sale assessment
Reference Prices
27
Page 29
Property info will be displayed over the building
showing up on the user’s smartphone
by using AR technologynumber of data used for the function will be data of one million properties
nationwide including rental, newly-built and second-hand condos
LIFULL HOME’S App
Android https://play.google.com/store/apps/details?id=jp.co.homes.android3
iOS https://itunes.apple.com/jp/app/id342650611
New function
Hold up
your
smartphone
and search
Enhance Media Capability - LIFULL HOME’S App -
Intuitive house-hunting function now available: By holding up a smartphone camera with AR function towards the direction of the building,
the app will tell the user which room of the property is now up for sale or available for rent in a timely manner
28
Page 30
Real Estate Tech (ReTech) - 3D Model House -
“3D Model House” to be released, which will enable users to tour model houses on-line on a virtual basis without physically visiting
housing exhibition spaces
Provide support to home builders to improve cost-efficiency in attracting customers and to improve contract close rate by improving
the user-friendliness of the service and transferring high-quality customers to them
< feature page > < 3D Model House *image>
To be released
in August
Note: The picture is just an image and the actual image might be different from what is shown above
Note: Above service uses “Matterport 3D Realty Capture Solution” developed by Matterport, Inc. (US)
tap-
and
-go
29
Page 31
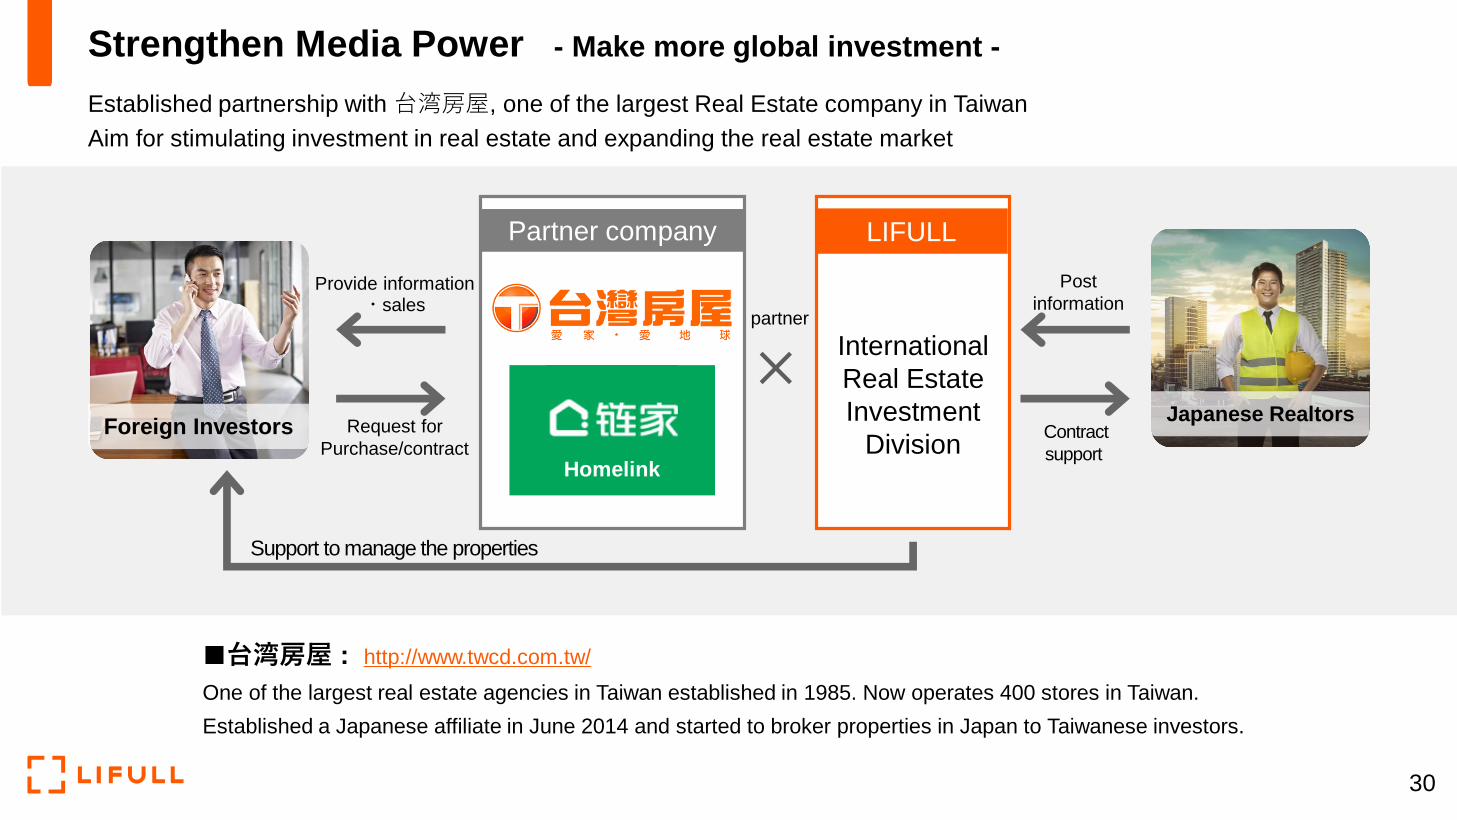
Strengthen Media Power - Make more global investment -
Established partnership with 台湾房屋, one of the largest Real Estate company in Taiwan
Aim for stimulating investment in real estate and expanding the real estate market
■台湾房屋 : http://www.twcd.com.tw/
One of the largest real estate agencies in Taiwan established in 1985. Now operates 400 stores in Taiwan.
Established a Japanese affiliate in June 2014 and started to broker properties in Japan to Taiwanese investors.
International
Real Estate
Investment
Division
LIFULL
Homelink
Partner company
Foreign InvestorsJapanese Realtors
partner
Post
information
Contract
support
Provide information・sales
Request for
Purchase/contract
Support to manage the properties
30
Page 32
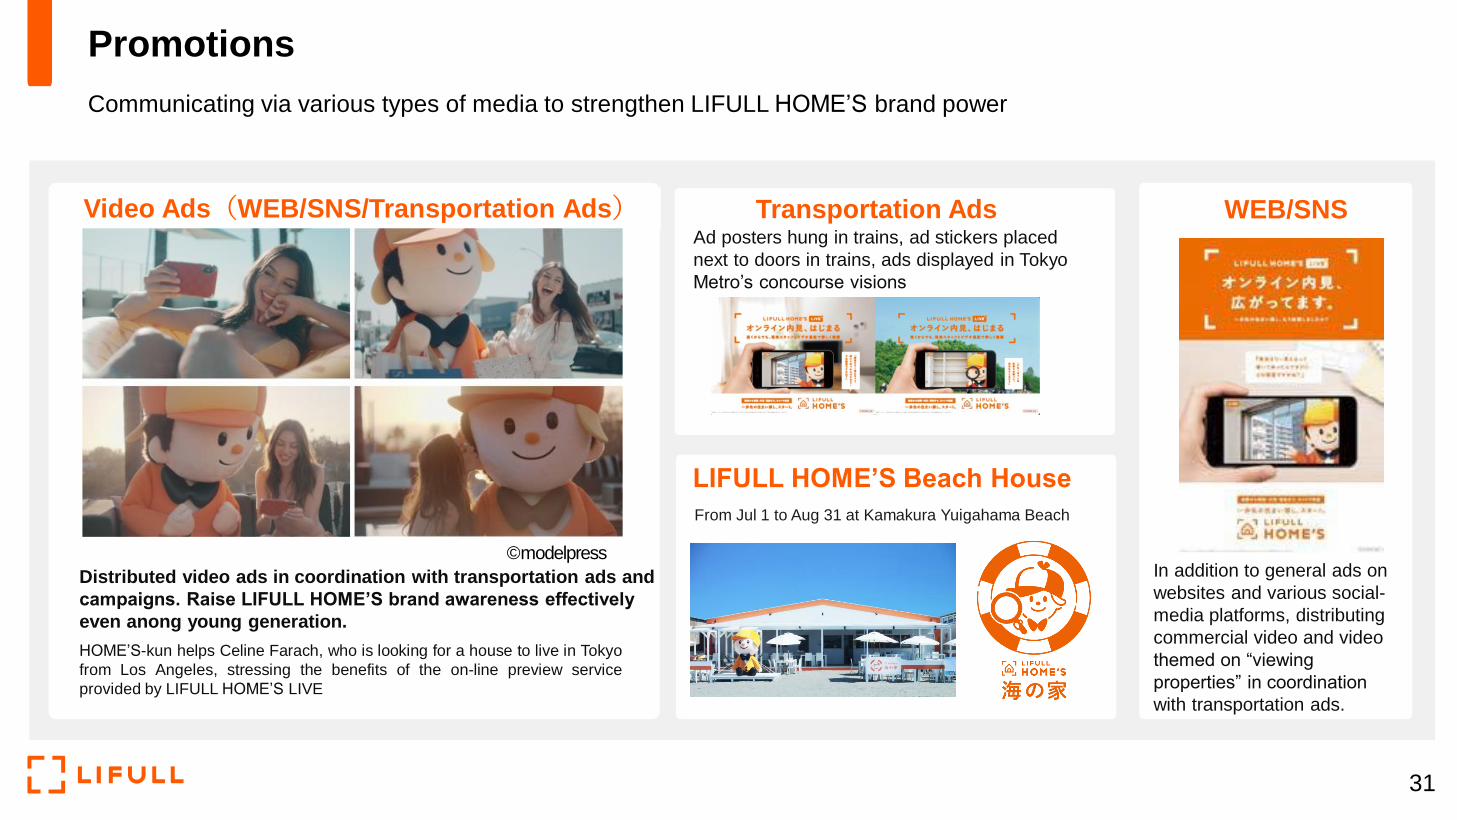
Video Ads(WEB/SNS/Transportation Ads)
Distributed video ads in coordination with transportation ads and
campaigns. Raise LIFULL HOME’S brand awareness effectively
even anong young generation.
HOME’S-kun helps Celine Farach, who is looking for a house to live in Tokyo
from Los Angeles, stressing the benefits of the on-line preview service
provided by LIFULL HOME’S LIVE
Transportation Ads WEB/SNSAd posters hung in trains, ad stickers placed
next to doors in trains, ads displayed in Tokyo
Metro’s concourse visions
In addition to general ads on
websites and various social-
media platforms, distributing
commercial video and video
themed on “viewing
properties” in coordination
with transportation ads.
LIFULL HOME’S Beach House
From Jul 1 to Aug 31 at Kamakura Yuigahama Beach
Promotions
Communicating via various types of media to strengthen LIFULL HOME’S brand power
©modelpress
31
Page 33
Overseas Business
32Copyright(c) LIFULL Co., Ltd. All Rights Reserved.
Page 34
Overseas Business Highlights
1. Trovit, an overseas subsidiary, has been a driving force both in terms of revenue and profit
2. Aim to acquire Mitula, a company with steadily growing revenue and profit
FY 2017 actual results Revenue: JPY 2.8 billion, EBITDA: JPY 0.9 billion
3. Will be an undisputed number one player in the world in real estate aggregation field
after acquiring Mitula
4. Grow overseas business significantly by Trovit x Mitula
33
Page 35
Overseas Business Actual Results - Revenue (by quarter)
Overseas Business has been growing lead especially by Trovit
Unit: JPY 100 million
Q2 Q3 Q4 Q1 Q2 Q1 Q2 Q3
Others
9.89.3
8.898.48.6
7.57.5
FY2017/3 FY2017/9 FY2018/9
34
Page 36
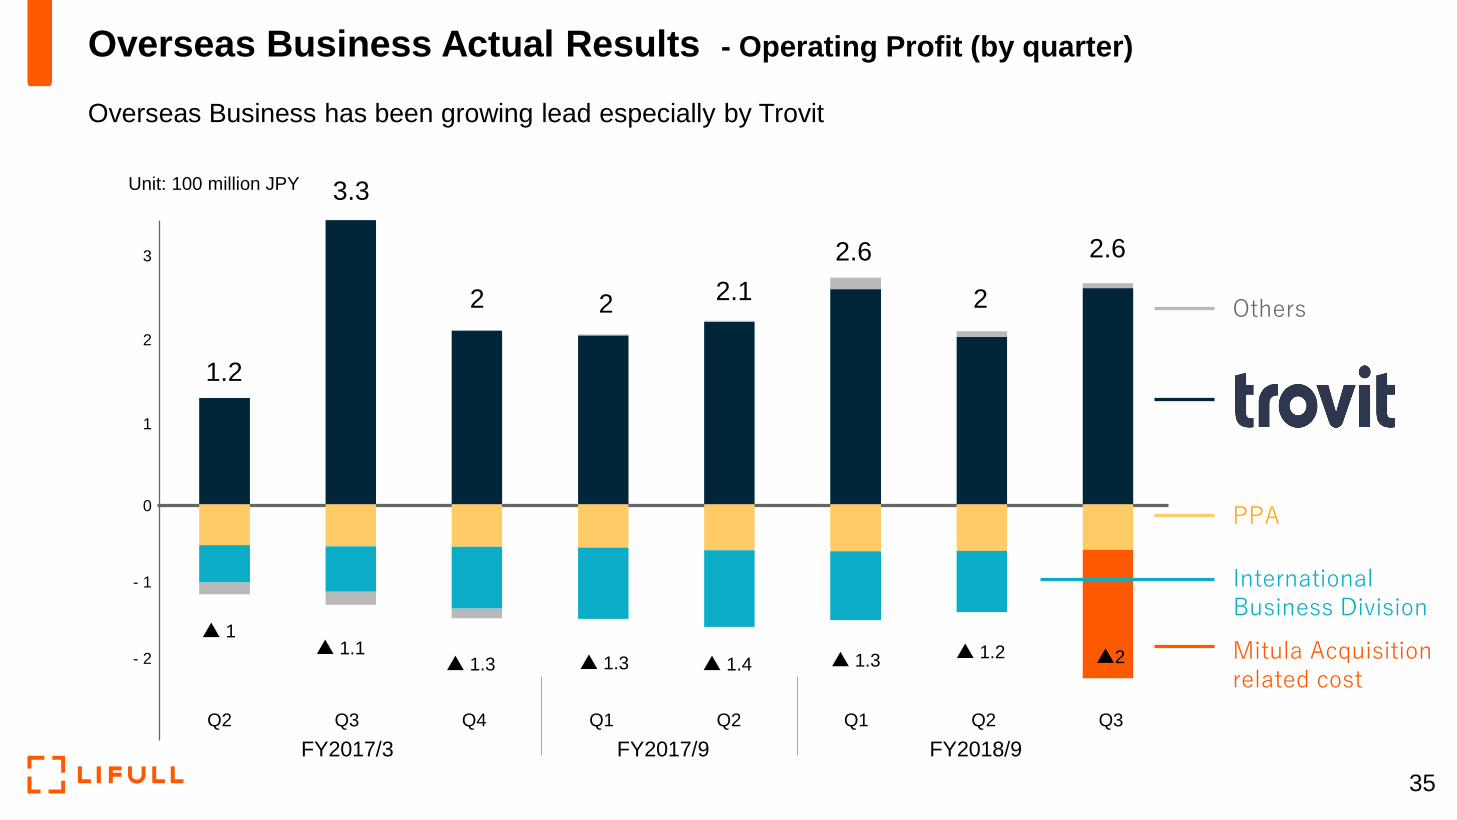
Overseas Business Actual Results - Operating Profit (by quarter)
Overseas Business has been growing lead especially by Trovit
Others
PPA
Mitula Acquisitionrelated cost
International Business Division
2.6
2
2.6
2.122
3.3
1.2
▲2▲ 1.2▲ 1.3▲ 1.4▲ 1.3▲ 1.3▲ 1.1
▲ 1
0
1
2
3
- 1
- 2
Q2 Q3 Q4 Q1 Q2 Q1 Q2 Q3
Unit: 100 million JPY
FY2017/3 FY2017/9 FY2018/9
35
Page 37
Overseas Business - Trovit Growth Strategy
Increase the profit by increasing the number of traffic and then by navigating the traffic well
36
Enhance ability to attract more
customers by executing
multi-channel strategy
Improve UI
Enhance sales capability
(customer development,
Improve average customer spend)
Traffic
Trovit revenue
Enhance marketing activities
Secure development resource
Low
Hign
Unit price
New
products
Ad revenue
Google AdSense
Trovit revenue structure focus points
Page 39
About Mitula - Company Overview -
˃ Name : Mitula Group Limited https://www.mitulagroup.com
˃ Listed Exchange : Australian Securities Exchange
˃ Shares Outstanding : 215,406,884 shares
˃ Business : Operation of Aggregator Websites and Portal Sites
˃ Financial Result : Revenue 33.6 million AUD (appx. 2,800 million JPY)
EBITDA 11.6 million AUD (appx. 900 million JPY)
: Net Income 5.2 million AUD (appx. 400 million JPY)
˃ Head Quarter : Madrid, Spain
˃ Major Subsidiaries : 1)Mitula Classified 2)Lokku Limited 3)Dot property 4)Kleding B.V.
˃ CEO : Gonzalo Del Pozo
˃ Schedule : Acquisition of shares to be completed in October 2018
* This document is calculated on exchange rate of 82.6 JPY/AUD.
(Fiscal Year 2017)
38
Page 40
About Mitula - Service -
An aggregation website operator providing its service in over 50 countries
39
(reference: p.10 of the material disclosed on May 9)
< Services provided by Mitula > <number of countries the service is provided>
Mitula Classified
Dot property
Kleding B.V.
Lokku Limited
【subsidiaries】 【service】
Operate aggregator sites in the fields
of housing, cars, jobs and fashion
Operate aggregator site in the field of
real estate
Operate portal website in the field of
real estate
Operate aggregator site in the field of
fashion
【business Overview】
Providing service in
over 50 countries
( reference: Mitula website (as of July 2018))
Page 41
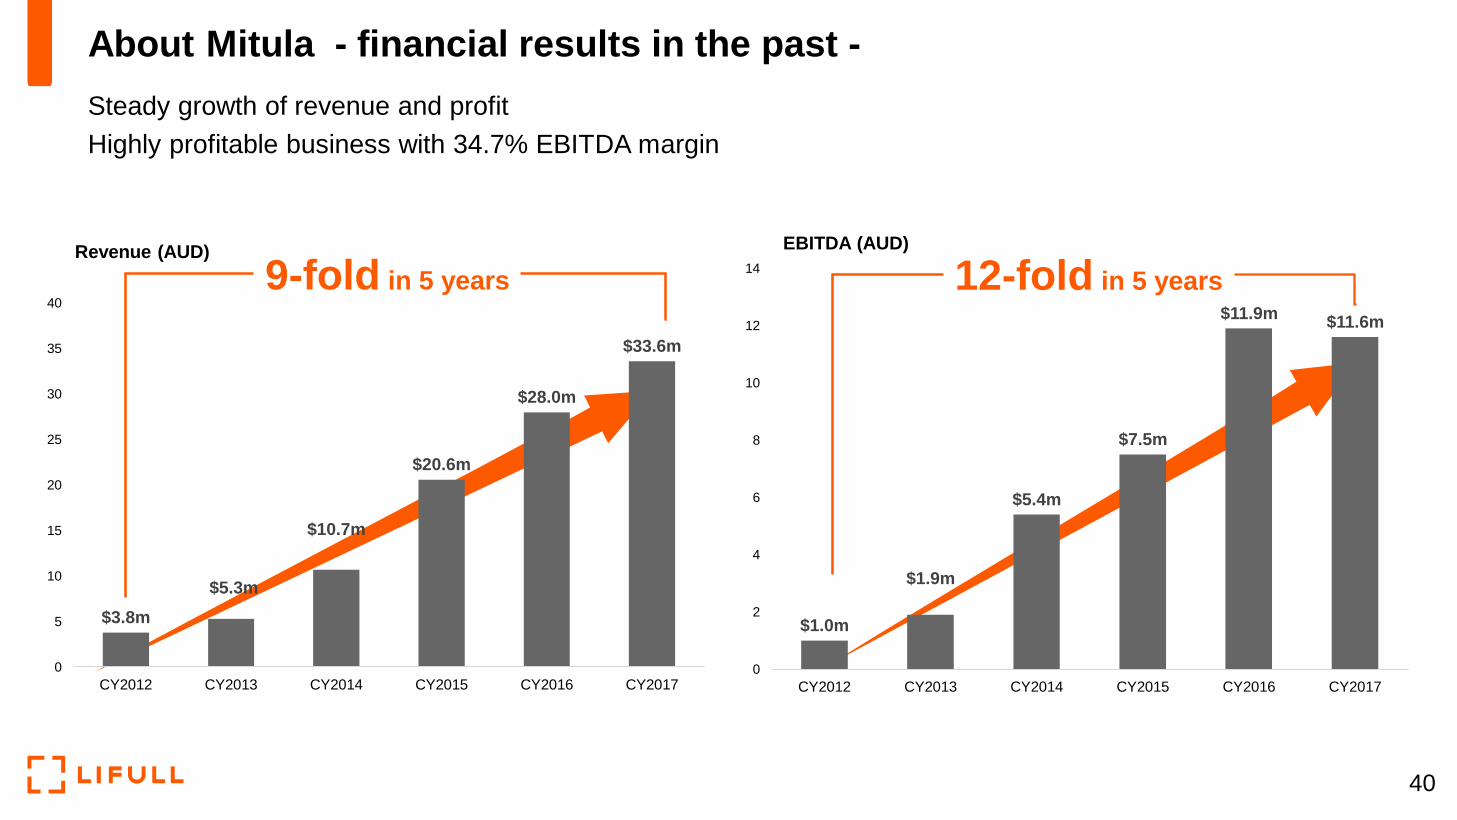
$3.8m
$5.3m
$10.7m
$20.6m
$28.0m
$33.6m
0
5
10
15
20
25
30
35
40
CY2012 CY2013 CY2014 CY2015 CY2016 CY2017
Revenue (AUD)
About Mitula - financial results in the past -
Steady growth of revenue and profit
Highly profitable business with 34.7% EBITDA margin
$1.0m
$1.9m
$5.4m
$7.5m
$11.9m$11.6m
0
2
4
6
8
10
12
14
CY2012 CY2013 CY2014 CY2015 CY2016 CY2017
EBITDA (AUD)
9-fold in 5 years 12-fold in 5 years
40
Page 42
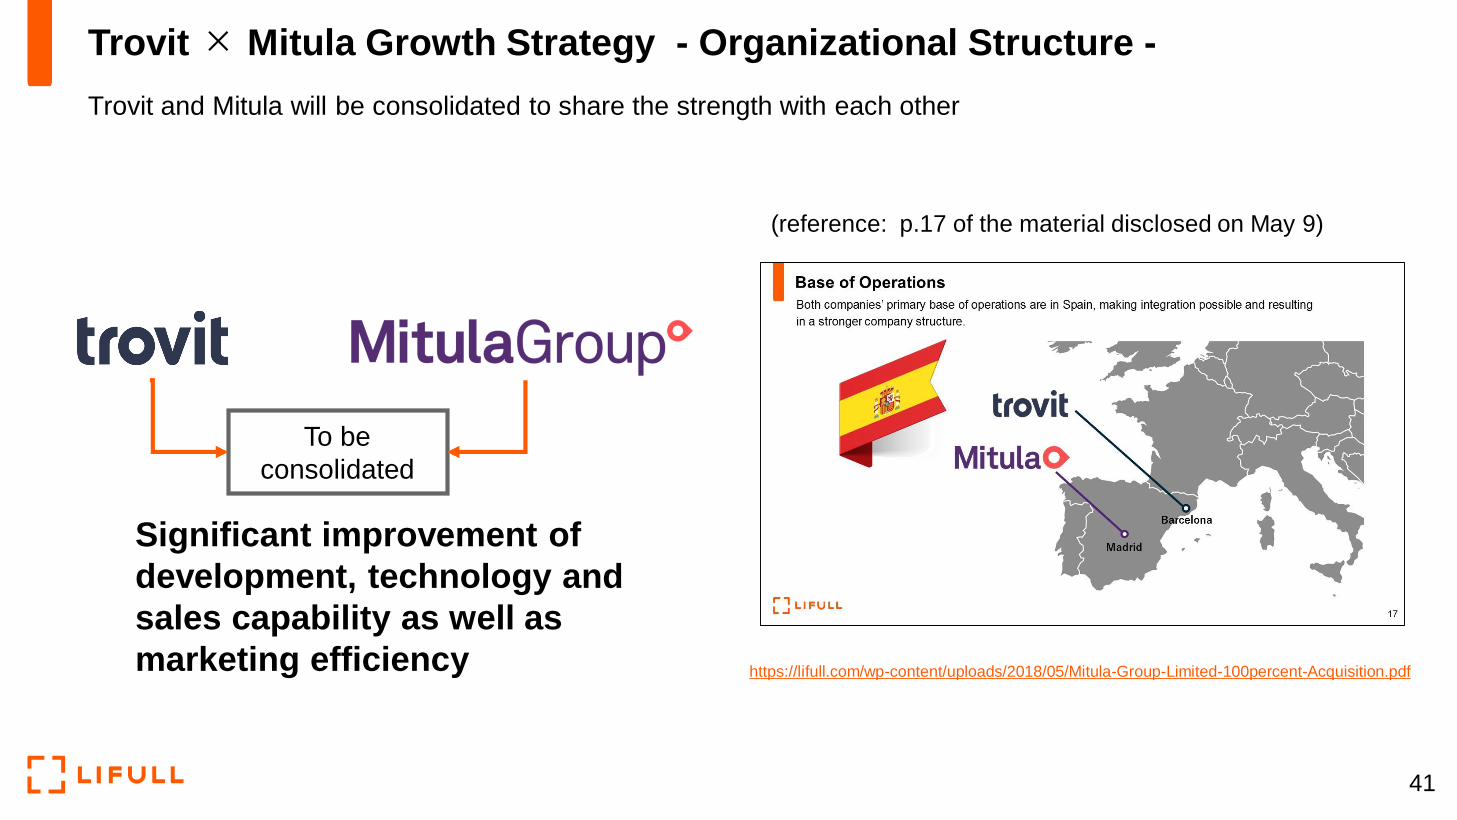
Trovit × Mitula Growth Strategy - Organizational Structure -
Trovit and Mitula will be consolidated to share the strength with each other
To be
consolidated
(reference: p.17 of the material disclosed on May 9)
https://lifull.com/wp-content/uploads/2018/05/Mitula-Group-Limited-100percent-Acquisition.pdf
Significant improvement of
development, technology and
sales capability as well as
marketing efficiency
41
Page 43
Trovit × Mitula Growth Strategy - Improve the traffic share -
Strengthen SEO by integrating knowhow of the two companies
Websites of Trovit and Mitula will not be consolidated to fully capture the users by dominating the SEO highly ranked websites.
Chilli
26%→68%55%→85%
Italy
Mexico
53%→90%
< example 1: Search result > < example 2: Traffic share >
Source: SimilarWeb
Chile
26% → 68%
Italy
55% → 85%
Mexico
53% → 90%
42
Page 44
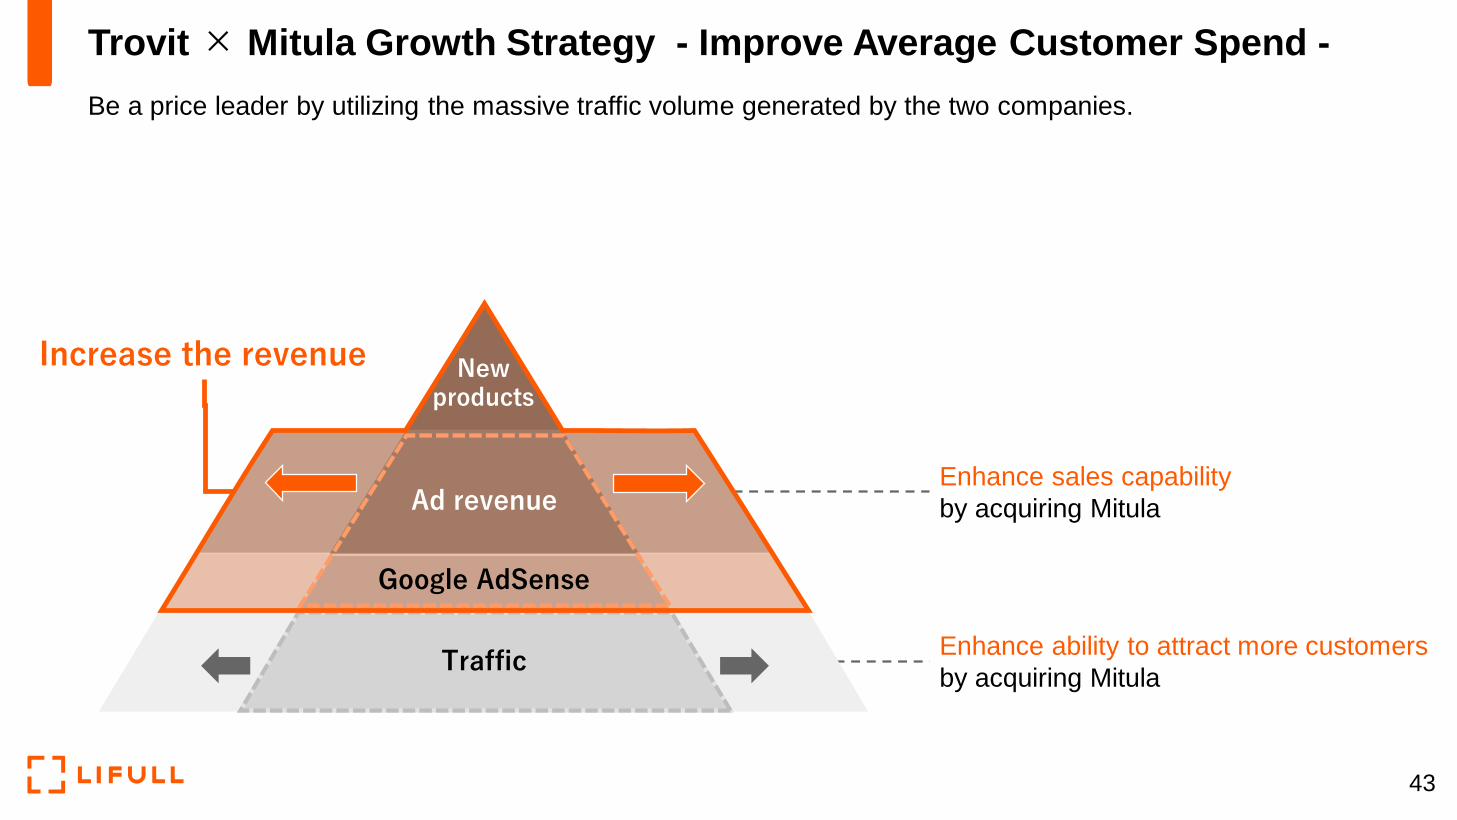
Trovit × Mitula Growth Strategy - Improve Average Customer Spend -
Be a price leader by utilizing the massive traffic volume generated by the two companies.
Enhance ability to attract more customers
by acquiring Mitula
Enhance sales capability
by acquiring Mitula
Traffic
Increase the revenue
Google AdSense
Ad revenue
Newproducts
43
Page 45
Trovit × Mitula Growth Strategy - Service -
Increase potential value per user to capture multi-dimension revenue opportunities
1)CPC
2) Advertisement
3)Transaction
★
★
Va
lue
Po
ten
tial
Low
High
• Text Link
• Google AdSense
• Premium Advertisements
• E-mail Marketing
• Retargeting
• Banners
• Quality customer
referral
• Closing
• Secondary Markets(Peripheral areas)
Improve the profit by increasing points of contact with users 44
Page 46
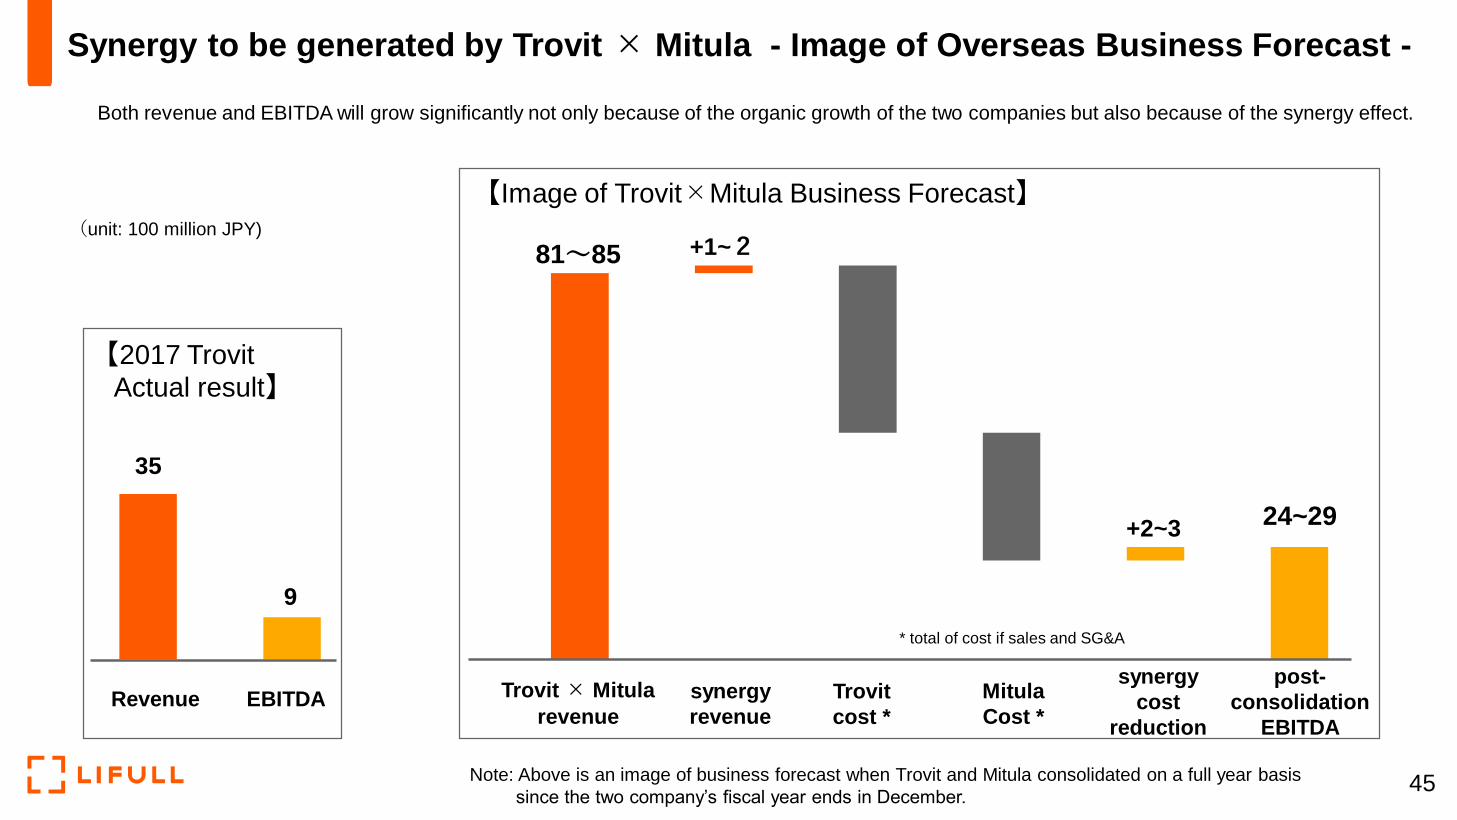
Both revenue and EBITDA will grow significantly not only because of the organic growth of the two companies but also because of the synergy effect.
Synergy to be generated by Trovit × Mitula - Image of Overseas Business Forecast -
【2017 Trovit
Actual result】
Revenue EBITDA Trovit × Mitula
revenue
synergy
revenue
Trovit
cost *
Mitula
Cost *
synergy
cost
reduction
post-
consolidation
EBITDA
【Image of Trovit×Mitula Business Forecast】
* total of cost if sales and SG&A
(unit: 100 million JPY)
35
9
81~85 +1~2
+2~324~29
Note: Above is an image of business forecast when Trovit and Mitula consolidated on a full year basis
since the two company’s fiscal year ends in December.45
Page 47
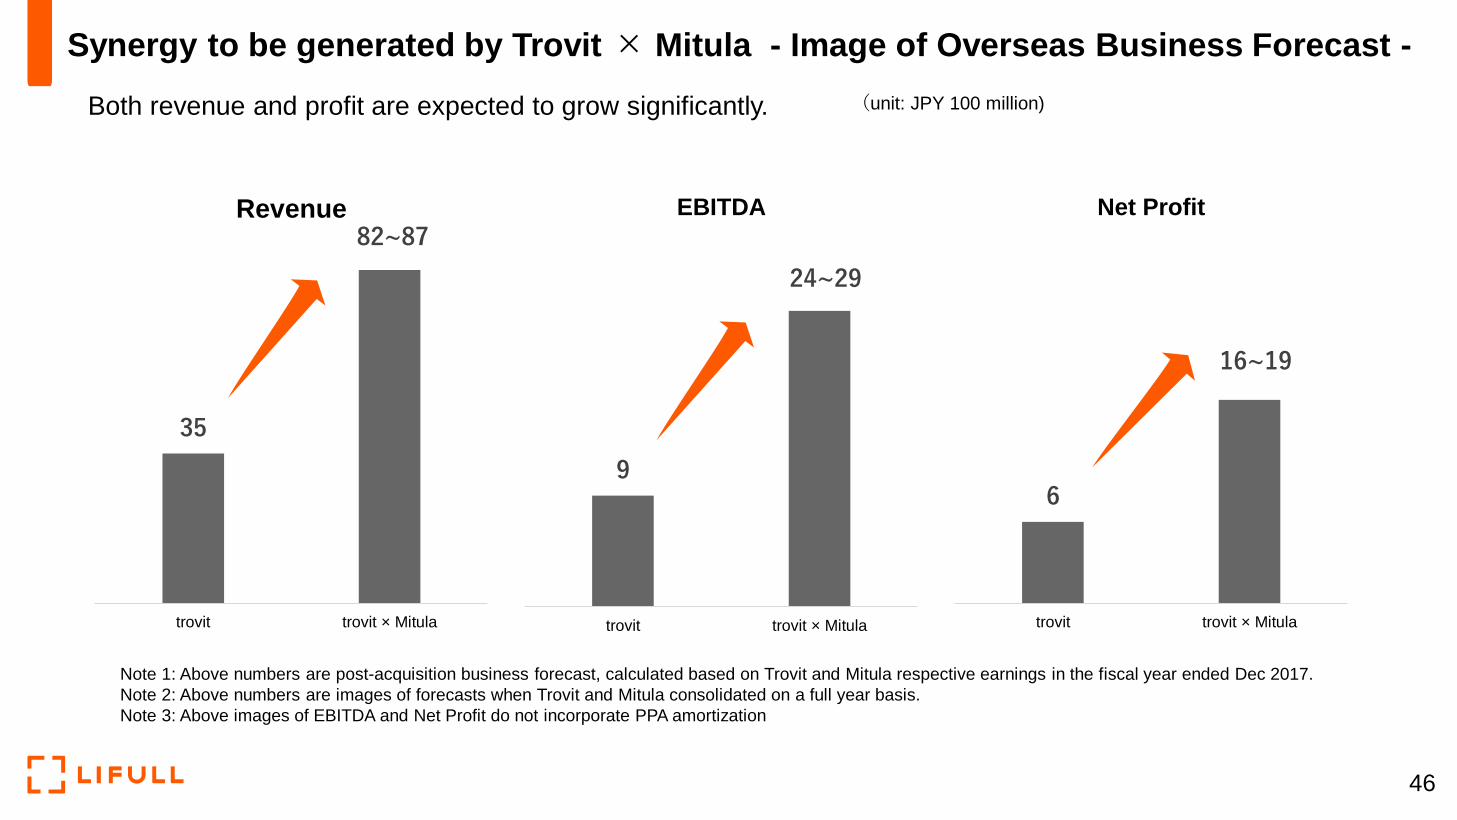
Both revenue and profit are expected to grow significantly.
Synergy to be generated by Trovit × Mitula - Image of Overseas Business Forecast -
35
82~87
trovit trovit × Mitula
Revenue
9
24~29
trovit trovit × Mitula
EBITDA
6
16~19
trovit trovit × Mitula
Net Profit
(unit: JPY 100 million)
Note 1: Above numbers are post-acquisition business forecast, calculated based on Trovit and Mitula respective earnings in the fiscal year ended Dec 2017.
Note 2: Above numbers are images of forecasts when Trovit and Mitula consolidated on a full year basis.
Note 3: Above images of EBITDA and Net Profit do not incorporate PPA amortization
46
Page 48
15.6%dilution at maximum
[ Dilution by issuing common shares ] [ expected profit increase after the consolidation ]
Net profit will increase by
aprx. 20~25%
* based on net profit forecast for FY2018/9
* As a result of the above trial calculation, amortization of
depreciable assets (PPA) is a condition of 200 million yen
annually.
Impact Following Mitula Acquisition - Size of impact per share -
Although stock value will be diluted by 15.6% at maximum after the issuance of common shares, the size of
consolidation synergy is expected to be bigger.
47
Page 49
Copyright(c) LIFULL Co., Ltd. All Rights Reserved.
Others Business
48
Page 50
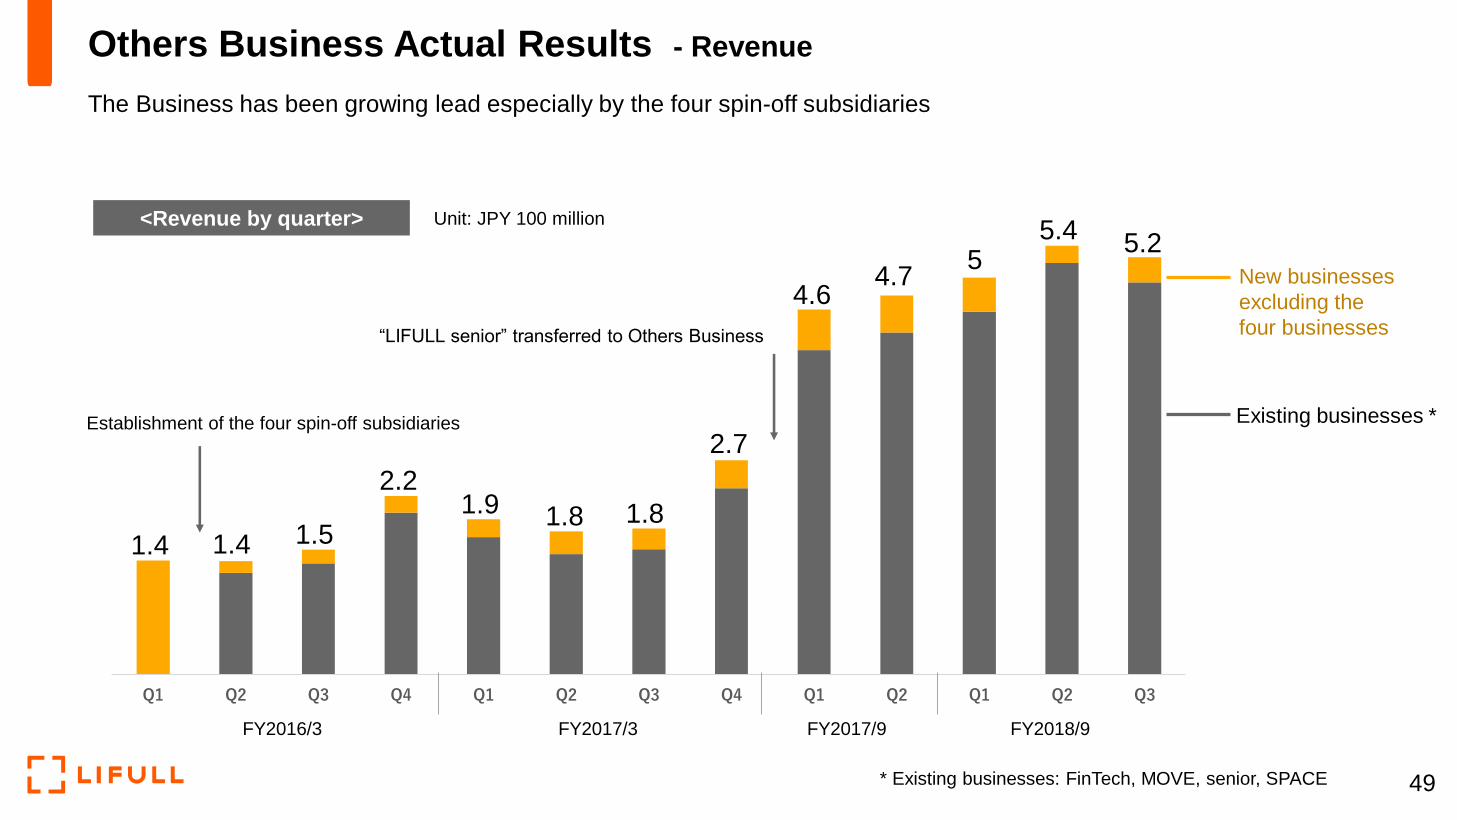
単位:億
Q1 Q2 Q3 Q4 Q1 Q2 Q3 Q4 Q1 Q2 Q1 Q2 Q3
5.2New businesses
excluding the
four businesses
Existing businesses *
5.45
4.74.6
2.7
1.81.81.92.2
1.51.41.4
Establishment of the four spin-off subsidiaries
* Existing businesses: FinTech, MOVE, senior, SPACE
FY2016/3 FY2017/3 FY2017/9 FY2018/9
Unit: JPY 100 million
“LIFULL senior” transferred to Others Business
Others Business Actual Results - Revenue
The Business has been growing lead especially by the four spin-off subsidiaries
49
<Revenue by quarter>
Page 51
Others Business Actual Results - Operating Income (quarterly)
Existing business increased steadily. Other business is investment stage, but plan to further grow further
50
Q1 Q2 Q3 Q4 Q1 Q2 Q3 Q4 Q1 Q2 Q1 Q2 Q3
<Operating Income by quarter> 1.1
0.6
-1
-0.8
0.50.5
0.2
0.4
0.20.3
0.6
0.20.1
-0.9-0.9
-0.3-0.3-0.1-0.1
-0.1
FY2016/3 FY2017/3 FY2017/9 FY2018/9
Existing businesses *
Unit: JPY 100 million
* Existing businesses: FinTech, MOVE, senior, SPACE
New businesses
excluding the
four businesses
0
1
- 1
-1.1
Page 52
Make every LIFE FULL.
Page 54
Company LIFULL Co., Ltd.
Stock code 2120 (TSE 1st Section)
Representative Takashi Inoue, President and CEO
History Mar. 12, 1997 Established
Oct. 2006 Listed in TSE, Mother’s Section
Mar. 2010 Listed on TSE 1st Section
Capital JPY 3,999 million
Stock issues 118,789,100 shares (incl. 73,736 shares of treasury stock)
Consolidated
number of employee1,280 people (incl. 200 temporary and 118 overseas)
Major shareholder LIFULL directors, Rakuten, Inc. (20%)
Main subsidiaries ()
stakeTrovit Search, S.L. (100%)LIFULL Marketing Partners (100%)
Corporate Info (as of June 30, 2018)
53
Page 55
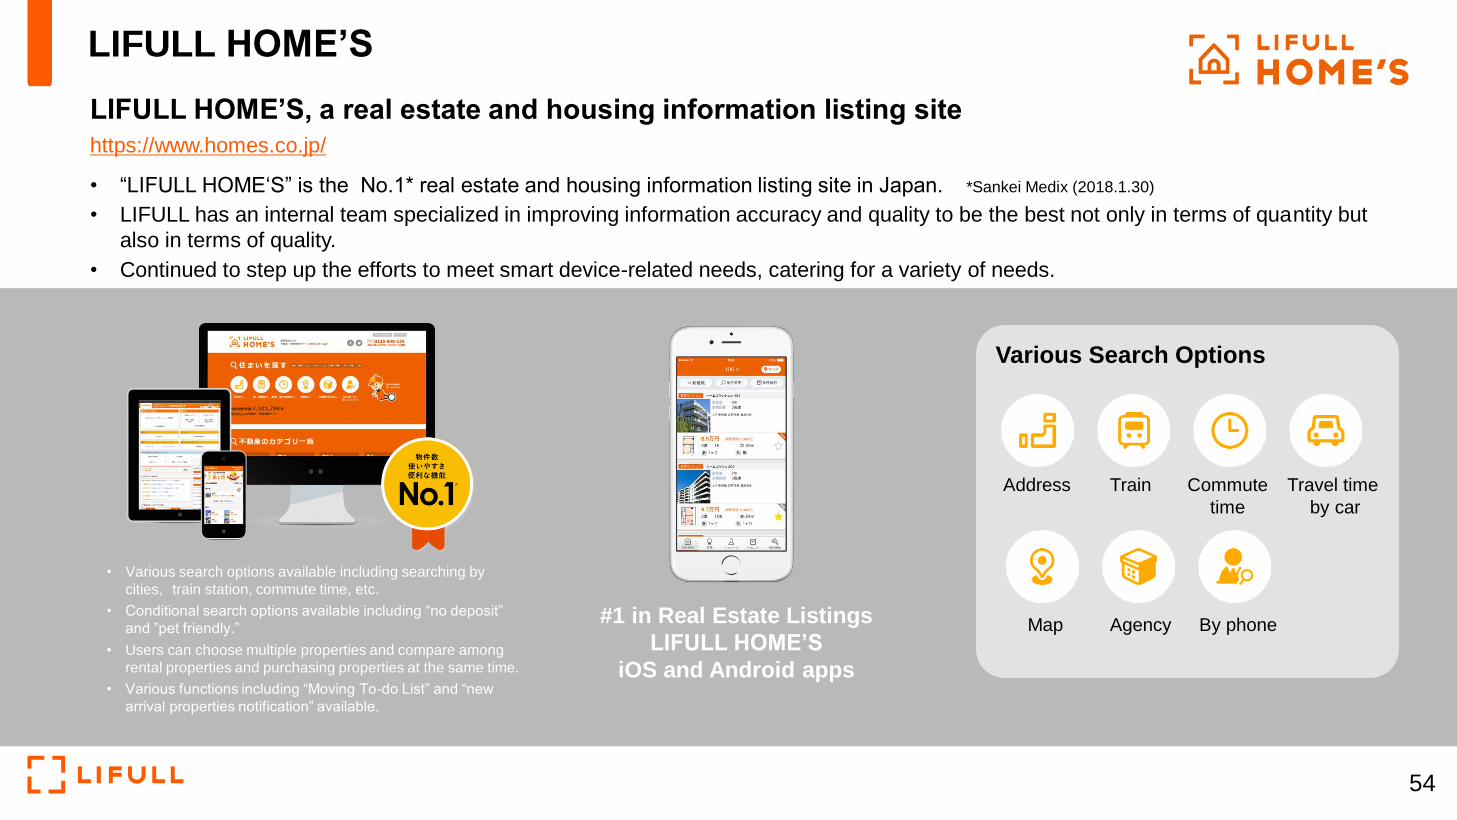
LIFULL HOME’S, a real estate and housing information listing site
https://www.homes.co.jp/
• “LIFULL HOME‘S” is the No.1* real estate and housing information listing site in Japan. *Sankei Medix (2018.1.30)
• LIFULL has an internal team specialized in improving information accuracy and quality to be the best not only in terms of quantity but
also in terms of quality.
• Continued to step up the efforts to meet smart device-related needs, catering for a variety of needs.
#1 in Real Estate Listings
LIFULL HOME’S
iOS and Android apps
• Various search options available including searching by
cities, train station, commute time, etc.
• Conditional search options available including “no deposit”
and ”pet friendly.”
• Users can choose multiple properties and compare among
rental properties and purchasing properties at the same time.
• Various functions including “Moving To-do List” and “new
arrival properties notification” available.
Various Search Options
Address Train Commute
time
Travel time
by car
Map Agency By phone
LIFULL HOME’S
54
Page 56
LIFULL HOME’S
real estate information site
Compariso
n of home
loans
LIFULL
Hikkoshi
(moving
LIFULL
Insurance
Real estate
sales
inspections
LIFULL
HOME’S real
estate
investment
Interests, needs Comparisons,
considerationsInquiries and office visits
Sales, real estate
investmentRelocation InsuranceCompletion of contract
LIFULL HOME’S app
Price Map
Sale Price Simulator
Call Center Counter
Mortgage estimates
LINE inquiry
Smart
Viewing
New equipment assurance
New house/condo
assurance
LIFULL HOME’S House Appraisal
LIFULL Interior Insurance broker Correspondence in foreign
languages
Management, building and
stocking
Acquire customers,
information, follow-upContract completion
Brokerage services,
real estate investments
Easy copy tool
for agents
Property
Distribution
Owner CRM
SNS
Floor plan
preparation
Collection
services
Ad consulting
Deposit
management
Grid Vrick
ANNEXOnline Viewing
Appointment
(smart lock)
Tie-in ads Room VR
DMP
AD MASTER (Renter’s Net)
Concierge
Anonymous surveys, seminars
Credit
“My Room” insurance
LIFULL HOME’S LIVE
Explanation on important matter
Online contract
Credit card settlement
Correspondence in foreign languages
LIFULL Remodel
Real Estate Price
Visualization
Online property
Viewing
Escrow
Online contact
Specialist companies(Movers, insurance agencies, etc.)
Ma
tch
ing
Fo
r re
alt
ors
(ad
min
-su
pp
ort
)F
or
us
ers
Being
provided
Under development/in
planning
Not
undertaken
Started to provide since FY18/9 Q1
LIFULL Service List
LIFULL provides a wide range of user-friendly and realtor-friendly services
55
Page 57
Mid-to-Long Term
Strategy Roadmap
in the real estate field
Data-
base
Net-
work
Media
New Domains
LIF
UL
L H
OM
E’S
Co
re S
trate
gy
Global
PlatformExpanding
real-estate
marketsStimulating
real-estate
marketsTransforming
the real-estate
industry
Covering the
information and evaluations(property info, pricing, asset info,
performance evaluation, realtor rating)
Akiya Bank
Vacation rental
database
Covering the
information of
investment properties
Building the global
database
Expanding the network of alliance partners and
local governments
Making online
transaction available
Development of uses
Crowd-funding
Services for realtors
Real estate technology
(ReTech)
Expanding the network of
real-estate companies in
the world
Expanding the share and
brand recognition in the
global marketExpanding the share and brand recognition in the domestic market
Enhancing LIFULL HOME’S
media power
Omni-Channel Strategy
Vacation rental site
Monthly rental site
Expanding the affiliated
office (clients) network of
real-estate companies
56
Page 58
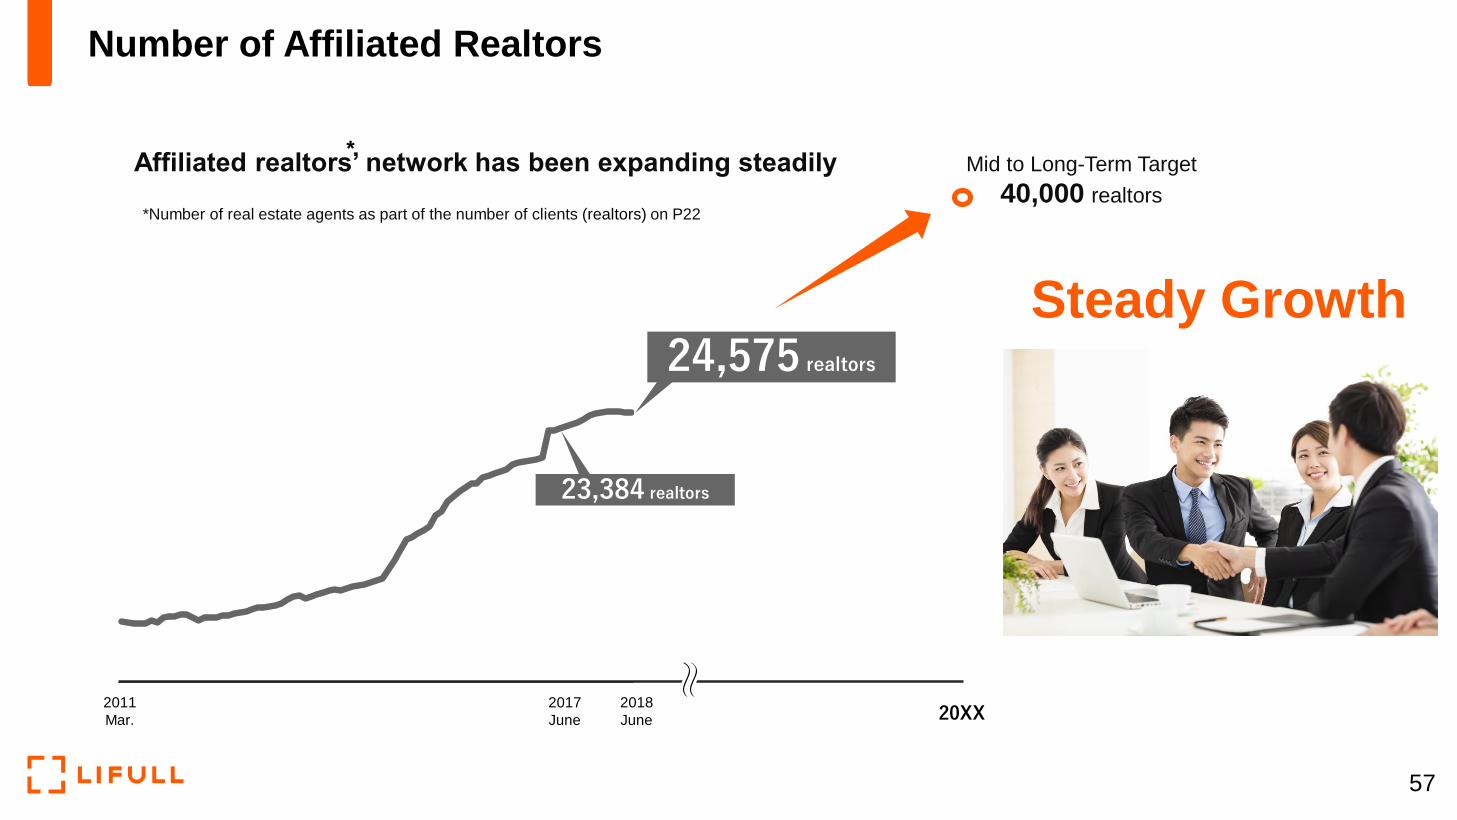
24,575 realtors
23,384 realtors
*Number of real estate agents as part of the number of clients (realtors) on P22
Affiliated realtors’ network has been expanding steadily*
Mid to Long-Term Target
40,000 realtors
Steady Growth
20XX2011
Mar.
2017
June
2018
June
Number of Affiliated Realtors
57
Page 59
0
2,000
4,000
6,000
8,000
10,000
2010
Apr.
(building)
New Houses and Condos
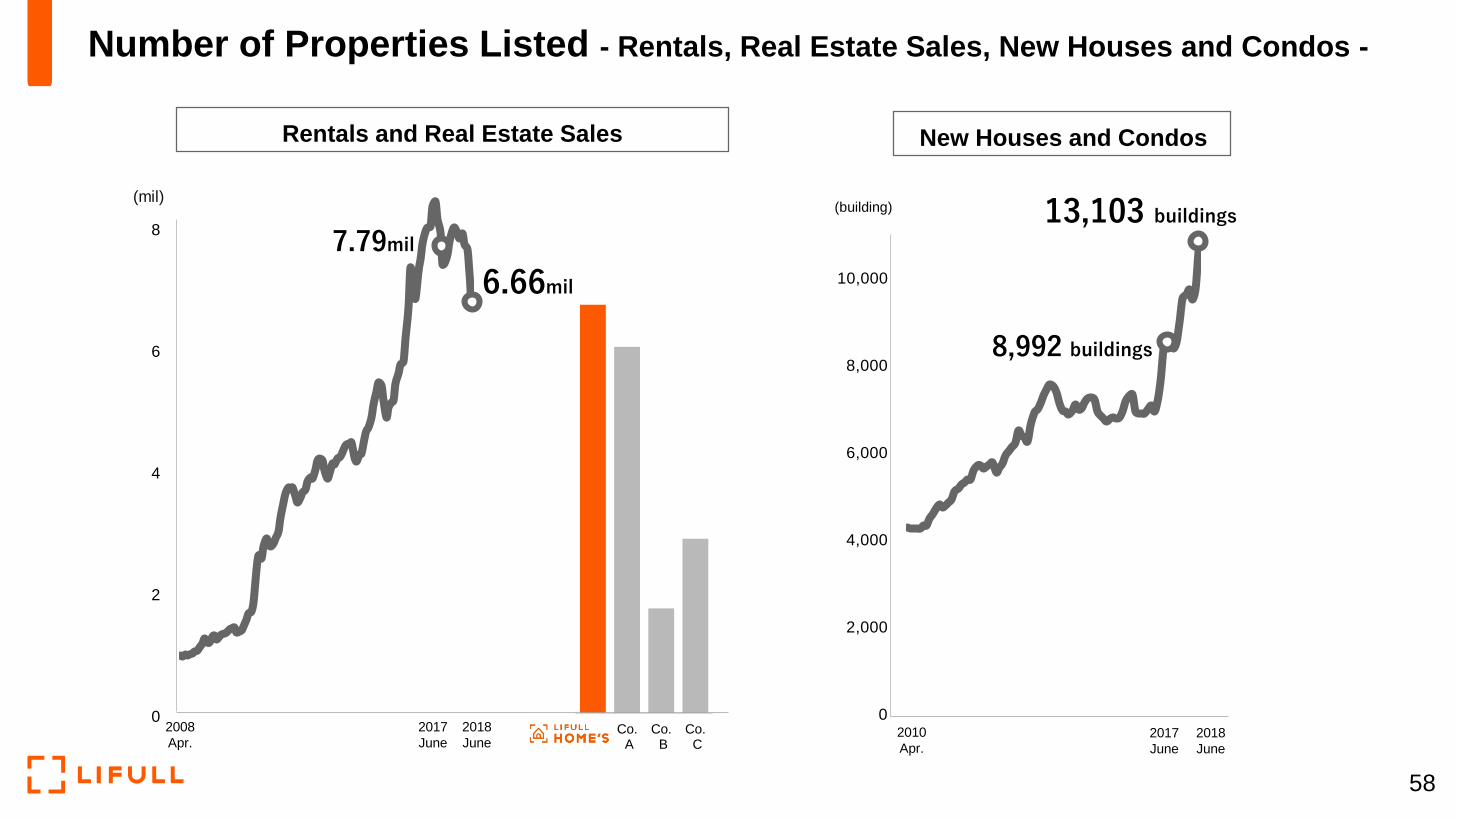
8,992 buildings
13,103 buildings
2017
June
2018
June
Co. A
Co. B
Co. C
Rentals and Real Estate Sales
0
2
4
6
8
(mil)
7.79mil
6.66mil
2008
Apr.
2017
June
2018
June
Number of Properties Listed - Rentals, Real Estate Sales, New Houses and Condos -
58
Page 60
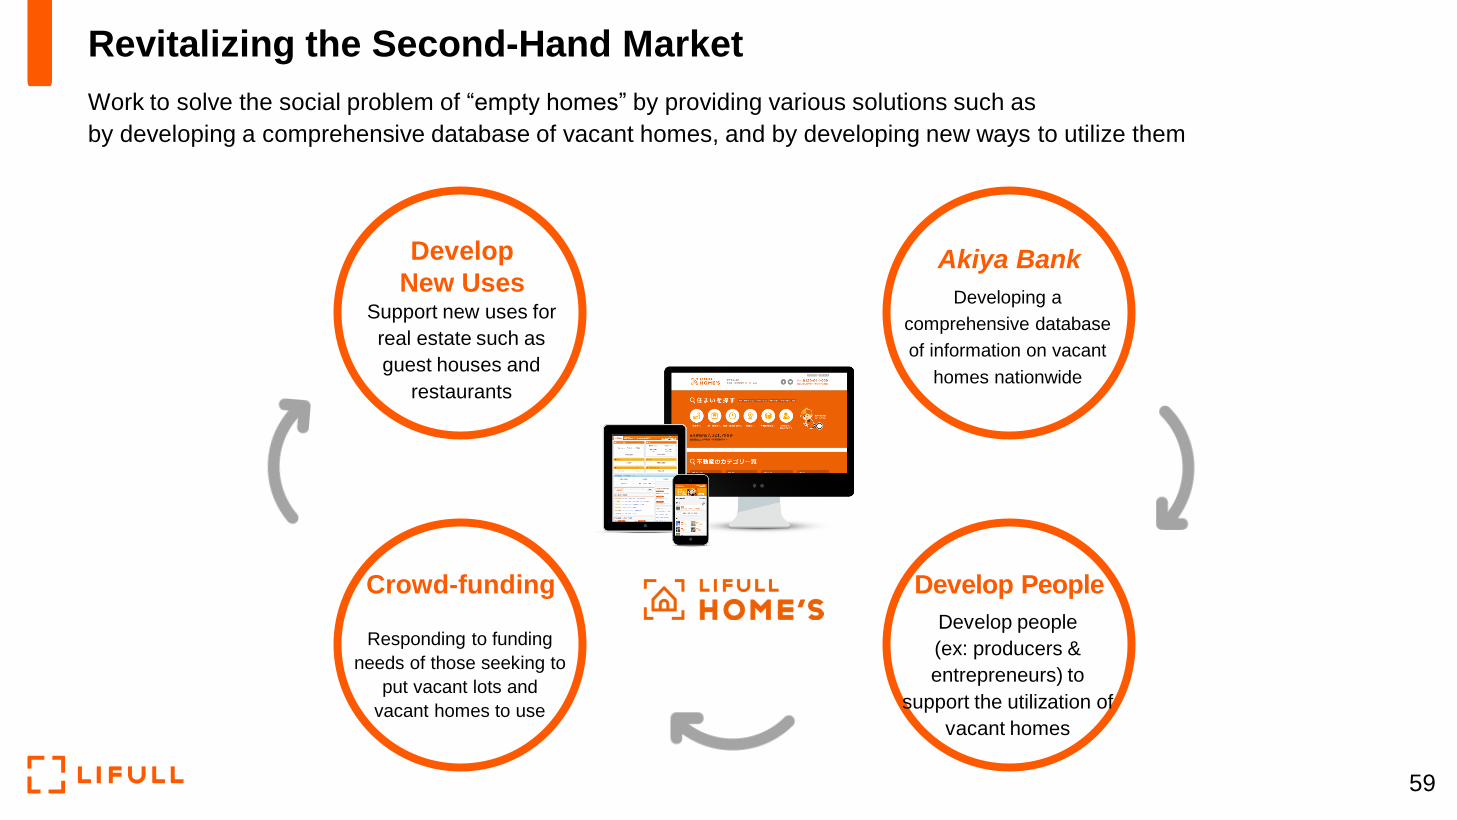
Revitalizing the Second-Hand Market
Work to solve the social problem of “empty homes” by providing various solutions such as
by developing a comprehensive database of vacant homes, and by developing new ways to utilize them
59
Developing a
comprehensive database
of information on vacant
homes nationwide
Akiya Bank
Develop People
Develop people
(ex: producers &
entrepreneurs) to
support the utilization of
vacant homes
Responding to funding
needs of those seeking to
put vacant lots and
vacant homes to use
Crowd-funding
Develop
New UsesSupport new uses for
real estate such as
guest houses and
restaurants
Page 61
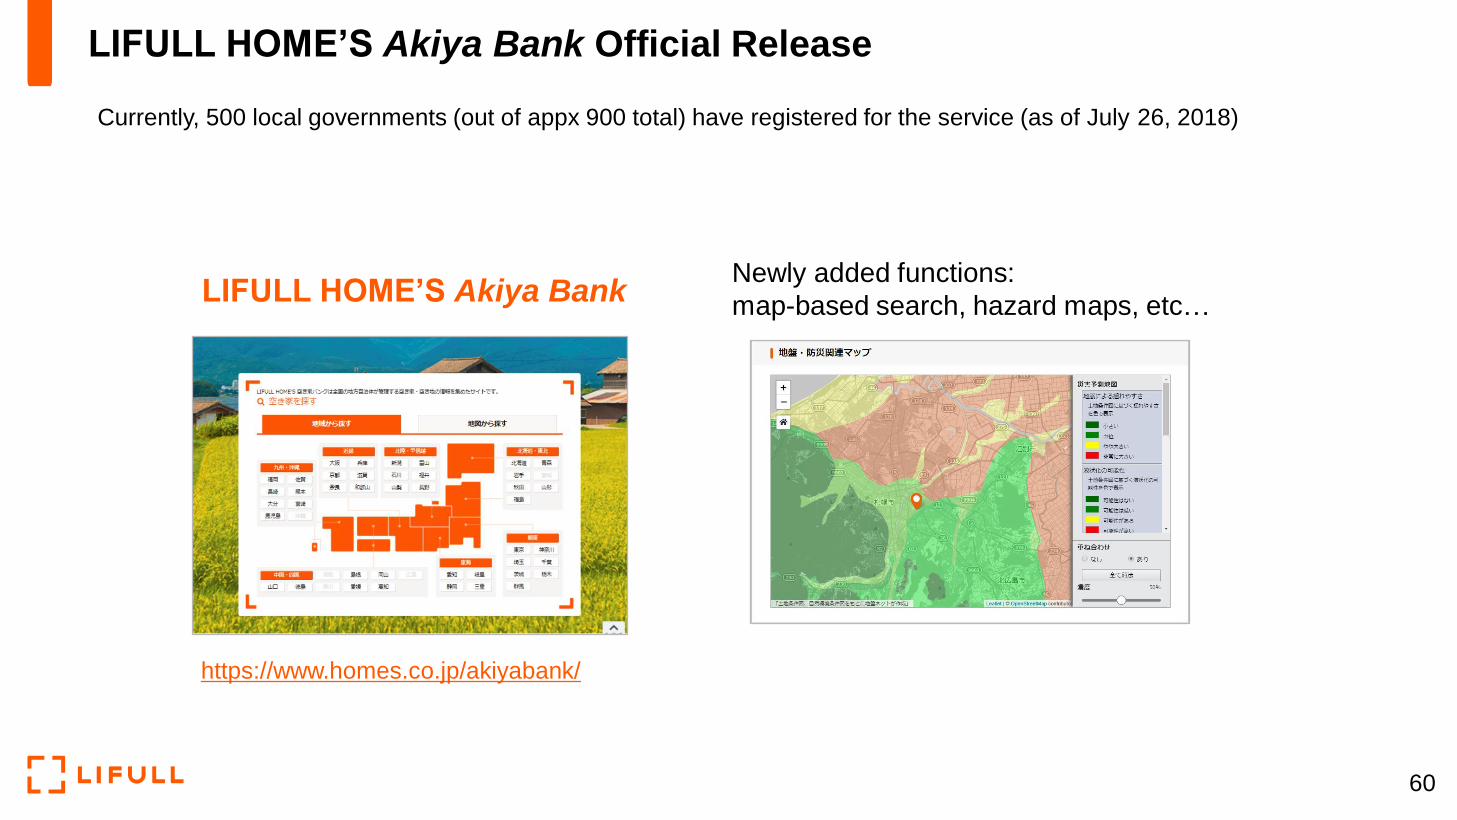
LIFULL HOME’S Akiya Bank Official Release
Currently, 500 local governments (out of appx 900 total) have registered for the service (as of July 26, 2018)
Newly added functions:
map-based search, hazard maps, etc… LIFULL HOME’S Akiya Bank
https://www.homes.co.jp/akiyabank/
60
Page 62
https://vacation-stay.jp/
Fee structure (service charge)
Plan to collect 3% from the host and 12% from the guest
Global accommodation and vacation
rental reservation sites
Automatic
Posting
Vacation STAY 検索
RAKUTEN LIFULL STAY - “Vacation STAY”
Registration of properties to Vacation STAY - the vacation rental and accommodation reservations site - has begun
61
Page 63
New Business – New Service
Rental meeting room and rental space information site “LIFULL Rental Space” launched.
https://www.homes.co.jp/rentalspace
Rental Meeting Room and
Rental Space Information Site
Service started Jan 2018
62
Page 64
Overseas subsidiaries
Trovit Search, S.L. (Spain)
LIFULL Tech Vietnam (Vietnam)
Others
LIFULL Marketing Partners (Consulting)
LIFULL bizas (Back office)
LIFULL Social Funding (Crowd-funding)
LIFULL Kaigo(nursing care)
LIFULL Hoken Sodan(insurance consultation)
LIFULL Interior
LIFULL Storage
LIFULL Hikkoshi(moving)
other LIFULL Services
Insurance agency search and
appointment website
Operated by LIFULL FinTech
Furniture / interior EC website
“LIFULL Interior”
Operated by LIFULL Interior
Website to make an inquiry
and reservation with movers
Operated by LIFULL MOVE
Website to search nursing care homes
or elderly housing
Operated by LIFULL senior
A website to search rental storage room/unit
Operated by LIFULL SPACE
• “LIFULL Flower”: regular monthly delivery of seasonal flowers
• “Ouchi de shika”: visiting dentist and information search service• “Mina no ihinseiri”: search service for finding companies
specializing in cleaning up the belongings of the deceasedOperated by LIFULL senior
LIFULL Group Services
63
Page 65
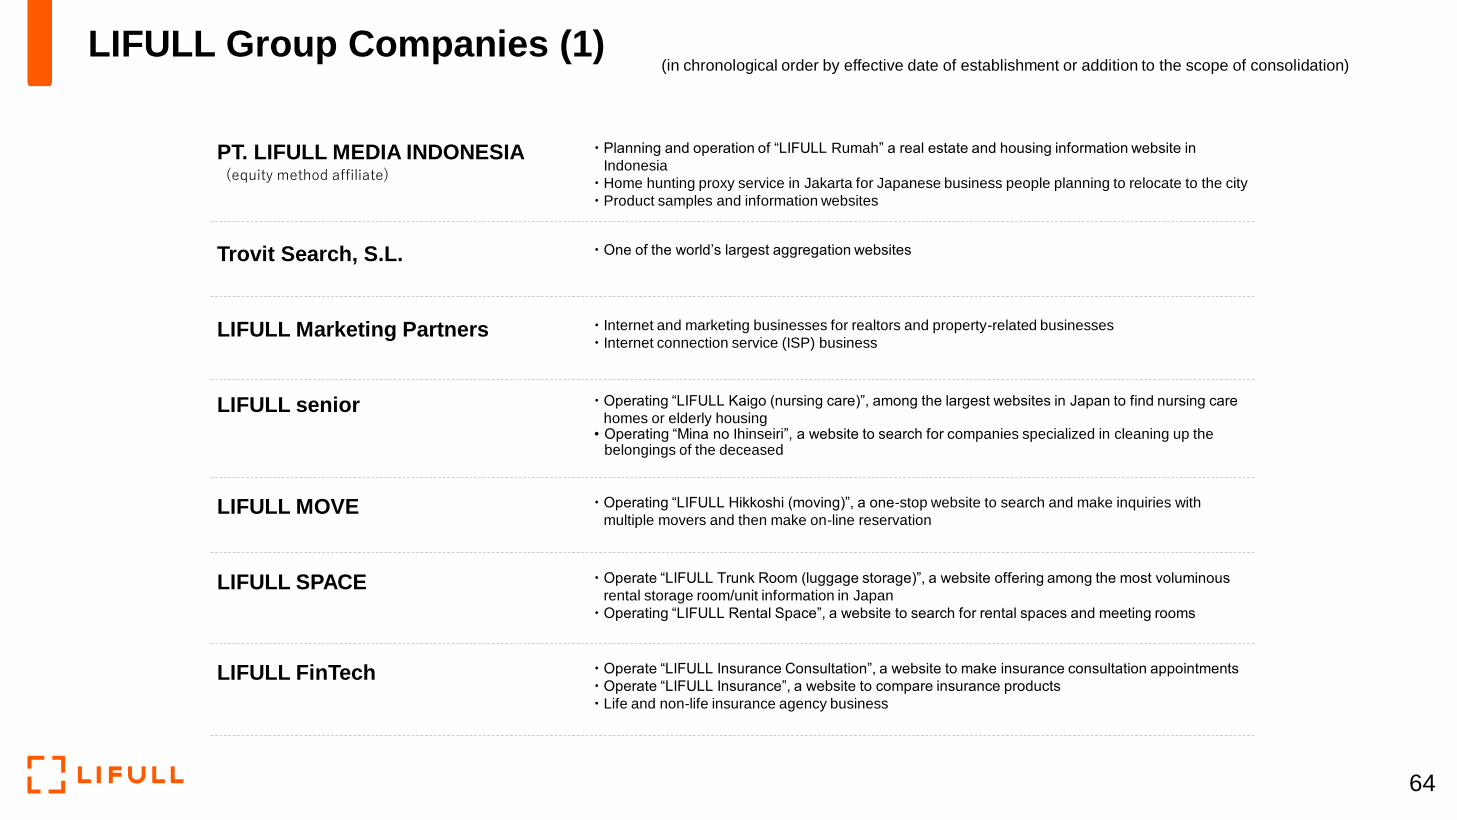
PT. LIFULL MEDIA INDONESIA Planning and operation of “LIFULL Rumah” a real estate and housing information website in
Indonesia
Home hunting proxy service in Jakarta for Japanese business people planning to relocate to the city
Product samples and information websites
Trovit Search, S.L. One of the world’s largest aggregation websites
LIFULL Marketing Partners Internet and marketing businesses for realtors and property-related businesses
Internet connection service (ISP) business
LIFULL senior Operating “LIFULL Kaigo (nursing care)”, among the largest websites in Japan to find nursing care
homes or elderly housing• Operating “Mina no Ihinseiri”, a website to search for companies specialized in cleaning up the
belongings of the deceased
LIFULL MOVE Operating “LIFULL Hikkoshi (moving)”, a one-stop website to search and make inquiries with
multiple movers and then make on-line reservation
LIFULL SPACE Operate “LIFULL Trunk Room (luggage storage)”, a website offering among the most voluminous
rental storage room/unit information in Japan
Operating “LIFULL Rental Space”, a website to search for rental spaces and meeting rooms
LIFULL FinTech Operate “LIFULL Insurance Consultation”, a website to make insurance consultation appointments
Operate “LIFULL Insurance”, a website to compare insurance products
Life and non-life insurance agency business
(in chronological order by effective date of establishment or addition to the scope of consolidation)
(equity method affiliate)
LIFULL Group Companies (1)
64
Page 66
LIFULL bizas Administration and other back office operation outsourcee
Call center operation outsourcee
LIFULL Social Funding Operating “Japan Giving” and “Shooting Star” crowd-funding platforms
LIFULL Tech Vietnam Co., Ltd. Offshore development, Lab development, software development, application development and
creative development
LIFULL Interior ・Operate an interior and furniture EC site, “LIFULL Interior”
RAKUTEN LIFULL STAY ・Operate a vacation rental and accommodation platform
(in chronological order by effective date of establishment or addition to the scope of consolidation)
(formerly JG MARKETING)
(formerly Vietnam Creative Consulting)
(a joint venture with FLYMEe Inc.,
established on Nov. 6, 2017)
(equity method affiliate)
(a joint venture with Rakuten, Inc.)
Established “RAKUTEN LIFULL STAY PTE.
LTD.” as 100% subsidiary in March 2017
LIFULL Group Companies (2)
65
Page 67
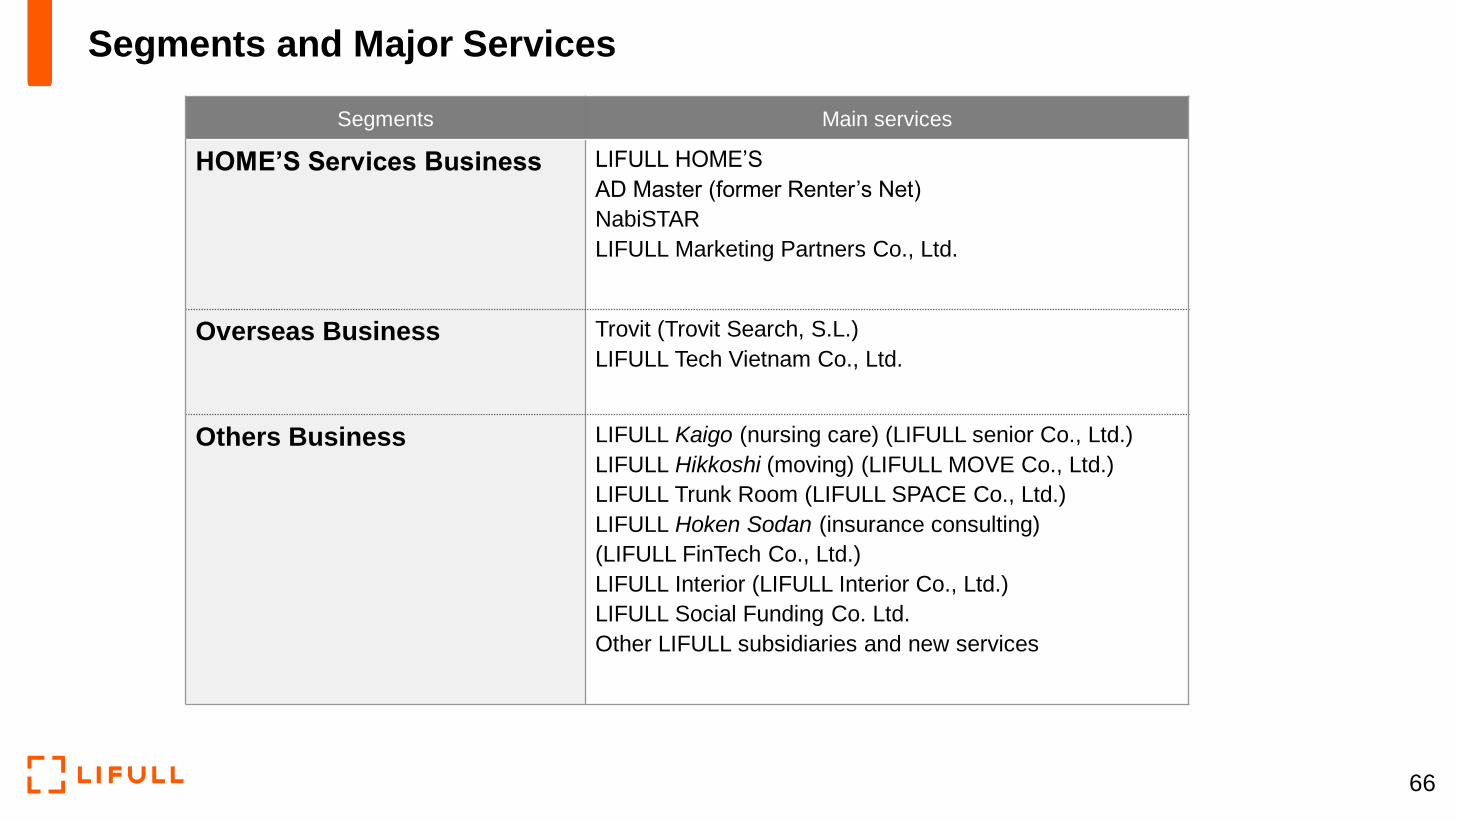
Segments Main services
HOME’S Services Business LIFULL HOME’S
AD Master (former Renter’s Net)
NabiSTAR
LIFULL Marketing Partners Co., Ltd.
Overseas Business Trovit (Trovit Search, S.L.)
LIFULL Tech Vietnam Co., Ltd.
Others Business LIFULL Kaigo (nursing care) (LIFULL senior Co., Ltd.)
LIFULL Hikkoshi (moving) (LIFULL MOVE Co., Ltd.)
LIFULL Trunk Room (LIFULL SPACE Co., Ltd.)
LIFULL Hoken Sodan (insurance consulting)
(LIFULL FinTech Co., Ltd.)
LIFULL Interior (LIFULL Interior Co., Ltd.)
LIFULL Social Funding Co. Ltd.
Other LIFULL subsidiaries and new services
Segments and Major Services
66
Page 68
Consolidated Statements of Profit and Loss (quarterly)
67
*Net income = Net income attributable to owners of the parent
*We made modification to disclosure segments since FY2017/09. Sales of prior periods has been described in conjunction with the change of segment.
1Q 2Q 3Q 4Q 1Q 2Q 3Q 4Q 1Q 2Q 1Q 2Q 3Q
5,457 6,441 6,280 7,527 6,846 6,910 7,107 9,056 7,793 8,154 8,128 9,541 8,345
4,280 5,210 5,167 6,263 5,616 5,782 5,955 7,662 6,472 6,816 6,742 8,062 6,833
904 940 796 865 823 750 750 867 859 858 883 935 983
273 290 317 397 406 377 400 525 461 479 502 542 528
141 737 597 651 670 737 774 897 915 946 928 946 996
4,036 4,640 4,343 5,605 4,776 4,581 5,422 6,627 6,346 6,100 5,862 6,987 5,948
1,366 1,479 1,535 1,888 1,773 1,531 1,811 1,923 1,993 1,816 1,962 1,783 1,963
1,524 2,002 1,527 2,291 1,689 1,730 2,145 2,834 2,719 2,695 2,426 3,657 2,431
208 245 305 257 246 236 282 244 240 215 236 267 209
937 912 975 1,168 1,066 1,082 1,183 1,624 1,393 1,373 1,236 1,279 1,344
-13 -41 -33 -33 -6 -42 -30 -39 -72 -30 71 18 6
1,267 1,022 1,306 1,237 1,392 1,549 879 1,491 458 1,077 1,408 1,624 1,406
214 214 230 205 221 217 338 468 253 266 274 266 263
1,052 808 1,076 1,031 1,171 1,331 540 1,022 205 811 1,134 1,358 1,142
682 552 693 742 734 942 331 756 22 467 591 980 702
23.2% 15.9% 20.8% 16.4% 20.3% 22.4% 12.4% 16.5% 5.9% 13.2% 17.3% 17.0% 16.9%
FY2017/09
Revenue
HOME'S Services Business
Overseas Business
FY2018/09
Others Business
FY2017/03Unit : JPY mil
FY2016/03
EBITDA margin
Cost of sales
SG&A
Personal expenses
Advertising expenses
Operating expenses
Other SG&A
Other revenues and expenses
EBITDA
Depreciation/amortization cost
Operating profit
Net income *
Page 69
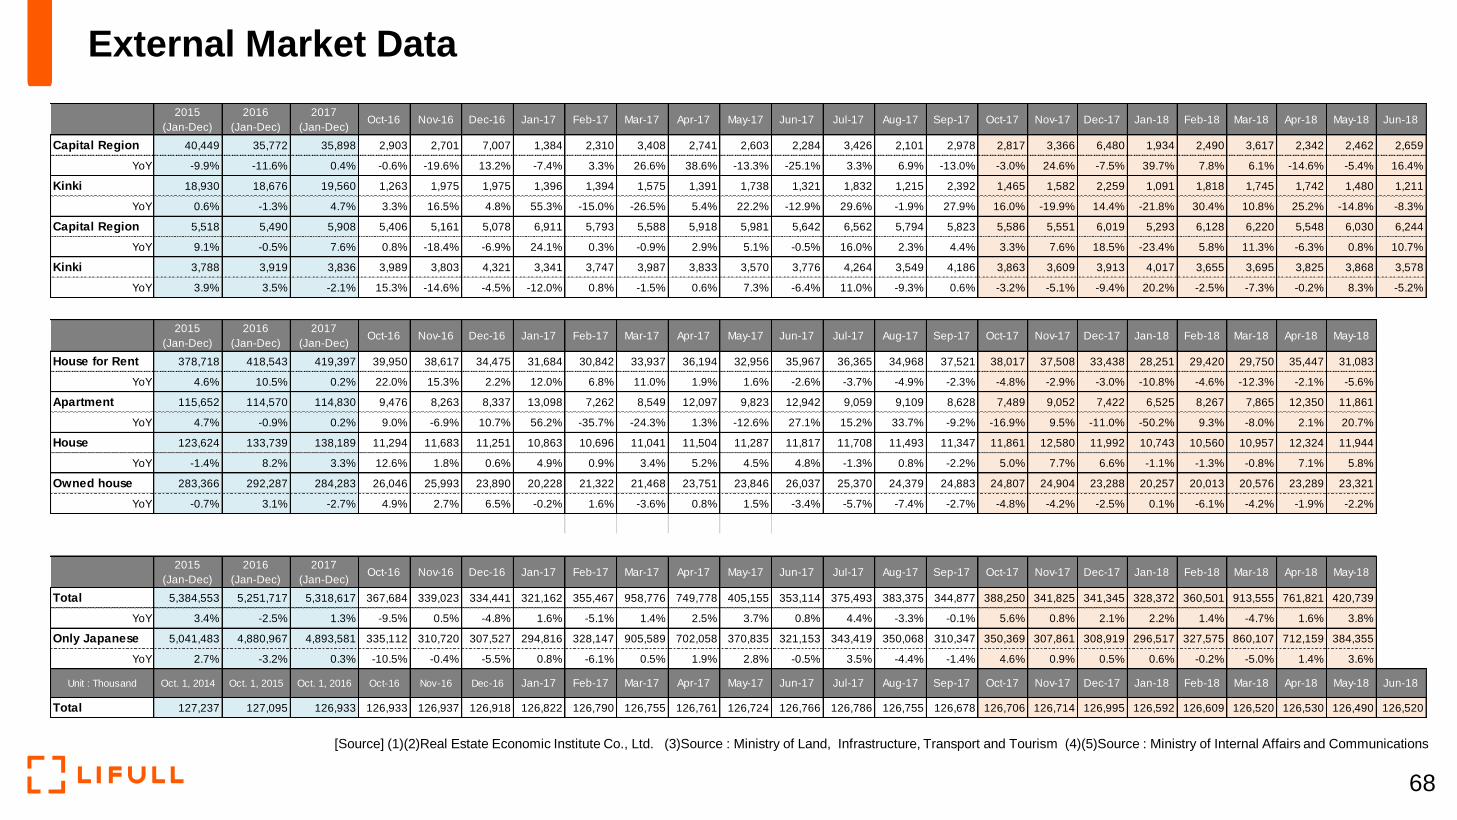
External Market Data
68
[Source] (1)(2)Real Estate Economic Institute Co., Ltd. (3)Source : Ministry of Land, Infrastructure, Transport and Tourism (4)(5)Source : Ministry of Internal Affairs and Communications
2015
(Jan-Dec)
2016
(Jan-Dec)
2017
(Jan-Dec)Oct-16 Nov-16 Dec-16 Jan-17 Feb-17 Mar-17 Apr-17 May-17 Jun-17 Jul-17 Aug-17 Sep-17 Oct-17 Nov-17 Dec-17 Jan-18 Feb-18 Mar-18 Apr-18 May-18 Jun-18
Capital Region 40,449 35,772 35,898 2,903 2,701 7,007 1,384 2,310 3,408 2,741 2,603 2,284 3,426 2,101 2,978 2,817 3,366 6,480 1,934 2,490 3,617 2,342 2,462 2,659
YoY -9.9% -11.6% 0.4% -0.6% -19.6% 13.2% -7.4% 3.3% 26.6% 38.6% -13.3% -25.1% 3.3% 6.9% -13.0% -3.0% 24.6% -7.5% 39.7% 7.8% 6.1% -14.6% -5.4% 16.4%
Kinki 18,930 18,676 19,560 1,263 1,975 1,975 1,396 1,394 1,575 1,391 1,738 1,321 1,832 1,215 2,392 1,465 1,582 2,259 1,091 1,818 1,745 1,742 1,480 1,211
YoY 0.6% -1.3% 4.7% 3.3% 16.5% 4.8% 55.3% -15.0% -26.5% 5.4% 22.2% -12.9% 29.6% -1.9% 27.9% 16.0% -19.9% 14.4% -21.8% 30.4% 10.8% 25.2% -14.8% -8.3%
Capital Region 5,518 5,490 5,908 5,406 5,161 5,078 6,911 5,793 5,588 5,918 5,981 5,642 6,562 5,794 5,823 5,586 5,551 6,019 5,293 6,128 6,220 5,548 6,030 6,244
YoY 9.1% -0.5% 7.6% 0.8% -18.4% -6.9% 24.1% 0.3% -0.9% 2.9% 5.1% -0.5% 16.0% 2.3% 4.4% 3.3% 7.6% 18.5% -23.4% 5.8% 11.3% -6.3% 0.8% 10.7%
Kinki 3,788 3,919 3,836 3,989 3,803 4,321 3,341 3,747 3,987 3,833 3,570 3,776 4,264 3,549 4,186 3,863 3,609 3,913 4,017 3,655 3,695 3,825 3,868 3,578
YoY 3.9% 3.5% -2.1% 15.3% -14.6% -4.5% -12.0% 0.8% -1.5% 0.6% 7.3% -6.4% 11.0% -9.3% 0.6% -3.2% -5.1% -9.4% 20.2% -2.5% -7.3% -0.2% 8.3% -5.2%
2015
(Jan-Dec)
2016
(Jan-Dec)
2017
(Jan-Dec)Oct-16 Nov-16 Dec-16 Jan-17 Feb-17 Mar-17 Apr-17 May-17 Jun-17 Jul-17 Aug-17 Sep-17 Oct-17 Nov-17 Dec-17 Jan-18 Feb-18 Mar-18 Apr-18 May-18 Jun-18
House for Rent 378,718 418,543 419,397 39,950 38,617 34,475 31,684 30,842 33,937 36,194 32,956 35,967 36,365 34,968 37,521 38,017 37,508 33,438 28,251 29,420 29,750 35,447 31,083 0
YoY 4.6% 10.5% 0.2% 22.0% 15.3% 2.2% 12.0% 6.8% 11.0% 1.9% 1.6% -2.6% -3.7% -4.9% -2.3% -4.8% -2.9% -3.0% -10.8% -4.6% -12.3% -2.1% -5.6% 0.0%
Apartment 115,652 114,570 114,830 9,476 8,263 8,337 13,098 7,262 8,549 12,097 9,823 12,942 9,059 9,109 8,628 7,489 9,052 7,422 6,525 8,267 7,865 12,350 11,861 0
YoY 4.7% -0.9% 0.2% 9.0% -6.9% 10.7% 56.2% -35.7% -24.3% 1.3% -12.6% 27.1% 15.2% 33.7% -9.2% -16.9% 9.5% -11.0% -50.2% 9.3% -8.0% 2.1% 20.7% 0.0%
House 123,624 133,739 138,189 11,294 11,683 11,251 10,863 10,696 11,041 11,504 11,287 11,817 11,708 11,493 11,347 11,861 12,580 11,992 10,743 10,560 10,957 12,324 11,944 0
YoY -1.4% 8.2% 3.3% 12.6% 1.8% 0.6% 4.9% 0.9% 3.4% 5.2% 4.5% 4.8% -1.3% 0.8% -2.2% 5.0% 7.7% 6.6% -1.1% -1.3% -0.8% 7.1% 5.8% 0.0%
Owned house 283,366 292,287 284,283 26,046 25,993 23,890 20,228 21,322 21,468 23,751 23,846 26,037 25,370 24,379 24,883 24,807 24,904 23,288 20,257 20,013 20,576 23,289 23,321 0
YoY -0.7% 3.1% -2.7% 4.9% 2.7% 6.5% -0.2% 1.6% -3.6% 0.8% 1.5% -3.4% -5.7% -7.4% -2.7% -4.8% -4.2% -2.5% 0.1% -6.1% -4.2% -1.9% -2.2% 0.0%
2015
(Jan-Dec)
2016
(Jan-Dec)
2017
(Jan-Dec)Oct-16 Nov-16 Dec-16 Jan-17 Feb-17 Mar-17 Apr-17 May-17 Jun-17 Jul-17 Aug-17 Sep-17 Oct-17 Nov-17 Dec-17 Jan-18 Feb-18 Mar-18 Apr-18 May-18 Jun-18
Total 5,384,553 5,251,717 5,318,617 367,684 339,023 334,441 321,162 355,467 958,776 749,778 405,155 353,114 375,493 383,375 344,877 388,250 341,825 341,345 328,372 360,501 913,555 761,821 420,739 0
YoY 3.4% -2.5% 1.3% -9.5% 0.5% -4.8% 1.6% -5.1% 1.4% 2.5% 3.7% 0.8% 4.4% -3.3% -0.1% 5.6% 0.8% 2.1% 2.2% 1.4% -4.7% 1.6% 3.8% 0.0%
Only Japanese 5,041,483 4,880,967 4,893,581 335,112 310,720 307,527 294,816 328,147 905,589 702,058 370,835 321,153 343,419 350,068 310,347 350,369 307,861 308,919 296,517 327,575 860,107 712,159 384,355 0
YoY 2.7% -3.2% 0.3% -10.5% -0.4% -5.5% 0.8% -6.1% 0.5% 1.9% 2.8% -0.5% 3.5% -4.4% -1.4% 4.6% 0.9% 0.5% 0.6% -0.2% -5.0% 1.4% 3.6% 0.0%
Unit : Thousand Oct. 1, 2014 Oct. 1, 2015 Oct. 1, 2016 Oct-16 Nov-16 Dec-16 Jan-17 Feb-17 Mar-17 Apr-17 May-17 Jun-17 Jul-17 Aug-17 Sep-17 Oct-17 Nov-17 Dec-17 Jan-18 Feb-18 Mar-18 Apr-18 May-18 Jun-18
Total 127,237 127,095 126,933 126,933 126,937 126,918 126,822 126,790 126,755 126,761 126,724 126,766 126,786 126,755 126,678 126,706 126,714 126,995 126,592 126,609 126,520 126,530 126,490 126,520
Page 70
Annual Report 2017
Twitter Facebook Page
https://www.facebook.com/LIFULL.corp/https://twitter.com/LIFULL_Corp
IR Office Information
IR Website English https://LIFULL.com/en/ir/
E-mail [email protected]
Japanese https://LIFULL.com/ir/
TEL 03-6774-1603 (Monday to Friday 10:00AM-6:00PM)
FAX 03-6774-1737
Other Information
Englishhttps://lifull.com/wp-
content/uploads/2017/10/LIFULL_
AnnualReport2017_en.pdf
Japanesehttps://lifull.com/news/10305/
69Copyright(c) LIFULL Co., Ltd. All Rights Reserved.