128
East Kalimantan Environmentally Sustainable Development Strategy
| Date post: | 04-Jul-2015 |
| Category: |
Documents |
| Upload: | anujin-baatar |
| View: | 404 times |
| Download: | 2 times |

East Kalimantan Environmentally Sustainable Development Strategy
2
DRAFT
Draft for circulation
The analysis in this document shows how it is possible for East Kalimantan to cut greenhouse gas emissions and still develop, continuing to create better livelihoods for its diverse population. Our experience tells us that such a top-down plan requires an extensive process of integration, socialization and re!nement. Much needs to be done, in particular, to reconcile the priorities emerging from high-level analysis with the priorities that our communities feel on the ground.
In order to reconcile different perspectives, this draft document is being circulated to experts, community representatives, and other interested parties in all districts across the province. We expect much to change in this document, in the way that we organize, sequence, and present action priorities, as we continue to discuss and reconcile top-down and bottom-up perspectives.
This draft is for limited circulation to stakeholders for discussion and input. This draft is not for citation nor does it represent of!cial policy.
3
DRAFTEast Kalimantan
Environmentally Sustainable Development Strategy

4
DRAFT

5
DRAFT
Contents
Preface 7
Acknowledgements 9
Executive summary 11
Kaltim Green Program 17
1. The context for East Kalimantan’s development 19
2. East Kalimantan’s environmentally sustainable development strategy 23
3. Sector strategies 29
Palm oil sector 29
Forestry sector 43
Agriculture sector 58
Coal sector 66
Oil and gas sector 76
4. District strategies 84
5. Adaptation 96
6. Implementation and enablers 104
Sources 119

6
DRAFT
“Since 1950, East Kalimantan has
reduced its forest cover by 35 percent
(6.9 million hectares).”

7
DRAFT
Preface
A broad global consensus has emerged that human activities are causing a rapid buildup of carbon dioxide and other greenhouse gases (GHG) in the atmosphere (from less than 300 parts per million in pre-industrial times to 433 ppm in 2005), and that this buildup is causing a rise in global average temperatures and impacting the climate. The Intergovernmental Panel on Climate Change (IPCC) has estimated various scenarios of future emissions levels and the degree of future climate change, which range from significant to catastrophic impact on people, economies, and communities. While the global consensus recognizes the uncertainty over what scenario will unfold, the risks are deemed great enough today to warrant concerted, coordinated global action to mitigate climate change.
The global consensus has developed far faster than a global response. Of the many obstacles, one has been the recognition that the developed world is responsible for the majority of historical greenhouse gas emissions. This has led some developing countries to argue that developed countries must first take full action to reduce their emissions before a global agreement including developing countries is reached. However, even if all developed countries reduced their emissions to 1990 levels (as targeted under the Kyoto Protocol), this would not be enough to avert serious climate change. Developing nations now account for such large and growing emissions that they too must take action today if climate change is to be mitigated.
Indonesia understands this impasse. It has decided to take action to break it and create new momentum in the global negotiations for serious action to combat climate change. Under the leadership of President Susilo Bambang Yudhoyono, Indonesia has made several pioneering contributions. First, Indonesia hosted the United Nations Framework Climate Change Convention (UNFCCC) Conference of Parties (COP-13) in Bali in 2007. Then Indonesia organized and participated in a series of high-level gatherings to address the issue of reducing GHG from the land use, land-use change, and forestry (LULUCF) sector, which is a major source of emissions in developing countries but rarely in developed countries. Next, at the September 2009 G-20 summit in Pittsburgh, President Yudhoyono voluntarily committed Indonesia to an ambitious roadmap for reducing its carbon emissions by 26 percent by 2020, the first large developing country to make such a commitment. Indonesia reaffirmed its commitment to the reduction target at the COP-15 round of negotiations in Copenhagen in December 2009 and is currently preparing a National Action Plan on Climate Change, which will describe in detail how Indonesia will meet its 26 percent commitment.
The traditional thinking is that reducing carbon emissions must come at the expense of economic growth, with environmental financing and international assistance providing a form of welfare payment to compensate local communities for these losses. This need not be the case. In fact, the scheme to reduce emissions from deforestation and forest degradation (REDD) that was mandated at the Bali Climate Change Conference two years ago can help move Indonesia onto a more environmentally sustainable development growth path.
For a democratic and decentralized country such as Indonesia, the provincial and district-level governments are at the heart of this challenge. The Provincial Government of East Kalimantan, under the leadership of Governor Awang Faroek Ishak, and the National Council on Climate Change (Dewan Nasional Perubahan Iklim, DNPI) have launched this Environmentally Sustainable Development Strategy (Strategi Pembanguan Ramah Lingkuan) to chart a plan for the province.
8
DRAFT
East Kalimantan intends to pioneer a new development pathway that reconciles economic growth with significant reductions of greenhouse gas emissions.
This report evaluates the potential for environmentally sustainable development in East Kalimantan. It first outlines a fact-based assessment of current and likely future GHG emissions for the province and then considers the potential actions to reduce emissions, the relative volume of each of these reduction measures, and an indication of costs (or gains) per measure. The report then identifies how the province can move to higher value-added activities and new low-carbon sectors so that its future growth leaves a smaller carbon footprint. Recognizing that a degree of climate change is already locked in by recent CO2e rises, and despite current global action, the strategy also explores adaptation measures, which aim to make the province more resilient to climate change.
East Kalimantan hopes to become a showcase not only in Indonesia but globally of how to combine carbon abatement with economic growth. We hope to inspire others to recognize the potential for environmentally sustainable development. Neither DNPI nor the Government of East Kalimantan underestimate the challenges in making the shift to such a new model of development. As in other parts of Indonesia, the underlying drivers of emissions are strong, entrenched, often based on highly profitable activities, and abetted by weaknesses in the country’s nascent institutions. Yet the journey must begin, step by step. President Yudhoyono has taken the first steps with his leadership and commitments. The Governor of East Kalimantan, H Awang Faroek Ishak, has taken the next step committing East Kalimantan to a more sustainable future. This strategy marks another step forward.
9
DRAFT
AcknowledgementsThe DNPI and the Government of East Kalimantan would like to express their appreciation to the Climate Land Use Alliance and the Norwegian Government for partially funding this effort to develop an environmentally sustainable development strategy for the Province of East Kalimantan.
The DNPI and the Government of East Kalimantan would like to acknowledge Daemeter Consulting, McKinsey & Company, Mulawarman University, The Nature Conservancy (TNC), and The World Wildlife Fund (WWF) for their analytical support in connection with this study. The DNPI and the Government of East Kalimantan would also like to thank the several hundred government, private company, and NGO personnel who made important contributions to this work in various workshops and meetings. While the data and input came from many stakeholders and information sources, the conclusions and results set forth in this report are exclusively those of the DNPI and the Government of East Kalimantan.
10
DRAFT
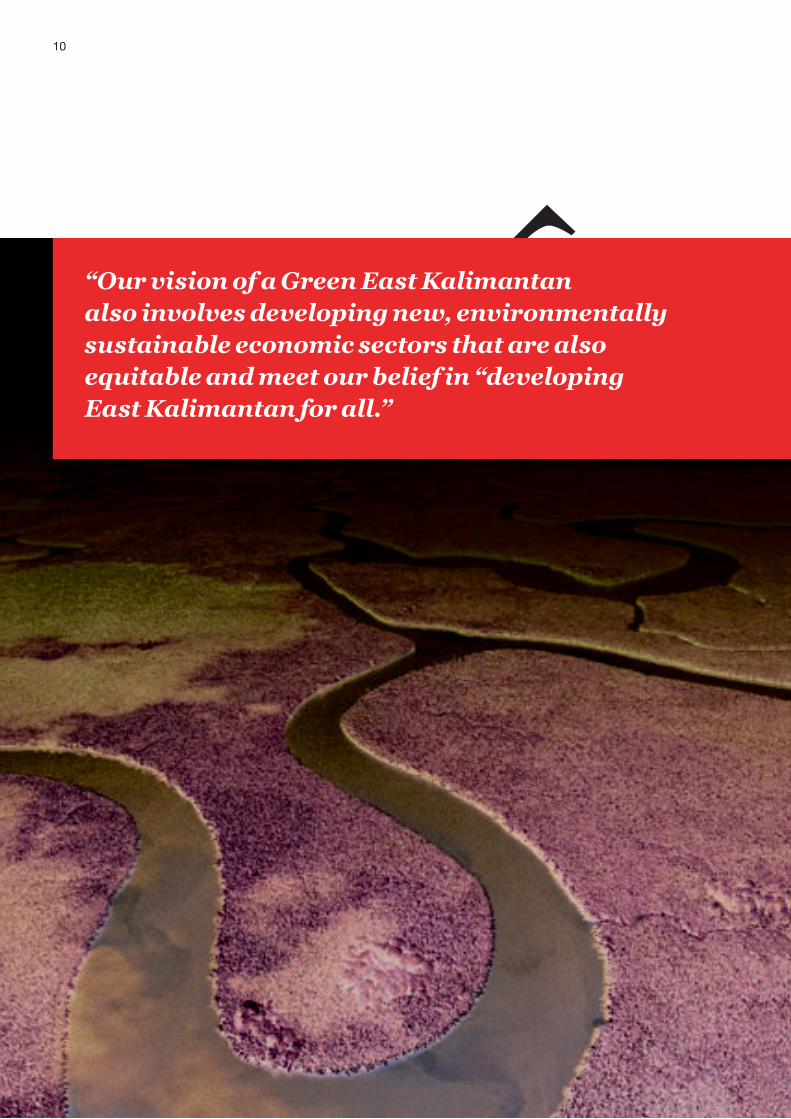
“Our vision of a Green East Kalimantan
also involves developing new, environmentally
sustainable economic sectors that are also
equitable and meet our belief in “developing
East Kalimantan for all.”

11
DRAFT
East Kalimantan has an ambitious goal to become a Green Province. This goal includes contributing to a 26 percent reduction in CO2e emissions by 2020 as part of Indonesia’s national commitment. Our vision of a Green East Kalimantan also involves developing new, environmentally sustainable economic sectors that are also equitable and meet our belief in “developing East Kalimantan for all.”
The document also sets out a comprehensive series of initiatives aimed at climate-compatible economic development. We consider the measures we need to take to protect our people from the impact of climate change. Together, abatement measures, adaptation measures and development opportunities create the framework for our province’s climate compatible development strategy.
EMISSION ABATEMENT
Five broad initiatives account for 75 percent of all of the CO2e reduction opportunities in the province. And while they demand different approaches, these efforts all share something in common: increasing the efficiency of land use.
The single most important measure we can take to cut emissions is to enforce a zero 1. burning policy. This effort achieves the greatest abatement at the lowest cost. By prohibiting the use of fire as a tool to clear land, by enforcing this prohibition, and by creating a system of early warning and fire brigades, we can prevent damaging forest and peatland fires. This can reduce emissions in East Kalimantan by as much as 47 MtCO2e by 2030 at a cost of USD 0.40 per ton.
Since the devastation of the 1980s and late 1990s, we’ve learned much about the damage caused by these fires, and equally, about the practical difficulties of preventing them. Enforcement remains the biggest challenge. We’ve also learned that the economic pressures that drive farmers, planters and miners to use fire as a tool are felt most keenly by smallholders, and so our efforts must give them clear incentives and tools to use alternative methods of land clearing.
Reduced impact logging is the second largest abatement opportunity overall, with the 2. potential to prevent 34 MtCO2e of emissions at an implementation cost of USD 1.10 per ton. Reduced impact logging will require a relatively high investment of more than USD 100 per hectare and could be even higher if substantial investments in road construction are required. While the forestry sector economic contribution is less to East Kalimantan than it has been in the past, it still remains important for many of our most rural communities. Poor logging practices, often carried out in violation of existing laws and regulations, mean that for every ton of carbon harvested into saleable timber, as many as another five tons are emitted from timber which is damaged, and left to rot or burn as waste.
We need to improve harvesting planning, and extracting practices. We need to change the behavior of our loggers, and this will require a major investment in forestry management units across the province, and as well as investment in road and skidding infrastructure, both from government and from forestry companies. Last but not least, investments in skidding technology and the training of forest workers are also required. These efforts will require a relatively high investment of USD 150 per hectare, but a truly sustainable forestry industry could be an important source of livelihoods for us for many years to come.
Executive summary

12
DRAFT
Reforestation and rehabilitation of forests that have been partially degraded will 3. restore ecosystem services and also absorb carbon, providing a reduction of emissions of 12 MtCO2e at a cost of USD 2.60 per ton. The forest estate under the administration of the national Ministry of Forestry includes some 1.5 million ha of “slightly critical land” (agak kritis) that has been degraded by unsustainable logging practices. These forests can be restored, and serve eventually as carbon sinks, but in order to do so they must be set aside for conservation.
Rehabilitation and water management of previously opened peatlands offers the 4. possibility of saving some 18 MtCO2e at an average cost of USD 0.50 per ton. Peat soils play a critical role in carbon emissions in our province, and once drained and degraded they may emit CO2 for many years. We are coming to understand more and more of the role of peat in emissions is relatively new, but betterhow management of the water table of our peatlands can cut emissions dramatically and still allow economic use of lands that which are already cleared. On top of high carbon emissions there are additional arguments against the clearing of peat forests, such as flood prevention and protecting high biodiversity, and these should also be taken into account when granting permits for alternative land uses.
The use of degraded land 5. (lahan kritis) for future expansion of oil palm plantations, timber plantations, and agriculture will allow us to grow these critical industries while providing a reduction of emissions of 24 MtCO2e at a cost of USD 5.50 per ton. As many 1.4 million hectares in the province are categorized as very critical or critical lands. The terms cover different categories of land, including those with negligible or little tree cover or even mostly covered by unproductive alang-alang grasslands. About one third of these degraded lands are found in contiguous fields of 500 ha and larger. Using these areas for plantations of oil palm or pulpwood would avoid deforestation of equally sized forests.
One first step to enable the expansion of plantation on degraded land is the development of a provincial degraded land database, which looks at soils, forest cover, existing usage and land tenure, as well as other dimensions of economic potential. Degraded lands need to be specifically identified in the spatial planning process, and should be prioritized over forested areas for plantation location permits. Subsidies for the use of degraded land and/or high carbon taxes on forested land might also be necessary to encourage the private sector to use degraded areas. It might also be necessary to compensate oil palm concessionaires to shift from forested land to degraded land.
Considering all the practical constraints, the timely use of degraded lands could save some 500,000 hectares of forests in the province. More use of degraded land could be achieved relatively quickly if the issuing of new concessions for oil palm cultivation were simultaneously put on hold, as indeed has been announced by the President as part of the Norway-Indonesia REDD+ Partnership.
SUSTAINABLE DEVELOPMENT EFFORTS
Hand in hand with our efforts to abate emissions, there are a number of complementary growth initiatives that we should pursue urgently, as part of a sustainable economic development effort. The top five such efforts could increase GDP by IDR 68 trillion in 2030, and so increase our growth from 3 percent per year to 5 percent without increasing emissions. The emphasis here is on capturing more of the value-added from the processing of our natural resources.
13
DRAFT
The development of coal-bed methane1. would bring important new stocks of natural gas online, while mitigating the environmental harm of methane emissions from existing coal mines. Use of CBM will ensure that our existing LNG and natural gas network and industry in the province is fully utilized as production declines in our offshore fields.
Develop integrated pulp and paper mills. 2. Making use of timber now discarded as waste, boosting productivity on existing timber plantations and bringing idle timber plantations into production would increase the supply of timber from sustainable resources to the extent that the province could develop two integrated pulp and paper mills, with a total capacity of 2.6 million tons. Improvements in land management and a sequenced financing approach will mitigate the risk that building mills creates demand for unsustainable timber harvesting.
Improved management of timber plantations could yield IDR 4.9 trillion in additional 3. GDP. Some 600,000 hectares of lands cleared for timber plantations, but currently sitting idle can be brought into production. This wastage of land is a legacy of poor past practices by the pulp and paper industry. Still, looking forward, pulpwood production on already cleared land is sustainable, especially in synergy with the other initiatives set out here. Plantations with short planting cycles are carbon neutral at best, but they can provide livelihoods and form the foundation for higher-value-added activities. In addition, we need to improve the productivity of our existing timber plantations to the levels reached in Sumatran plantations.
Accelerating oil and gas exploration is also important for slowing the decline in the oil 4. and gas sector, which is still the largest in the economy. Our existing fields are mature and face declining production. There are still significant estimated potential gas resources in the province, yet exploration activity has decreased as with all of Indonesia due to uncertainty in regulations. We aim to encourage more petroleum exploration by working with BP MIGAS to be more investor friendly and by directly facilitating local licenses and security
Increasing productivity of our agriculture sector is also important. 5. Yields from non-palm oil agriculture are some 25 percent below national norms. Incentives to farmers, better infrastructure, development of innovative nucleus-plasma schemes to increase the synergies between plantation agriculture and smallholders and more delivery of agricultural extension services all could help increase our productivity. Simply hitting the national average would add some IDR 2.9 trillion to provincial GDP by 2030, while benefitting rural populations
ENABLERS
There are three levels of action required from government to capture the abatement opportunities and enable the economic activities set out in brief above, and in more detail in the pages that follow. These form perhaps the most critical sets of actions required, because without the right governance of climate change mitigation and sustainable development, we will not succeed.
First, much of what needs to be done is simply to better enforce existing rules. For more than ten years we’ve suffered the ill effects of peatland and forest fires, and struggled to combat them. Our forestry and mining regulations embody much wisdom and best practice. The challenge is clearly in enforcing the rules that we have on the books, and in clarifying and settling whatever ambiguities or overlaps may constrain better regulation. While we can expect to attract added support from outside, given the importance of good governance of our forests to the global carbon emissions picture, which will be useful, but the success factors are in our control.

14
DRAFT
Secondly, there are clear opportunities to adjust and reform our regulatory and enforcement regime, to better fit the realities of today’s economy and the challenges of sustainable development. Elements of existing regulations on forestry, to choose one example, do not incentivize our loggers to follow sustainable practices. Government regulations on energy investments need to be updated to better suit the requirements of the coal-bed methane industry. This report recommends a number of incremental reform and adjustments, either in our provincial systems, or in national or local ones.
Much of the effort required here involves clarifying and rationalizing our spatial management system. Lands must be managed based on environmental and economic factors, not bureaucratic classifications that poorly reflect ground-truth. Creation of a new land-management system cannot be carried out by the Provincial government alone, or any single Ministry, but it is at the heart of our goal of improving the productivity of our lands. Sometimes lack of transparency in land ownership and licensing is a simple reflection of the complexity of overlapping claims, including traditional ones of course. So side-by-side with any attempt to rationalize our maps and geographic databases, we must institute a process of settling claims that is highly sensitive, highly responsive and involving of local communities, and yet decisive and speedy.
And lastly, in some cases we do need to build completely new systems to tackle climate change challenges. For example, we need to begin to build a system and method for measuring changes in emissions in the province. A good MRV system for measuring emissions changes is an essential building block to a scalable REDD or REDD+ regime. While REDD payments for avoiding deforestation are not among the most important emissions abatment measures on our agenda, they are certainly important, and have the potential to most directly channel funds to those who protect forests, foregoing the benefits of exploiting them. This is a new function that our government will have to create, leveraging the good work done by other governments, development partners and non-governmental organizations around the world.
- - -
Our analysis tells us that we can achieve growth and cut our carbon emissions. Our experience warns us that this is difficult, but also gives us faith that much can be achieved, as we look at our province’s record of development over the last decades. Achieving this change will also require significant financial resources; we estimate reducing our emissions with these initiatives will cost USD 2.00 – 3.10 per ton CO2e abated. These costs will ramp up over time, from USD 20-30 million in 2012 to USD 370-570 million in 2030.
East Kalimantan is a highly diverse society, as befits the richness and variety of our natural environment, from our forests and mountains to our seashores along the trading routes of Southeast Asia. To develop, we must unleash the drive and creativity of all members of our society. Environmentally sustainable development means that this creativity and drive will be built on a foundation of respect for our god-given natural heritage.

15
DRAFT

16
DRAFT
“…forests provide vital ecological
and environmental services such as
watershed protection, biodiversity, habitat
for countless species.”

17
DRAFT
The Government of East Kalimantan has created the Kaltim Green program, the province’s framework for sustainable development and reduction of greenhouse gas emissions.
The program was announced at the provincial event “Regional Initiatives in Anticipation of Global Warming and Climate Change Mitigation” (“Inisiatif Daerah Dalam Mengantisipasi Pemanasan Global and Mitigasi Perubahan Iklim”) held on 1 December 2009 in Balikpapan.
The Kaltim Green Program has four objectives:
Improve the overall quality of life of people of East Kalimantan, balancing economic, social, cultural, and environmental aspects
Reduce the threat of ecological and climate change threats such as flooding, landslides, droughts, forest fires across East Kalimantan
Reduce pollution and degradation of the quality of terrestrial ecosystems, water, and air in East Kalimantan
Increase the knowledge and awareness among the institutions and people of East Kalimantan that the conservation of natural resources is important and that resources must be used wisely
The Kaltim Green Declaration, agreed to by the Provincial and District governments across East Kalimantan, acknowledges the urgency of action to reduce greenhouse gas emissions and includes five commitments:
Carry out low carbon emission development; a)
Integrate sustainable development targets for the region; b)
Analyze and reform current development policy accordingly; c)
Promote the local research required to address climate change issues by supporting the d) province’s network of universities and colleges (especially in forestry); and
Support mitigation efforts in cooperation with international institutions. e)
This Environmentally Sustainable Development Strategy has been created as part of the Kaltim Green Program and is a plan of action to achieve this vision.
Kaltim Green Program

18
DRAFT
“… we must unleash the drive and creativity of all
members of our society.”

19
DRAFT
1. The context for East Kalimantan’s developmentEast Kalimantan has achieved an impressive record of economic development for its people. East Kalimantan has the second highest GDP per capita of any province in Indonesia and its economy reached a sizeable IDR 103 trillion1 in 2008. Since 2000, the province’s poverty rate has fallen by 10 percent per annum while per capita consumption has risen by 12 percent p.a. This reflects the long-term development path of the province; since the 1970s East Kalimantan has increased the life expectancy of its people from 56 to 71 years, reduced illiteracy from 50 percent to 4 percent, and has increased the number of community health centers from a mere 50 to over 850.
This development has been largely driven by the exploitation of the province’s abundant natural resources. The pumping, cutting, mining, and processing of East Kalimantan’s oil, gas, timber, coal, and other mineral deposits accounted for more than 80 percent of GDP in the early 1980s and two-thirds of GDP in 2008. Oil has been a mainstay of East Kalimantan’s economy since the 1880s when Indonesia became the third country to find and produce oil commercially. The discoveries of large oil and gas deposits in the 1960s and 1970s transformed the province; it has Indonesia’s largest liquefied natural gas (LNG) plant in Bontang and second largest refinery in Balikpapan. Since 1950, East Kalimantan has reduced its forest cover by 35 percent (6.8 million hectares). East Kalimantan has 25 percent of all coal deposits in Indonesia as well as an estimated 60 million tons of unexploited gold deposits.
Economic development remains an imperative for the almost 260,000 people in East Kalimantan still living below the poverty line. While the province has made impressive gains in living standards, nine percent of the population still earns less than IDR 225,000 per month, the provincial poverty level. Decentralization has increased the accountability and pressure on district heads (bupatis) and the governor to extend economic opportunities and increase incomes. Although the province’s working population has actually shrunk since 2000, creating new jobs remains a political imperative as the unemployment level stood at 11 percent in 2008. Incomes, likewise, have much room to rise; the average citizen of East Kalimantan spends just IDR 420,000 per month on housing, food, and basic necessities.
Under a business-as-usual growth scenario, East Kalimantan’s economy will grow only at a moderate 3 percent p.a., as new growth from coal mining, palm oil, and services will be partially offset by the continued decline of the oil and gas sector (EXHIBIT 1). The GDP contribution from oil and gas has decreased by one percent per annum over the last few years, and is expected to continue to fall as production rates decline in the East Kalimantan’s mature fields. As oil and gas currently make up almost 50 percent of the economy, this decline acts as a brake on the overall economy’s growth. Going forward, the provincial economy’s growth will be increasingly influenced by sectors such as coal mining, palm oil, and services.
1 Real GDP in constant 2000 prices. Unless otherwise noted, all GDP !gures in this report are in real (constant 2000) prices and not nominal prices.

20
DRAFT
SOURCE: BPS
Real GDP growth, 1983-2008IDR Trillion, Constant price 2000
35
Services/Others
Manufacturing
Coal & Mining
ForestryPalm oilAgriculture
2008
103
07
99
Construction
95
67
94
64
93
55
92
49
91
50
90
47
89
44
88
43
87
44
86
43
85
43
86
2000
82
99
79
98
76
97
76
96
73
+3% p.a.
Oil & Gas
84
42
1983 06
97
05
94
04
91
03
89
02
88
01
+5% p.a.
East Kalimantan’s economy has been driven by the oil and gas sector, however this is in decline while coal, palm oil, and services are growing fast
East Kalimantan’s economy will shift toward coal, services, and palm oil
SOURCE: Team analysis
0102030405060708090
100110120130140150 Agriculture
202018161412102008
Services/Others
ManufacturingConstruction
Coal & MiningForestry
Palm oil/Estate crops
Oil & Gas
Estimated sectoral contribution to Real GDPunder BAU scenarioIDR Trillion, constant price 2000
CAGR 2008-2020 BAU scenarioPercent
Slows to 3% in line with Indonesian average of 3%Plantation area reaches 1 million ha by 2025Decline slows as HTIsincrease
High historical growth will be maintained as are in line with national trend and sector is under-developed
Coal production will slow to national trend with land and infrastructure constraints
Decline continues to accelerate as fields mature and no major new discoveries assumed
CAGR2000-2008Percent
3
5
-1
6-7
5
-2
8
12
-3
6-7
15
-1
Exhibit 1
Exhibit 2
21
DRAFT
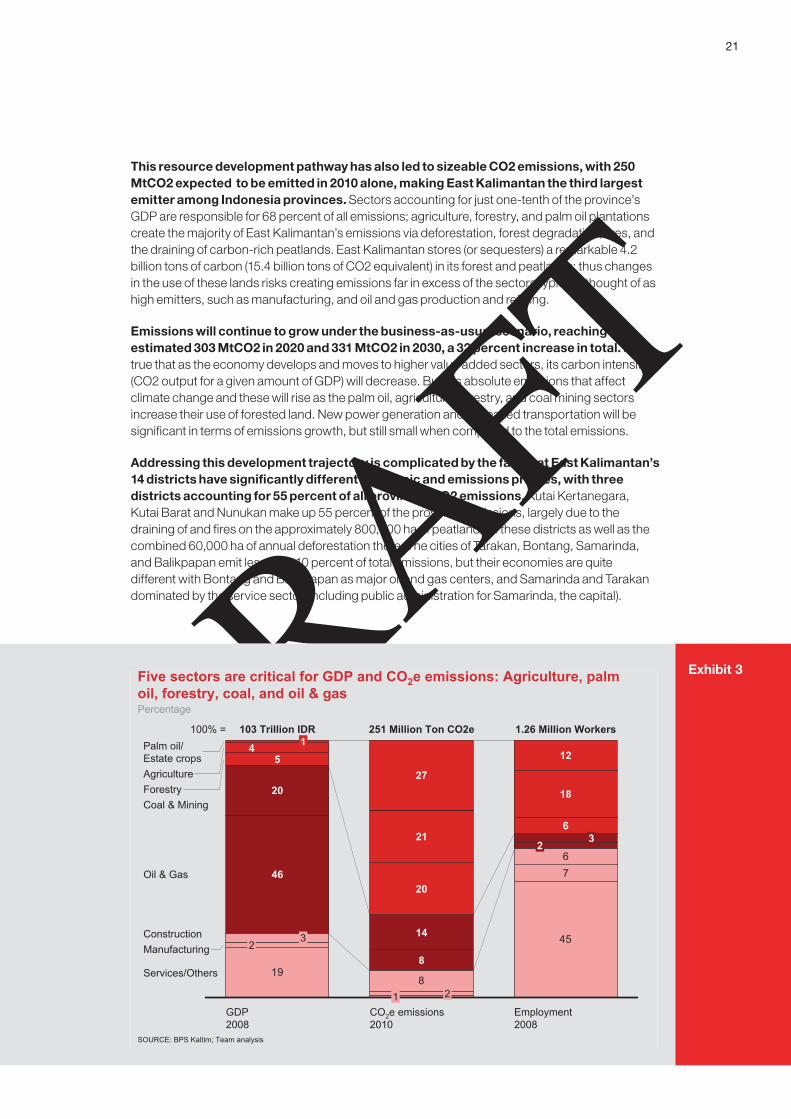
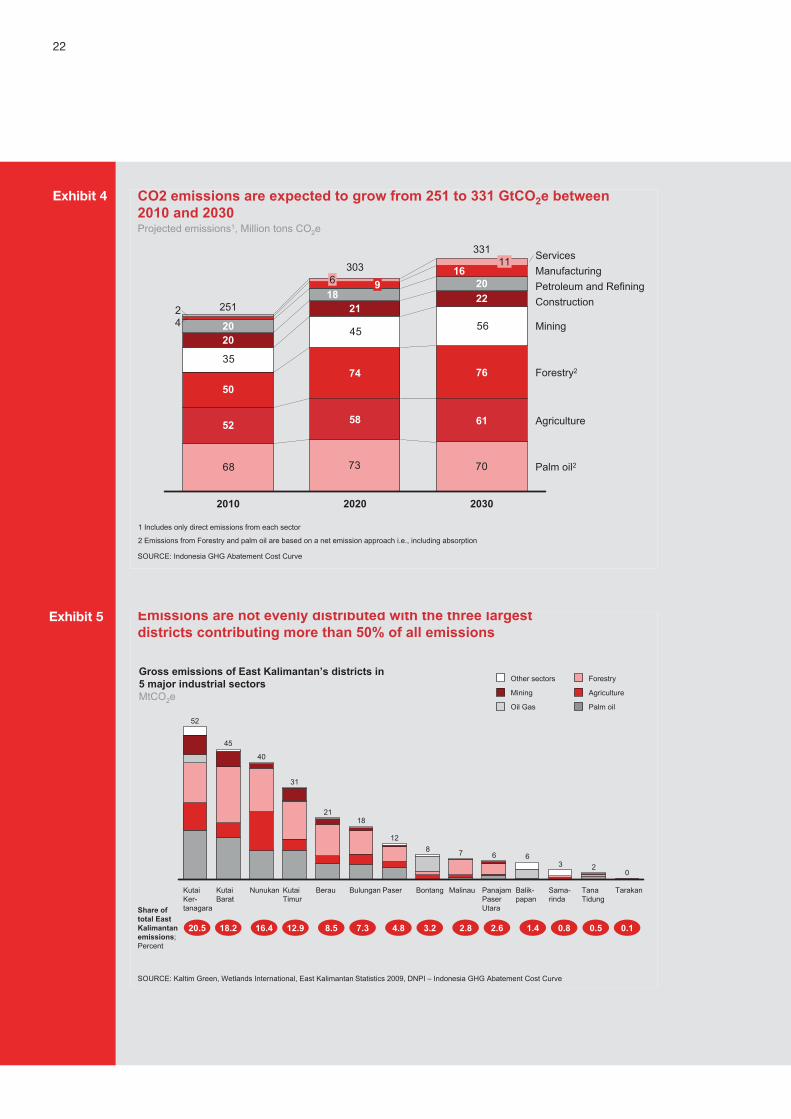
This resource development pathway has also led to sizeable CO2 emissions, with 250 MtCO2 expected to be emitted in 2010 alone, making East Kalimantan the third largest emitter among Indonesia provinces. Sectors accounting for just one-tenth of the province’s GDP are responsible for 68 percent of all emissions; agriculture, forestry, and palm oil plantations create the majority of East Kalimantan’s emissions via deforestation, forest degradation, fires, and the draining of carbon-rich peatlands. East Kalimantan stores (or sequesters) a remarkable 4.2 billion tons of carbon (15.4 billion tons of CO2 equivalent) in its forest and peatlands; thus changes in the use of these lands risks creating emissions far in excess of the sectors typically thought of as high emitters, such as manufacturing, and oil and gas production and refining.
Emissions will continue to grow under the business-as-usual scenario, reaching an estimated 303 MtCO2 in 2020 and 331 MtCO2 in 2030, a 32 percent increase in total. It is true that as the economy develops and moves to higher value added sectors, its carbon intensity (CO2 output for a given amount of GDP) will decrease. But it is absolute emissions that affect climate change and these will rise as the palm oil, agriculture, forestry, and coal mining sectors increase their use of forested land. New power generation and increased transportation will be significant in terms of emissions growth, but still small when compared to the total emissions.
Addressing this development trajectory is complicated by the fact that East Kalimantan’s 14 districts have significantly different economic and emissions profiles, with three districts accounting for 55 percent of all provincial CO2 emissions. Kutai Kertanegara, Kutai Barat and Nunukan make up 55 percent of the provincial emissions, largely due to the draining of and fires on the approximately 800,000 ha of peatlands in these districts as well as the combined 60,000 ha of annual deforestation there. The cities of Tarakan, Bontang, Samarinda, and Balikpapan emit less than 10 percent of total emissions, but their economies are quite different with Bontang and Balikpapan as major oil and gas centers, and Samarinda and Tarakan dominated by the service sector (including public administration for Samarinda, the capital).
Exhibit 3Five sectors are critical for GDP and CO2e emissions: Agriculture, palm oil, forestry, coal, and oil & gas
SOURCE: BPS Kaltim; Team analysis
Percentage
19
45
76
8
CO2e emissions2010
251 Million Ton CO2e
1 2
8
14
20
21
GDP2008
103 Trillion IDR100% =
Services/Others
ManufacturingConstruction
Oil & Gas
Coal & MiningForestryAgriculture
23
46
Employment2008
54
1.26 Million Workers
23
20
6
18
12
27
1Palm oil/Estate crops
22
DRAFT
Exhibit 4 CO2 emissions are expected to grow from 251 to 331 GtCO2e between 2010 and 2030Projected emissions1, Million tons CO2e
73 7068
5645
35
42
1611
2020
303
58 Agriculture
2118
96
2010
251
52
50
2020
Palm oil2
Forestry2
Mining
ConstructionPetroleum and RefiningManufacturingServices
74
2030
331
61
76
2220
SOURCE: Indonesia GHG Abatement Cost Curve
1 Includes only direct emissions from each sector
2 Emissions from Forestry and palm oil are based on a net emission approach i.e., including absorption
Emissions are not evenly distributed with the three largest districts contributing more than 50% of all emissions
Tarakan
0
Sama-rinda
3
Balik-papan
6
PanajamPaserUtara
6
Malinau
7
Bontang
8
Paser
31
Nunukan
40
KutaiBarat
45
KutaiKer-tanagara
52
12
Bulungan
18
Berau
21
KutaiTimur
TanaTidung
2
SOURCE: Kaltim Green, Wetlands International, East Kalimantan Statistics 2009, DNPI – Indonesia GHG Abatement Cost Curve
Oil Gas
Mining
Other sectors Forestry
Palm oil
Agriculture
Share of total East Kalimantan emissions; Percent
20.5 18.2 16.4 12.9 8.5 7.3 4.8 3.2 2.8 2.6 1.4 0.8 0.5 0.1
Gross emissions of East Kalimantan’s districts in 5 major industrial sectorsMtCO2e
Exhibit 5

23
DRAFT
Both Berau and Malinau are large, still heavily forested districts. But Malinau is part of the Heart of Borneo area with protected forests, and thus has one third of the emissions of Berau despite being 30 percent larger in size. Likewise, forestry and non-timber forest products make up 40 percent of Malinau’s GDP, whereas the largest sector in Berau is coal and mining at 40 percent of its GDP. Thus, a one-size-fits-all policy for low-carbon growth for the province would be impractical, given the different economic and emission realities facing East Kalimantan’s districts.
2. East Kalimantan’s environmentally sustainable development strategyEast Kalimantan is committed to moving onto a climate-compatible development pathway. In a developing economy like East Kalimantan, the people will not choose to reduce CO2 emissions if to do so means retarding economic growth. This strategy does not require that choice. A core principle of this development strategy is that economic development and CO2 mitigation can be mutually reinforcing. East Kalimantan’s low carbon growth strategy reconciles growth with climate change mitigation by focusing on: 1) reducing the carbon footprint of its current economic sectors, 2) moving to higher value-added activities and new low-carbon activities, and 3) acting to make the economy and infrastructure resilient to climate change.
Achieving truly climate-compatible development will require substantial changes to East Kalimantan’s economic structure, land-use planning, and government policy. It will also require a new mindset focused on long-term, environmentally-sustainable development taking hold within the government, the business community, and the non-profit sector. Finally, these changes will require additional financing. As above, a principal goal of the low carbon
Exhibit 6Environmentally sustainable development is a holistic approach where economic growth, CO2 mitigation, and adaptation go hand in hand
Framework for environmentally sustainable development
CO2 mitigation! Estimate the size of current and future emissions! Assess the technical abatement potential and
feasibility and implementation cost of individual mitigation initiatives
Economic development! Analyze existing competitive strengths and
weaknesses ! Explore potential new sources of growth
(providing less carbon emissions)
Adaptation! Analyze existing and future climate threats! Explore adaptation measures and estimate total
cost of realization
Institutional enablers! Develop strategy for critical enablers (e.g.,
monitoring and evaluation, spatial planning, community engagement)
! Estimate the total costs of realizing these opportunities
Key elements
CO2Mitigation
AdaptationEconomic development
Insti-tutionalenablers
Environmentally sustainable development
SOURCE: DNPI – Low carbon growth team; team analysis

24
DRAFT
growth strategy is to ensure that the people of East Kalimantan do not achieve reduced emissions at the cost of reduced growth. Additional financing will needed to underwrite the considerable investments associated with the transition to a climate-compatible development path. Some of that financing will likely be provided by the domestic government, some by international donor agencies, and some directly by the private sector as companies see the potential to generate positive returns.
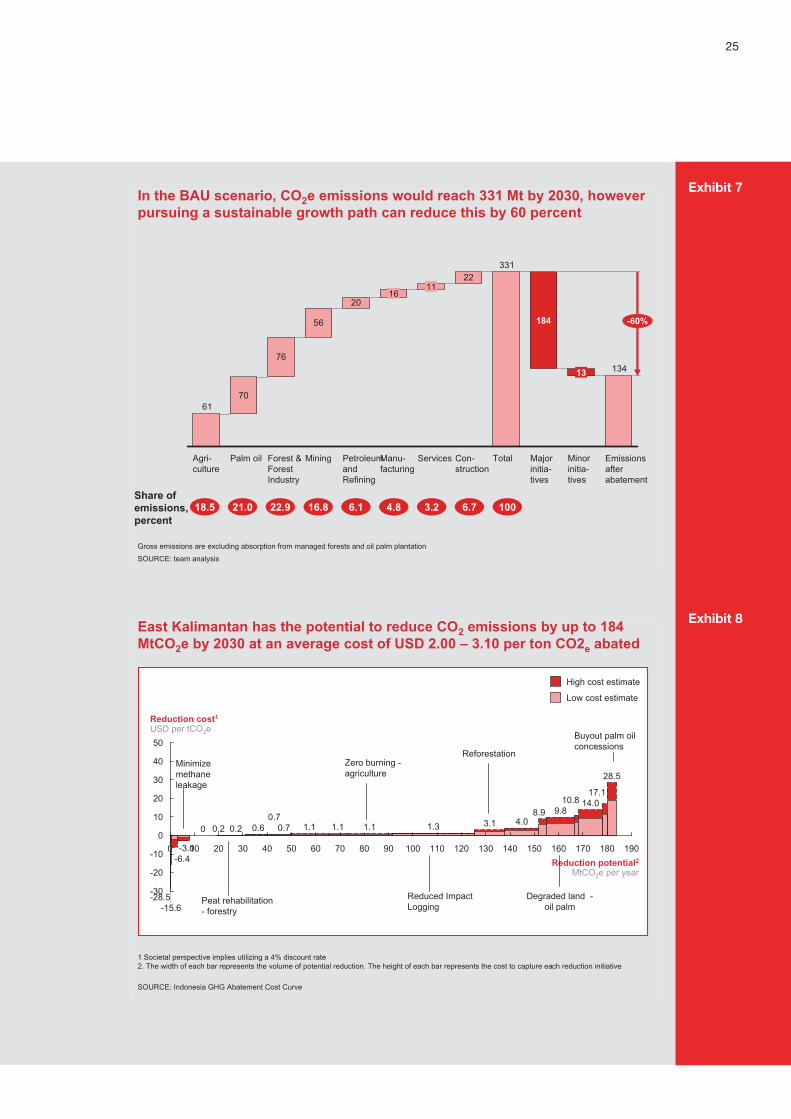
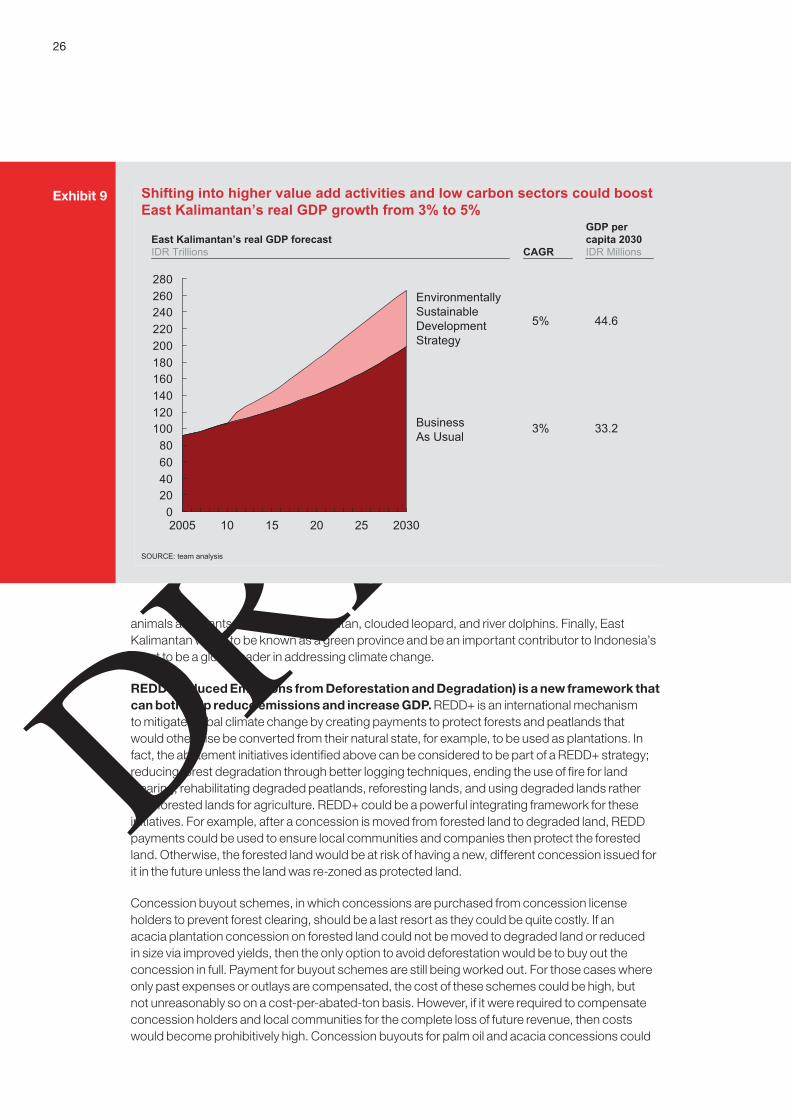
East Kalimantan can reduce the carbon footprint of its current economy by 60 percent from the business-as-usual trajectory by 2030. This reduction comes mainly from the five priority sectors of palm oil, forestry, agriculture, coal mining, and oil and gas. A total of 22 initiatives in these sectors could reduce the province’s emissions by 184 MtCO2 (an additional reduction of 13.2 MtCO2e could be achieved by activities focusing on other sectors, for example construction) at an average cost of USD 2.0 to 3.1 per tCO2e abated. This represents a reduction of 60 percent from the level of emissions expected in the business-as-usual scenario in 2030.
Five abatement initiatives account for 75 percent of all the CO2 reduction potential in East Kalimantan. All five focus on increasing land-use efficiency. The maximum reduction from these initiatives would be 135 MtCO2 by 2030, although a number of challenges would need to be overcome to reach the full reduction. All of the abatement initiatives described in Table 1 are discussed in more detail in Chapter 3, Sector Strategies.
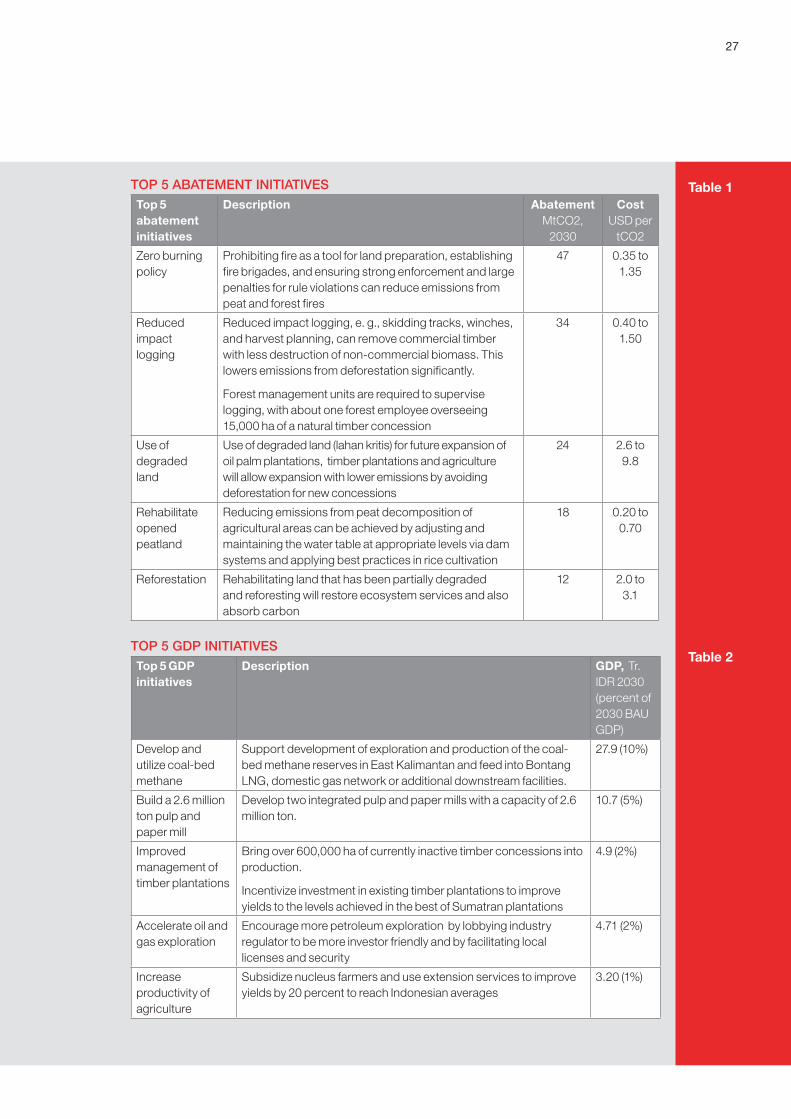
East Kalimantan can increase its GDP growth from a business-as-usual rate of 3 percent p.a. to 5 percent p.a. without increasing emissions by moving to higher value-added activities and promoting less carbon-intensive sectors. East Kalimantan has a relatively diverse economy, especially when compared to provinces outside the heavily-populated Sumatra-Java-Bali chain. Yet, with a population of only 2 million, East Kalimantan has only a small domestic market. Much of its abundant resources are exported in raw form to Java, Sumatra and overseas where they are turned into higher-value added goods (e.g., raw logs to Sumatran mills and Javanese furniture manufacturers). East Kalimantan has an opportunity to capture more downstream processing and thus increase the GDP contribution that the province gains from its natural resources.
The top five economic initiatives could increase GDP by IDR 50 trillion in 2030, equivalent to IDR 9 million per person (Table 2). These initiatives include developing a new resource (coal-bed methane), improving productivity of underutilized sectors (timber plantations and agriculture in particular), and developing downstream activities such as a pulp and paper mill and CPO refinery. Each initiative is described in more detail in the relevant sector strategy.
This increased growth will require safeguards to ensure that it does not encourage other sources of emissions. Increasing the productivity of HTI and palm oil concessions, for example, could make them more attractive for investors and thus encourage the development of new concessions in forested lands if measures, such as REDD, are not in place to prevent this. Similarly, developing additional pulp and paper processing capacity without first ensuring a sustainable supply of acacia could simply accelerate deforestation by increasing demand for current unsustainable logged timber. Financial safeguards, proper sequencing, and thoughtful spatial planning will all be needed to ensure the shift to environmentally sustainable GDP growth.
While GDP is an important and visible indicator of development, it is not the only metric that is important to the people of East Kalimantan. Our official slogan of “Develop East Kalimantan for all” recognizes that too much of the province’s natural resource extraction has benefited a few companies and individuals as opposed to creating jobs and income for the majority. Creating jobs, improving rural incomes, and reducing inequality are also vital parts of our sustainable development strategy. Beyond reducing CO2e emissions, we have important environmental goals to reduce pollution, maintain natural resources, protect fisheries, protect water quality and retain watersheds to reducing flooding. East Kalimantan is home to important biodiversity which we want to protect, represented most notably by a number of rare and beautiful
25
DRAFT
Exhibit 7
Exhibit 8
In the BAU scenario, CO2e emissions would reach 331 Mt by 2030, however pursuing a sustainable growth path can reduce this by 60 percent
SOURCE: team analysis
Gross emissions are excluding absorption from managed forests and oil palm plantation
70
76
56
20
22
134
331
61
Manu-facturing
Agri-culture
Petroleum and Refining
Forest & Forest Industry
Mining
16
Palm oil Minor initia-tives
Total
11
13
Emissions after abatement
Major initia-tives
Services Con-struction
184 -60%
Share of emissions, percent
18.5 21.0 22.9 16.8 3.26.1 4.8 6.7 100
14013012011010010 60
10
8070Reduction potential2
MtCO2e per year
0
40
30
90
1.1
Reduction cost1
USD per tCO2e
-30
-20
-10
20
1.1 1.3
-28.5-15.6
3.1
50
-6.4-3.0
0.2 0.24.0
8.9
150
9.810.8 14.0
0.6
17.1
28.5
0.70.7 1.10
170 180 1900 16050403020
East Kalimantan has the potential to reduce CO2 emissions by up to 184 MtCO2e by 2030 at an average cost of USD 2.00 – 3.10 per ton CO2e abated
SOURCE: Indonesia GHG Abatement Cost Curve
1 Societal perspective implies utilizing a 4% discount rate2. The width of each bar represents the volume of potential reduction. The height of each bar represents the cost to capture each reduction initiative
Buyout palm oil concessions
Degraded land -oil palm
Reforestation
Reduced Impact Logging
Zero burning -agriculture
Peat rehabilitation - forestry
Minimize methane leakage
High cost estimate
Low cost estimate
26
DRAFT
Exhibit 9 Shifting into higher value add activities and low carbon sectors could boost East Kalimantan’s real GDP growth from 3% to 5%
SOURCE: team analysis
020406080
100120140160180200220240260280
Business As Usual
Environmentally Sustainable DevelopmentStrategy
2030252015102005
East Kalimantan’s real GDP forecast IDR Trillions CAGR
GDP per capita 2030IDR Millions
5%
3%
44.6
33.2
animals and plants, such as the orangutan, clouded leopard, and river dolphins. Finally, East Kalimantan wants to be known as a green province and be an important contributor to Indonesia’s effort to be a global leader in addressing climate change.
REDD (Reduced Emissions from Deforestation and Degradation) is a new framework that can both help reduce emissions and increase GDP. REDD+ is an international mechanism to mitigate global climate change by creating payments to protect forests and peatlands that would otherwise be converted from their natural state, for example, to be used as plantations. In fact, the abatement initiatives identified above can be considered to be part of a REDD+ strategy; reducing forest degradation through better logging techniques, ending the use of fire for land clearing, rehabilitating degraded peatlands, reforesting lands, and using degraded lands rather than forested lands for agriculture. REDD+ could be a powerful integrating framework for these initiatives. For example, after a concession is moved from forested land to degraded land, REDD payments could be used to ensure local communities and companies then protect the forested land. Otherwise, the forested land would be at risk of having a new, different concession issued for it in the future unless the land was re-zoned as protected land.
Concession buyout schemes, in which concessions are purchased from concession license holders to prevent forest clearing, should be a last resort as they could be quite costly. If an acacia plantation concession on forested land could not be moved to degraded land or reduced in size via improved yields, then the only option to avoid deforestation would be to buy out the concession in full. Payment for buyout schemes are still being worked out. For those cases where only past expenses or outlays are compensated, the cost of these schemes could be high, but not unreasonably so on a cost-per-abated-ton basis. However, if it were required to compensate concession holders and local communities for the complete loss of future revenue, then costs would become prohibitively high. Concession buyouts for palm oil and acacia concessions could
27
DRAFT
TOP 5 ABATEMENT INITIATIVESTop 5 abatement initiatives
Description Abatement MtCO2,
2030
Cost USD per
tCO2
Zero burning policy
Prohibiting fire as a tool for land preparation, establishing fire brigades, and ensuring strong enforcement and large penalties for rule violations can reduce emissions from peat and forest fires
47 0.35 to 1.35
Reduced impact logging
Reduced impact logging, e. g., skidding tracks, winches, and harvest planning, can remove commercial timber with less destruction of non-commercial biomass. This lowers emissions from deforestation significantly.
Forest management units are required to supervise logging, with about one forest employee overseeing 15,000 ha of a natural timber concession
34 0.40 to 1.50
Use of degraded land
Use of degraded land (lahan kritis) for future expansion of oil palm plantations, timber plantations and agriculture will allow expansion with lower emissions by avoiding deforestation for new concessions
24 2.6 to 9.8
Rehabilitate opened peatland
Reducing emissions from peat decomposition of agricultural areas can be achieved by adjusting and maintaining the water table at appropriate levels via dam systems and applying best practices in rice cultivation
18 0.20 to 0.70
Reforestation Rehabilitating land that has been partially degraded and reforesting will restore ecosystem services and also absorb carbon
12 2.0 to 3.1
TOP 5 GDP INITIATIVES Top 5 GDP initiatives
Description GDP, Tr. IDR 2030 (percent of 2030 BAU GDP)
Develop and utilize coal-bed methane
Support development of exploration and production of the coal-bed methane reserves in East Kalimantan and feed into Bontang LNG, domestic gas network or additional downstream facilities.
27.9 (10%)
Build a 2.6 million ton pulp and paper mill
Develop two integrated pulp and paper mills with a capacity of 2.6 million ton.
10.7 (5%)
Improved management of timber plantations
Bring over 600,000 ha of currently inactive timber concessions into production.
Incentivize investment in existing timber plantations to improve yields to the levels achieved in the best of Sumatran plantations
4.9 (2%)
Accelerate oil and gas exploration
Encourage more petroleum exploration by lobbying industry regulator to be more investor friendly and by facilitating local licenses and security
4.71 (2%)
Increase productivity of agriculture
Subsidize nucleus farmers and use extension services to improve yields by 20 percent to reach Indonesian averages
3.20 (1%)
Table 1
Table 2
28
DRAFT
cost as much as USD 26 per t CO2e and USD 12 per t CO2e respectively, using a full opportunity cost methodology.
REDD+ is still in development, and the laws governing and allowing full REDD+ projects are still being drafted. Yet, donor countries attending the UNFCCC summit in Copenhagen in December 2009 committed USD 3.5 billion to jumpstart REDD+ schemes, which underlines the importance of this abatement option. REDD+ could potentially provide significant funding for avoided deforestation projects. However, funding is only likely to materialize at scale when more developed countries establish emissions trading systems (also known as cap-and-trade systems) and the private sector becomes the principal source of REDD financing.
East Kalimantan’s environmentally sustainable development strategy is connected into Indonesia’s climate change strategy at a national level. President’s Yudhoyono’s pledge to reduce Indonesia’s total emissions by 26 percent against a business-as-usual trajectory by 2020 will have profound implications for businesses and economic planners across the country, and nowhere more so than in the high-emitting provinces such as East Kalimantan. All provinces and districts will be required to submit plans for capturing reduction opportunities. The DNPI is trying to ensure that a common approach to environmentally sustainable development strategies is being followed in different provinces, so that the data and recommendations contained within them can be more easily incorporated into an overall national Low Carbon Growth Plan.
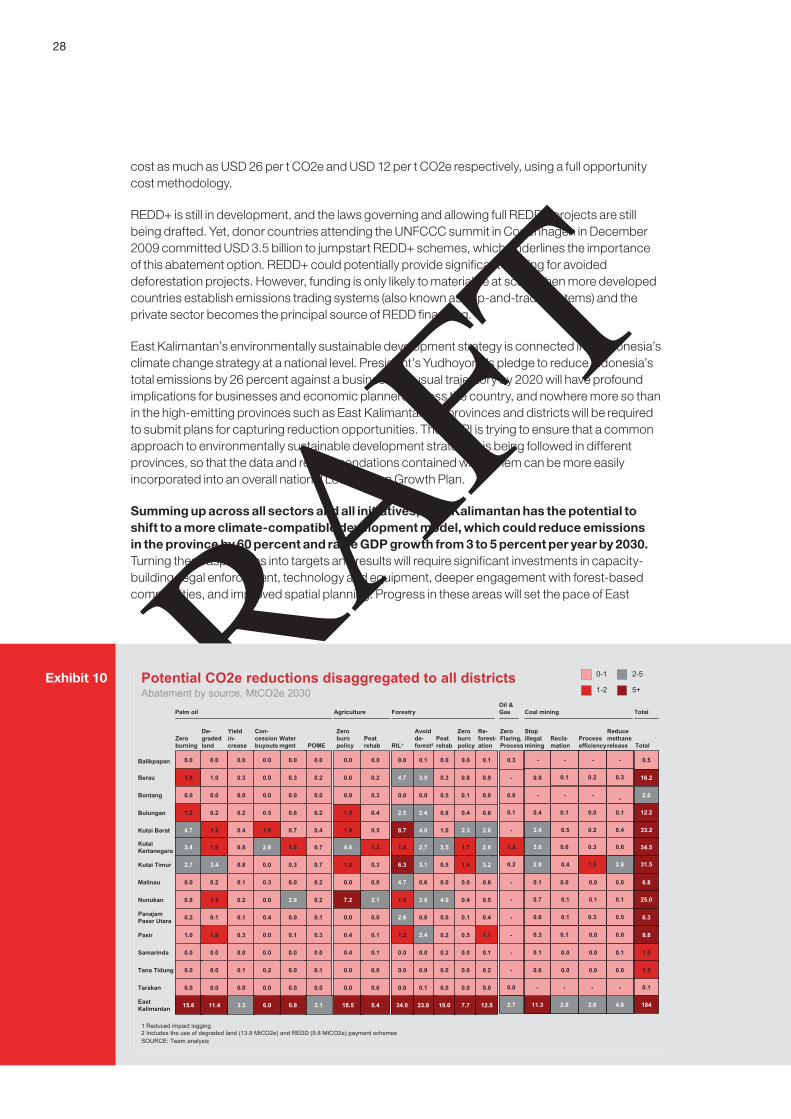
Summing up across all sectors and all initiatives, East Kalimantan has the potential to shift to a more climate-compatible development model, which could reduce emissions in the province by 60 percent and raise GDP growth from 3 to 5 percent per year by 2030. Turning these aspirations into targets and results will require significant investments in capacity-building, legal enforcement, technology and equipment, deeper engagement with forest-based communities, and improved spatial planning. Progress in these areas will set the pace of East
Exhibit 10 Potential CO2e reductions disaggregated to all districts
SOURCE: Team analysis
Tarakan
Tana Tidung
Samarinda
Pasir
PanajamPaser Utara
Nunukan
Malinau
Kutai Timur
KutaiKertanegara
Kutai Barat
Bulungan
Bontang
Berau
Balikpapan
2-5
5+
0-1
1-2
East Kalimantan
Abatement by source, MtCO2e 2030
1 Reduced impact logging2 Includes the use of degraded land (13.9 MtCO2e) and REDD (9.8 MtCO2e) payment schemes
Palm oil
Zero burning
De-graded land
Water mgmt POME
Yield in-crease
Con-cession buyouts
0.00.0 0.0 0.00.0 0.0
0.21.5 1.0 0.30.3 0.0
0.00.0 0.0 0.00.0 0.0
0.21.2 0.2 0.60.2 0.5
0.44.7 1.2 0.70.4 1.9
0.73.4 1.9 1.80.8 2.6
0.72.7 3.4 0.30.8 0.0
0.20.0 0.2 0.00.1 0.3
0.20.8 1.5 2.80.2 0.0
0.10.2 0.1 0.00.1 0.4
0.31.0 1.8 0.10.3 0.0
0.00.0 0.0 0.00.0 0.0
0.10.0 0.0 0.00.1 0.2
0.00.0 0.0 0.00.0 0.0
3.115.6 11.4 6.83.3 6.0
Oil & Gas
ZeroFlaring, Process
-
0.8
0.1
-
1.4
0.2
-
-
-
-
-
-
0.0
2.7
0.3
Agriculture
Zero burn policy
Peat rehab
0.0 0.0
0.6 0.2
1.5 0.4
1.9
4.6 1.3
1.0 0.3
0.0 0.0
7.2 2.1
0.0 0.0
0.4 0.1
0.4 0.1
0.0 0.0
0.0 0.0
18.5 5.4
0.9 0.3
0.5
Forestry
Peat rehab
Zero burn policy
Re-forest-ationRIL1
Avoid de-forest2
0.1 0.0 0.0 0.1
4.0 1.08.7 2.3 2.0
3.9
2.4
2.7
3.1
0.6
2.8
0.8
2.4
0.0
0.9
0.1
0.3
0.8
2.5
0.5
0.0
4.0
0.0
0.2
0.2
0.0
0.0
0.8
0.4
1.7
1.4
0.0
0.4
0.1
0.5
0.0
0.0
0.0
0.9
0.6
2.8
3.2
0.6
0.5
0.4
1.1
0.1
0.2
0.0
0.0
4.7
0.0 0.5 0.1 0.0
2.5
1.8
6.3
4.7
1.5
2.6
1.2
0.0
0.0
0.0
0.0
23.8 10.0 7.7 12.534.0
Recla-mation
Reduce methane release
Stop illegal mining
0.05 0.03 0.08
0.09 0.05 0.16
---
0.26 0.14 0.46
0.33 0.18 0.58
0.19 0.10 0.34
0.01 0.00 0.01
0.08 0.04 0.13
0.04 0.02 0.07
0.03 0.02 0.05
0.01 0.00 0.01
0.00 0.00 0.00
---
2.90 1.56 2.01
---
0.34
0.67
-
1.90
2.41
1.39
0.04
0.56
0.30
0.21
0.06
0.02
-
8.11
-
Coal mining
Process efficiency
0.10.00.1
0.30.20.1
---
0.40.20.5
0.60.30.6
2.8 1.50.4
0.0 0.0 0.0
0.10.1 0.1
0.50.30.1
0.0 0.0 0.1
0.10.0 0.0
0.00.0 0.0
---
4.8 2.62.0
---
0.4
0.9
-
2.4
3.0
2.9
0.1
0.7
0.6
0.3
0.1
0.0
-
11.3
-
Total
Total
16.2
2.6
12.2
33.2
34.5
31.5
6.8
25.0
6.3
9.8
1.0
1.5
0.1
184
0.5

29
DRAFT
Kalimantan’s shift to a climate-compatible development model. Each district will contribute differently to these goals according to their emissions profiles and potential. Individual district strategies are detailed in Chapter 4.
3. Sector strategies East Kalimantan has significant opportunities to reduce its current emissions and increase its GDP. For East Kalimantan, it is important to look at sustainable development strategies for each major part of the economy and not just for the whole. This is partly because important stakeholders in the province are grouped into different economic sectors (e.g., palm oil companies versus coal mining companies) and partly because our government administration is organized by sector, such as estate crops and forestry, as opposed to physical drivers of emissions such as deforestation. Once each major economic sector has a sustainable development strategy we can engage stakeholders on implementation. We hope that by having initiatives that both reduce the carbon footprint from current activities and also increase GDP through higher value-add activities, the companies and people working in that sector will support sustainable development as they will directly experience the benefits.
This chapter reviews each of the sectors in order of their current business-as-usual situation, their abatement opportunities, pilot projects, potential GDP improvements, and required policies (or changes to policies) to enable the changes in each sector.
Palm oil
Forestry
Agriculture
Coal
Oil and gas
PALM OIL SECTOR
This document analyzes palm oil separately from all other agricultural crops, as the palm oil sector 2 is critically important for East Kalimantan’s economic growth and is also central to its CO2e emissions profile and abatement opportunities.. Indonesia is the world’s largest producer of palm oil, yet East Kalimantan has only recently begun its development of the sector. While palm oil accounts for less than 1 percent of GDP currently, palm oil concessions are expanding rapidly. Palm oil is important beyond its GDP contribution as it is one of the few highly profitable activities in rural areas, thus bringing needed jobs and income to rural people and offsetting rural-urban inequality.
While the oil palm plant is highly efficient compared with other oil crops such as rapeseed, and the actual process of planting, harvesting, and milling palm oil produces relatively few emissions, the sector’s expansion into forest and peatlands is creating substantial emissions and has made the palm oil sector the largest emitter in the province. We have identified initiatives to reduce more than 60 percent of palm oil’s business-as-usual emissions, through a more efficient use of our land base. Instead of area expansion into forested areas, economic development can be achieved by agricultural intensification, better use of degraded lands, and by moving down the value chain into palm oil refining. However, these changes require supporting policies, training, and financial resources.
2 Palm oil describes the overall industry sector, while oil palm is used to describe upstream operations within the plantations, such as cultivation of Elaeis guineensis
30
DRAFT
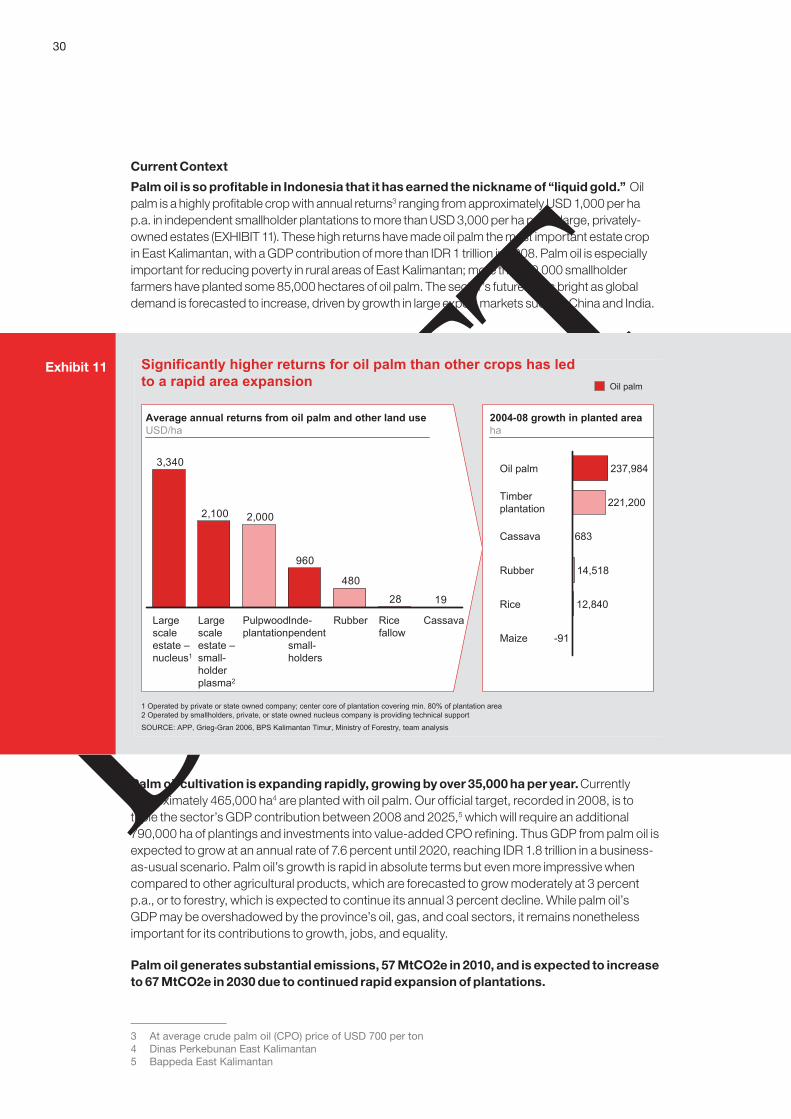
Current Context
Palm oil is so profitable in Indonesia that it has earned the nickname of “liquid gold.” Oil palm is a highly profitable crop with annual returns3 ranging from approximately USD 1,000 per ha p.a. in independent smallholder plantations to more than USD 3,000 per ha p.a. in large, privately-owned estates (EXHIBIT 11). These high returns have made oil palm the most important estate crop in East Kalimantan, with a GDP contribution of more than IDR 1 trillion in 2008. Palm oil is especially important for reducing poverty in rural areas of East Kalimantan; more than 40,000 smallholder farmers have planted some 85,000 hectares of oil palm. The sector’s future looks bright as global demand is forecasted to increase, driven by growth in large export markets such as China and India.
Palm oil cultivation is expanding rapidly, growing by over 35,000 ha per year. Currently approximately 465,000 ha4 are planted with oil palm. Our official target, recorded in 2008, is to triple the sector’s GDP contribution between 2008 and 2025,5 which will require an additional 790,000 ha of plantings and investments into value-added CPO refining. Thus GDP from palm oil is expected to grow at an annual rate of 7.6 percent until 2020, reaching IDR 1.8 trillion in a business-as-usual scenario. Palm oil’s growth is rapid in absolute terms but even more impressive when compared to other agricultural products, which are forecasted to grow moderately at 3 percent p.a., or to forestry, which is expected to continue its annual 3 percent decline. While palm oil’s GDP may be overshadowed by the province’s oil, gas, and coal sectors, it remains nonetheless important for its contributions to growth, jobs, and equality.
Palm oil generates substantial emissions, 57 MtCO2e in 2010, and is expected to increase to 67 MtCO2e in 2030 due to continued rapid expansion of plantations.
3 At average crude palm oil (CPO) price of USD 700 per ton4 Dinas Perkebunan East Kalimantan5 Bappeda East Kalimantan
Exhibit 11 Significantly higher returns for oil palm than other crops has led to a rapid area expansion
SOURCE: APP, Grieg-Gran 2006, BPS Kalimantan Timur, Ministry of Forestry, team analysis
1928
480
960
2,0002,100
3,340
CassavaRice fallow
RubberInde-pendent small-holders
Pulpwood plantation
Large scale estate –small-holder plasma2
Large scale estate –nucleus1
Average annual returns from oil palm and other land useUSD/ha
Oil palm
1 Operated by private or state owned company; center core of plantation covering min. 80% of plantation area2 Operated by smallholders, private, or state owned nucleus company is providing technical support
12,840Rice
-91Maize
Rubber 14,518
Cassava 683
Timber plantation 221,200
Oil palm 237,984
2004-08 growth in planted areaha
31
DRAFT
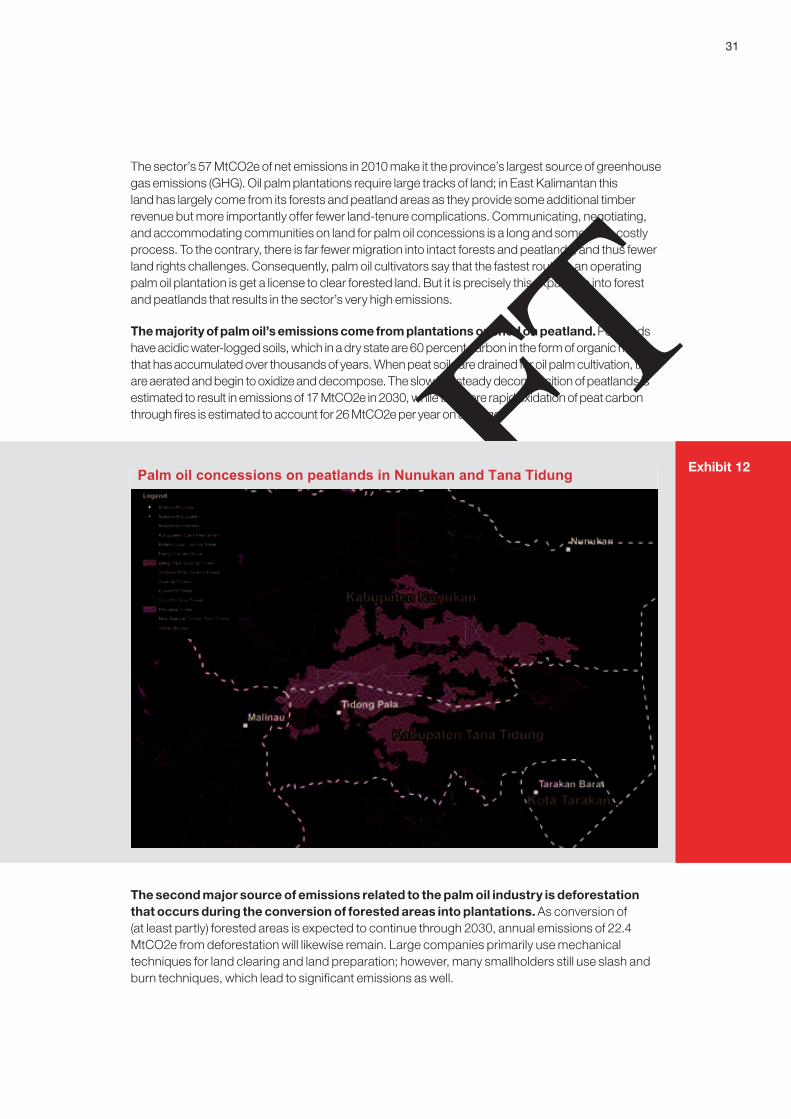
The sector’s 57 MtCO2e of net emissions in 2010 make it the province’s largest source of greenhouse gas emissions (GHG). Oil palm plantations require large tracks of land; in East Kalimantan this land has largely come from its forests and peatland areas as they provide some additional timber revenue but more importantly offer fewer land-tenure complications. Communicating, negotiating, and accommodating communities on land for palm oil concessions is a long and sometimes costly process. To the contrary, there is far fewer migration into intact forests and peatlands, and thus fewer land rights challenges. Consequently, palm oil cultivators say that the fastest route to an operating palm oil plantation is get a license to clear forested land. But it is precisely this expansion into forest and peatlands that results in the sector’s very high emissions.
The majority of palm oil’s emissions come from plantations opened on peatland. Peatlands have acidic water-logged soils, which in a dry state are 60 percent carbon in the form of organic matter that has accumulated over thousands of years. When peat soils are drained for oil palm cultivation, they are aerated and begin to oxidize and decompose. The slow but steady decomposition of peatlands is estimated to result in emissions of 17 MtCO2e in 2030, while the more rapid oxidation of peat carbon through fires is estimated to account for 26 MtCO2e per year on average.
The second major source of emissions related to the palm oil industry is deforestation that occurs during the conversion of forested areas into plantations. As conversion of (at least partly) forested areas is expected to continue through 2030, annual emissions of 22.4 MtCO2e from deforestation will likewise remain. Large companies primarily use mechanical techniques for land clearing and land preparation; however, many smallholders still use slash and burn techniques, which lead to significant emissions as well.
Exhibit 12Palm oil concessions on peatlands in Nunukan and Tana Tidung

32
DRAFT
Exhibit 13 Palm oil concessions expanding on forest lands in Bulungan and Berau
GHG emissions from the oil palm sector are expected to increase in a business-as-usual scenario
SOURCE: BPS Kaltim; WWF Indonesia, Dinas Kehutanan Kaltim, Departemen Kehutanan Indonesia, Dinas Perkebunan Kaltim, Team analysis
22 22 22
10
0
+1% p.a.
62
2020
1
17
3
2624
-2 -4 -3
67
2030
16
2 1
2010
57
22
131 0
Current and future GHG emissions from the oil palm sectorMtCO2e
Deforestation
Fire
Peat decomposition
Process
Others
Absorption
! Largest drivers of emissions are deforestation and fire
! Change of emissions is driven by increasing areas cleared by smallholders with fire and larger areas of planted peatland
Exhibit 14
33
DRAFT
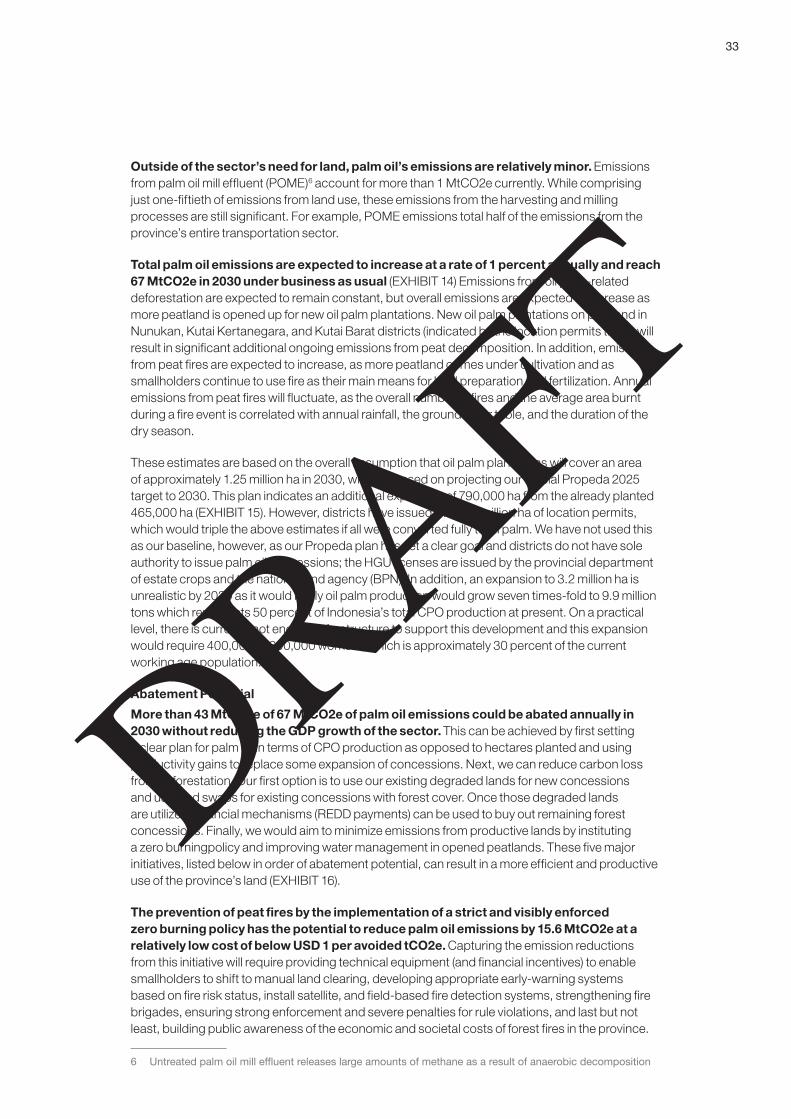
Outside of the sector’s need for land, palm oil’s emissions are relatively minor. Emissions from palm oil mill effluent (POME)6 account for more than 1 MtCO2e currently. While comprising just one-fiftieth of emissions from land use, these emissions from the harvesting and milling processes are still significant. For example, POME emissions total half of the emissions from the province’s entire transportation sector.
Total palm oil emissions are expected to increase at a rate of 1 percent annually and reach 67 MtCO2e in 2030 under business as usual (EXHIBIT 14) Emissions from oil palm-related deforestation are expected to remain constant, but overall emissions are expected to increase as more peatland is opened up for new oil palm plantations. New oil palm plantations on peatland in Nunukan, Kutai Kertanegara, and Kutai Barat districts (indicated by the location permits there) will result in significant additional ongoing emissions from peat decomposition. In addition, emissions from peat fires are expected to increase, as more peatland comes under cultivation and as smallholders continue to use fire as their main means for land preparation and fertilization. Annual emissions from peat fires will fluctuate, as the overall number of fires and the average area burnt during a fire event is correlated with annual rainfall, the groundwater table, and the duration of the dry season.
These estimates are based on the overall assumption that oil palm plantations will cover an area of approximately 1.25 million ha in 2030, which is based on projecting our official Propeda 2025 target to 2030. This plan indicates an additional expansion of 790,000 ha from the already planted 465,000 ha (EXHIBIT 15). However, districts have issued over 3.2 million ha of location permits, which would triple the above estimates if all were converted fully to oil palm. We have not used this as our baseline, however, as our Propeda plan has set a clear goal and districts do not have sole authority to issue palm oil concessions; the HGU licenses are issued by the provincial department of estate crops and the national land agency (BPN). In addition, an expansion to 3.2 million ha is unrealistic by 2030 as it would imply oil palm production would grow seven times-fold to 9.9 million tons which represents 50 percent of Indonesia’s total CPO production at present. On a practical level, there is currently not enough infrastructure to support this development and this expansion would require 400,000 to 600,000 workers, which is approximately 30 percent of the current working age population.
Abatement Potential
More than 43 MtCO2e of 67 MtCO2e of palm oil emissions could be abated annually in 2030 without reducing the GDP growth of the sector. This can be achieved by first setting a clear plan for palm oil in terms of CPO production as opposed to hectares planted and using productivity gains to replace some expansion of concessions. Next, we can reduce carbon loss from deforestation. Our first option is to use our existing degraded lands for new concessions and use land swaps for existing concessions with forest cover. Once those degraded lands are utilized, financial mechanisms (REDD payments) can be used to buy out remaining forest concessions. Finally, we would aim to minimize emissions from productive lands by instituting a zero burningpolicy and improving water management in opened peatlands. These five major initiatives, listed below in order of abatement potential, can result in a more efficient and productive use of the province’s land (EXHIBIT 16).
The prevention of peat fires by the implementation of a strict and visibly enforced zero burning policy has the potential to reduce palm oil emissions by 15.6 MtCO2e at a relatively low cost of below USD 1 per avoided tCO2e. Capturing the emission reductions from this initiative will require providing technical equipment (and financial incentives) to enable smallholders to shift to manual land clearing, developing appropriate early-warning systems based on fire risk status, install satellite, and field-based fire detection systems, strengthening fire brigades, ensuring strong enforcement and severe penalties for rule violations, and last but not least, building public awareness of the economic and societal costs of forest fires in the province.
6 Untreated palm oil mill ef"uent releases large amounts of methane as a result of anaerobic decomposition

34
DRAFT
Oil palm concessions are expanding into natural forest areas

35
DRAFT
Exhibit 15
Exhibit 16
The greatest expansion is expected to happen in the 3 Kutai districts and Pasir
SOURCE: Dinas Perkebunan Kaltim, Expert interviews, team analysis
Current and future area of oil palm in East Kalimantan under a business-as-usual scenarioha
Kutai Timur
Kutai KertanagaraKutai BaratPasirBerauNunukanBulunganPanajam Paser UtaraTana TidungMalinau
BAU oil palm area 2030
1,254,595
Additional expansion1
400,000
HGU - approved
390,406
HGU1 - planted
464,189
1 Based on share of current plantation area, approved expansion and already issued location permits
Emission reduction activities in the oil palm sector should be focused around 5 major initiatives
Description Abatement1
SOURCE: Team analysis
1 Maximum technical annual abatement in 20302 Reduced emissions through avoided deforestation, assuming adequate funding from voluntary carbon markets or international bi or multilateral funding
! Introduce a REDD payment scheme to compensate concession holders for forgone revenues for not starting an economic activity
! Apply REDD when the use of degraded land is no alternative! For the biggest effect on emission abatement, REDD activities
should focus on peatland or other areas with high carbon value
3.2 Mt CO2e
! Implement water management within active oil palm concessions! Protect remaining deep peatland in Nunukan, as the majority of
undisturbed deep peatland is located there7.1 Mt CO2e
! Implement zero burning policy along with strict and visible enforcement
! Increase fire fighting capacities within the province by hiring fire rangers and provision of appropriate technology
15.6 Mt CO2e
! Initiate and implement extension services in cooperation with supportive private sector players to increase yield of oil palm with activities focusing on smallholder farmers
! Higher yields will help to reduce pressure on forest areas
3.3 Mt CO2e
! Promote use of degraded land (lahan critis) for future expansion oil palm
! Arrange land swaps of already granted concessions on forested land with equal sized plots of degraded land
11.4 Mt CO2e
Zero burning policy
Degradedland
Peatland water management
Yield improvements
Concession buyouts
36
DRAFT
The technical maximum potential for CO2e reduction through zero burning could be as high as 26 MtCO2e annually if all fires set by oil palm growers in East Kalimantan were suppressed. However, we recognize this would require large investments in infrastructure and fire prevention programs across a very large and difficult terrain. Thus, this strategy uses a more conservative abatement estimate of 15.6 MtCO2e, which could be achieved by focusing on the historical fire hot spots within the province.
Using existing degraded lands for the expansion of palm oil plantations could result in 11.4 MtCO2e of abatement annually by 2030. East Kalimantan has large areas of land that have been heavily degraded through previous deforestation, forest degradation, and the massive fires of the 1980s and 1990s. As many as 1.4 million ha are categorized as very critical (sangat kritis) and critical (kritis), with remaining tree cover of less than 10 percent and less than 30 percent respectively. Large areas of very critical and critical land are covered with Imperata cylindrica (alang-alang) and other weed species or bushes as their main vegetation with low carbon values. These degraded lands require roughly equal amounts of fertilizer (primarily rock phosphate) as forest lands and have approximately the same costs for development excluding any potential one-off revenues from selling cut timber on forested lands. Using degraded land for oil palm expansion will not only prevent emissions, it could even result in a net sequestration of carbon as long as the initial carbon levels are below 40 tCO2e per ha.
Only the larger plots of available degraded land are economically interesting for palm oil plantations investments from the private sector. About 40 percent of the land categorized as very critical and critical (approximately 550,500 ha of the total 1.4 million ha) consists of contiguous fields of 500 ha and larger. The rule-of-thumb estimate for the area needed for an economically attractive palm oil concession is 5,000 ha. We have focused on plots of degraded land of 500 ha or greater as we believe that they are typically found close to one another and can be consolidated with proper efforts. Thus, these areas could be used for oil palm cultivation and avoid deforestation of equally sized forests. To enable the use of degraded land, a degraded land database has to be developed that will identify the location, soil type, owner, and current land use. Degraded land must also be included in the spatial planning process, and its use should be prioritized over forested areas in the issuance of oil palm location permits (Izin Lokasi). In addition, financial incentives in the form of subsidies for use of degraded land and/or high carbon taxes on forested land would help to encourage the private sector to use degraded areas. This initiative will need to be linked to classical REDD payments or reclassifications under the spatial plan to ensure the original forest concession is not converted in the future by other activities.
Using degraded land is a relatively low cost opportunity to reduce emissions, with societal costs7 of less than USD 10 per abated tCO2e. The direct costs of cultivating oil palm on degraded land are roughly equal to cultivation on forested land. Forest concessions do offer a one-time revenue from the harvesting of the timber, which can cover the capital to establish the plantation. However, this is not the biggest driver for palm oil companies; in fact, many report that unless there is an associated timber company, they find it difficult to sell the timber or the community will claim it. They report that the biggest cost of degraded land is the indirect time and compensation needed to reach agreement with the larger number of settlers on these lands.
Emissions from decomposing peatland can be reduced through the implementation of a water management system and peat rehabilitation efforts, which can yield 7.1 MtCO2e in abatement. Water management limits the depth to which the peatlands are drained, from 100 cm to 70 cm for example. While best practices are still being researched, dam and canal systems can better manage water tables in palm plantations. These need to be based on an assessment of the entire hydrological conditions around a peat dome; as peat domes are integrated systems,
7 Societal cost doesn’t include transaction costs (e.g., compensation payments for land use rights of communities), which could be signi!cant, especially as a large number of smallholder communities would be involved

37
DRAFT
improving water management in one area, the deep center for example, will not be productive if drainage continues in another, the shallow periphery for example.8 Such measures are relatively low cost at less than USD 1 per abated tCO2e. In addition, good water management can help reduce the risks of flooding in the wet season and drought in the dry season and therefore result in higher crop yields.
Yield improvements can act both as an abatement measure (3.3 MtCO2e) as well as a tool to increase the sector’s economic contribution. In terms of abatement, yield improvements would allow the use of a smaller plantation area to achieve the same CPO production target, and thus could potentially reduce the area under cultivation, assuming good planning. If East Kalimantan reaches a similar yield level to Indonesia’s national average, it could reach a production of 3.8 million tons of CPO9 with 100,000 fewer hectares of plantations than at current yield levels. Yield improvements in isolation are unlikely to cause a decrease in plantation expansions; in fact, they could encourage expansion as palm oil becomes even more profitable. Therefore, yield improvements must be done in conjunction with strict planning on the use of lands for palm oil, targets set on production and not planted lands, and classical REDD payments to protect forests that would have otherwise been needed for palm oil expansion.
Avoiding emissions from deforestation and forest degradation through a concession buyout scheme could provide 3.2 MtCO2e of abatement annually. The idea behind concession buyouts is that local communities and concession holders would be paid for not starting or continuing economic activities that result in deforestation or forest degradation. While REDD+ payments could be part of the above initiatives, concession buyout payments would focus only on buying out a palm oil concession when there are no other options to relocate the palm oil plantation, Concession buyouts can be extremely expensive if concession holders and local communities insist on being compensated for the full opportunity cost of the lost palm oil plantation. Such an approach would cost approximately USD 16,000 to 21,000 per ha or USD 19 to 28 per avoided tCO2e depending of oil palm yields and avoided emissions. It should therefore only be applied in areas where few alternative opportunities for economic development exist, or to prevent the conversion of areas with high carbon and conservation value, such as primary forests and peatland or areas of cultural heritage for the province’s indigenous peoples.
Costs for reducing carbon emissions within the palm oil sector are, with the exception of a plantation concession buyout, relatively cheap if calculated on a per ton of abated CO2e basis. However, given the sheer seize of the overall abatement captured, total costs reach considerable levels of up to USD 200 million per year (EXHIBIT 17).
Pilot Projects
Pilot projects will help to identify and overcome existing challenges and showcase the potent combination of emission reduction and economic growth. Pilot projects should be developed to achieve quick and significant emission reduction as well as further economic development. Pilot projects need to be selected with local stakeholders and be based on several criteria, including the potential abatement as well as the level of support of stakeholders with land tenure and land-use rights. We have identified preliminary pilots by using the first criteria of abatement potential. Three recommended pilot project are as follows: work with the 10 largest holders of oil palm location permits (izin lokasi) in the province to relocate onto degraded land; implement a zero burning policy in areas historically prone to fire; and improve water management standards on peatland with the five largest active oil palm concession holders.
8 Peat domes are in the center of a coherent hydrological system and are normally areas with the highest peat thickness, which control the water "ow within the peatland
9 East Kalimantan’s business-as-usual production level at current yield rates is 3.8 million tons of CPO with 1.25 million ha under production
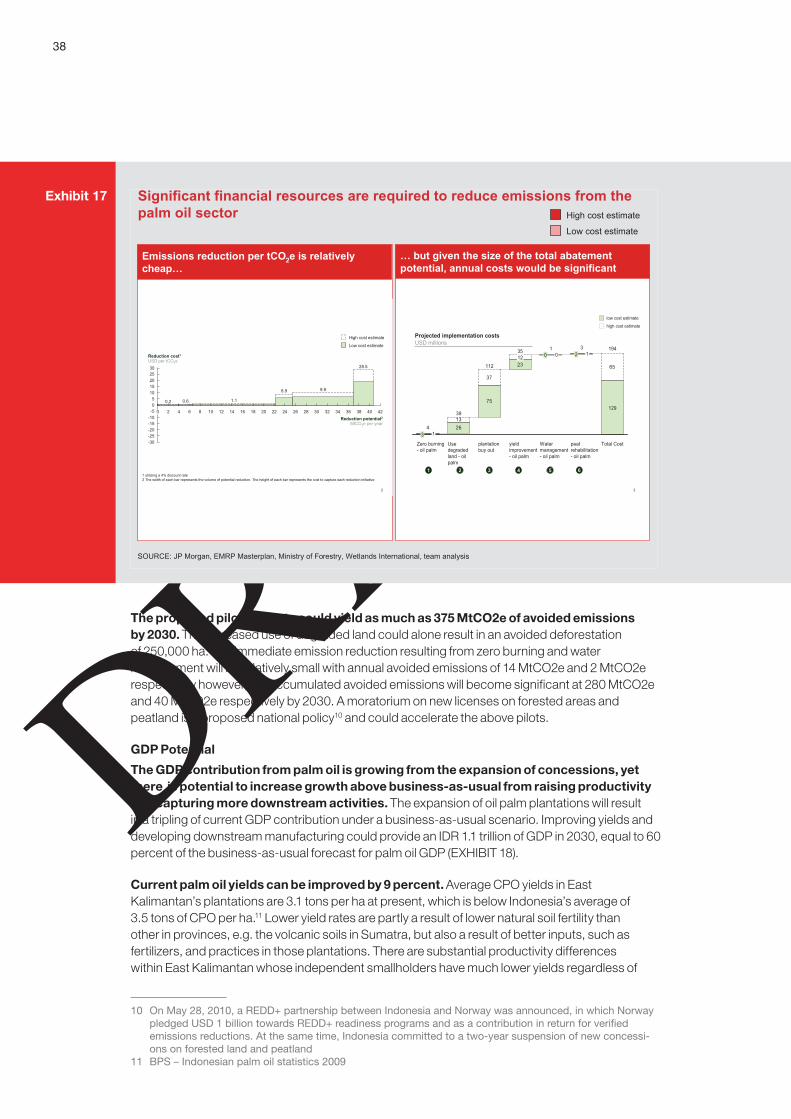
38
DRAFT
Exhibit 17 Significant financial resources are required to reduce emissions from the palm oil sector
SOURCE: JP Morgan, EMRP Masterplan, Ministry of Forestry, Wetlands International, team analysis
Emissions reduction per tCO2e is relatively cheap…
… but given the size of the total abatement potential, annual costs would be significant
High cost estimate
Low cost estimate
3
23
75
26
65
37
13
Total Costyield improvement - oil palm
129
194
112
plantation buy out
12
Use degraded land - oil palm
39
13
0
Zero burning - oil palm
4
353
2 1
Water management - oil palm
10
peat rehabilitation - oil palm
low cost estimate
high cost estimate
1 2 3 4 5 6
Projected implementation costsUSD millions
2
0.2
84 38 40 42
30
20
-30
Reduction potential2MtCO2e per year
0
10
Reduction cost1
USD per tCO2e
34
-20
-103632306 16
1.1
14
0.6
-15
-25
0 10
8.9
12
28.5
-5 18 28
5
9.9
2 2624
15
25
2220
1 utilizing a 4% discount rate2 The width of each bar represents the volume of potential reduction. The height of each bar represents the cost to capture each reduction initiative
High cost estimate
Low cost estimate
The proposed pilot projects could yield as much as 375 MtCO2e of avoided emissions by 2030. The increased use of degraded land could alone result in an avoided deforestation of 250,000 ha. The immediate emission reduction resulting from zero burning and water management will be relatively small with annual avoided emissions of 14 MtCO2e and 2 MtCO2e respectively however, the accumulated avoided emissions will become significant at 280 MtCO2e and 40 MtCO2e respectively by 2030. A moratorium on new licenses on forested areas and peatland is a proposed national policy10 and could accelerate the above pilots.
GDP Potential
The GDP contribution from palm oil is growing from the expansion of concessions, yet there is potential to increase growth above business-as-usual from raising productivity and capturing more downstream activities. The expansion of oil palm plantations will result in a tripling of current GDP contribution under a business-as-usual scenario. Improving yields and developing downstream manufacturing could provide an IDR 1.1 trillion of GDP in 2030, equal to 60 percent of the business-as-usual forecast for palm oil GDP (EXHIBIT 18).
Current palm oil yields can be improved by 9 percent. Average CPO yields in East Kalimantan’s plantations are 3.1 tons per ha at present, which is below Indonesia’s average of 3.5 tons of CPO per ha.11 Lower yield rates are partly a result of lower natural soil fertility than other in provinces, e.g. the volcanic soils in Sumatra, but also a result of better inputs, such as fertilizers, and practices in those plantations. There are substantial productivity differences within East Kalimantan whose independent smallholders have much lower yields regardless of
10 On May 28, 2010, a REDD+ partnership between Indonesia and Norway was announced, in which Norway pledged USD 1 billion towards REDD+ readiness programs and as a contribution in return for veri!ed emissions reductions. At the same time, Indonesia committed to a two-year suspension of new concessi-ons on forested land and peatland
11 BPS – Indonesian palm oil statistics 2009
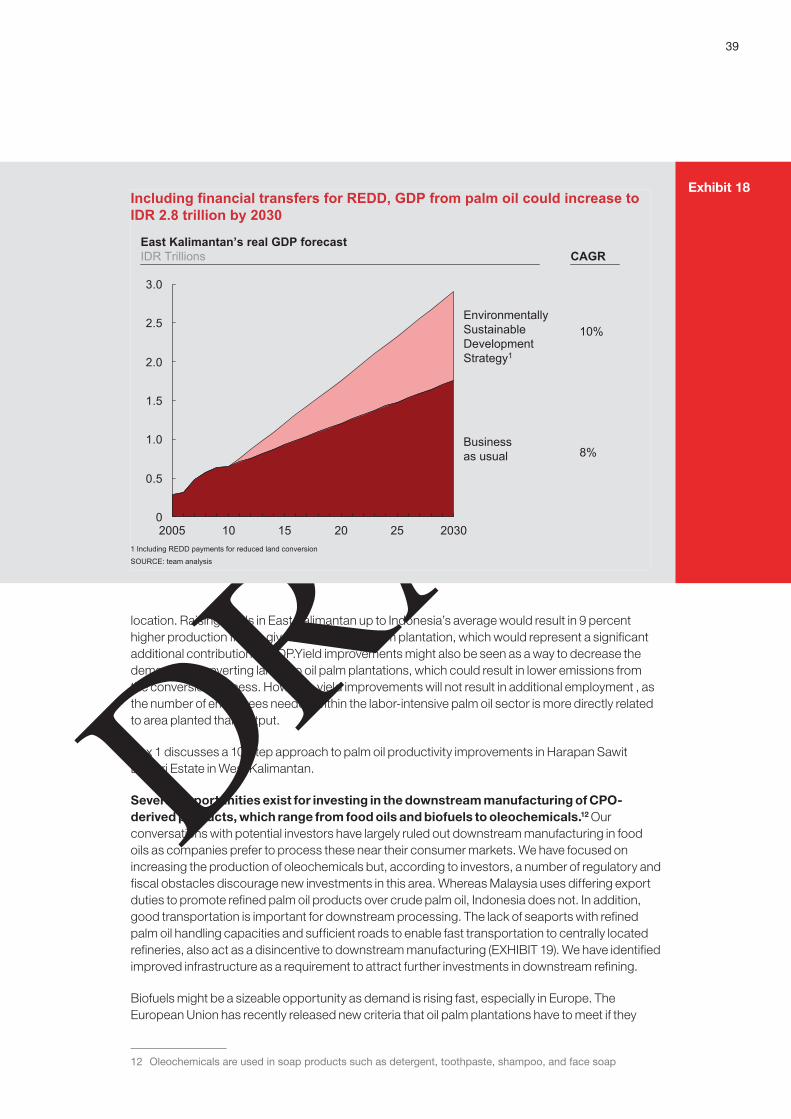
39
DRAFT
Exhibit 18Including financial transfers for REDD, GDP from palm oil could increase to IDR 2.8 trillion by 2030
SOURCE: team analysis
0
0.5
1.0
1.5
2.0
2.5
3.0
Business as usual
EnvironmentallySustainableDevelopmentStrategy1
2030252015102005
East Kalimantan’s real GDP forecast IDR Trillions CAGR
10%
8%
1 Including REDD payments for reduced land conversion
location. Raising yields in East Kalimantan up to Indonesia’s average would result in 9 percent higher production from a given hectare of oil palm plantation, which would represent a significant additional contribution to GDP.Yield improvements might also be seen as a way to decrease the demand for converting land into oil palm plantations, which could result in lower emissions from the conversion process. However, yield improvements will not result in additional employment , as the number of employees needed within the labor-intensive palm oil sector is more directly related to area planted than output.
Box 1 discusses a 10-step approach to palm oil productivity improvements in Harapan Sawit Lestari Estate in West Kalimantan.
Several opportunities exist for investing in the downstream manufacturing of CPO-derived products, which range from food oils and biofuels to oleochemicals.12 Our conversations with potential investors have largely ruled out downstream manufacturing in food oils as companies prefer to process these near their consumer markets. We have focused on increasing the production of oleochemicals but, according to investors, a number of regulatory and fiscal obstacles discourage new investments in this area. Whereas Malaysia uses differing export duties to promote refined palm oil products over crude palm oil, Indonesia does not. In addition, good transportation is important for downstream processing. The lack of seaports with refined palm oil handling capacities and sufficient roads to enable fast transportation to centrally located refineries, also act as a disincentive to downstream manufacturing (EXHIBIT 19). We have identified improved infrastructure as a requirement to attract further investments in downstream refining.
Biofuels might be a sizeable opportunity as demand is rising fast, especially in Europe. The European Union has recently released new criteria that oil palm plantations have to meet if they
12 Oleochemicals are used in soap products such as detergent, toothpaste, shampoo, and face soap
40
DRAFT
have the intention to export CPO or biofuels to Europe. Those criteria are in line with our current thinking related to a better utilization of our degraded land. The consequent implementation of those criteria could therefore open markets and provide a competitive advantage compared with other Indonesian provinces.
It is important that we implement safeguards to ensure that greater downstream processing does not lead to increased demand for palm oil that leads to increased deforestation for new concessions. This can be avoided partly by timing the development of downstream facilities only
Palm oil Productivity Improvements in Harapan Sawit Lestari Estate in West Kalimantan
Palm oil yields in Kalimantan lag behind their potential considering that the region’s soil, climate conditions, and available planting materials. The Best Practice Management project implemented in Harapan Sawit Estate illustrates that impressive yield improvements in oil palm can be achieved by a targeted 10-step approach:
Complete crop recovery by strict control of harvesting activities to eliminate crop loss in the field•
Harvest intervals controlled at seven-day intervals•
Proper access for harvesting (infield paths, foot bridges, road access)•
Continuous maintenance of correct canopy conditions by removing fronds at harvest and • implementing two rounds of pruning per year
Ground cover management to provide adequate soil cover but provide harvesters and other field • workers with unimpeded access
Adequate in-field drainage and outlets•
Recapitalization of soil phosphorus with one-time application of 1 t per hectare of reactive tock • phosphate
Timely application of standard fertilizer programs•
Application of empty fruit bunch mulch (40 t per hectare)•
Relentless drive by management to maximize yield by eliminating field constraints•
Following the approach, fresh fruit bunch yields in trial blocks increased rapidly after implementation of best practice guidelines by 4 t per hectare due to complete crop recovery. Additional FFB increases of 2 t per hectare can be explained by better agronomic management and reached 35 t per hectare in 2007.
(Fairhurst, McLaughlin (2009) Sustainable Oil Palm Development on Degraded Land in Kalimantan)
Roundtable of Sustainable Palm Oil (RSPO)
Palm oil yields in Kalimantan The Roundtable of Sustainable Palm Oil consists of oil palm growers, downstream manufacturers but also financing institutions and non-governmental organizations. In 2007, the RSPO has, after a long period of consultations, published more than hundred principles and criteria which ensure sustainable production of oil palm. While the majority of large Indonesian oil palm growers and palm oil producers are members of RSPO only a couple of companies, e.g. WILMAR and Cargill, have received formal RSPO cerification for selected plantations.
Box 1
Box 2
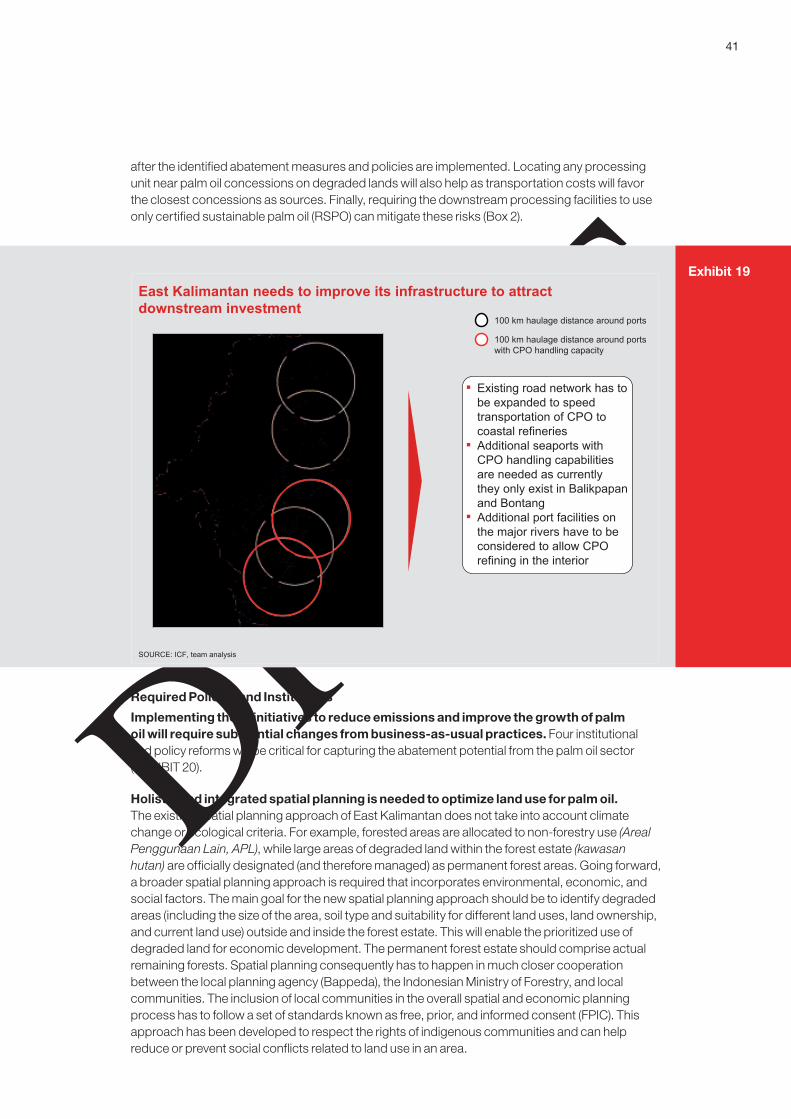
41
DRAFT
after the identified abatement measures and policies are implemented. Locating any processing unit near palm oil concessions on degraded lands will also help as transportation costs will favor the closest concessions as sources. Finally, requiring the downstream processing facilities to use only certified sustainable palm oil (RSPO) can mitigate these risks (Box 2).
Required Policies and Institutions
Implementing these initiatives to reduce emissions and improve the growth of palm oil will require substantial changes from business-as-usual practices. Four institutional and policy reforms will be critical for capturing the abatement potential from the palm oil sector (EXHIBIT 20).
Holistic and integrated spatial planning is needed to optimize land use for palm oil. The existing spatial planning approach of East Kalimantan does not take into account climate change or ecological criteria. For example, forested areas are allocated to non-forestry use (Areal Penggunaan Lain, APL), while large areas of degraded land within the forest estate (kawasan hutan) are officially designated (and therefore managed) as permanent forest areas. Going forward, a broader spatial planning approach is required that incorporates environmental, economic, and social factors. The main goal for the new spatial planning approach should be to identify degraded areas (including the size of the area, soil type and suitability for different land uses, land ownership, and current land use) outside and inside the forest estate. This will enable the prioritized use of degraded land for economic development. The permanent forest estate should comprise actual remaining forests. Spatial planning consequently has to happen in much closer cooperation between the local planning agency (Bappeda), the Indonesian Ministry of Forestry, and local communities. The inclusion of local communities in the overall spatial and economic planning process has to follow a set of standards known as free, prior, and informed consent (FPIC). This approach has been developed to respect the rights of indigenous communities and can help reduce or prevent social conflicts related to land use in an area.
Exhibit 19East Kalimantan needs to improve its infrastructure to attract downstream investment
SOURCE: ICF, team analysis
100 km haulage distance around ports
100 km haulage distance around ports with CPO handling capacity
! Existing road network has to be expanded to speed transportation of CPO to coastal refineries
! Additional seaports with CPO handling capabilities are needed as currently they only exist in Balikpapan and Bontang
! Additional port facilities on the major rivers have to be considered to allow CPO refining in the interior

42
DRAFT
Law enforcement is required to ensure policies and changes are fully implemented. At present, at least 60 oil palm concessions in the province are operating without the full set of legal permits required to do so (Box 3). It is essential for the future development of the palm oil sector that existing regulations regarding permits, the use of fire for land clearing, and illegal land clearing are enforced. Without enforcement, the lowest cost and quickest option to establish a palm oil concession would be to pay a bribe to plant on forest lands. We are committed to the national anti-corruption policies and thus enforcement must have strict and visible consequences. Our efforts will also help to gain the trust of international consumers and promote the image and integrity of oil-palm-derived products produced in Indonesia.
Capability-building is needed to support the necessary behavioral change required. Emission reductions need to go hand in hand with productivity improvements so individual stakeholders gain benefits from their efforts to reduce emissions. We recognize East Kalimantan needs to provide smallholder farmers with training and technical support, as well as give them access to input components required for growing oil palms, such as cheap fertilizers and premium seedlings that will result in improved yields, lower production costs, and higher incomes.
Regulatory changes are also required to support change in the palm oil sector. At present, granted concessions exceed the total land area of the province excluding protected forests. This is a result of different agencies and levels of government being involved in the concession licensing process without common datasets or sufficient coordination. Providing an additional mandate and authority to the provincial planning agency Bappeda to track and give final approval for new concessions could help reduce duplication of concession licenses in the province and thus help reduce land-use conflicts. In general, such decision-making is pushed down to the lowest level of government as local governments have more on-the-ground knowledge and greater responsiveness to local stakeholders. However, in this case, the need to coordinate among different agencies issuing permits as well as to optimize land across all of East Kalimantan requires a central coordination effort. While there is the potential of a slightly longer bureaucratic process;
Exhibit 20 Addressing critical enablers is required for successful emissionreduction in the oil palm sector
Description
! Develop a new provincial spatial plan to identify no-go areas as well as degraded areas with low carbon, biodiversity, and economic value for future expansion of oil palm plantations, as current spatial plan is primarily based on accessibility
! Develop degraded land database including level of degradation, land ownership, land use rights, and suitability for oil palm
Spatial planning1
Law enforce-ment
2! Adjust and enforce regulations regarding, e.g. use of fire and illegal logging, to
reduce emissions from land conversion into oil palm plantations
Capability building3
! Develop appropriate extension services to provide smallholder growers of oil palm with technical know-how to support zero burning methods and yield improvements of their oil palm crops
Regulatorychanges
4! Change regulations to ensure sustainable expansion, e.g. independent cross-
district permit agency to avoid overlapping concessions and to minimize social conflicts, mandatory and enforced environmental impact assessment (EIA) before start of land clearing
§§
43
DRAFT
however, this does not need to be the case. The new process could actually translate into a clear competitive advantage for East Kalimantan in its efforts to attract new investments by reducing the legal complexity and time consuming delays facing oil palm investors.
FORESTRY SECTOR
Forests have always been an important resource for East Kalimantan: valuable timber is collected from legal logging, industrial plantations provide Acacia, Eucalyptus, Teak, and other tree species, communities harvest non-timber forest products, and forests provide vital ecological and environmental services such as watershed protection, biodiversity, habitat for countless species. Yet, since the 1960s East Kalimantan’s production forests have experienced unsustainable rates of logging, which have resulted in the degradation of the forests. Those high logging rates could not be sustained as reserves of valuable timber were depleted and tree growth was insufficient to replace stocks. Thus, the forestry sector has declined since the mid 1990s in both relative and absolute terms in East Kalimantan’s economy.
With the exception of two FSC-certified concessions, East Kalimantan’s logging concessions do not meet international best practices for reduced impact logging (RIL). Unsustainable logging practices together with the conversion of natural forest into timber plantations and the decomposition of degraded peatland within the forestry estate (Kawasan Hutan) result in estimated annual net emissions of 45 MtCO2e, which makes the forestry sector the third largest emitter in the province.
Significant reductions in forestry emissions are possible through the implementation of RIL practices, more efficient use of areas already designated as timber plantations, better water management in existing forestry concessions in peat areas, and a moratorium on granting new concessions on peatland. Increasing productivity in existing timber plantations and RIL within the logging concessions would enable a sustainable supply of wood to support an expanded downstream industry, which in turn would increase local employment by an estimated 40,000 to 60,000 new jobs and contribute up to IDR 20 trillion to provincial GDP.
The Case of Oil Palm Permits and Related Area Consumption
Permits for oil palm concessions are generally issued by the head of the district government, and operators require three significant steps to legally operate a concession. At present, the official target formalized in the long-term strategic plan is to have an additional 1 million ha of oil palm plantations planted by 2025.
Location Permit • (Izin Lokasi, IL) is a preliminary boundary setting of a plantation, which is issued by the district leader (Bupati or Walikota) based on a recommendation by the provincial governor. At present, location permits for oil palm plantations in East Kalimantan cover an area of 3.2 million ha, of which more than 400,000 ha are located on peatland. In the last six months, the area for location permits increased by more than 350,000 ha.
Plantation Business Permit• (Izin Usaha Perkebunan, IUP) is issued by the Governor in case of cross-district plantations or by Bupati or Walikota if not and requires an Environmental Impact Assessment (AMDAL). Although location permits and plantation permits are formally linked together and both are required, many companies operate with only one of the permits.
Plantation Operating Permit • (Hak Guna Usaha, HGU) is issued by the national land agency (BPN) and is the final step for legally operating an oil palm concession. Approved and active plantations with HGU cover approximately 465,000 ha at present, while HGUs have been issued but not activated for another 300,000 ha.
Box 3

44
DRAFT
Current Context
The forestry industry has been in a slow decline for over a decade. Still, forestry is East Kalimantan’s largest sector in terms of land use, occupying an area of more than 7.5 million ha. In contrast to the large area deployed, the economic contribution of the forestry sector13 is relatively small at approximately IDR 2.1 trillion GDP at present. This contribution to GDP has been steadily declining since the late 1990s when it peaked at IDR 3.4 trillion (EXHIBIT 21).
The decline in forestry is due to historical overlogging as well as low productivity in plantations. Many of the production forests (Hak Pengusahaan Hutan, HPH) have been over logged and illegally logged in the past and can today supply only a small number of high-value logs. Furthermore, East Kalimantan’s timber plantations (Hutan Tanaman Industri, HTI) have had extremely low productivity levels, as a result of poor management practices, e.g., the inefficient use of silviculture. HTI productivity and utilization has also been slowed by lower than expected demand for timber (especially pulpwood) within East Kalimantan, as planned expansions and further investments in downstream processing capacities have not been realized.
Net emissions from forestry are significant at approximately 45 MtCO2e. Four major land-use related factors are driving emissions from the forestry sector: forest degradation from legal logging, deforestation from conversion to timber plantations, peat decomposition from logging and conversion on peatlands, and fires used for clearing land and debris (EXHIBIT 22). The forestry sector is also the largest absorber of CO2e in East Kalimantan, absorbing 34 MtCO2e in 2010.
The degradation of East Kalimantan’s production forests (HPHs) is the largest single source of emissions within the forestry sector at 34 MtCO2e annually. Current logging techniques cause massive collateral damage and result in the subsequent death of many of the
13 Excluding wood products and pulp and paper manufacturing
Exhibit 21
SOURCE: Indonesia Bureau of Statistics
GDP contribution of the forestry sector is declining since the 1990s both in absolute as well as relative measures
2.12.22.32.42.4
2.62.7
2.93.1
3.2
3.0
3.4
3.23.2
2.8
2.52.72.7
2.5
1.81.6
1.71.5
0
0.5
1.0
1.5
2.0
2.5
3.0
3.5
0
0.5
1.0
1.5
2.0
2.5
3.0
3.5
4.0
4.5
5.0
5.5
6.0
6.5
1983 84 85 9188 9087 8986
Relative contribution to GDPpercent
Real GDPIDR trillion
92 93 94 95 96 97 98 99 2000 01 02 03 04 05 06 07 2008
2.62.5 2.4
GDP from forestry (Left hand scale)GDP from forestry as percent of total (Right hand scale)

45
DRAFT
Exhibit 22Emissions from the forestry sector have multiple causes
SOURCE: Ministry of Forestry Indonesia; Dinas Kehutanan; Wetlands International; Van der Werf et al 2008 Team analysis
Description
! Current planned logging activities are leading to a permanent loss of carbon in East Kalimantan’s production forest
! Illegal logging is contributing significantly to forest degradation, however there are many uncertainties about size of impact
Forestdegradation
Deforestation! Planned and unplanned conversion of natural forests result
in significant net emissions even taking sequestration of plantations into account
Peat decomposition
! Drainage channels used for dewatering of peat transportation of timber and logging equipment lead to the decomposition of the peat organic matter
Fire! Fire is used for land conversion but also land clearing from
wood residues at the end of the rotation cycle
EmissionsMt CO2e
34
24
17
13
trees left behind when saleable timber is extracted. Emissions from this collateral damage to the forest is several times the emissions from the actual harvested trees for sale. Such damage to surrounding forest is not inevitable, but can be explained by unsustainable logging practices, minimal harvest planning, a lack of training for forest workers, a lack of management capabilities, and use of inappropriate skidding technology. All of the above result in low growth of the remaining trees. Poor logging techniques can cause the net loss of 30 percent of the initial carbon stock of a forest over a logging cycle.
The expansion of timber plantation area in recent years has resulted in large areas of natural forest being converted, causing emissions of 24 MtCO2e in 2010. Conversion of natural primary and secondary forests into timber plantations results in a net carbon loss of up to 70 percent of the initial carbon stock of the forest, making conversion the second largest emission source of the forestry sector.
Emissions from peat decomposition are smaller than in neighboring provinces, such as Central Kalimantan, yet still result in 13 MtCO2e emissions in 2010. East Kalimantan’s peatlands are partly covered with timber plantations and logging concessions. Peat soils in these areas are degraded through drainage to allow for logging and harvesting activities. As the area of degraded peatland increases with new concessions, emissions are expected to reach 17 MtCO2e in 2030.
Fires within the borders of production forests, especially on peat soils, are another significant source of emissions, approximately 11 MtCO2e in recent years. The number of hot spots varies from year to year as fire is heavily influenced by rainfall and other weather factors. However, fires spread through degraded areas, thus these emissions are expected to increase to 13 MtCO2e in 2030 under a business-as-usual scenario with increased forest degradation. Besides emissions, fires cause massive economic losses, not least by destroying merchantable timber. The World Resource Institute estimated the financial losses caused by the ravaging fires

46
DRAFT
Exhibit 23
Kutai BaratKutai Barat
PasirPasir
Planned timber plantations on natural forest in Kutai Barat and Pasir
Some timber plantations cover deep peat in Nunukan and Tana TidungExhibit 24

47
DRAFT
across Kalimantan in 1997 and 1998 to be in the range of USD 3 to 5 billion.14 In addition, fires damage the environment as well as the health of our people, leading to high levels of respiratory problems and indirect costs.
Counteracting these emissions, East Kalimantan’s forests are a major source of carbon sequestration (or carbon sink). Based on different scientific publications and growth rate assumptions published by the Ministry of Forestry, it is estimated that East Kalimantan’s secondary forests and timber plantations are sequestering 37 MtCO2e annually at present, of which approximately 24 MtCO2e is sequestered in natural secondary forests.
In a business-as-usual scenario (EXHIBIT 25) net emissions from forestry will grow from 45 to 71 MtCO2e by 2030. Emissions from forest degradation within logging concessions will continue at roughly the same pace as will emissions from the continued conversion of forests to timber plantations. Once drained, peatlands continue to degrade over many years, and so it is expected that emissions from peat decomposition as a result of drainage will rise and the damage from fires will also increase in newly opened up peatland. In addition, absorption from East Kalimantan’s secondary forests and timber plantations will be reduced to only 19 MtCO2e by 2030 as the overall size of the forest area decreases and timber plantations reach the end of their rotation cycle.
Abatement Potential
The forestry sector has the potential to become a net carbon sink over time. The forestry sector is unique; its abatement potential is larger than its estimated future gross emission levels. This abatement potential consists of the implementation of reduced impact logging in the production forest (HPHs), better water management and rehabilitation of peatland, and reforestation (EXHIBIT 26).
14 World Resource Institute (2001) – State of Forests: Indonesia
Exhibit 25GHG emissions from the forestry sector are expected to increase in a business-as-usual scenario
PRELIMINARY
SOURCE: BPS Kaltim; WWF Indonesia, Dinas Kehutanan Kaltim, Departemen Kehutanan Indonesia, Team analysis
-37
24 24 24
-19-18
100
+2% p.a.
2030
34
17
132
2020
69
34
16
121
2010
45
1311
0
34
71
Absorption
Degradation
Peat decomposition
Fire
Others
Deforestation
Current and future GHG emissions from the forestry sectorMtCO2e
Largest drivers of emissions are deforestation and degradation, however changes in emissions are primarily driven by the decreasing absorption capacity of East Kalimantan’s forests

48
DRAFT
Exhibit 26 Technically East Kalimantan’s forestry sector could become carbon neutral in 2030
SOURCE: Indonesia GHG Abatement Cost Curve
Emissions
Abatement
Forestry sector 2030 BAU gross emissions, net emissions after abatement, and abatement levers MtCO2e
88
13
17
2434
-9
Reforest-ation
13
Emissions after abatement
Water manage-ment and peat rehabilitation
19
Zero burn
8
Con-cession buyouts
10
Use of degraded land
14
Reduced Impact Logging
34
Net emissions
FirePeat decomp-osition
De-forest-ation
Forest degrad-ation
Reduced impact logging (RIL) is the largest abatement opportunity and could yield 34 MtCO2e by 2030. Reduced impact logging could be attractive to private companies as it allows the same amount of commercial timber to be extracted. Yet, the introduction of new harvesting techniques will require investment – training, initial capital, and monitoring. Currently, production forests, or HPHs, are largely ungoverned as they fall under the control of the national Ministry of Forestry, which lacks sufficient provincial-based staff to monitor concessions. Creating forestry management units (Kesatuan Pengelolaan Hutan – KPH) across the provinces to increase monitoring could be a powerful tool to strengthen monitoring and control and improve harvesting planning and practices, especially concerning the skidding15 of timber. Investments in roads and skidding infrastructure are required to reduce the skidding distances and thus reduce damage caused during logging of the remaining forests. Additional investments in skidding technology and the training of forest workers are also required. The cost for implementation is relatively low compared to the abatement potential, approximately USD 0.5 to 2.5 per ton of abated CO2e. Still, for the timber companies, this translates into required investment estimated at approximately USD 50 to 250 per ha.
Utilizing degraded land for expansion of timber plantations would yield 13.9 MtCO2e of abatement. Using degraded land within and outside the forest estate for expansion should be prioritized for future timber plantations wherever possible. If not suitable for rehabilitation, degraded areas within the forest estate should definitely be used for future expansion of timber plantations. However, for other degraded lands, a new planning exercise will be needed to select the type of land use that holds the highest economic value for East Kalimantan.
15 Skidding is describing the process of hauling one or several felled logs with e.g. a bulldozer to an area accessible for other means of transportation e.g. rivers and major roads.

49
DRAFT
Utilizing concession buyout schemes could provide 9.8 MtCO2e in abatement. The use of standalone concession buyout schemes is the last option due to its high costs. This approach targets land owners or concessionaires and pays them for not starting economic activities, such as converting forests into pulpwood plantations. Without providing a substitute, such as degraded land or improved productivity, concessions holders may need to be compensated for the opportunity cost of the lost plantation (assuming all proper permits were received). This approach comes at relatively high cost, approximately USD 9 to 14 per avoided tCO2e in the case of Acacia and even more for more valuable woods like Teak or Meranti. A compensation scheme that only covered historical costs and expenses would result in much lower cost per ton of abated carbon,
Improving yields in timber plantations could result in less expansion into forest, but only if coupled with other safeguard measures. Growth rates within East Kalimantan’s HTIs are below best practice yields achieved in other parts of Indonesia. In 2008, harvesting targets for pulpwood plantations according to the Provincial Forest Ministry (Dinas Kehutanan) indicate an annual growth rate of approximately 20 cubic meters per ha. Best practice examples in Sumatra achieve annual growth rates for Acacia mangium of 40 cubic meters per ha. Given differences in soil quality, however, a more conservative target growth rate of 25 to 30 cubic meters per ha seems more feasible. Increasing productivity would allow for increased production with less forest conversion: approximately 150,000 ha less than in the business-as-usual scenario and result in avoided emissions of 120 MtCO2e over a period of 20 years.
Increasing growth rates can also be accomplished by using intensive silvicultural methods like thinning, better planting techniques, a better selection of seeds, and improved nursery techniques for seedlings. However, productivity improvements alone would not necessarily lead to less HTI expansion; in fact, it could make the sector more attractive and increase investment and expansion. Increased productivity would need to be coupled with additional measures to protect the available forest, for example REDD+ payments if reduced deforestation could be proven.
12.5 MtCO2e of abatement is possible from reforestation and forest rehabilitation. Degraded forests can be reforested and rehabilitated with new plantings and result in increased carbon sequestration. There is approximately 1.5 million ha of slightly critical land (agak kritis) located within the forest estate; these areas have forest cover of 50 to 60 percent, and thus should not be used for land swaps for timber concessions but instead fully reforested. We have already launched a One Man Five Tree replanting program to engage the whole province in reforestation as well as raise awareness. To achieve the 12.5 MtCO2e abatement potential, approximately 35 to 40 million trees need to be planted each year to restore the degradation caused by non-sustainable logging practices.
Reforestation and forest rehabilitation only results in carbon sequestration if the replanted lands are set aside for conservation. Timber plantations are considered carbon neutral as nearly all carbon sequestered as trees grow is lost once they are harvested; thus replanting for timber plantations yields no permanent abatement of emissions. Reforestation and forest rehabilitation comes at a relatively high cost of approximately USD 2 to 5 per tCO2e. However, fostering natural regeneration (if the remaining trees provide enough potential) by weeding and other techniques to increase the viability of tree seedlings could reduce the costs substantially and should be the preferred option for rehabilitation wherever possible.
Water management and peatland rehabilitation initiatives can produce 17 MtCO2e of abatement. The goal is to minimize drainage in logging and timber concessions on peatland to 50 to 70 cm below the peat surface. High growth rates of Acacia are possible at this level; any further drainage would result in higher emissions from peat decomposition, while lower drainage would result in decreasing yields. Drainage to 50 to 70 cm below the surface also allows for the transportation of pulpwood in the drainage channels. Proper water management requires an assessment of the hydrological conditions around the peat domes and the construction of dams and sluice gates to regulate the water level to allow transportation of felled timber. In addition,

50
DRAFT
water management can help to reduce the risk of flooding in the wet season and prevent the risk of drought in the dry season, events that often reduce yield and therefore result in financial losses.
Water management is relatively low cost, with an associated cost below USD 1 per abated tCO2e. While the restoration of peatlands via water management is low cost, replanting degraded peatlands is relatively expensive with costs of USD 500 to 1,100 per ha, or USD 2 to 5 per ton of sequestered CO2e. Fostering natural regeneration of existing tree cover could reduce the replanting costs significantly and should be applied wherever possible.
Fire prevention and management could yield 8 MtCO2e in abatement annually by 2030. The prevention of peat fires has a significant emissions abatement potential at a relatively low cost of less than USD 1 per avoided tCO2e. Major emission reductions could be achieved by implementing a zero burning policy to prevent encroachment of fires into plantations and logging concessions, providing appropriate and practical equipment (and, if appropriate, financial incentives) for fire fighting, developing appropriate early-warning systems based on fire risk status and field-based fire detection, strengthening fire brigades, ensuring strong enforcement and large penalties for rule violations, and building public awareness of the economic and social costs of forest fires in the province.
Costs for reducing carbon emissions within the forestry sector are, with the exception of a plantation concession buyout, relatively cheap if calculated per ton of abated CO2e basis, averaging to USD 1 to 2. However, given the sheer size of the overall abatement captured, total costs reach considerable levels of up to USD 190 million per year (EXHIBIT 27).16
16 The two already FSC certi!ed concessions of PT Sumalindo and PT Intracawood have not been considered as pilots, however those concessions could be models for future sustainable logging activities
Exhibit 27 Significant financial resources are required to reduce emissions within the forestry sector
SOURCE: JP Morgan, EMRP Masterplan, Ministry of Forestry, Wetlands International, team analysis
The cost to reduce forestry emissions is relatively low per tCO2e abated…
… but given the size of the total annual abatement potential, costs are significant
High cost estimate
Low cost estimate
9
73
16
21
127
6337
110
24
Annual cost
3
3110
Re-forestation
plantation buyout -forestry
7
Reduced Impact Logging
10
236
583
Zero burning -forestry
1
Degraded land -forestry
10
190
peat re-habilitation - forestry
Water management - forestry
8
low cost estimate
high cost estimate
1 2 3 4 5 6
Projected implementation costsUSD millions
7
8
15
25
Reduction cost1
USD per tCO2e
20
-30
25
-25-20
30
5
40-10
9085 10095-5 705 15 8075
1.31.1
45 50
0.60.2
55 656020 35
14.0
3.1 4.0
0 30Reduction potential2
MtCO2e per year
0
10
10
-15
1 utilizing a 4% discount rate2 The width of each bar represents the volume of potential reduction. The height of each bar represents the cost to capture each reduction initiative
High cost estimate
Low cost estimate
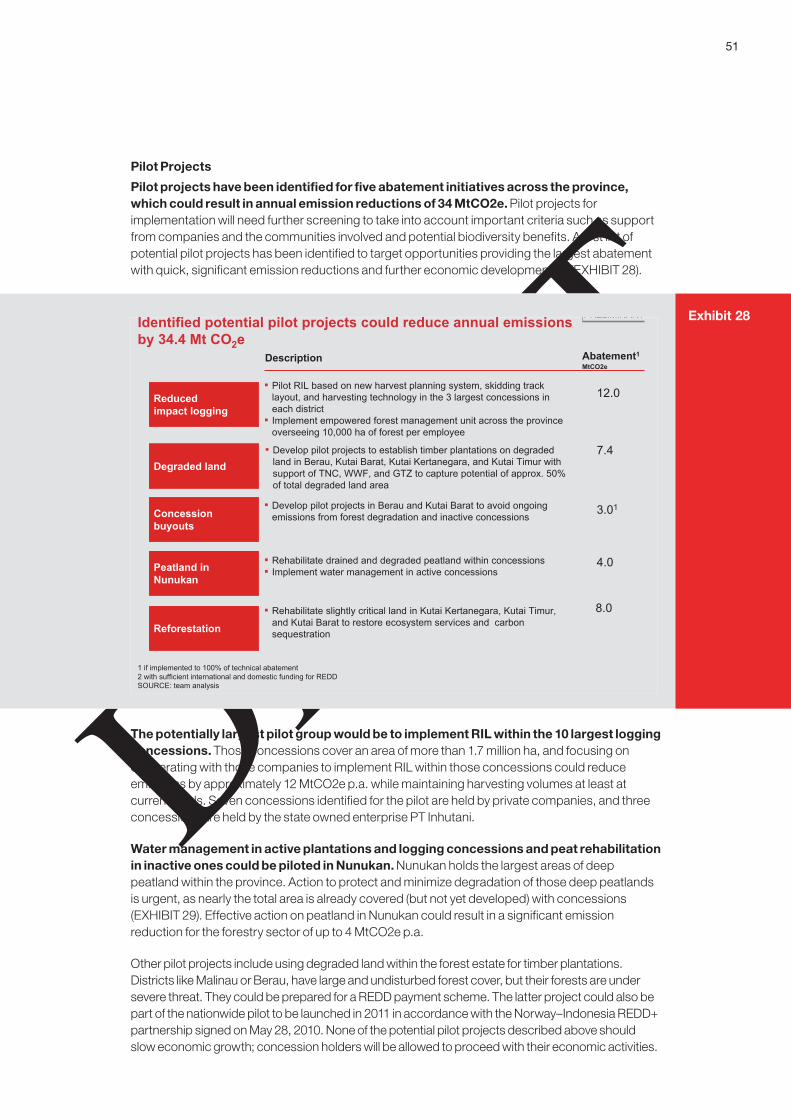
51
DRAFT
Pilot Projects
Pilot projects have been identified for five abatement initiatives across the province, which could result in annual emission reductions of 34 MtCO2e. Pilot projects for implementation will need further screening to take into account important criteria such as support from companies and the communities involved and potential biodiversity benefits. A first list of potential pilot projects has been identified to target opportunities providing the largest abatement with quick, significant emission reductions and further economic development by (EXHIBIT 28).
The potentially largest pilot group would be to implement RIL within the 10 largest logging concessions. Those concessions cover an area of more than 1.7 million ha, and focusing on cooperating with those companies to implement RIL within those concessions could reduce emissions by approximately 12 MtCO2e p.a. while maintaining harvesting volumes at least at current levels. Seven concessions identified for the pilot are held by private companies, and three concessions are held by the state owned enterprise PT Inhutani.
Water management in active plantations and logging concessions and peat rehabilitation in inactive ones could be piloted in Nunukan. Nunukan holds the largest areas of deep peatland within the province. Action to protect and minimize degradation of those deep peatlands is urgent, as nearly the total area is already covered (but not yet developed) with concessions (EXHIBIT 29). Effective action on peatland in Nunukan could result in a significant emission reduction for the forestry sector of up to 4 MtCO2e p.a.
Other pilot projects include using degraded land within the forest estate for timber plantations. Districts like Malinau or Berau, have large and undisturbed forest cover, but their forests are under severe threat. They could be prepared for a REDD payment scheme. The latter project could also be part of the nationwide pilot to be launched in 2011 in accordance with the Norway–Indonesia REDD+ partnership signed on May 28, 2010. None of the potential pilot projects described above should slow economic growth; concession holders will be allowed to proceed with their economic activities.
Exhibit 28Identified potential pilot projects could reduce annual emissions by 34.4 Mt CO2e
PRELIMINARY
Description Abatement1
MtCO2e
SOURCE: team analysis
Peatland in Nunukan
! Rehabilitate drained and degraded peatland within concessions! Implement water management in active concessions
Concession buyouts
! Develop pilot projects in Berau and Kutai Barat to avoid ongoingemissions from forest degradation and inactive concessions
! Develop pilot projects to establish timber plantations on degraded land in Berau, Kutai Barat, Kutai Kertanegara, and Kutai Timur with support of TNC, WWF, and GTZ to capture potential of approx. 50% of total degraded land area
Degraded land
Reduced impact logging
! Pilot RIL based on new harvest planning system, skidding track layout, and harvesting technology in the 3 largest concessions in each district
! Implement empowered forest management unit across the province overseeing 10,000 ha of forest per employee
Reforestation! Rehabilitate slightly critical land in Kutai Kertanegara, Kutai Timur,
and Kutai Barat to restore ecosystem services and carbon sequestration
1 if implemented to 100% of technical abatement2 with sufficient international and domestic funding for REDD
12.0
7.4
4.0
8.0
3.01
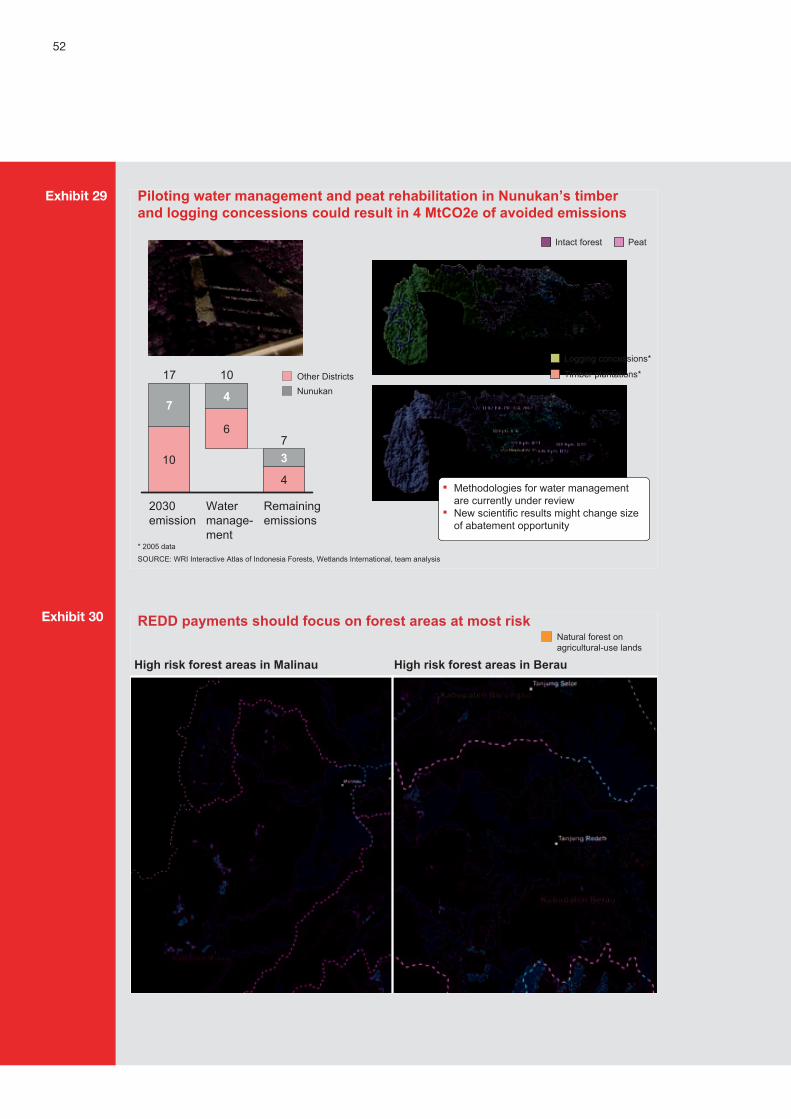
52
DRAFT
Exhibit 29
* 2005 data
SOURCE: WRI Interactive Atlas of Indonesia Forests, Wetlands International, team analysis
Intact forest Peat
Logging concessions*
Timber plantations*
Piloting water management and peat rehabilitation in Nunukan’s timber and logging concessions could result in 4 MtCO2e of avoided emissions
10
6
3
10
4
7
17
4
2030 emission
7
Remaining emissions
Water manage-ment
Other DistrictsNunukan
! Methodologies for water management are currently under review
! New scientific results might change size of abatement opportunity
REDD payments should focus on forest areas at most risk
High risk forest areas in Malinau High risk forest areas in Berau
Natural forest on agricultural-use lands
Exhibit 30

53
DRAFT
GDP Potential
The economic decline of the forestry sector in East Kalimantan can be reversed through raising productivity and investing in downstream activities. These moves would increase the forestry sector’s GDP by IDR 16 trillion by 2030 (EXHIBIT 31). The initiatives described earlier will reduce emissions from our current logging and harvesting activities, but such efforts should be complemented with efforts to extract more value from these activities. Currently, much of the felled timber from logging is left as waste in the forest: thiscould be further processed. After forests are converted to plantations, there are different opportunities to raise productivity within those concessions. And finally, much of East Kalimantan’s timber is exported to Sumatra and Java where it is processed into higher value products such as pulp or furniture. East Kalimantan has the opportunity to capture a larger share of the downstream value-add going forward.
Improving timber utilization could yield IDR 0.7 trillion in additional GDP. Currently, logging operations produce large volumes of waste. The logging companies currently sell to domestic plywood and veneer mills or other solid wood applications. These buyers are interested in only large diameter logs. Thus, large volumes of small-diameter wood (e.g., tree crowns) and wood residues are left behind in the forest after the trees are cut. A more efficient approach is to fully utilize the felled trees and thus gain higher revenues from a given land area. A common approach in Europe, North America, and Brazil is to use large-diameter wood for high-value applications (as is already done in East Kalimantan), but then to sell small-diameter wood and wood residue for lower-value applications like pulp and paper, board manufacturing, and the production of wood chips and wood pellets (EXHIBIT 32).
Growth rates in East Kalimantan’s timber plantations could be substantially improved and idle plantations brought back into production. As noted earlier, growth rates in East Kalimantan’s industrial pulpwood plantations are low compared with best practice benchmarks in other parts of Indonesia. The annual growth rate is around 20 cubic meters per ha, while up to 40
Exhibit 31Yield improvements in HTI, and increasing value added production could increase the GDP of the forestry sector to IDR 19.3 trillion by 2030
SOURCE: team analysis
0
5
10
15
20
Business as usual
EnvironmentallySustainableDevelopmentStrategy
2030252015102005
East Kalimantan’s real GDP forecast IDR Trillions CAGR
5%
-1%

54
DRAFT
Exhibit 32 Utilizing trees fully can increase the value from logging activities and decrease harvesting waste
Veneer, ply-saw
nwood
Veneer, ply-saw
nwood
Pulp w
oodW
ood pellets
SOURCE: Institute of Forest Utilization Freiburg, team analysis
Not utilized
Conventional utilization Full tree utilization
ILLUSTRATIVE
cubic meters per ha is achieved in other parts of Indonesia. Given differences in soil quality, a more conservative range of 25 to 30 cubic meters per ha is targeted.
Increased yields could also come from bringing idle plantations back into production. At present, East Kalimantan’s pulpwood plantations cover an area of approximately 800,000 ha, the majority of which were established during the 1990s. In line with current environmental regulations, approximately 160,000 ha have to be set aside for nature conservation (e.g., watershed protection and wildlife corridors) while the remaining area could be used for economic purposes. In theory, these 640,000 ha could yield an annual volume of approximately 23 million cubic meters,17 more than enough to supply a viable forest products industry. However, currently only 165,000 ha are actually planted, while the remaining area is degraded, and lies idle. Low productivity, and this low rate of planting mean East Kalimantan’s annual harvest is only 0.7 million cubic meters. The continued conversion of natural forests into plantations is unnecessary for growth in the sector. Instead of expanding the overall plantation area, the focus should be on improving yieldsand ensuring that the area set aside for industrial timber plantations is fully utilized. Realizing this approach could increase annual sustainable wood production and the economic contribution from production forests by a factor of ten.
Downstream manufacturing (IDR 8.5 trillion): Several opportunities exist for the industry to move downstream into higher value-added production businesses. Based on future market developments, the largest opportunities are likely to be in pulp and paper and wood pellet production, which ideally would be located in close proximity of each other to lower costs of logistics, raw material, and energy. Additional opportunities for niche companies exist in production of high-value furniture (EXHIBIT 33).
17 Assuming plantations planted with Acacia maginum and Eucalyptus species
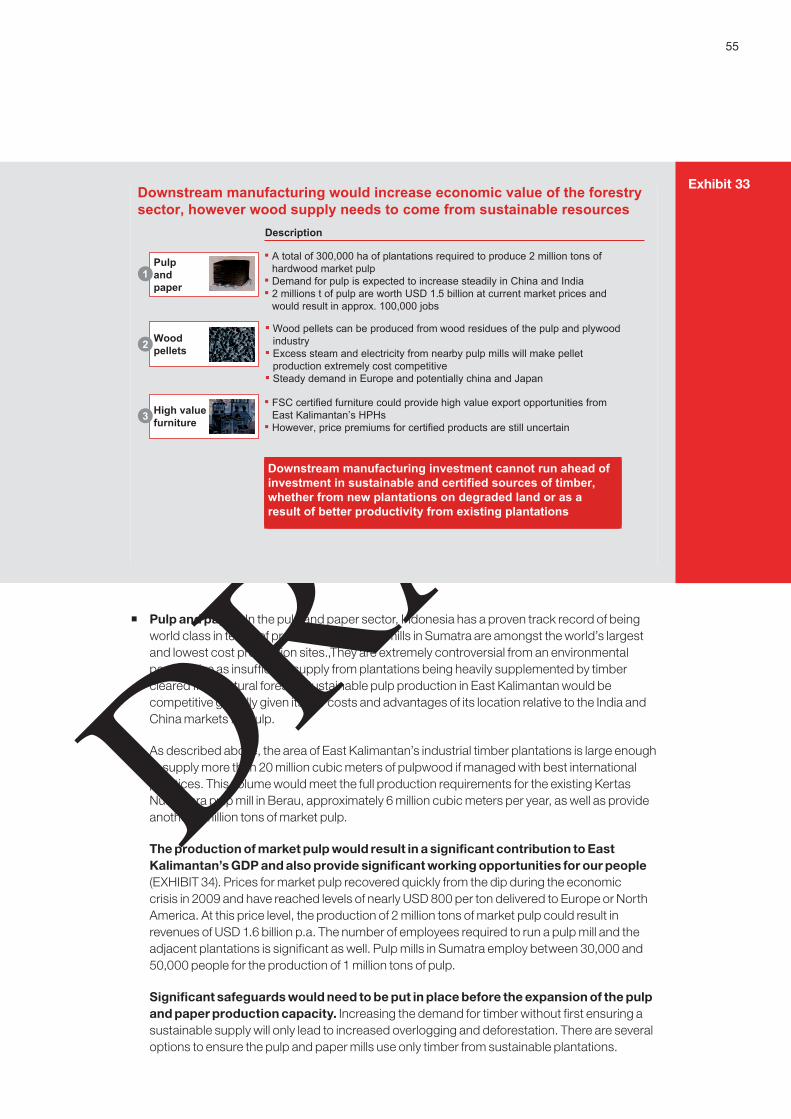
55
DRAFT
Pulp and paper: In the pulp and paper sector, Indonesia has a proven track record of being world class in terms of production. The pulp mills in Sumatra are amongst the world’s largest and lowest cost production sites.,They are extremely controversial from an environmental perspective as insufficient supply from plantations being heavily supplemented by timber cleared from natural forests. Sustainable pulp production in East Kalimantan would be competitive globally given its low costs and advantages of its location relative to the India and China markets for pulp.
As described above, the area of East Kalimantan’s industrial timber plantations is large enough to supply more than 20 million cubic meters of pulpwood if managed with best international practices. This volume would meet the full production requirements for the existing Kertas Nusantara pulp mill in Berau, approximately 6 million cubic meters per year, as well as provide another 2 million tons of market pulp.
The production of market pulp would result in a significant contribution to East Kalimantan’s GDP and also provide significant working opportunities for our people (EXHIBIT 34). Prices for market pulp recovered quickly from the dip during the economic crisis in 2009 and have reached levels of nearly USD 800 per ton delivered to Europe or North America. At this price level, the production of 2 million tons of market pulp could result in revenues of USD 1.6 billion p.a. The number of employees required to run a pulp mill and the adjacent plantations is significant as well. Pulp mills in Sumatra employ between 30,000 and 50,000 people for the production of 1 million tons of pulp.
Significant safeguards would need to be put in place before the expansion of the pulp and paper production capacity. Increasing the demand for timber without first ensuring a sustainable supply will only lead to increased overlogging and deforestation. There are several options to ensure the pulp and paper mills use only timber from sustainable plantations.
Exhibit 33Downstream manufacturing would increase economic value of the forestry sector, however wood supply needs to come from sustainable resources
Description
High valuefurniture3
! FSC certified furniture could provide high value export opportunities from East Kalimantan’s HPHs
! However, price premiums for certified products are still uncertain
! Wood pellets can be produced from wood residues of the pulp and plywood industry
! Excess steam and electricity from nearby pulp mills will make pellet production extremely cost competitive
! Steady demand in Europe and potentially china and Japan
Wood pellets2
Pulpand paper
1! A total of 300,000 ha of plantations required to produce 2 million tons of
hardwood market pulp! Demand for pulp is expected to increase steadily in China and India! 2 millions t of pulp are worth USD 1.5 billion at current market prices and
would result in approx. 100,000 jobs
Downstream manufacturing investment cannot run ahead of investment in sustainable and certified sources of timber, whether from new plantations on degraded land or as a result of better productivity from existing plantations
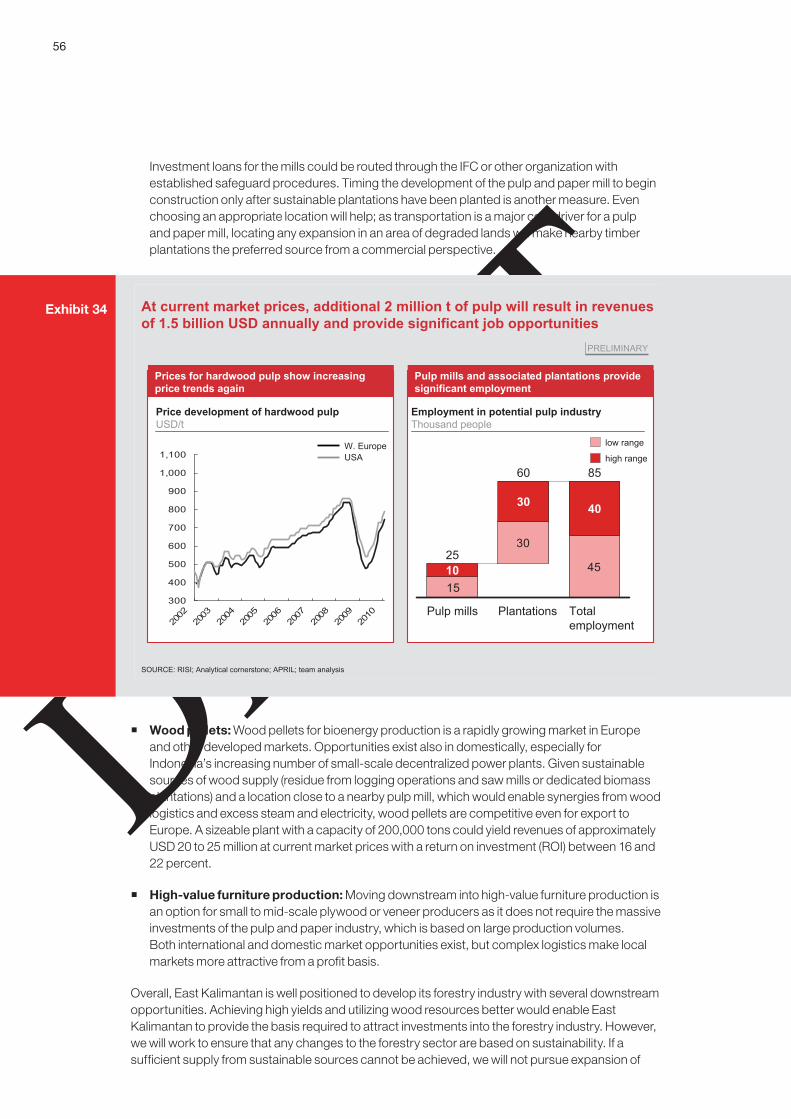
56
DRAFT
Investment loans for the mills could be routed through the IFC or other organization with established safeguard procedures. Timing the development of the pulp and paper mill to begin construction only after sustainable plantations have been planted is another measure. Even choosing an appropriate location will help; as transportation is a major cost driver for a pulp and paper mill, locating any expansion in an area of degraded lands will make nearby timber plantations the preferred source from a commercial perspective.
Wood pellets: Wood pellets for bioenergy production is a rapidly growing market in Europe and other developed markets. Opportunities exist also in domestically, especially for Indonesia’s increasing number of small-scale decentralized power plants. Given sustainable sources of wood supply (residue from logging operations and saw mills or dedicated biomass plantations) and a location close to a nearby pulp mill, which would enable synergies from wood logistics and excess steam and electricity, wood pellets are competitive even for export to Europe. A sizeable plant with a capacity of 200,000 tons could yield revenues of approximately USD 20 to 25 million at current market prices with a return on investment (ROI) between 16 and 22 percent.
High-value furniture production: Moving downstream into high-value furniture production is an option for small to mid-scale plywood or veneer producers as it does not require the massive investments of the pulp and paper industry, which is based on large production volumes. Both international and domestic market opportunities exist, but complex logistics make local markets more attractive from a profit basis.
Overall, East Kalimantan is well positioned to develop its forestry industry with several downstream opportunities. Achieving high yields and utilizing wood resources better would enable East Kalimantan to provide the basis required to attract investments into the forestry industry. However, we will work to ensure that any changes to the forestry sector are based on sustainability. If a sufficient supply from sustainable sources cannot be achieved, we will not pursue expansion of
Exhibit 34
SOURCE: RISI; Analytical cornerstone; APRIL; team analysis
300
400
500
600
700
800
900
1,000
1,100
2002
2003
2004
2005
2006
2007
2008
2009
2010
30
45
15
Total employment
Pulp mills Plantations
25
30
10
60
40
85
Employment in potential pulp industryThousand people
Price development of hardwood pulpUSD/t
W. EuropeUSA
low range
high range
PRELIMINARY
At current market prices, additional 2 million t of pulp will result in revenues of 1.5 billion USD annually and provide significant job opportunities
Prices for hardwood pulp show increasing price trends again
Pulp mills and associated plantations provide significant employment

57
DRAFT
downstream manufacturing as it would result in further deforestation and forest degradation, as has happened in other provinces.
Required Policies and Institutions
Several critical enablers are needed to implement the identified initiatives for reducing emissions and increasing GDP in the forestry sector. Four critical enablers have been identified. These include a new spatial planning approach, regulatory changes and enforcement, capacity-building to successfully implement sustainable forestry practices, and implementation of a reliable and up-to-date monitoring, reporting and verification system, which would be supported by the new forest management units.
Spatial planning: The existing spatial planning approach of East Kalimantan does not take into account climate change or ecological criteria. For example, forested areas are allocated to non-forestry use (Areal Penggunaan Lain, APL), while large areas of degraded land within the forest estate (kawasan hutan) are officially designated (and therefore managed) as permanent forest areas. Going forward, a broader spatial planning approach is required that incorporates environmental, economic, and social factors. The main goal for the new spatial planning approach should be to identify degraded areas (including the size of the area, soil type, suitability for different land uses, land ownership, and current land use) outside and inside the forest estate. This will enable the prioritized use of degraded land for economic development. The permanent forest estate should comprise actual remaining forests. Spatial planning consequently has to happen in much closer cooperation between the local planning agency (Bappeda), the Indonesian Ministry of Forestry, and local communities.
Regulatory changes: Current legislation regulating harvesting practices in Indonesia does not support sustainable forest management as it only focuses on volumes of merchantable timber and doesn’t address the overall felling and skidding process. To be able to enforce RIL those regulations have to be broadened to consider the complete harvesting process. A new regulation published in 2009 by the Ministry of Forestry is trying to address sustainability, however the regulation is vague and not strong enough to enforce RIL. In addition, current regulations prohibit the felling of smaller trees for commercial purposes, i.e., those below 50 cm diameter at breast height (dbh). Changing those regulations would allow thinning, which can help focus the forest’s future growth on the most valuable trees by providing enough light and space to foster natural regeneration. If properly done, thinning and improved natural regeneration result in higher growth rates and therefore better carbon sequestration. However, thinning and other intensive silvicultural treatments result in a loss of biodiversity as they focus on a small number of high valuable tree species and not necessarily on biodiversity. In the long term we need to seriously consider a complete replacement of logging in natural forests by sustainable timber plantations.
Law enforcement: Illegal logging – in the form of large-scale forest conversions into plantations without legal permits, logging levels exceeding the target given by the Ministry of Forestry, and illegal smallholder activities – remains rampant in East Kalimantan and is leading to high levels of deforestation and forest degradation. In order to better enforce the law, we need to employ additional forest rangers for the newly established forest management units (KPH), and ensure strict and visible consequences for illegal action, e.g., high fines and long jail terms.
Monitoring, reporting, and verification (MRV): All of the above efforts should be supported by an MRV system to assess the emission reduction efforts and to measure, report, and verify the impact of those efforts to a nationwide MRV system. In order to reduce transaction costs and increase the likelihood of carbon reduction projects attracting international carbon market payments for verified emission reductions, it is critical that the provincial government incorporates methodologies that have already been independently verified, are in line with national government regulation, and allow the establishment of a province-wide approach that includes local communities. Local communities could play a key role in ground-truthing satellite images in the field, which would also create additional jobs and increase income in local communities.
58
DRAFT
AGRICULTURE SECTOR
Agriculture remains an important part of East Kalimantan’s development and is one of the most important opportunities to improve rural livelihoods. Although agriculture, excluding palm oil, represents only 4 percent of East Kalimantan’s overall GDP, in some rural districts it accounts for 20 percent of GDP. Its impact on rural communities is even broader as it accounts for almost 20 percent of total employment. By bringing jobs and incomes to rural households, which are typically poorer than the average household in East Kalimantan, agriculture is one of the most effective anti-poverty economic development strategies; by some estimates, a 1 percent increase in agricultural GDP can translate into 6 percent more spending for rural households. Yet, current agricultural practices also led to significant emissions from land use, and there are substantial opportunities to reduce the sector’s carbon footprint. In this section, the agricultural sector includes both production of food crops and estate crops but excludes palm oil, which is addressed in a separate section given its disproportionate size and growth.
Current Context
East Kalimantan’s agricultural sector is divided into food crops, dominated by rice production, and estate crops. Over 178,000 ha of agricultural lands are planted with food crops, often for subsistence farming. Rice is by far the largest food crop, accounting for almost 90 percent of production by hectare. Estate crops, excluding palm oil, are roughly equal in area to food crops with 181,000 ha planted. Rubber, followed by cocoa and coconuts, are the largest crops accounting for 80 percent of planted areas. Compared to Java and Sumatra, agriculture is small in East Kalimantan, taking up just 2 percent of land and 4 percent of GDP, but is still important for rural communities.
Agricultural practices differ substantially by type of farming in East Kalimantan. There are four main types of farming in East Kalimantan, upland food crop production, lowland food crop production, perennial estate crop production, and swidden or shifting cultivation. These are not mutually exclusive as individual farmers engage in multiple types of farming. Lowland farming is dominated by irrigated paddy rice fields and common among Javanese migrants. Upland farming is conducted in rainfed, hilly areas; again rice is the most common crop, but its yield is almost half that of lowland rice. Perennial estate crop farming practices differ by the type of crop. For example, the pepper plantations common among Buginese migrants are typically developed for three to five years, after which the soil is depleted and must be restored or abandoned for new farmland. Rubber plantations, by contrast, take 10 to 15 years to reach peak productivity. Swidden or shifting cultivation involves the clearing of agricultural or forest land, typically by fire, cultivating the land for a short period until fertility or weeds decrease productivity, then shifting to a new area, eventually rotating back through fields as they have been restored. While conventional wisdom holds that shifting cultivation is a major force of deforestation and is inherently unsustainable, its impact depends on the length of the rotation. The swidden agricultural practices by Dayak tribes are considered more sustainable given their long rotation periods compared to swidden practices on lowland, smallholder estate crops, which have shorter periods.
Agriculture accounted for substantial emissions of 52 MtCO2e in 2005, primarily from its expansion into forests and peatlands. Agricultural processes, such as the fuel used to run farm equipment and transport crops, and methane release from flooded rice paddies, account for only 3.2 MtCO2e currently. The other 94 percent of emissions are due to the opening up of forest land for new agriculture (9.4 MtCO2e), use of fires to clear land and their spread and subsequent destruction of abandoned lands (31 MtCO2e), and peat decomposition from active and abandoned peatlands which have been opened and drained for agriculture (8 MtCO2e). These emissions are greatest in the districts of Nunukan, Kutai Kertanegara, and Kutai Barat, respectively.
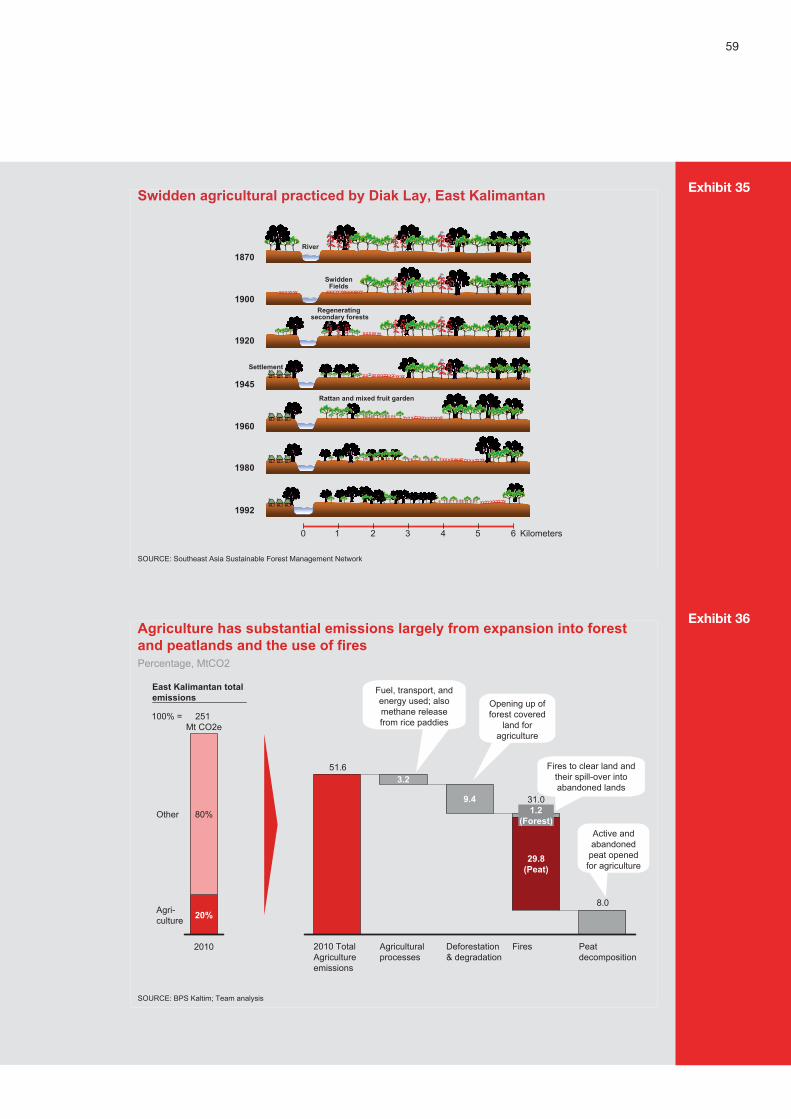
59
DRAFT
Exhibit 35
Exhibit 36
SOURCE: Southeast Asia Sustainable Forest Management Network
Swidden agricultural practiced by Diak Lay, East Kalimantan
0 1 2 3 4 5 6 Kilometers
River1870
1900
1920
1945
1960
1980
1992
SwiddenFields
Regenerating secondary forests
Settlement
Rattan and mixed fruit garden
Agriculture has substantial emissions largely from expansion into forest and peatlands and the use of fires
SOURCE: BPS Kaltim; Team analysis
Percentage, MtCO2
100% =
Agri-culture
Other
2010
251 Mt CO2e
20%
80%
8.0
51.6
Peat decomposition
Fires
31.0
29.8(Peat)
1.2(Forest)
Deforestation & degradation
9.4
Agricultural processes
3.2
2010 Total Agriculture emissions
Fuel, transport, and energy used; also methane release from rice paddies
Opening up of forest covered
land for agriculture
Fires to clear land and their spill-over into abandoned lands
Active and abandoned
peat opened for agriculture
East Kalimantan total emissions

60
DRAFT
Abatement Potential
Agriculture can decrease its current CO2 footprint by 24 MtCO2 by 2030 through a policy of zero burning and the rehabilitation of peatlands. Smallholder fires represent a significant source of emissions. A zero burning policy could deliver 18.5 MtCO2 at a cost of USD 0.40 per ton (excluding implementation costs) through a program of alternative land clearing methods, rigorous fire prevention, and the use of local fire fighting brigades. Rehabilitating degraded peatlands that were opened for agriculture and then abandoned will provide 5.4 MtCO2 of abatement at a cost of USD 5.20 per ton.
A zero burning policy can reduce emissions from forest fires by prohibiting fire as a tool for land preparation, establishing fire brigades, and ensuring strong enforcement and large penalties for rule violations. On average, 250,000 hectares of land in East Kalimantan are burned each year. Pristine forest is virtually fire-proof, so the complementary strategy is to prevent land conversion of intact forests. Active agricultural lands are burned to prepare for planting, so fire prevention strategies would include investments in alternative tools for land clearing and training. These strategies should also aim to remove regulatory incentives that encourage fire clearing as a means to prove ‘active cultivation’ for the purpose of retaining concessions or proving ownership. Abandoned lands are quite vulnerable to fires that spread from active lands. Thus, an important element of fire fighting strategies is the expansion of community fire brigades which can quickly identity and deal with fire hot spots.
Rehabilitating peatlands can be done by adjusting and maintaining the water table at a more sustainable level and through reforestation and wetting of degraded peatland that has little food or feed production value. Smallholder agriculture requires draining peatlands by 50 cm on average, which results in exposed peat that reacts with oxygen and releases CO2e. For one ha of a smallholder plot, an average of 27 tCO2e is released annually assuming a drainage level of 50 cm. Building dam systems and applying best practices in water management can lead to a less destructive way of peatland utilization to a more sustainable level.
Pilots
Almost 80 percent of the abatement opportunities can be captured by focusing on pilot districts with the highest emissions. The four districts of Nunukan, Kutai Kertanegara, Kutai Barat, and Kutai Timur account for 80 percent of the 18.5 MtCO2 potential abatement from implementing a zero burning policy. Nunukan’s fires, for example, are largely concentrated in two areas of about 60,000 ha near to and on peatlands. One command post and six brigades could likely cover most of the district’s fires. Whereas in Kutai Kertanegara, fires are spread across wide areas, likely raising costs above the provincial average. Within this district, fire prevention brigades should focus on the 700,000 ha of land that is mostly degraded peat and thus susceptible to fire and large emissions. In terms of abatement from rehabilitating abandoned peatlands, 80 percent of the potential abatement will come from the four districts of Nunukan, Kutai Kertanegara, Kutai Barat, and Bulungan. These potential pilot projects have been identified based on abatement potential; a finalized list of pilots would also need to assess criteria such as types of farmers in each area and community support.
GDP Potential
There is an opportunity to increase the value added from agriculture by boosting yields, which could yield IDR 3.2 trillion in additional GDP by 2030. East Kalimantan’s yields on major food crops, such as rice and cassava, are 60 percent below best practice yields in Java and Sumatra. This is partially due to the difference in soil quality: East Kalimantan lacks the rich volcanic soils of Sumatra for example. However, low yields are caused not only by poor soil conditions, but also from low access to inputs such as fertilizers, seeds, and farming equipment. Even compared to the yields across all of Indonesia, East Kalimantan’s production is still 20 percent below average production (EXHIBIT 40). If East Kalimantan could raise its agricultural yields to the average yield level in Indonesia, it could increase the annual growth of its agricultural GDP from 3 percent to 6

61
DRAFT
Exhibit 37
Exhibit 38
Although East Kalimantan has far fewer fires than its neighbors, a substantial amount of land is still burned each year
SOURCE: WRI Interactive Atlas of Indonesia Forests
Yet on average 250,000 ha of land is burned a yearHa burned land, East Kalimantan
East Kalimantan has significantly fewer fires than its neighborsHotspots 2003-2007
108,600
208,200
660,300
74,500
280,000
175,200
Ø
2003 04 05 06 07 2008
West Kalimantan
South Kalimantan
East Kalimantan
Central Kalimantan 72,843
12,400
55,035
13,982
Zero burning policy must be tailored to different types of land
Intact forest
•Intact tropical forest is virtually fire-proof. Almost of all fires in East Kalimantan occur in logged over and degraded lands
•Strategy: No conversion
•Maintain intact forests and fully hydrated peatlands protects them against fires
Active agricultural land
•Fire is a traditional and cheap land-clearing tool
•It is also used to show cultivation to maintain/prove ownership
•Strategy: Fire prevention
•Invest in alternative land clearing tools and training
•Remove regulatory incentives that allow fire clearing to prove active cultivation to retain concessions
Abandoned agricultural land
•Fires set to clear active lands spill over into abandoned lands
•Degraded peatland and forests are very vulnerable to fire
•Strategy: Fire fighting
•Create local community fire brigades in hot spots
•Invest in wells and tools to fight peat fires requiring treatment below the surface
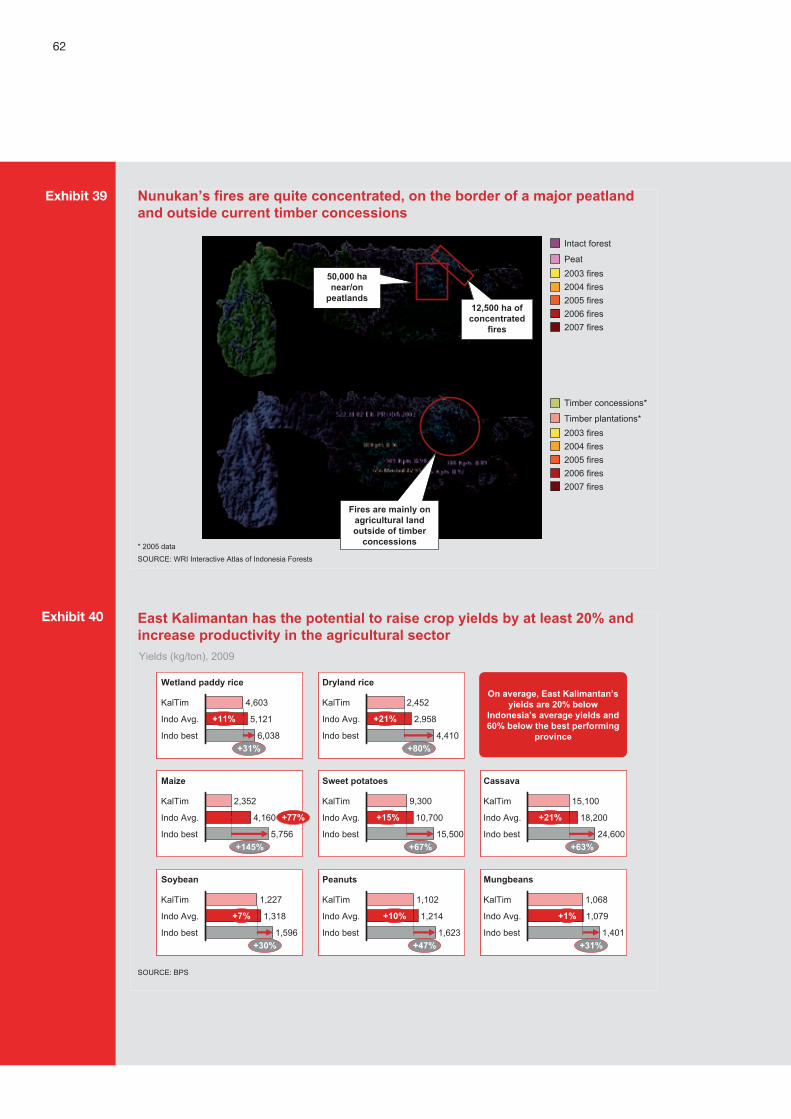
62
DRAFT
Exhibit 39 Nunukan’s fires are quite concentrated, on the border of a major peatlandand outside current timber concessions
* 2005 data
SOURCE: WRI Interactive Atlas of Indonesia Forests
Intact forest
Peat2003 fires2004 fires2005 fires2006 fires2007 fires
Timber concessions*
Timber plantations*2003 fires2004 fires2005 fires2006 fires2007 fires
Fires are mainly on agricultural land outside of timber
concessions
50,000 ha near/on
peatlands12,500 ha of concentrated
fires
East Kalimantan has the potential to raise crop yields by at least 20% and increase productivity in the agricultural sector
SOURCE: BPS
6,038
5,121
Indo best
Indo Avg.
KalTim 4,603
+31%
+11%
Wetland paddy rice
5,756
4,160
Indo best
Indo Avg.
KalTim 2,352
+145%
+77%
Maize
1,596
1,227
Indo best
Indo Avg. 1,318
KalTim
+30%
+7%
Soybean
4,410
2,958
Indo best
Indo Avg.
KalTim 2,452
+80%
+21%
Dryland rice
15,500
10,700
Indo best
Indo Avg.
KalTim 9,300
+67%
+15%
Sweet potatoes
1,623
1,102
Indo best
Indo Avg. 1,214
KalTim
+47%
+10%
Peanuts
Indo best
18,200
KalTim 15,100
Indo Avg.
24,600
+21%
+63%
Cassava
KalTim 1,068
1,079
Indo best
Indo Avg.
1,401+31%
+1%
Mungbeans
Yields (kg/ton), 2009
On average, East Kalimantan’s yields are 20% below
Indonesia’s average yields and 60% below the best performing
province
Exhibit 40
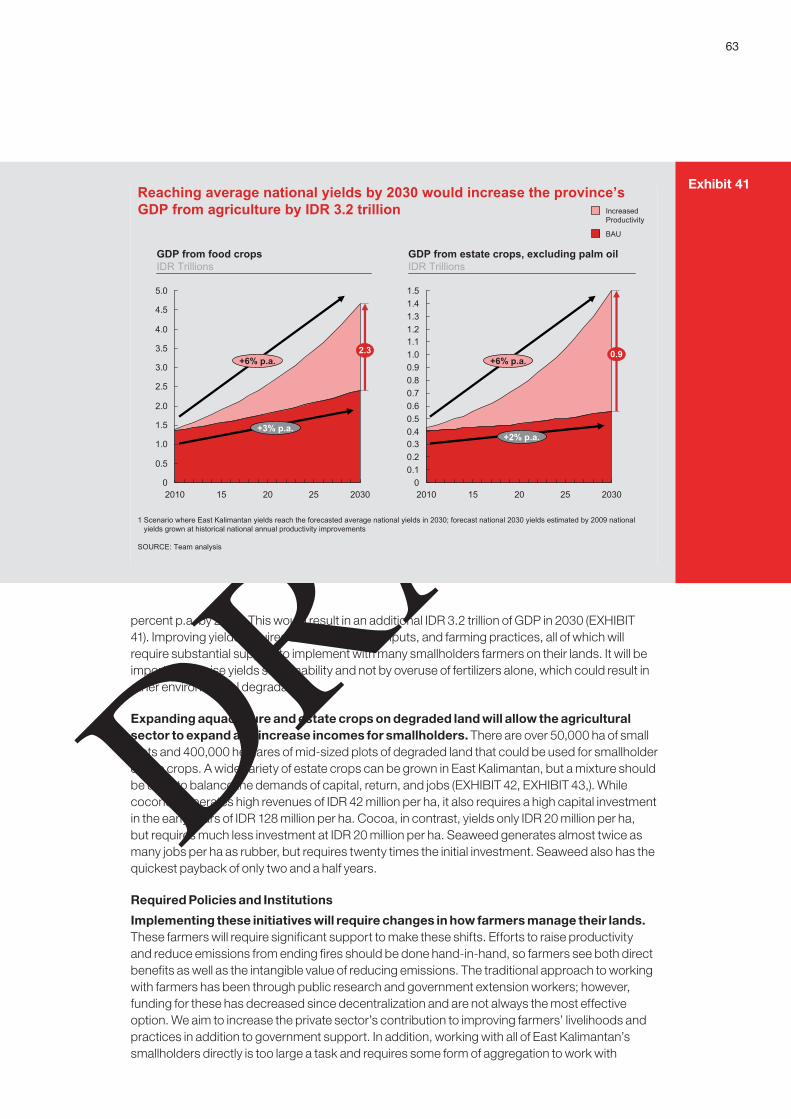
63
DRAFT
percent p.a. by 2030. This would result in an additional IDR 3.2 trillion of GDP in 2030 (EXHIBIT 41). Improving yields requires better seedlings, inputs, and farming practices, all of which will require substantial support to implement with many smallholders farmers on their lands. It will be important to raise yields sustainability and not by overuse of fertilizers alone, which could result in other environmental degradation.
Expanding aquaculture and estate crops on degraded land will allow the agricultural sector to expand and increase incomes for smallholders. There are over 50,000 ha of small plots and 400,000 hectares of mid-sized plots of degraded land that could be used for smallholder estate crops. A wide variety of estate crops can be grown in East Kalimantan, but a mixture should be used to balance the demands of capital, return, and jobs (EXHIBIT 42, EXHIBIT 43,). While coconut generates high revenues of IDR 42 million per ha, it also requires a high capital investment in the early years of IDR 128 million per ha. Cocoa, in contrast, yields only IDR 20 million per ha, but requires much less investment at IDR 20 million per ha. Seaweed generates almost twice as many jobs per ha as rubber, but requires twenty times the initial investment. Seaweed also has the quickest payback of only two and a half years.
Required Policies and Institutions
Implementing these initiatives will require changes in how farmers manage their lands. These farmers will require significant support to make these shifts. Efforts to raise productivity and reduce emissions from ending fires should be done hand-in-hand, so farmers see both direct benefits as well as the intangible value of reducing emissions. The traditional approach to working with farmers has been through public research and government extension workers; however, funding for these has decreased since decentralization and are not always the most effective option. We aim to increase the private sector’s contribution to improving farmers’ livelihoods and practices in addition to government support. In addition, working with all of East Kalimantan’s smallholders directly is too large a task and requires some form of aggregation to work with
Exhibit 41
0
0.5
1.0
1.5
2.0
2.5
3.0
3.5
4.0
4.5
5.0
2010 2030252015
2.3
00.10.20.30.40.50.60.70.80.91.01.11.21.31.41.5
25 203015 202010
0.9
Reaching average national yields by 2030 would increase the province’s GDP from agriculture by IDR 3.2 trillion
SOURCE: Team analysis
GDP from food cropsIDR Trillions
GDP from estate crops, excluding palm oilIDR Trillions
+2% p.a.
1 Scenario where East Kalimantan yields reach the forecasted average national yields in 2030; forecast national 2030 yields estimated by 2009 national yields grown at historical national annual productivity improvements
+6% p.a.
BAU
IncreasedProductivity
+6% p.a.
+3% p.a.

64
DRAFT
Exhibit 42 New pockets of environmentally sustainable growth can be developed from agriculture and aquaculture on already degraded land
SOURCE: East Kalimantan Investment Board
Rubber! Total suitable area: 3.29
million Ha ! Main commodities: Latex! Investment: IDR 94
Billion! NPV: IDR 176 Billion! Payback: 10 year
Cocoa! Main commodities:
Forastero (bulk cocoa), criolo (fine cocoa), and hybrid cocoa
! Investment: IDR 1,200 Billion
! NPV: IDR 160 Billion! Payback: 8 year
Pepper! Main commodities:
Pepper for food industry and pharmacy
! Investment: IDR 0.04 Billion
! NPV: IDR 0.03 Billion ! Payback: 3 year
Coffee! Main commodities:
Robusta coffee! Government has
established SasambaZone (in Balikpapan and Kutai Kertanegara) as integrated development zone for coffee export
Livestock! Main commodities: Beef! Local demand is 36,000
cattle/year, existing local supply is only 3,000 cattle/year; National demand is 491,200 cattle/year
Oranges! Main commodities:
Premium borneo orange! Premium commodity of
East Kalimantan! High productivity: 20-25
kg/tree! Investment: IDR 0.4
Billion
Fishery! Suitable area for fishery:
72.24 million Ha! Main commodities:
Tuna, Kakap, Cakalang, Kuri, Bawal, UdangWindu, Lobster
! Investment: IDR 2.7 Billion
! NPV: IDR 1.7 Billion
Seaweed! Main commodities:
seaweed for food, cosmetics, and medicine
! Investment: IDR! 1.1 Billion ! NPV: IDR 1.5 Billion! Payback: 3 years
Pineapple! Main commodities:
Srikaya Pineapple! Investment: IDR 0.05
Billion! NPV: IDR 0.02 Billion! Payback: 2 years
A wide variety of estate crops with different characteristics and returns can be developed in East Kalimantan
SeaweedOrangeRubber
Revenue (IDR Million/ha) 0 100
Investment required(IDR Million/ ha)* 0 150
Jobs (Workers/ha)
0 2
Characteristics of crops in East Kalimantan
Source: Regional Investment and Permittance Board of East Kalimantan Province
Cocoa
40.4
39.1
Payback period (years)
0157.6
IRR(%) 0 39
Coconut
19.5
19.4
1.5
35
7.7
0.9
25.9
11.8
28
10
1.0
42.0
128.7
1.2
31
9.1
75.9
66.4
1.7
31
2.5
40
Exhibit 43
65
DRAFT
farmers . We have identified several important enablers for the agricultural sector including spatial planning, technology, farmer productivity, market access, and MRV. An agricultural transformation depends on all parts of the agricultural system working together; while each element can improve the agricultural sector’s production and abatement, a sustainable solution requires all elements working together.
In order to support the growth of the agricultural sector, spatial planning should focus on identifying several ‘breadbasket’ areas. A breadbasket strategy aims at a breakthrough in food production in certain defined geographic areas. Breadbaskets are defined as agricultural areas with potentially high productivity for specific food crops, good market access potential, and relatively high rural population density. In addition, to support East Kalimantan’s goal to reduce CO2e emissions, these breadbaskets should also be located in areas with degraded lands or grasslands to prevent further deforestation. By identifying breadbasket regions, agricultural expansion can be focused in the areas with highest potential as well as lowest emissions.
Nucleus-Plasma schemes (Perkebunan Inti Rakyat) are an important tool to raise yields of smallholder estate crops located near major plantations. Nucleus-plasma programs have been developed for palm oil plantations but could be expanded to other, high-value estate crops. The programs work by having plantation companies develop palm oil plots for smallholders in a ‘plasma’ area around their own plantation ‘nucleus’. The management of the plasma area is run by a cooperative of the smallholders, which typically contracts technical functions back to the nucleus plantation company, thus growers often work as laborers on their plots. The smallholders receive seedlings, inputs such as fertilizers, and often a guaranteed price for their produce. These schemes have worked in East Kalimantan, and plasma smallholders have yields twice as high as independent palm oil smallholders. But the plasma schemes do have weaknesses as they can interfere with traditional community management of lands (adat) as well as change traditional land ownership patterns. Plasma schemes could be expanded to other high-value estate crops; for less profitable estate crops, government subsidies may be needed to get private sector support for such programs.
Capability building can be achieved by creating a limited number of aggregation units operated by private local change agents (e.g., local entrepreneurs and farmers as well as small warehouse operators on the post-harvest side) whom government, donors, input/off-take companies, and banks can work with and who in turn will aggregate and extend support to lead farmers and or farmer groups and individual smallholders on the production side. One option is to develop Agriculture Centers that will perform three types of activities: (i) offer off-take from farmer groups; (ii) provide inputs on credit; and (iii) provide services (e.g., tractor services, storage). Each Agriculture Center should have a large warehouse facility. International examples suggest it could serve farmers within a 20 km radius and work with about 200 to 300 lead farmers who would in turn aggregate about around 5,000 smallholders overall. These centers should be placed in agricultural breadbasket areas with sufficiently dense smallholder populations; based on current agricultural lands, number of smallholders, and infrastructure or market access, potential pilots could be in Kutai Kertanegara, Kutai Timur, and Penajam Paser Utara.
Extension services are still an important government program to supporting smallholders, particularly in isolated regions. Private sector cooperation with farmers is often limited to those with high-value estate crops who are located in the lowlands near plantations and processing facilities. Thus, government extension workers are still important, particularly to provide access to credit, seeds, and technology to smallholders growing food crops and located in the more remote interior of East Kalimantan. Both the budget and number of extension service workers has fallen in Indonesia; today Indonesia has roughly 6 extension service workers per 10,000 farmers, compared to China, which has a ratio of 16 per 10,000. Moving to China’s benchmark, East Kalimantan would need an additional 200 extension workers.

66
DRAFT
Real-time and publicly available MRV systems are needed to help communities fight fires. While the zero burningpolicies will help with fire prevention, inevitably some man-made fires will continue, and the community fire brigades will need to focus on extinguishing them. While watchtowers are an effective local means of monitoring, satellite detectors can identify remote fires or larger fires that will require support from the district and province to help suppress. There are already existing tools, such as the online IndoFire service, which are publicly available and can be used to support this monitoring.
COAL SECTOR
Coal mining has long been a source of tension in development plans. Coal’s value attracts substantial investment to East Kalimantan, and it provides significant tax revenues and contributes to GDP. Yet, coal mining provides few jobs compared to labor-intensive manufacturing or agriculture. If done poorly, mining can leave huge environmental consequences. Still, coal is a central part of East Kalimantan’s economy and will remain so for decades. This strategy aims to improve its efficiency and seek measures to minimize its destructive impacts.
Current Context
East Kalimantan has several mineral resources, but coal mining dominates production. While there remain an estimated 50 million tons of gold and silver, there has been very limited gold and silver production since the closure of the PT KEM mine in 2004. East Kalimantan has substantial coal reserves, estimated to be 3.6 billion tons, equal to 19 percent of Indonesia’s total. Thus, virtually all mining today is for coal. The majority of East Kalimantan’s coal is low in sulfur and ranges from low- to high-calorie (43 percent of reserves are within 6,100–7,100 CV range), which means East Kalimantan coal can be exported to both steel mills (which require high-calorie coal) as well as power plants.
Coal mining is a significant driver of East Kalimantan’s economy. From 2000 to 2008, coal production grew rapidly by 15 percent p.a., raising its contribution to total GDP from 8 percent to 20 percent. Production has already reached 119 million tons and some infrastructure, such as ports, are reaching their limits. Going forward, growth in coal production is expected to slow to 5 percent, as infrastructure constraints and concession limits are reached, in line with Indonesia’s average. (Box 4 discusses concession types.) At this rate, by 2030, the coal mining sector will account for a significant 31 percent share of the provincial real GDP.
Coal mining in East Kalimantan contributes significant emissions, mainly through its associated deforestation, which are estimated to be 27 MtCO2e in 2010. These emissions are equivalent to 11 percent of East Kalimantan’s total emissions. Most emissions from coal mining are due to deforestation to open up areas for mining exploration and production, not the mining processes themselves. As each hectare of deforested land emits over 800 tons of CO2e, the deforestation due to mine opening accounts for 68 percent of the emissions from the coal sector, while the mining process itself (such as digging, crushing, and transport) contributed only 21 percent of total emissions. The remaining 11 percent of emissions comes from methane that is released from the coal seam as it is mined. As the coal sector is growing, emissions will likely grow by 2 percent p.a. and reach 41 MtCO2e by 2030, equivalent to 12 percent of the province’s total emissions.
Deforestation is high as most miners use open pit mining, which strips the surface of the concession. Underground mining could avoid much of this deforestation, but it is unfeasible in East Kalimantan. Virtually all coal reserves in East Kalimantan are shallow, making underground mining technically unfeasible. Furthermore, mining in East Kalimantan is dominated by small companies, which lack the sophisticated equipment, knowledge, and funding to implement underground mining, which has much greater safety risks. Of 301 coal mining companies in East Kalimantan, only 2 have employed underground mining, i.e., Kitadin and Fajar Bumi Sakti.
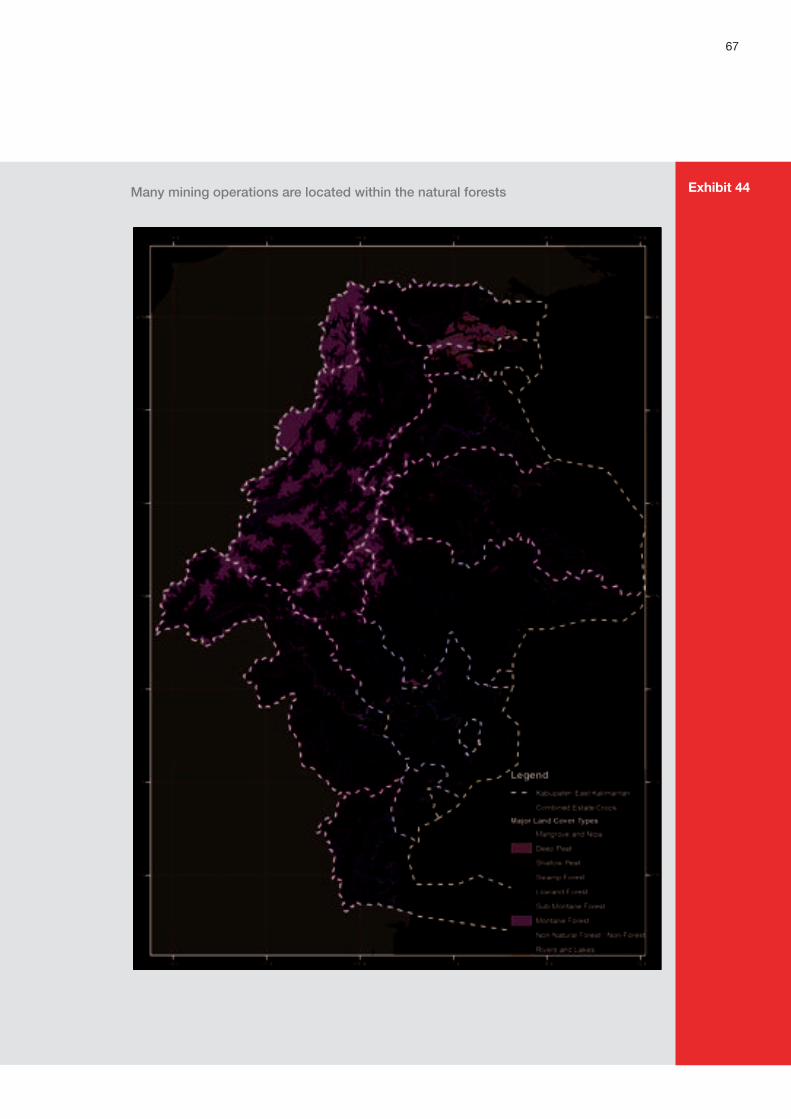
67
DRAFT
Exhibit 44
Many mining operations are located within the natural forests

68
DRAFT
Exhibit 45
Deforestation contributes more CO2 emissions than the direct mining process
Most emissions from the coal sector are due to deforestation to open the mining operation, not the process of mining
Source of emissionMillion Ton CO2e
SOURCE: Indonesia Abatement Cost Curve; Interviews; Simulation; Team analysis
30%36%
41100% =
Methane leakage
2020
34
Mining process
19%16%
2030
54%Deforestation
45%
2010
27
11%
21%
68%
Methane leakageAssociated gases released when the coal seam is opened up! 88.25% of emissions are methane – 20 times
more potent than CO2 as a greenhouse gas! Around 0.02 ton CO2e is emitted per ton coal
produced
BAU SCENARIO DeforestationTotal carbon loss from forested lands and soils that are stripped during the mining process! Around 800 ton CO2e is emitted per ha of
deforested area
Mining processEmission from energy consumption during mining process, e.g. for electricity and fuel ! Around 0.04 ton CO2e is emitted per ton coal
produced
A
B
C
The model assumes no new exploration permits would issued beyond year 2008, thus all new production permits would come from existing exploration concessions! Conversion rate: 90% of PKP2B exploration permits based on (1) ratio between average size of production and exploration concession and verified with
(2) ratio of max area allowed during production and exploration phase; 33% of KP exploration permits based on (1) ratio between average size of production and exploration concession and verified with (2) interviews
! Conversion duration: maximum 7 years of exploration as stipulated in the UU No 4/2009
PKP2Bs, KPs, and IUPs
Currently, there are two main types of coal concession in East Kalimantan, i.e., PKP2B (Perjanjian Karya Pengusahaan Pertambangan Batubara – Working Contract of Coal Mining Business) and KP (Kuasa Pertambangan – Mining Right). There are several differences between the PKP2Bs and KPs, however the key differences are their legal status and sizes. PKP2Bs are contracts between the central Government of Indonesia and relatively bigger mining companies. The average size of a PKP2B production concession is around 28,000 ha. PKP2Bs pay land rent and a ‘production share’ to the central government. On the other hand, KPs are permits awarded by local government to the relatively smaller mining companies. The average size of a KP production concession is around 1,000 ha. KPs pay land rent and a ‘production royalty’ to the local government.
Both PKP2B and KP are legal products prior to the new mining law, the UU No 4 Year 1999, which was actually issued in 2010. As per the new mining law, the Government of Indonesia now issues only IUP (Izin Usaha Pertambangan – Mining Business Permit). IUPs are analogous to KPs from the perspective of size (a maximum of 15,000 ha for production and 50,000 ha for exploration), status (a permit instead of contract), and financial obligations to governments (profit sharing). Yet, unlike the KPs, IUPs are to be awarded based on transparent tender process. Going forward, all new licenses will be IUPs. The law requires all existing KPs to be converted into IUPs by 2011. PKP2B contracts issued prior to the New Mining Law remain valid until their original contract expires.
Box 4

69
DRAFT
Unlike timber or oil palm plantations, only a portion of a mining concession is deforested. Initial mining concessions start with exploration or feasibility study permits. For large miners, these concessions typically shrink by 60 to 75 percent as they move to production concessions; this is the result of exploration identifying the actual areas with commercially recoverable coal. In addition, a land rent is charged based on the size of the production concession, which encourages companies to seek the minimum size required. The average production concession for a large miner is 28,000 ha; of this, typically 20 percent of the area is disturbed, meaning that the earth is dug up and all vegetation on the surface is destroyed. The average size of a production concession for small miners is just 1,000 ha. Typically 75 percent of this small area is disturbed. (See Box 5 for more about being a KP miner.) The small companies have a higher deforestation rate for two reasons. First, they have far smaller areas than big companies; therefore the proportion of forested land they clear is bigger. Second, the small companies have less sophisticated exploration equipment; therefore they are less targeted and systematic in clearing the forests. The amount of deforestation depends on the whether the disturbed land originally contained forests or already degraded lands.
Going forward, the deforestation rate will likely increase as new production concessions are increasingly likely to be awarded to small companies. In 2008, of the 1 million ha of licensed production concessions, around 192,000 ha have been deforested. Although small companies hold only 28 percent of the total area of production concessions, they account for 61 percent of the deforestation area. There are currently an additional 3 million ha worth of coal exploration licenses in East Kalimantan; given historical patterns, these would translate into an additional 1 million ha of production concessions by 2030, of which around 564,000 ha would be deforested. This implies an average deforestation rate of 56 percent of the total production area. The higher deforestation rate
Story of a KP Miner
Small miners face many challenges across the value chain in doing coal business in East Kalimantan. The challenges begin when the small miners apply for mining permits. Lack of transparency and lengthy bureaucracy of the application process create situations that are conducive for covert “transactions”. Many small miners complained about the “transactions” which are, in many cases, costly, uncertain, and risky.
Once the mining permit is obtained, the next challenge is securing land access. The small miners need to compensate the local communities who live on top of the mining deposit or convince the HPH companies who hold logging licenses for the area to allow them to access the land. The small miners also need to tackle the so-called land mafias and land speculators by themselves.
The challenges do not end after land access has been secured. During the mining operation, the small miners must still manage the local mafias. These local mafias sometimes disguise themselves as legitimate stakeholders: members of local communities that are disturbed by mining operation, NGOs which fight for the local communities, or even as government officials that come to collect some kind mining retribution (lack of clear regulation allows this to happen). Furthermore, theft is common during the transportation of coal from the site to the port (small miners do not build their own ports or roads, but utilize the publicly available roads and ports). At certain locations, thieves come and hop on to the coal truck or coal barge, take whatever they can, and then hop off.
Lack of infrastructure also causes problems for the small miners. When their coal arrives at a port, the small miners must wait for their turn to ship their coal. Many times at certain ports, when the water level is too low and no barge can come in, the waiting time can be very long.
All of the above challenges – combined with their small area under license and lack of equipment and knowhow – lead to low margins for the small miners. To survive, the small miners then try to find ways to cut costs, which often results in skimping on proper land reclamation and rehabilitation.
Box 5

70
DRAFT
predicted compared with the historical rate is because smaller coal mining companies will account for a higher share of future production based on the current pipeline of concessions.
Abatement Potential
Four abatement initiatives have been identified which could abate 50 percent of the coal sector’s total emissions. As deforestation is the largest source of emissions, the natural target for an abatement initiative is to stop deforestation; however, there are few good options to do this. Underground mining avoids large scale deforestation but it’s infeasible in East Kalimantan. Unlike palm oil or timber, coal concessions can not be swapped to degraded lands. Coal reserves are located where they are located, regardless of the forest cover above. Stopping all mining on forest lands without outside compensation would result in significant loss of GDP.
There is illegal mining in protected forest areas, and this should be stopped. It would reduce CO2e emissions by 27 percent to 11.3 MtCO2e. Next, efforts should focus on reducing emissions from the mining activities themselves. An increase in operational efficiency levels would reduce emissions by 2.6 MtCO2e. Reducing methane release could result in 4.8 MtCO2e emission reduction. Finally, the last strategy is to reverse deforestation emissions post mining. The enforcement of proper post-mining reclamation would save a further 2.01 MtCO2e. It is important to stress that avoiding unnecessary or poorly planned deforestation is a far more important abatement lever than enforcing proper reclamation of forests after mining concessions expire. Enforcing reclamation regulations is certainly necessary, but the new trees will need 80 to 100 years to restore the original area as a net carbon sink.
Stopping illegal mining in protected forest areas would see a 27 percent reduction equivalent to 11.3 MtCO2e. Vast areas of coal concessions are located in forest areas, some even within the protected forest estates. By some estimates, as much as 90 percent of the
Exhibit 46Four abatement levers have been identified that could save up to50% of East Kalimantan’s total emissions
1 Assuming 90% of existing and future production concessions located in: Hutan Lindung, Cagar Alam, Hutan Penelitian, Taman Nasional, and HutanRaya are illegal (based on existing PKP2B rate)
2 Assuming 100% reclamation rate is possible through enforcement3 Assuming 20% emission reduction could be gained from mining operation efficiency (expert estimate adjusted with the fact that majority of miners in
East Kalimantan are small players)4 Assuming 70% of methane release can be stopped (expert estimate)SOURCE: Interviews; Simulation; Team analysis
Source of emissions Abatement levers Description
Deforest-ation
Stop illegal mining ! Survey all forested lands, check licenses held by mining companies, and stop the operation if illegal
Methane release
Minimize methane release
! Reduce methane leakage by requiring methane flaring or utilization
1
Enforce proper post-mining reclamation
2 ! Closely monitor mining companies! Use special reclamation contractors! Restructure the reclamation bond
4
11.321
4.774
2.012
Encourage process efficiency
3 ! Encourage operation efficiency 2.563Mining process
ESTIMATE
20.66Total emission reduction =
Emission reductionMt, 2030
% of 2030 emission
(27%)
(12%)
(5%)
(6%)
(50%)

71
DRAFT
exploration and production concessions located within protected areas are illegal.18 An effective abatement strategy would require that East Kalimantan surveys all forested lands and checks the licenses of all mining companies within the forested lands The estimated cost to implement this initiative, in present value and excluding the opportunity cost from illegal mining, is around USD 0.01 to 0.02 per tCO2e p.a. by 2030. Box 6 discusses mining infrastructure and deforestation.
Minimizing methane release could capture 4.77 MtCO2e of abatement. Reducing the release of methane into the atmosphere is the second largest abatement lever after deforestation. Methane is 20 times more potent than CO2 as a greenhouse gas, and coal seams in East Kalimantan have high concentrations of methane, 1.46 m3 per ton of coal (around 88 percent of total gas concentration in coal). As coal mining in East Kalimantan is dominated by open pit mining, methane is released from seams when miners remove the earth above the deposit (overburden). Additional methane trapped in rock pores is released during the crushing and milling process. Yet, no measures to mitigate the release of methane are currently in place in East Kalimantan. Existing mining legislation is not explicit enough in prohibiting methane releases. Moreover, the commercial utilization of methane gas is hindered by the current regulations for coal-bed methane, which requires coal miners to follow a lengthy process if they want to flare19 or use the methane.
We have identified a number of recommended steps to help reduce methane release: petition the Ministry of Energy and Mineral Resources to simplify the requirements for CBM; pass new regulations requiring methane capture in mining operations; provide technical support to miners that apply for Clean Development Mechanism funding; and launch a new mining monitoring
18 Not all mining operations located within protected zones are illegal. Within the protected zones, there are many different forest types. To simplify from the mining point of view, there are two main categories: 1) Conservation forests (e.g., Cagar Alam, Suaka Margasatwa) – strictly no mining unless the mining right or contract had been issued prior to the new forestry law, UU No 41 Year 1999; 2) Protection forests (e.g., Hutan Lindung) – surface mining is prohibited, underground mining is allowed with prior approval from the Minister of Forestry, unless the mining right or contract had been issued prior to the new forestry law, UU No 41 Year 1999.
19 Flaring converts the methane to CO2, and therefore it is more environmentally friendly than having methane, which is a 20 times more potent greenhouse gas than CO2, be released to the atmosphere directly.
Mining Infrastructure and Deforestation
If not managed well mining infrastructure could lead to further deforestation. In order to access the coal deposits in the middle of forests, many big miners in East Kalimantan build roads across the forest areas. However, the availability of roads allows settlers to encroach on the forest. It is not uncommon that the settlers also clear trees and build permanent structures along the roadsides. Small miners, unlike the big ones, are generally unable to afford their own infrastructure. Therefore, they leverage the existing public roads, HPH roads, or rivers. The use of existing HPH roads can actually prevent further deforestation, as the roads are typically managed by the HPH companies that have strong interests to control their logging area and prevent encroachment from the settlers. Going forward, big miners need to leverage the HPH roads or alternatively build railways instead of roads to minimize settlements along roadsides.
To accommodate the coal mining workers, many big miners also build small encampments near the site in the midst of the forest. While the mine is operating, the encampments grow bigger as many local traders come to establish their businesses. Some even bring their families and build houses around the encampments. When these mining encampments have grown large enough, they can apply to be formal villages (desa) or even sub-districts (kecamatan). If approved, then the encampments will become permanent villages and will be entitled to some development funding. The growing sub-districts then increase their pressure on the forest areas. Going forward, East Kalimantan needs to encourage the big miners to prevent the unplanned growth of encampments.
Box 6

72
DRAFT
team to check on methane release at mining sites. The cost, in present value, required to reduce emissions by reducing methane release from coal mines is around negative USD 2 to 3 per tCO2e p.a. by 2030.
Encouraging operational efficiency could capture a reduction of 2.56 MtCO2e. Both emissions from the mining process and the profitability of coal mining are mainly driven by the consumption of fuel and electricity. Expert interviews suggest that East Kalimantan could reduce energy consumption (and hence emissions and costs) by around 20 percent through operational efficiency improvements. One step the provincial government could consider is training a new provincial mining monitoring team to be able to recommend operational improvements during their site visits. The members of the provincial mining monitoring team then will also assess efficiency and suggest improvements to the mining companies. Examples of operational efficiency initiatives include: reduce idle time of shovels, improve control of transport equipment, improve fill factor for shovels, improve haul road, optimize truck dispatch, and improve fuel monitoring and maintenance. Which initiatives are appropriate is dependent on the result of site assessment by the provincial mining monitoring team. The cost, in present value, to implement all these steps to improve operational efficiency is estimated at negative USD 4 to 6 per tCO2e p.a. by 2030.
Enforcing proper post-mining reclamation would save 2.01 MtCO2e. Although the environmental impact of open pit mining is inevitable, the damage can be minimized through implementation of best practices for reclamation. In violation of existing regulations, many miners in East Kalimantan, especially the smaller ones, do not implement proper reclamation practices. Interviews with industry participants and mining sector analysts suggest that around 20 percent of big companies and 75 percent of small companies do not implement proper reclamation. Their reasons vary. Many smaller miners don’t have the capital to finance reclamation activities. (An upfront reclamation guarantee fund does exist, however in many cases it is not adequate to cover the full cost of reclamation or it is simply not collected properly.) Some miners do not have the required knowhow and skills to implement reclamation correctly. And, some do not implement proper reclamation because they know that government has limited resources to monitor and control them, and therefore the consequences of violating the reclamation provisions are limited. Box 7 discusses the economic opportunity of post mining reclamation.
Three initiatives to enforce proper post-mining reclamation have been identified. First, to address the problem of a lack of skills and knowhow, certified reclamation contractors can be used. Miners with insufficient capability to do reclamation could contract one of the contractors on a recommended shortlist. Second, to address the lack of financial resources, the reclamation guarantee fund system can be adjusted. Instead of requiring applicants for mining permits to pay small upfront guarantees, East Kalimantan can require them to pay the full reclamation costs in advance to any certified reclamation contractor in East Kalimantan and attach the reclamation contract to their permit application. Then, the East Kalimantan government will only need to hold the certified reclamation contractors, instead of the applicants, responsible for implementing proper reclamation. It will be easier for East Kalimantan to manage a few certified reclamation contractors as opposed to thousands of mining companies. Third, to address the issue of lack of enforcement, East Kalimantan could establish a new mine monitoring unit with sufficient resources and regulatory authority.
To ensure successful reclamation (1) rehabilitation programs should be an integral part of operations from the commencement of mining; (2) lands should be rehabilitated immediately upon the closure of each mining pit; and (3) an extensive consultation process with community stakeholders should start a few years before the closure of a mine. There are several successful reclamation examples in East Kalimantan such as the Petangis coal mine in Paser rehabilitated by PT Kendilo and the PT KEM gold mine in Kutai Barat. The Petangis mine rehabilitated its post mining lands into an eco-tourism park, for which it received the Gold Flag environmental award from the Province of East Kalimantan. To enforce proper reclamation, East Kalimantan will need to add 65 qualified personnel to a provincial mine monitoring team. The estimated total cost, in present value, for these steps to enforce reclamation would be around USD 6 to 22 per tCO2e p.a. by 2030.
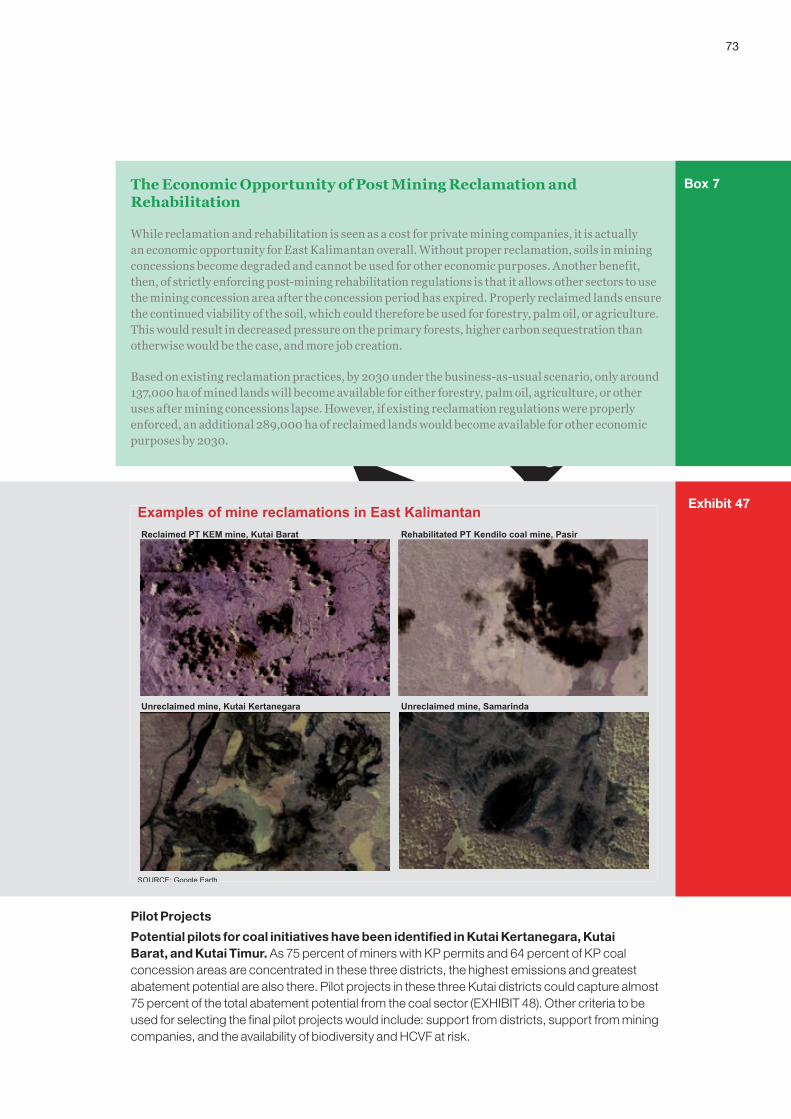
73
DRAFT
Pilot Projects
Potential pilots for coal initiatives have been identified in Kutai Kertanegara, Kutai Barat, and Kutai Timur. As 75 percent of miners with KP permits and 64 percent of KP coal concession areas are concentrated in these three districts, the highest emissions and greatest abatement potential are also there. Pilot projects in these three Kutai districts could capture almost 75 percent of the total abatement potential from the coal sector (EXHIBIT 48). Other criteria to be used for selecting the final pilot projects would include: support from districts, support from mining companies, and the availability of biodiversity and HCVF at risk.
Exhibit 47Examples of mine reclamations in East Kalimantan
SOURCE: Google Earth
Reclaimed PT KEM mine, Kutai Barat Rehabilitated PT Kendilo coal mine, Pasir
Unreclaimed mine, Kutai Kertanegara Unreclaimed mine, Samarinda
The Economic Opportunity of Post Mining Reclamation and Rehabilitation
While reclamation and rehabilitation is seen as a cost for private mining companies, it is actually an economic opportunity for East Kalimantan overall. Without proper reclamation, soils in mining concessions become degraded and cannot be used for other economic purposes. Another benefit, then, of strictly enforcing post-mining rehabilitation regulations is that it allows other sectors to use the mining concession area after the concession period has expired. Properly reclaimed lands ensure the continued viability of the soil, which could therefore be used for forestry, palm oil, or agriculture. This would result in decreased pressure on the primary forests, higher carbon sequestration than otherwise would be the case, and more job creation.
Based on existing reclamation practices, by 2030 under the business-as-usual scenario, only around 137,000 ha of mined lands will become available for either forestry, palm oil, agriculture, or other uses after mining concessions lapse. However, if existing reclamation regulations were properly enforced, an additional 289,000 ha of reclaimed lands would become available for other economic purposes by 2030.
Box 7
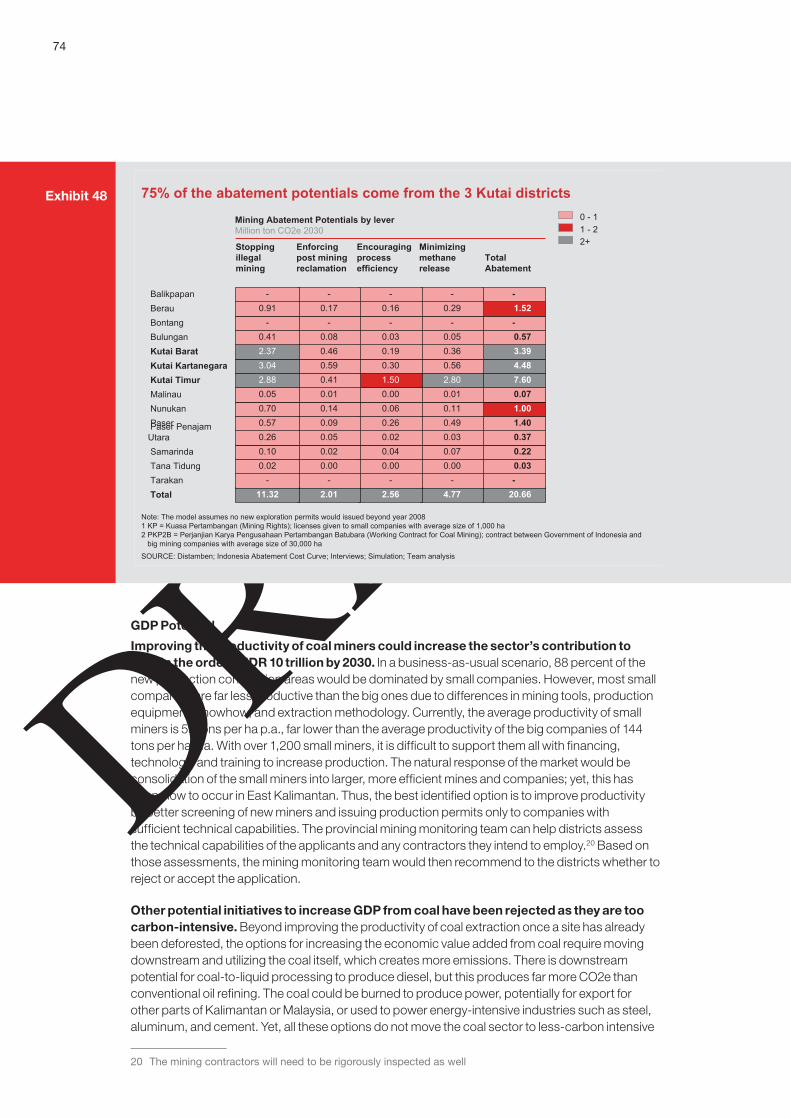
74
DRAFT
GDP Potential
Improving the productivity of coal miners could increase the sector’s contribution to GDP in the order of IDR 10 trillion by 2030. In a business-as-usual scenario, 88 percent of the new production concession areas would be dominated by small companies. However, most small companies are far less productive than the big ones due to differences in mining tools, production equipment, knowhow, and extraction methodology. Currently, the average productivity of small miners is 59 tons per ha p.a., far lower than the average productivity of the big companies of 144 tons per ha p.a. With over 1,200 small miners, it is difficult to support them all with financing, technology, and training to increase production. The natural response of the market would be consolidation of the small miners into larger, more efficient mines and companies; yet, this has been slow to occur in East Kalimantan. Thus, the best identified option is to improve productivity by better screening of new miners and issuing production permits only to companies with sufficient technical capabilities. The provincial mining monitoring team can help districts assess the technical capabilities of the applicants and any contractors they intend to employ.20 Based on those assessments, the mining monitoring team would then recommend to the districts whether to reject or accept the application.
Other potential initiatives to increase GDP from coal have been rejected as they are too carbon-intensive. Beyond improving the productivity of coal extraction once a site has already been deforested, the options for increasing the economic value added from coal require moving downstream and utilizing the coal itself, which creates more emissions. There is downstream potential for coal-to-liquid processing to produce diesel, but this produces far more CO2e than conventional oil refining. The coal could be burned to produce power, potentially for export for other parts of Kalimantan or Malaysia, or used to power energy-intensive industries such as steel, aluminum, and cement. Yet, all these options do not move the coal sector to less-carbon intensive
20 The mining contractors will need to be rigorously inspected as well
Exhibit 48 75% of the abatement potentials come from the 3 Kutai districts
Mining Abatement Potentials by leverMillion ton CO2e 2030
Stopping illegal mining
Encouraging process efficiency
Total Abatement
Minimizing methane release
Enforcing post mining reclamation
SOURCE: Distamben; Indonesia Abatement Cost Curve; Interviews; Simulation; Team analysis
Note: The model assumes no new exploration permits would issued beyond year 20081 KP = Kuasa Pertambangan (Mining Rights); licenses given to small companies with average size of 1,000 ha2 PKP2B = Perjanjian Karya Pengusahaan Pertambangan Batubara (Working Contract for Coal Mining); contract between Government of Indonesia and
big mining companies with average size of 30,000 ha
Total TarakanTana TidungSamarinda
Paser PenajamUtara PaserNunukanMalinauKutai TimurKutai KartanegaraKutai Barat BulunganBontangBerau
20.66 -0.03 0.22 0.37 1.40 1.00 0.07 7.60 4.48 3.39 0.57 -1.52 -
4.77 -
0.00 0.07 0.03 0.49 0.11 0.01 2.80 0.56 0.36 0.05
-0.29
-
2.56 -
0.00 0.04 0.02 0.26 0.06 0.00 1.50 0.30 0.19 0.03
-0.16
-
2.01 -
0.00 0.02 0.05 0.09 0.14 0.01 0.41 0.59 0.46 0.08
-0.17
-
11.32 -
0.02 0.10 0.26 0.57 0.70 0.05 2.88 3.04 2.37 0.41
-0.91
-Balikpapan
0 - 11 - 22+
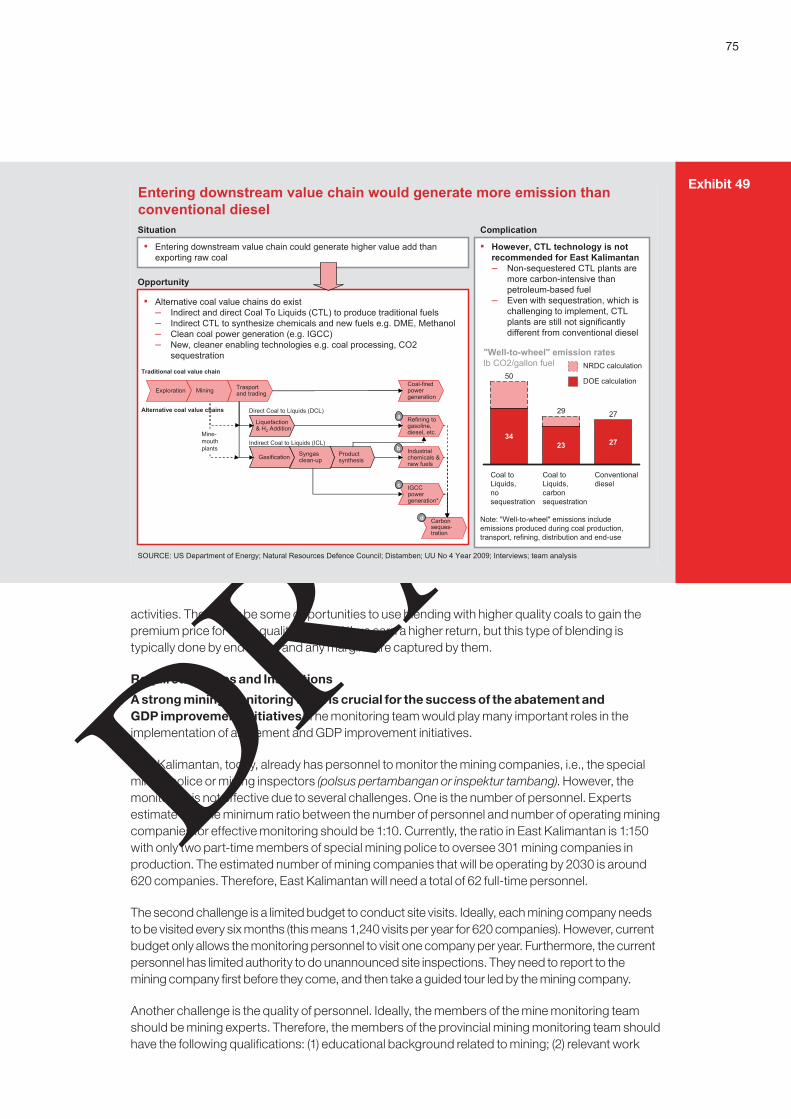
75
DRAFT
activities. There may be some opportunities to use blending with higher quality coals to gain the premium price for steel-quality coal and thus earn a higher return, but this type of blending is typically done by end-users and any margins are captured by them.
Required Policies and Institutions
A strong mining monitoring team is crucial for the success of the abatement and GDP improvement initiatives. The monitoring team would play many important roles in the implementation of abatement and GDP improvement initiatives.
East Kalimantan, today, already has personnel to monitor the mining companies, i.e., the special mining police or mining inspectors (polsus pertambangan or inspektur tambang). However, the monitoring is not effective due to several challenges. One is the number of personnel. Experts estimate that the minimum ratio between the number of personnel and number of operating mining companies for effective monitoring should be 1:10. Currently, the ratio in East Kalimantan is 1:150 with only two part-time members of special mining police to oversee 301 mining companies in production. The estimated number of mining companies that will be operating by 2030 is around 620 companies. Therefore, East Kalimantan will need a total of 62 full-time personnel.
The second challenge is a limited budget to conduct site visits. Ideally, each mining company needs to be visited every six months (this means 1,240 visits per year for 620 companies). However, current budget only allows the monitoring personnel to visit one company per year. Furthermore, the current personnel has limited authority to do unannounced site inspections. They need to report to the mining company first before they come, and then take a guided tour led by the mining company.
Another challenge is the quality of personnel. Ideally, the members of the mine monitoring team should be mining experts. Therefore, the members of the provincial mining monitoring team should have the following qualifications: (1) educational background related to mining; (2) relevant work
Exhibit 49
SOURCE: US Department of Energy; Natural Resources Defence Council; Distamben; UU No 4 Year 2009; Interviews; team analysis
Entering downstream value chain would generate more emission than conventional dieselSituation
Opportunity
Complication
! Entering downstream value chain could generate higher value add than exporting raw coal
! Alternative coal value chains do exist– Indirect and direct Coal To Liquids (CTL) to produce traditional fuels– Indirect CTL to synthesize chemicals and new fuels e.g. DME, Methanol– Clean coal power generation (e.g. IGCC)– New, cleaner enabling technologies e.g. coal processing, CO2
sequestration
! However, CTL technology is not recommended for East Kalimantan– Non-sequestered CTL plants are
more carbon-intensive than petroleum-based fuel
– Even with sequestration, which is challenging to implement, CTLplants are still not significantly different from conventional diesel
"Well-to-wheel" emission rateslb CO2/gallon fuel
2729
50
Conventional diesel
27
Coal to Liquids, carbon sequestration
23
Coal to Liquids, no sequestration
34
Note: "Well-to-wheel" emissions include emissions produced during coal production, transport, refining, distribution and end-use
Coal-fired powergeneration
Direct Coal to Liquids (DCL)
Traditional coal value chain
Refining to gasoline, diesel, etc.
Indirect Coal to Liquids (ICL)
GasificationIndustrial chemicals & new fuels
Productsynthesis
Syngas clean-up
Exploration
Alternative coal value chainsa
b
Trasportand trading
Mine-mouth plants
Mining
Liquefaction& H2 Addition
IGCCpowergeneration*
Carbonseques-tration
c
d
NRDC calculation
DOE calculation

76
DRAFT
experience in the industry, e.g., ex-manager of a good mining company; and (3) training in site inspection.
In summary, it is very important for the provincial monitoring team to have:
Sufficient authority and power to undertake all of its responsibilities
Clarity of roles and responsibilities between the team members and the provincial and district mining authorities (dinas)
Sufficient expertise and knowledge
Highest possible integrity of people and processes, and world-class governance processes
OIL AND GAS SECTOR
The oil and gas sector has been a fundamental driver of East Kalimantan’s economy for decades. Onshore fields have been producing oil in East Kalimantan since before Independence; in the 1970s, the sector developed further with the discovery of massive offshore gas fields. Recently, East Kalimantan has been pioneering Indonesia’s development of coal-bed methane. East Kalimantan’s production has been important nationally; it accounted for 42 percent of national upstream gas production and 90 percent of national LNG production in 2008. Yet, the sector is currently in decline with oil and gas production falling 1 percent p.a. since 2000. Thus, in a business-as-usual scenario, emissions from the oil and gas sector will decline naturally. In the other sectors discussed in this report, we have first evaluated options for reducing the current carbon footprint of the sector before considering how to expand the sector with new higher value-adding and lower carbon-emitting activities. Given the expected decline of oil and gas sector going forward, we have switched the order here and first explore how to reverse the sector’s decline. We then turn to the topic of how to reduce emissions from a larger, revitalized industry.
Exhibit 50 Almost all of the abatement levers could be implemented through a provincial mine monitoring team
SOURCE: Interviews; Team analysis
Initiatives
Stop illegal mining
Minimize methane release
2
Enforce proper post-mining reclamation
3
5
1 Implement stricter review of license applications
Encourage process efficiency
4
Can a mine moni-toring team help?
What role can the mine monitoring team play?
Yes
Yes
Yes
Yes
Yes
As the provincial expert body who reviews the application1
! Quality of AMDAL and mining technical plans
! Company background check
As the inspector who visits the sites and monitors closely; Also as a facilitator that helps companies to apply for CDM projects
As the inspector who visits the sites and monitors closely
As the surveyor/inspector who can survey the forested lands and check the company’s licenses
1 All administration papers still handled by the district’s mining dinas
As the expert who visits the sites, observes and diagnoses the mining practices and recommended improvement initiatives
GDP improvement
Abatement
77
DRAFT
Current Context
The oil and gas sector contributes almost half of East Kalimantan’s GDP but has been declining at an accelerating rate, 1 percent p.a. since 2000 and 3 percent p.a. since 2005. The majority of East Kalimantan’s oil and gas fields are already mature and production volumes are declining 3 percent p.a. The impact on the province’s GDP of this decline is further amplified by the subsequent drop in downstream gas processing. While the Balikpapan refinery continues to run at 99 percent of its maximum capacity by importing crude oil supplies, the Bontang LNG production facility continues to decline and in 2008 was operating at 80 percent capacity, as it must rely on the declining gas feed from nearby upstream fields. If these trends continue, there will be a significant drop of GDP contribution from oil and gas to East Kalimantan, from IDR 47.2 trillion in 2008 to IDR 31.6 trillion in 2030. This declining role of the oil and gas sector is likely to increase East Kalimantan’s dependence on other, more carbon-intensive sectors such as agriculture, palm oil, and coal mining to secure its future growth.
In 2010, the oil and gas sector produced approximately 17.8 MtCO2e from both its upstream and downstream activities. Upstream oil and gas production produced 6.9 MtCO2e; 23 percent of this stemmed from the energy used for the drilling and operating of the production fields. The remaining 77 percent was due to flaring. Flaring occurs most commonly in oil fields where associated gas is produced along with oil from the fields; this gas is separated from the oil at surface facilities and then flared (burned) if the operators do not use it for internal purposes or sell to others. Flaring can also occur at gas fields if production exceeds the field’s processing capacity as well as at downstream processing facilities. An estimated 3.3 MtCO2e are generated from the Balikpapan refinery due its energy needs and processing of oil. The Bontang LNG plants produces an estimated 7.6 MtCO2e from its high energy needs to process, cool, pressurize, and liquefy the natural gas.
GDP Potential
We have identified three GDP improvement initiatives that could reverse the decline of East Kalimantan’s oil and gas sector and increase GDP by an additional IDR 64.3 trillion by 2030. These initiatives are accelerating upstream exploration (2030 GDP increase of IDR 4.7 trillion), developing coal-bed methane (CBM) fields (IDR 24.3 trillion), and building new downstream gas facilities once the new CBM stream is online (IDR 3.63 trillion) (EXHIBIT 51).
Accelerating upstream exploration would see an increase of 2030 real GDP by IDR 4.7 trillion. East Kalimantan’s oil and gas resources have been largely exploited, but there remains some potential for new exploration and production, particularly in gas. East Kalimantan’s oil and gas deposits are found in two main basins, the Kutai Basin and Tarakan Basin. The Kutai Basin, for example, still holds estimated reserves of 474 million barrels of oil and 20,663 billion cubic feet (bcf) of gas. Besides in-field exploration, the United States Geological Survey (USGS) routinely estimates how much resources are “yet-to-find” and could be expected from future exploration efforts in a basin. For the Kutai Basin, for example, there is an estimated 50 percent chance (F50) that at least 59.8 trillion cubic feet of gas could be discovered in fields of various sizes. Doubling current exploration efforts could yield new oil and gas production of 35 mbpd and 766 million cubic feet per day (mmcfd) by 2030. Yet, this is insufficient to fully offset the decline in existing mature fields. Accelerated exploration can merely slow the decline in oil production from 8 percent p.a. to 3 percent and the decline in gas production from 2 percent p.a. to almost 0 percent.
Coal-bed methane (CBM) is one of the biggest opportunities for East Kalimantan and could increase 2030 GDP by IDR 24.3 trillion. Coal-bed methane is a recent development that allows methane (natural gas) trapped in coal seams to be located, drilled, and sold to conventional gas buyers. East Kalimantan has CBM resources of 109 trillion standard cubic feet (tscf), almost a quarter of Indonesia’s CBM potential (EXHIBIT 53). The current CBM explorations are focused on four exploration blocks within the Kutai Basin that are close to the Bontang LNG plant; they were

78
DRAFT
Exhibit 51 Three GDP improvement initiatives could reverse the decline to lift 2030 real GDP to IDR 64.25 trillion
SOURCE: BPS; Global Insights; Team analysis
05
101520253035404550556065
CBM stream to BontangLNG plant
3020102008
Additional downstream facilities
Upstream oil & gas BAU
Refinery BAU
LNG BAU
Accelerated exploration
CBM production
Real GDPIDR Trillion; Constant Price 2000
3
2a
1
2b
Gas
(bcf
)O
il(m
mbb
l)
East Kalimantan’s oil & gas resources have been largely exploited but there remains some potential for exploration, particularly in gas
SOURCE: WoodMackenzie, USGS, team analysis
Kuteibasin
Produced Remaining
Technical (currently undevelopable): 172
2,820 474
Yet-to-find
F95: 1,386
F50: 4,790
F5: 10,067
587 6
118
Tarakanbasin N/A
Kuteibasin
Produced Remaining
Technical (currently undevelopable): 5,371
23,474 20,663
Yet-to-find
F95: 18,269
F50: 59,763
F5: 127,895
Remaining: 15Tarakanbasin N/A
Produced: 155
Technical: 1044
Exhibit 52

79
DRAFT
granted in 2008–2009 and contain 12.7 tscf. Assuming continued auctions of CBM blocks21to 2030 (but at a more conservative pace and size) that would cover at least 60 percent of current resources, East Kalimantan could produce an additional 2,500 mmcfd of CBM gas production by 2030.
This new stream of coal-bed methane would double business-as-usual gas production by 2030 from 2,200 mmcfd to 4,700 mmcfd. Furthermore, this new supply of gas from CBM could be used to raise LNG production at Bontang LNG plant to its historical utilization rate of 92 percent, despite the declining conventional gas feed. There should be ample markets for the additional LNG from Bontang, from the existing buyers in South Korea, Japan, and Taiwan as new markets such as China.
Building additional downstream gas processing facilities would result in a GDP increase of IDR 3.6 trillion by 2030. Coal-bed methane should be fed to the Bontang LNG plant and PT Pupuk Kaltim fertilizer plant until the gas feed exceeds the maximum capacity of these plants. By 2017, the CBM gas feed would reach the maximum capacity of the Bontang LNG plant: 3.7 billion standard cubic feet per day (bscfd). By 2023, the excess CBM supply would reach 1.0 bscfd, enough to operate two additional LNG liquefaction and purification facilities (called LNG trains) and by 2030, three additional LNG trains. Building a new LNG train requires large capital investment and can require up to five years to complete; thus investors are typically reluctant unless they can be assured of sufficient long-term supplies. The decision whether to expand LNG trains based on CBM supplies would be made in the future and depend on the regulatory framework at the time, LNG prices, domestic demand, and certainty over supply. It may be easier to find investment for capital-intensive downstream facilities such as fertilizer and petrochemical complexes that use
21 The four exploration blocks are Kutai West (5.1 tscf, explored by Newton Energy, Ephindo, and CBM Asia), Sanga-Sanga (4.0 tscf, explored by Vico, BP, and ENI), Kutai-Ephindo (3.1 tscf, explored by Ephindo), and Sanggata West (0.5 tscf, explored by Pertamina, Arrow, and Ephindo)
Exhibit 53East Kalimantan has CBM resources of 109 TSCF, almost a quarter of Indonesia’s CBM potential
SOURCE: SPE: Stevens, S. "Indonesia Coalbed Methane Indicators and Basin Evaluation"
453.330,248TOTAL
3.67726100.4012LemauBengkulu11
2.05006100.556TorajaSulawesi10
0.810015240.706T.AkarNW Java9
3.03857010.4515WarukinPasir/ Asem8
0.5477620.8024SawahtOmbilin7
8.47806710.4524LatihBerau6
17.52,7347010.4515TabulN. Tarakan5
52.55,1507620.4015PetaniC. Sumatra4
80.46,1009150.5021PrangatKutai3
101.66,3309150.4528WarukinBarito2
183.07,3507620.4737M.EnimS. Sumatra1
(Tcf)(km2)(m)(R0%)(m)
CBMComplet
Able
HighGraded
AreaAvg
DepthCoalRank
CompleteableCoal
ThicknessTarget
FormationBasin
Located in East Kal
109 tcf in East Kalimantan(24% of national resources)

80
DRAFT
also natural gas as an input. We recognize that we will need to work with the national investment board and regulatory agencies to encourage new investment into CBM.
Abatement Potential
Emissions from the oil and gas sector are forecasted to fall naturally from 18.5 to 11.4 MtCO2e as oil and gas production declines under business as usual. Emissions from the Balikpapan refinery would remain constant as the plant continues to operate at capacity. Emissions from the upstream processes to produce oil and gas would decline as oil and gas production decreases. In addition, under business as usual, the emissions from flaring would decline in tandem with the decline of upstream oil production.
The revival of the oil and gas sector, through the implementation of the GDP improvement initiatives outlined above, would counteract the natural decline in emissions under business as usual. With the decline of oil and gas production, the total emissions of the oil and gas sector are estimated to naturally decline from 18.5 MtCO2e in 2008 to 11.4 MtCO2e in 2030. However, the GDP improvement initiatives above would see higher production of oil, conventional gas, CBM gas, and LNG, which would push total sector emissions to 26.3 MtCO2e by 2030.
Three abatement initiatives have been identified for the oil and gas sector that could reduce emissions by 2.8 MtCO2e, equal to 10 percent of the revived oil and gas sector’s emissions. Implementation of a zero flaring program in East Kalimantan would result in emission abatement of 1.7 MtCO2e p.a. by 2030. The Ministry of Energy and Mineral Resources, under the Green Oil & Gas Industry Initiatives, has targeted Indonesia to reach zero flaring by 2025. East Kalimantan could be the first pilot province for this program and introduce a Kaltim Zero Flare program (Box 8). The total cost, in present value, of implementing this initiative would be USD 8 to 10 per tCO2e p.a. by 2030.
Implementation of an LNG plant operational improvement program, such as improved planning, would reduce emissions by 0.8 MtCO2e p.a. Improved planning can save fuel, as plants can reduce unnecessary pressurization and depressurization by actively matching compression needs with natural gas demand. In addition, improved planning places emphasis on running compressors at their most efficient point, called the working point. The total cost, in present value, of implementing this initiative would be negative USD 19 to 28 per tCO2e p.a. by 2030, as the revenues and cost savings from improved planning outweigh the cost of equipment and investment.
Zero Flaring is Possible and Could Be Cost Negative
It is possible to achieve the negative cost of zero flaring from a technical perspective. There are many viable options for utilizing associated gas from a field; the appropriate option depends on the amount of gas and the characteristics of the field. If the field is near existing gas infrastructure and pipelines, the associated gas can be sold commercially into the system (after investing in connecting pipelines) instead of flared. If there is no gas grid within an economical distance, excess gas can be sold to neighboring energy-intensive factories or local power plants. If this is not available or the amount of gas is small, then the excess gas can be used for power generators and compressors at the field site, replacing diesel fuel. The gas can also be reinjected into the reservoir itself to maintain pressure and production levels under the right circumstances.
In addition to the revenues and cost savings from the above options, there is the potential to receive CDM funding for flare reduction initiatives. At the Tambun and Pondok Tengah fields, up to 40 mmcfd of flared gas is utilized for power generation, and the estimated carbon reduction is around 0.4 MtCO2e p.a. Thus, zero flaring, in many cases, can be achieved at a negative cost.
Box 8

81
DRAFT
Exhibit 54
Exhibit 55
Emission from flaring is declining fast following the decline of oil production
Source of emissionMillion Ton CO2e
SOURCE: Indonesia Abatement Cost Curve; Interviews; Simulation; Team analysis
BAU SCENARIOUpstream processesTotal energy burned to lift oil and gas! ~12.72 kg CO2e is emitted per boe oil produced! ~17.95 kg CO2e is emitted per boe gas produced! Emission from both oil and gas are declining as
fields are maturing
FlaringEmission from associated gas flared during oil production ! ~87.33 kg CO2e is emitted per boe oil produced! Emission from flaring is decreasing as the decline
of oil production
A
B
Downstream processesEnergy consumed to run the refinery and LNG plant ! ~34.89 kg CO2e is emitted per boe refined
products produced! ~411.00 kg CO2e is emitted per kg LNG! Emission from refinery would be stable while LNG
is decreasing
C
7.66.2 5.1
3.5
18.5
0.2
2.9
1.3
13.9
0.12.40.5
11.4
Refinery
LNG
3.33.3
3.3
Flaring
0.5
3.7
2020
Upstream gas
2008 2030
Upstream oil
The revival of the oil and gas sector, through initiatives to improve GDP, would inevitably increase the 2030 BAU emission
SOURCE: Team analysis
23.6
26.3
11.4
18.5
7.1
2030 emission due to GDP initiatives
2008 emission
Additional downstream facilities
5.8
Develop & utilize CBM
6.9
Accelerate exploration
2030 BAUemission
1.7
Zero flaring program
0.8
Refinery efficiency program
2.1
Decline of oil & gas
0.3
LNG efficiency program
2030 emissions
EmissionsMillion Ton CO2e
BAU emission
GDP initiatives emission
Abated emission
82
DRAFT
Implementation of a refinery operational efficiency program would reduce emissions by 0.3 MtCO2e. The Balikpapan refinery can reduce its emissions by implementing efficiency measures that involve replacement, upgrades, or additions that do not alter the process flow of the refinery, e.g., waste heat recovery via heat integration and replacement of boilers, heaters, turbines, or motors. The total cost, in present value, of implementing this initiative would be negative USD 10 to 15 per tCO2e p.a. by 2030, as the revenues and cost savings from the refinery operational efficiency programs outweigh the cost of equipment and investment.
Pilot Projects
The pilot projects should be implemented in Kutai Kertanegara for zero flaring program, Bontang for LNG efficiency program, and Balikpapan for refinery efficiency program. By 2030, Kutai Kertanegara, Balikpapan, and Bontang will account for 98 percent of the sector’s emissions with 1.4 MtCO2e from flaring at Kutai Kertanegara, 15.0 MtCO2e from Bontang LNG, and 3.32 MtCO2e from Balikpapan refinery. These three districts will also account for 91 percent of the abatement potential by 2030. Kutai Kertanegara, with many fields, has high emissions from flaring that contribute almost 85 percent of East Kalimantan’s flaring emissions. Satellite images detect more than 10 flare points in the district. By 2030, implementing a zero flaring program in Kutai Kertanegara could abate around 1.4 MtCO2e. Implementing operational efficiency programs at Bontang LNG plant will reduce 0.8 MtCO2e, and implementing energy efficiency programs at Balikpapan refinery will abate 0.3 MtCO2e.
Required Policies and Institutions
To accelerate exploration, there are five challenges to be addressed as reported by the industry: uncertainty of cost recovery regulations hinder private sector investment; contract sanctity is sometimes violated; unforeseen disputes with other agencies such as the tax office create additional costs; the overall taxation rate is not competitive with other exploration locations; and lack of security of assets and ownership rights causes uncertainty.
East Kalimantan should help the industry to address these exploration challenges by: encouraging BP MIGAS to switch from a cost recovery focus to maximizing investment; encouraging BP MIGAS to quickly settle the Offshore Mahakam dispute in a transparent and credible manner; actively collecting feedback related to interference by other agencies from major companies and escalating it to national ministries; actively collecting feedback related to total tax rate from major companies and escalating it to national ministries; and creating a one-stop center with staff dedicated to the largest PSCs to facilitate access and ensure security.
There are four regulatory issues that constrain the development of CBM: PSC regime, local procurement requirement, land access, and water management. The existing oil and gas based PSC regime is not conducive for CBM development. Due to the cost recovery scheme, all well drilling, work programs, and budgets need to be approved beforehand by BP MIGAS. This is not suitable for the complex and long-term nature of CBM activities. For example, with the lengthy approval process of the current PSC regime, it could take up to one year for the approval of one well, yet CBM developments require hundreds of wells to be drilled. Similarly other approvals for work programs, budgets, and other items take a long time and are thus ill-suited to the phased development required for CBM. The existing PSC scheme also requires First Tranche Petroleum (FTP), a mechanism that allow the Government of Indonesia to claim upfront 20 percent of gross production regardless of whether the production volume will be sufficient to cover the total exploration and development costs invested by the contractors or not. This scheme, while ensuring income for the Government of Indonesia, means higher risk for contractors. This is not conducive for CBM development that requires higher upfront investment. Countries like India and China offer better fiscal regimes to address the high upfront risk related to CBM development.
The requirement for local procurement hinders the development of CBM. Current regulations require operators to use local contractors and procure equipment locally. Non-local

83
DRAFT
Exhibit 56
Exhibit 57
Satellite images can help monitor the flaring points
SOURCE: Google Earth; Team analysis
Bontang, Balikpapan, and Kutai Kertanegara account for 98% of emission and 91% of abatement
= 0< 1> 1
SOURCE: WoodMac; Simulation; Team analysis
1 Oil and gas field locations by district:Kutai Kertanegara = Offshore Mahakam, Kalimantan TAC, Sanga-Sanga, Nilam Badak, Rapak, GanalKutai Timur = East Kalimantan PSC, Makassar PSCBulungan = Pertamina KalimantanTarakan = Tarakan PSC
2 Refinery plant located in Balikpapan; LNG plant located in Bontang
Total
Tarakan
Tana Tidung
Samarinda
Paser PU
Paser
Nunukan
Malinau
Kutai Timur
Kutai Kerta.
Kutai Barat
Bulungan
Bontang
Berau
Balikpapan
Oil & Gas Emissions by source, MtCO2e, 20301, 2
Total Abatement
LNGProcess
Refinery Process
UpstreamFlaring
Upstream Gas
Upstream Oil
26.27 15.05 3.32 1.67 5.98 0.24
0.01 --0.01 -0.00
------
------
------
------
------
------
0.42 --0.15 0.26 0.02
7.36 --1.43 5.72 0.21
------
0.10 --0.09 0.00 0.01
15.05 15.05 ----
------
3.32 -3.32 ---
2.72 0.75 0.30 1.67
0.01 --0.01
----
----
----
----
----
----
0.15 --0.15
1.43 --1.43
----
0.09 --0.09
0.75 0.75 --
----
0.30 -0.30 -
Total Emission
Zero flaring
Refinery efficiency
LNG efficiency
Oil & Gas Abatement potential, MtCO2e, 2030

84
DRAFT
procurement is only allowed with the approval of the Minister of Energy and Mineral Resources. However, as the CBM business is relatively new for Indonesia, no local equipment suppliers and contractors have yet built the skills to support large-scale CBM development projects. Existing procurement rules and local content requirements make it difficult for CBM operators to import necessary skills and equipment.
Conflicts regarding access to land hinder the development of CBM. Much of the land on top of CBM basins is likely to be already held by other parties, e.g., coal miners, oil and gas companies, oil palm plantations, or logging companies. Although Kepmen No 36/2008 has clarified the rules on CBM operators’ rights and land access, i.e., CBM companies can negotiate with other parties for land access, it does not go far enough to resolve the lengthy negotiation process involved between the CBM operator and multiple parties and the price to be paid for land access.
Unclear regulations on water management, especially when the CBM fields are far from the sea or rivers, hinder the development of CBM. The dewatering processes during CBM development produce large streams of water that need to be properly diverted. However, current regulations are not clear about how to implement this requirement.
East Kalimantan needs to lobby the Ministry of Energy and Mineral Resources to address four challenges of CBM development: (1) In 2011, the central government plans to introduce new PSC regulations that will provide more flexible procedures for CBM operators. East Kalimantan should play a proactive role in collecting feedback from major CBM companies and escalating this back to the central government; (2) East Kalimantan should request that the central government permit CBM operators to import non-local equipment and supplies without having to apply for ministerial approval until local contractors and suppliers emerge; (3) East Kalimantan should take a proactive role to facilitate the negotiation processes of land access between multiple parties; and (4) East Kalimantan should work with relevant parties, such as the Ministry of Environment and Ministry of Mining, to clarify the issue of water management once for all.
4. District strategies Strategies for individual districts take account of their situations with respect to the district’s size and population, current land use, levels of emissions and potential for abatement, and GDP and employment for the five primary sectors. For instance, populous and urban Balikpapan has little potential for abatement, except for reforestation and working to promote operational improvements in the Pertamina refinery, but will benefit from the environmentally sustainable development strategies used in other districts, such as the development of downstream industries for the forestry sector. On the other hand, resource rich Kutai Barat has great opportunities for abatement by working with its palm oil industry in the areas of zero burning, utilization of degraded land, etc. and with its forestry industry in the areas of Sustainable Forest Management (SFM) and avoiding further deforestation. District emissions will change over time under business as usual as already deforested districts see fewer emissions from decreased land use changes while heavily forested districts today could be at the frontier for accelerated deforestation. The district strategies follow:
BALIKPAPAN
Balikpapan is the commercial center of East Kalimantan. The city’s GDP exceeded IDR 13 trillion in 2006, it hosts the regional headquarters for many businesses, and its airport is the major entry point to East Kalimantan. Balikpapan hosts Indonesia’s second largest refinery and acts as the regional base for many of the province’s oil and gas companies. Oil and gas accounts directly for 40 percent of the city’s GDP; the industry has also helped spur the growth of services, which account for another 40 percent of GDP.

85
DRAFT
Exhibit 58
Exhibit 59
Under business as usual, relative district emissions will likely change by 2030 and require different strategies
SOURCE: BPS, team analysis
0
10
20
30
40
50
60
70
80
90
100Malinau
Kutai Timur Kutai Kertanegara
Kutai Barat
Bulungan
Nunukan
Pasir
Penajam Paser Utara
Samarinda
Tarakan
1,000100
Balikpapan
300 400 500 600 700 800200 51,100
Berau
Bontang
DevelopmentGDP per capita x population per km2
Remaining Forest CoverPercent of total land
0 900
Size proportional to 2010 CO2e emissions
“Frontier” districts at risk of increased deforestation and emissions
Current leaders that need address emissions today
Cities need to focus on non-land-use emissions
Potential CO2e reductions disaggregated to all districts
SOURCE: Team analysis
Tarakan
Tana Tidung
Samarinda
Pasir
PanajamPaser Utara
Nunukan
Malinau
Kutai Timur
KutaiKertanegara
Kutai Barat
Bulungan
Bontang
Berau
Balikpapan
2-5
5+
0-1
1-2
East Kalimantan
Abatement by source, MtCO2e 2030
1 Reduced impact logging2 Includes the use of degraded land (13.9 MtCO2e) and REDD (9.8 MtCO2e) payment schemes
Palm oil
Zero burning
De-graded land
Water mgmt POME
Yield in-crease
Con-cession buyouts
0.00.0 0.0 0.00.0 0.0
0.21.5 1.0 0.30.3 0.0
0.00.0 0.0 0.00.0 0.0
0.21.2 0.2 0.60.2 0.5
0.44.7 1.2 0.70.4 1.9
0.73.4 1.9 1.80.8 2.6
0.72.7 3.4 0.30.8 0.0
0.20.0 0.2 0.00.1 0.3
0.20.8 1.5 2.80.2 0.0
0.10.2 0.1 0.00.1 0.4
0.31.0 1.8 0.10.3 0.0
0.00.0 0.0 0.00.0 0.0
0.10.0 0.0 0.00.1 0.2
0.00.0 0.0 0.00.0 0.0
3.115.6 11.4 6.83.3 6.0
Oil & Gas
ZeroFlaring, Process
-
0.8
0.1
-
1.4
0.2
-
-
-
-
-
-
0.0
2.7
0.3
Agriculture
Zero burn policy
Peat rehab
0.0 0.0
0.6 0.2
1.5 0.4
1.9
4.6 1.3
1.0 0.3
0.0 0.0
7.2 2.1
0.0 0.0
0.4 0.1
0.4 0.1
0.0 0.0
0.0 0.0
18.5 5.4
0.9 0.3
0.5
Forestry
Peat rehab
Zero burn policy
Re-forest-ationRIL1
Avoid de-forest2
0.1 0.0 0.0 0.1
4.0 1.08.7 2.3 2.0
3.9
2.4
2.7
3.1
0.6
2.8
0.8
2.4
0.0
0.9
0.1
0.3
0.8
2.5
0.5
0.0
4.0
0.0
0.2
0.2
0.0
0.0
0.8
0.4
1.7
1.4
0.0
0.4
0.1
0.5
0.0
0.0
0.0
0.9
0.6
2.8
3.2
0.6
0.5
0.4
1.1
0.1
0.2
0.0
0.0
4.7
0.0 0.5 0.1 0.0
2.5
1.8
6.3
4.7
1.5
2.6
1.2
0.0
0.0
0.0
0.0
23.8 10.0 7.7 12.534.0
Recla-mation
Reduce methane release
Stop illegal mining
0.05 0.03 0.08
0.09 0.05 0.16
---
0.26 0.14 0.46
0.33 0.18 0.58
0.19 0.10 0.34
0.01 0.00 0.01
0.08 0.04 0.13
0.04 0.02 0.07
0.03 0.02 0.05
0.01 0.00 0.01
0.00 0.00 0.00
---
2.90 1.56 2.01
---
0.34
0.67
-
1.90
2.41
1.39
0.04
0.56
0.30
0.21
0.06
0.02
-
8.11
-
Coal mining
Process efficiency
0.10.00.1
0.30.20.1
---
0.40.20.5
0.60.30.6
2.8 1.50.4
0.0 0.0 0.0
0.10.1 0.1
0.50.30.1
0.0 0.0 0.1
0.10.0 0.0
0.00.0 0.0
---
4.8 2.62.0
---
0.4
0.9
-
2.4
3.0
2.9
0.1
0.7
0.6
0.3
0.1
0.0
-
11.3
-
Total
Total
16.2
2.6
12.2
33.2
34.5
31.5
6.8
25.0
6.3
9.8
1.0
1.5
0.1
184
0.5

86
DRAFT
With 5.9 MtCO2e annual emissions, Balikpapan accounts for just 2 percent of East Kalimantan’s emissions. Balikpapan resembles much more the industrialized world than the rest of East Kalimantan in its emissions profile. Manufacturing and services account for a sizeable share, mainly driven by consumption by the city’s residents and businesses of power (1.4 MtCO2e) and transport (0.8 MtCO2e). Few emissions result from change in land use; only 540 ha are deforested a year. In addition, the Pertamina refinery alone is estimated to produce 3.3 MtCO2e from the energy consumed in the refining process as well as flaring and other process emissions (EXHIBIT 60).
The priority sectors will yield little abatement, approximately 0.2 MtCO2e. With little deforestation, Balikpapan could reduce its forest loss only slightly, but it could reforest 22,600 ha as well as some potentially critical forest lands; these efforts would yield 0.2 MtCO2e. Balikpapan should also work with Pertamina to encourage investment in energy efficiency and reduced flaring, which could yield additional reductions by 0.3 MtCO2e. Beyond these efforts, Balikpapan could conduct a further assessment of transportation and power initiatives, such as moving to improved combustion engines for vehicles, enhanced public transport, and higher energy efficiency standards for buildings to match its developed world emissions profile.
Balikpapan would benefit from the potential GDP initiatives outlined for East Kalimantan. A revival in the oil and gas industry as well as development of Coal Bed Methane would benefit the city as it is the hub for oil and gas services. Furthermore, given its port, airport, and large population, Balikpapan is a natural home for downstream industries. For example, the city already hosts more than 50 plywood and furniture companies and could benefit from a larger downstream forest products industry.
Exhibit 60 Refining accounts for about 3.3 Mt CO2e, half of Balikpapan’s total emissions
SOURCE: Google maps, team analysis
Flare
Balikpapan refinery

87
DRAFT
BERAU
Berau is the third largest district in East Kalimantan by land size and is still more than 75 percent covered by forests. The district’s 160,000 people make it quite sparsely populated at only 5 people per square kilometer, and mining (40 percent of GDP) and forestry (30 percent of GDP) dominate the economy. Fourteen companies hold over 880,000 ha of production forest concessions and three companies hold 60,000 ha of HTI timber plantation concessions, which combined cover about 40 percent of Berau’s total land. The district’s large remaining forests but also the commitment of the Berau government have made it attractive as a REDD demonstration area for Indonesia.
The district generates over 21 MtCO2e of emissions a year, 10 percent of East Kalimantan’s total. Berau loses more than 24,000 ha of forest a year. The forestry sector accounts for over 10 MtCO2e p.a., primarily from unsustainable logging in the HPH concessions. In addition, there are existing location permits (Ijin lokasi) for opening 100,000 ha of palm oil concessions, which will put additional pressure on Berau’s forests. The district’s emissions, mainly stemming from changes in land use, are equivalent to the emissions of 4.5 million cars.
While emissions will grow under business as usual, Berau can reduce its emissions by over 18 MtCO2e p.a. by 2030. The single largest initiative for Berau is implementing reduced impact logging (RIL) in its HPH concessions (4.7 MtCO2e abatement); the district can first target the three companies that each have over 100,000 ha of concessions. A further 3.7 MtCO2e and 1.8 MtCO2e of reductions are possible by using degraded lands for the expansion of HTI and palm oil concessions, respectively. The district has over 125,000 of very critical and critical lands that can be used for this initiative. Additional abatement comes from the agriculture and coal sectors.
Berau can benefit from improved productivity in the forestry sector. Berau already has East Kalimantan’s only pulp and paper mill, but over the past years it has often run below capacity or been closed, due to lack of pulpwood inputs. Improving productivity in the pulpwood plantations, and more efficient use of wood from RIL forestry operations could provide enough supply to ensure the pulp and paper mill can operate at full capacity. With its water access, existing HTI concessions, and port, Berau could even potentially be the site for a new forest products industry cluster around the already existing mill, making use of timber and wood residues from the rest of the province.
BONTANG
Bontang is the LNG and gas center of East Kalimantan, resulting in the second highest district GDP at over IDR 25 trillion in 2006. The Bontang LNG plant, the largest in Indonesia, dominates the city’s GDP at over 90 percent of the total (EXHIBIT 61). On a per capita measure, Bontang’s GDP is over IDR 200 million per person, about eight times as great as Balikpapan’s. The city’s development since the 1970s has followed that of two companies based on gas, PT Badak Liquid Natural Gas and PT Pupuk Kaltim, which produces ammonia and fertilizer using natural gas. However, with the decline of the province’s major gas fields, the LNG plant capacity has declined to 80 percent today and is projected to decline further, particularly as Total’s offshore Makaham field moves off-plateau and experiences declining production.
Bontang has 18.5 MtCO2e of emissions which stem almost exclusively from its oil and gas industry. With just 125,000 people and only 3,000 ha of forest, Bontang has few emissions from land-use changes, power, or transport. The LNG plant, though, is estimated to generate 15 MtCO2e as it consumes substantial energy to cool and pressurize the natural gas for transport. Emissions also result from flaring in the LNG process and from transporting the LNG to market.
Bontang has few abatement options in the priority sectors. The city can encourage process efficiencies and reduce emission from the LNG plant by 0.8 MtCO2e. With annual deforestation at just 150 ha, there is little avoided deforestation abatement potential.

88
DRAFT
BULUNGAN
Bulungan is a large district, with over 1.8 million ha of land, but has a small population and GDP of just over IDR 1 trillion in 2006. Of all of the districts, Bulungan has the largest share of local GDP contributed by the agriculture sector, at 18 percent. The district has one of the more diverse economies with oil and gas, forestry, manufacturing, and services all contributing significantly to GDP. Currently, Bulungan has just over 20,000 ha of oil palm plantations, which contribute up to 2 percent of GDP, but the sector could see rapid expansion as oil palm location permits have been issued covering over 316,000 ha.
Forestry, palm oil, and agriculture make up most of Bulungan’s 18.1 MtCO2e of emissions, 8 percent of the province’s total. More than 7 MtCO2e of emissions stem from degradation and deforestation caused by over-logging in Bulungan’s five HPH concessions of over 560,000 ha. Bulungan contains more than 1 million ha of forest (more than 50 percent of its total area), which are being lost by about 15,000 ha p.a., driven by the expansion of palm oil and agriculture and results in 2.4 MtCO2e. The district’s 80,000 ha of peatland are also an important source of emissions as they are being opened for palm oil, logging, and agriculture. Annual fires in Bulungan from all palm oil, agriculture, and forestry combined account for over 5 MtCO2e.
Bulungan has the potential to reduce annual emissions by 8 MtCO2e by 2030. Implementing RIL in the five HPH concessions would yield 2.5 MtCO2e, and instituting and enforcing a zero burning policy can yield another 2.7 MtCO2e. Together these two initiatives would abate more CO2e than the average coal power plant emits. As palm oil plantations expand in Bulungan, it will be important to ensure that the associated deforestation is minimized. Bulungan has 77,000 ha of very critical and critical lands; if suitable plots were used for palm oil that would otherwise be developed on forest lands, then 1.1 MtCO2e of emissions would be avoided (EXHIBIT 62). The remaining abatement potential is fragmented across many initiatives in palm oil, forestry, agriculture, and coal mining.
Exhibit 61 Bontang’s economy and emissions are dominated by LNG
Bontang economic breakdown
100% =
Services/othersManufacturing
Coal & miningForestry
Palm oil/Estate crops
Agriculture
2006 GDP
25.4 trillion IDR
3%3%
3%
91%
0% 0% 0%0%
Oil & gas
Construction
SOURCE: BPS, team analysis
The LNG accounts for 5 MtCO2e of emissions
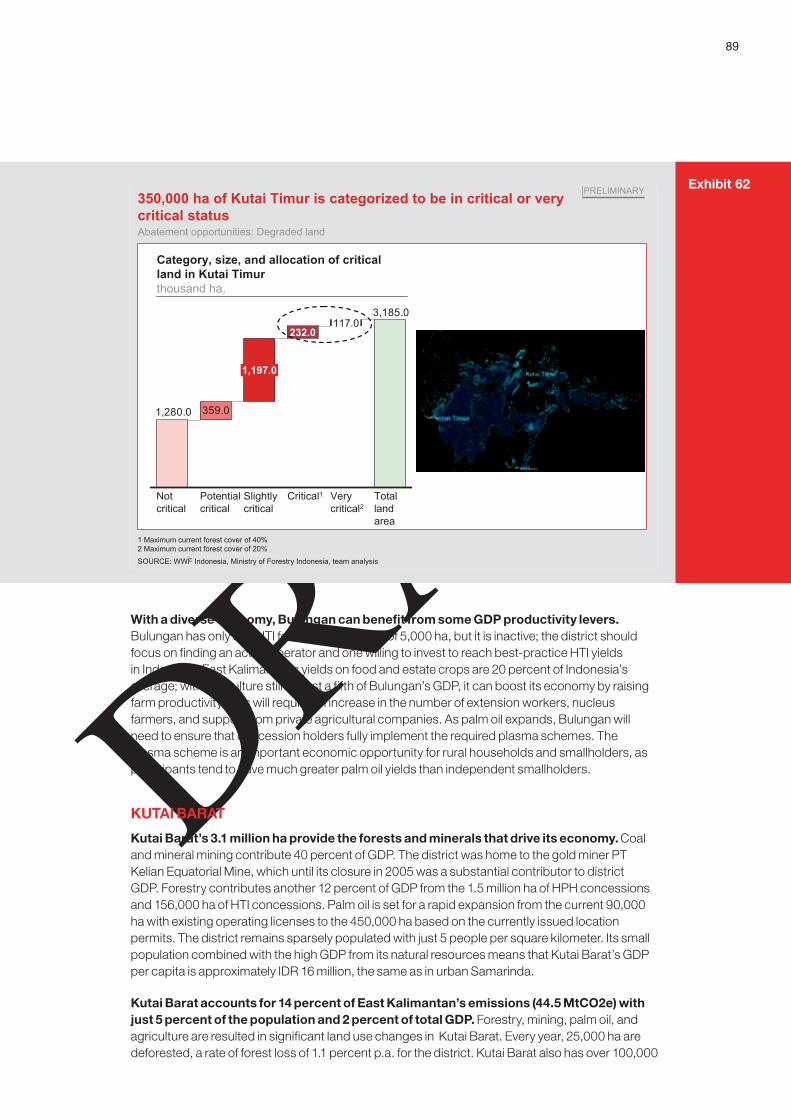
89
DRAFT
Exhibit 62350,000 ha of Kutai Timur is categorized to be in critical or very critical status
PRELIMINARY
SOURCE: WWF Indonesia, Ministry of Forestry Indonesia, team analysis
Category, size, and allocation of critical land in Kutai Timurthousand ha,
Abatement opportunities: Degraded land
1 Maximum current forest cover of 40%2 Maximum current forest cover of 20%
359.0
3,185.0
1,280.0
Not critical
Potential critical
Very critical2
117.0
Critical1
232.0
1,197.0
Slightly critical
Total land area
With a diverse economy, Bulungan can benefit from some GDP productivity levers. Bulungan has only one HTI forestry concession of 5,000 ha, but it is inactive; the district should focus on finding an active operator and one willing to invest to reach best-practice HTI yields in Indonesia. East Kalimantan’s yields on food and estate crops are 20 percent of Indonesia’s average; with agriculture still almost a fifth of Bulungan’s GDP, it can boost its economy by raising farm productivity. This will require an increase in the number of extension workers, nucleus farmers, and support from private agricultural companies. As palm oil expands, Bulungan will need to ensure that concession holders fully implement the required plasma schemes. The plasma scheme is an important economic opportunity for rural households and smallholders, as participants tend to have much greater palm oil yields than independent smallholders.
KUTAI BARAT
Kutai Barat’s 3.1 million ha provide the forests and minerals that drive its economy. Coal and mineral mining contribute 40 percent of GDP. The district was home to the gold miner PT Kelian Equatorial Mine, which until its closure in 2005 was a substantial contributor to district GDP. Forestry contributes another 12 percent of GDP from the 1.5 million ha of HPH concessions and 156,000 ha of HTI concessions. Palm oil is set for a rapid expansion from the current 90,000 ha with existing operating licenses to the 450,000 ha based on the currently issued location permits. The district remains sparsely populated with just 5 people per square kilometer. Its small population combined with the high GDP from its natural resources means that Kutai Barat’s GDP per capita is approximately IDR 16 million, the same as in urban Samarinda.
Kutai Barat accounts for 14 percent of East Kalimantan’s emissions (44.5 MtCO2e) with just 5 percent of the population and 2 percent of total GDP. Forestry, mining, palm oil, and agriculture are resulted in significant land use changes in Kutai Barat. Every year, 25,000 ha are deforested, a rate of forest loss of 1.1 percent p.a. for the district. Kutai Barat also has over 100,000

90
DRAFT
ha of peatland, which is partially degraded and decomposing. Finally, on average fires cover 32,000 ha across forest and peatland per year (EXHIBIT 63). The 1.5 million ha of HPHs contribute over 8 MtCO2e from forest degradation. The fires, particularly those on peatland, contribute an additional 15 MtCO2e. Mining causes 5 MtCO2e of emissions, more than 80 percent of which stem from the associated deforestation to open the mine.
Kutai Barat has the potential to reduce business-as-usual emissions by 34 MtCO2e in 2030. A zero burningpolicy could end the 32,000 ha of fires and abate almost 11 MtCO2e. The implementation of RIL in the 1.5 million ha of HPH could abate an additional 8.7 MtCO2e. Palm oil expansion onto 160,000 ha of degraded land, rather than forest land, would yield a reduction of 2.3 MtCO2e.
The district has the potential to benefit from additional sources of GDP. As coal mining continues in the district, the development of CBM would yield more GDP from each concession. Kutai Barat has the potential to improve its forest sector; more than half of its 150,000 ha of HTI are currently inactive. These could be brought into production, and increasing productivity of all HTI could further boost output in this district.
KUTAI KERTANEGARA
Kutai Kertanegara is an economic powerhouse in the province with the greatest GDP of any district at IDR 28.3 trillion in 2006. The district contains much of the upstream oil and gas fields in East Kalimantan, and they account for 75 percent of GDP. There is substantial coal production as well, over 12 million tons in 2008 and the third highest in East Kalimantan. Kutai Kertanegara’s large natural resources, large amounts of land, and large population distinguishes it from its neighbors. While most of the large districts in East Kalimantan have low populations, Kutai Kertanegara’s 530,000 population is second only to Samarinda and greater than Balikpapan. With
Exhibit 63 Kutai Barat’s fires are dispersed on peatland and along the borders of timber concessions and intact forests
* 2005 data
SOURCE: WRI Interactive Atlas of Indonesia Forests
Intact forest
Peat2003 fires2004 fires2005 fires2006 fires2007 fires
Timber concessions*
Timber plantations*2003 fires2004 fires2005 fires2006 fires2007 fires
170,000 ha of fires in and around
peatlands should be priority target
Fires in 50,000 ha on edge of intact forest should be
priority
Over 1 million ha of land pocketed
with fires

91
DRAFT
substantial natural resource extraction and a population density four times greater than Kutai Barat and Kutai Timur, much of Kutai Kertanegara’s lowland forests have been cleared, with the result that the district is only 30 percent forest covered today. The district also contains around 250,000 ha of peatlands, the second most of any district, but these too have been mostly deforested and drained.
With baseline emissions of 52.3 MtCO2e in 2005, Kutai Kertanegara has the largest emissions in East Kalimantan. The single largest source comes from fires, particularly on the district’s exposed peatlands, which release 16.8 MtCO2e annually. Emissions from continued clearing of forests are also sizeable. Palm oil expansion into forest results in 6.0 MtCO2e. While there are already 220,000 ha of concessions with HGU approvals today, there will be continued expansion as 466,000 ha have location permits. Kutai Kertanegara has far fewer emissions from forestry than its neighbors as it has comparatively less land in HPH and HTI concessions, 480,000 and 37,000 ha respectively. In fact, most of the district’s forests have been converted to uses for other economic sectors. But deforestation has not yet plateaued; mining is particular strong in Kutai Kertanegara, resulting in emissions of 5.4 MtCO2e from deforestation for mining activities, more than any other district from this source.
By optimizing its land use, Kutai Kertanegara could reduce the carbon footprint of its current economic activities by 34.5 MtCO2e against 2030 business as usual. The largest potential comes from instituting zero burning (9.0 MtCO2e), rehabilitating peatlands (5.4 MtCO2e), using degraded lands for oil palm expansion (3.0 MtCO2e), reforesting slightly degraded lands (2.8 MtCO2e), and stopping illegal mining (2.4 MtCO2e). Fires occur throughout most of Kutai Kertanegara’s 2.7 million ha; fighting fires across such a large expanse will be costly and difficult. The priority should be to target fires in and around the district’s 250,000 ha of peatland, which produce much greater emissions from fire. Rehabilitating opened peatlands and rewetting them will also help reduce the spread of fires while reducing emissions from peat decomposition.
Degraded land offers a large opportunity for Kutai Kertanegara to reduce emissions, but the district will require significant effort to use this lever properly. The district has 203,000 ha of critical and very critical land with low forest cover that would allow for the expansion of palm oil plantations without the high emissions of deforestation. However, only 93,000 ha of the land has plots of at least 500 ha or larger. These lands would need to be consolidated as typically a palm oil plantation needs 5,000 continguous hectares to attract investment. In addition, given the district’s relatively high population density of 19 people per square kilometer, significant time and effort may be necessary to ensure that all communities in degraded lands give free and prior informed consent to use the lands for new concessions. Perhaps easier would be the reforesting of the 950,000 ha of slightly critical and potentially critical lands, as no minimum plot sizes nor consolidation would be required.
Despite already having the largest economy in East Kalimantan, Kutai Kertanegara could expand its economy faster, particularly from developing coal-bed methane and accelerating exploration and investment in oil and gas exploration. With oil and gas such a dominant part of the economy yet a relatively low source of emissions, Kutai Kertanegara can support BP MIGAS to accelerate exploration in oil and gas fields by providing regulatory incentives. In particular, it is important for the district that the Offshore Mahakam field has clear ownership and investment plans as it will soon come off plateau and need substantial new capital to slow the decline in its production. A top priority for the district would be the development of coal-bed methane as a complement to its existing oil and gas production; this requires working with the province and national BP MIGAS to ensure regulations support its rapid development. Every day that Kutai Kertanegara mines 34 thousand tons of coal without capturing CBM first, the valuable methane is released into the atmosphere; representing an increase in greenhouse gases and a permanently lost opportunity to sell that gas. Kutai Kertanegara already has three of the four blocks approved for CBM in East Kalimantan.
92
DRAFT
KUTAI TIMUR
Kutai Timur is coal country in East Kalimantan, producing 75 million of East Kalimantan’s total of 118 million tons, and providing 85 percent of the district’s IDR 13.7 trillion GDP. Kutai Timur is large by all measures: the second largest in terms of land at 3.6 million ha, the second highest GDP per capita at IDR 78 million, and the most permits issued for palm oil at 81. The district has ambitious plans for palm oil; and while it has 170,000 ha with HGU approvals (second highest in East Kalimantan), it has plans to expand more than fourfold with 838,000 ha of location permits issued, more than double any other district. Given this development, much of the district’s lowland forests have already been cleared. There are still 1 million ha of forest remaining, mainly in the less accessible mountainous interior, but these are still mostly covered by HPH concessions. Kutai Timur is also home to one of the district’s largest national parks, the Kutai National Park, which although ravaged by El Nino forest fires of 1997–1998, remains an important conservation area.
Kutai Timur’s emissions of 31.4 MtCO2e in 2005 were the fourth highest in East Kalimantan. Like the other Kutai districts, fires from all sectors are an important contributor, emitting 8.5 MtCO2e annually. Other large sources include 4.2 MtCO2e from mining, 80 percent of which is due to the associated deforestation from open pit mining. An additional 3.9 MtCO2e results from deforestation for the expansion of palm oil plantations. The combined deforestation from palm oil, mining, small holders, and all other sources results in almost 20,000 ha of forest lost each year, equivalent to 2 percent of remaining forest cover.
Kutai Timur can reduce its emissions by 31.5 against the 2030 business-as-usual scenario with a focus on utilizing degraded lands. With 350,000 ha of very critical and critical lands, it has more degraded land available than any other district. After discounting for land with plots of 500 ha or larger, there is still 160,000 ha available. These lands can be used for palm and provide 3.4 MtCO2e in abatement from avoided deforestation. Deforestation from coal mining, though, cannot be abated via land swaps with degraded lands as coal resources are fixed geographically.
With coal such a vital part of Kutai Timur’s economy, the district can gain the most value from its current mining, primarily by supporting coal-bed methane and ensuring that mining sites are rehabilitated. Like Kutai Kertanegara, Kutai Timur has sizeable coal-bed methane reserves, and current coal production is releasing and wasting valuable natural gas. The district already has one CBM block: Sangatta West CBM PSC. The district can help reinforce to BP MIGAS the importance that it quickly auction further blocks as well as remove regulatory obstacles. Under its direct control, Kutai Timur should also reevaluate how it issues future licenses, as developing CBM is more difficult when many small KP licenses each have a portion of a larger coal seam, as the CBM operator would need to negotiate with many companies before starting investment. Also, with such a large mining expansion, Kutai Timur needs to put a higher priority on the rehabilitation and reclamation of post-mining lands. Over 140 thousand ha of land is estimated to be disturbed by 2030; if this is not reclaimed and rehabilitated (as is the current case with an estimated 80 percent of KP companies), then the land will be unusable for any other economic activity such as agriculture, acacia plantations, or palm oil plantations. Reclaiming, rehabilitating, and then re-using mining lands is a sizeable economic opportunity for the district.
MALINAU
Malinau holds the largest remaining natural forests in East Kalimantan and has retained the most forest cover at 90 percent. In fact, Malinau’s 3.8 million ha of forests make up almost a third of the entire province’s forest cover. Malinau can claim the smallest loss of forest, in absolute terms, at just 4,000 ha per year of any district excluding the four cities. It is also the largest district at 4.2 million ha and has the smallest population and lowest population density at 66,000 people and 2 people per square kilometer. Its GDP is the lowest at IDR 485 billion. With no oil, gas, or mining, Malinau’s economy depends on forestry, agriculture, and the service sector (largely from public administration). Malinau is also officially a conservation district; it is an integral part of the Heart of
93
DRAFT
Borneo conservation area as well as home to Sebuku Sembakung national park, home to the few remaining clouded leopards, sun bears, and other iconic but disappearing Borneo animals.
Malinau’s baseline emissions were only around 8 MtCO2e in 2005, the fifth lowest in East Kalimantan. More than half of all emissions come from logging. The single largest HPH concession in East Kalimantan is PT Essam Timber’s 355,000 ha concession in Malinau. In total, the district has nine companies operating HPH concessions covering 765,000 ha. Unsustainable logging practices, such as poor use of skid paths, results in forest degradation and emissions of 4.7 MtCO2e. There is also approximately 2.6 MtCO2e from smallholder deforestation for agriculture. Other sources are quite small.
Malinau could abate 7.4 MtCO2e against 2030 business as usual, primarily through reduced impact logging. Given its large areas of HPH concessions, Malinau should focus on implementing RIL. Working with the nine HPH concessionaires to implement skid paths, use winches (as opposed to bulldozers), and other RIL methods could yield the same amount of saleable timber from the concessions but with 30 to 50 percent less emissions, as less collateral biomass is destroyed in the logging process. Malinau also has almost 90,000 ha of degraded land that can be used for expansion of agriculture and palm oil. While there are no palm oil concessions yet with HGU approval, eight concessions totaling 134,000 ha have received location permits; it is important that the palm oil concessions utilize as much of the existing degraded land as possible. Given that Malinau already has low emissions, its environmentally sustainable development strategy needs to focus less on reducing emissions from existing activities than ensuring that future growth comes from higher-value added activities or low carbon sectors.
More than 40 percent of Malinau’s GDP is derived from forestry, which is thus an important sector for growth. Given its large HPH concessions, it is important to ensure that as much value as possible is gained from the logging activities. One way is to ensure high utilization of harvested logs, so that in addition to using the lower tree areas for plywood and veneer the concessionaires use the smaller branches for pulp and paper and wood pellet production. While Malinau’s inland position makes it an unfavorable location for a pulp and paper mill, the district can focus on other downstream forestry products, such as niche wood products and non timber forest products.
Agriculture will also remain important for Malinau. Agriculture provides income to the rural villages in Malinau and currently makes up 6 percent of GDP. While Malinau’s low population has fewer smallholders to reach, they are scattered throughout the district, which makes improving agricultural productivity more challenging. Growing more estate crops in addition to staple crops on small plots of degraded land can also boost GDP.
NUNUKAN
Nunukan, the large district on East Kalimantan’s northern border, has abundant forests and peatland as well as a diverse economy. Like its neighbor Malinau, Nunukan retains much of its forest cover, more than 80 percent. But unlike Malinau, Nunukan has substantial peatlands, over 400,000 ha, more than any other district of the province’s total. Its IDR 1.2 trillion GDP is fairly diverse: oil and gas from the district contributes 30 percent of GDP, services account for 20 percent, forestry 16 percent, coal 13 percent, agriculture 11 percent, and palm oil 3 percent.
Nunukan has substantial emissions with a baseline of 40 MtCO2e in 2005, almost one-fifth of the province’s total. While Nunukan does not have the highest level of deforestation nor the largest population, damage to its abundant peatlands have pushed up its emissions. Smallholder fires spread across degraded peatlands, causing 16 MtCO2e of emissions annually. Likewise, Nunukan’s 278,000 ha of HPH concessions partly cover its peat forests; the logging leads to peat decomposition emitting 6.8 MtCO2e, much larger than the 1.5 MtCO2e resulting from unsustainable logging practices. Nunukan has few palm oil concessions, just 78,000 ha with HGU licenses, and there is currently little expansion, as only 97,000 ha have location permits. These

94
DRAFT
palm oil concessions, though, do overlap with the district’s peatland, and the required drainage of peat to grow oil palms exposes the peat’s carbon to air; the decomposition releases 7.1 MtCO2e.
The key to reducing Nunukan’s emissions is better management of its peatlands, which can provide 8.9 out of the 25 MtCO2e abatement potential against 2030 business as usual. Fortunately, most of Nunukan’s fires are concentrated; the district could capture most of the total abatement from a zero burningpolicy for agriculture (7.2 MtCO2e) by focusing on just 50,000 ha of peatland. Maintaining water levels and reducing drainage in peatland can reduce emissions by another 3.6 MtCO2e. Likewise, rehabilitating peatlands in agriculture and forest concessions can yield 2.1 and 4.0 MtCO2e abatement respectively. There would also be gains from instituting reduced impact logging in the five current HPH concessions (1.5 MtCO2e potential) and using some of the district’s 133,000 ha of degraded land for palm oil expansion (1.9 MtCO2e potential).
With a diverse economy, good access from its ports, and proximity to Malaysia, Nunukan has the potential to move into downstream products as well as increase its economic productivity. Nunukan should join the efforts to lobby BP MIGAS to improve the regulatory policies to encourage oil and gas exploration as well as coal-bed methane. While Nunukan is not part of the massive Kutai Basin that holds most of the province’s oil and gas reserves, it does partially overlay the Tarakan basin. Nunukan can also benefit from raising the productivity of its agricultural and palm oil sectors, which make up 14 percent of the district’s economy. And while the district currently has no HTI concessions, with 133,000 ha of degraded land, it has the potential to develop acacia plantations without deforestation.
PENAJAM PASER UTARA
Penajam Paser Utara is a relatively small coastal district. It is the smallest district at 330,000 ha, but has a long coastline with 65,000 ha of beaches. With 37 people per square kilometer, Penajam Paser Utara has the highest population density outside of East Kalimantan’s cities. Its GDP per capita is equal to that of Samarinda. Oil and gas make up 45 percent of the economy, but most of the population is engaged in agriculture and fishing, which accounts for 9 percent of GDP. The district also has a significant manufacturing sector making up 19 percent of GDP, mostly agricultural processors and industrial manufacturers located near the border with Balikpapan. The district’s lowland location means its forests are easily accessible and thus have largely been utilized. Only 19 percent of its forest cover remains, less than any district, yet forest loss continues with an annual loss of 5,000 ha (equal to 8 percent of remaining forest cover).
With largely degraded lands and a small size, Penajam Paser Utara’s baseline emissions were only 6.3 MtCO2e in 2005, the lowest in East Kalimantan. The largest source is from deforestation, from expansion of agriculture and palm oil, at 2.7 MtCO2e. While there are currently only 27,000 ha of HGU-licensed concessions, palm oil could expand more than four-fold with 130,000 of location permits granted to 14 companies. Additional emissions of 2.1 MtCO2e stem from logging of the district’s remaining forests.
Abatement potential is estimated to be 6.3 MtCO2e against business as usual identified. The largest abatement would be from using the district’s 20,000 ha of degraded land for expansion of agriculture and palm oil, yielding 2.5 MtCO2e in abatement. There is abatement potential from zero burning and reforestation, but this is small at 0.3 and 0.4 MtCO2e respectively. Reduced impact logging of the remaining forest is important and could yield 2.6 MtCO2e abatement in 2030.
Penajam Paser Utara has the potential to boost its GDP among its diverse sectors. With oil and gas contributing so much to GDP, the district can support the province’s efforts to work with BP MIGAS to accelerate exploration and ensure maximum investments in current fields. With a substantial part of its population involved in agriculture, aquaculture, and fishing, raising productivity in these sectors is important and will require support from extension workers and nucleus farmers. The compact district’s coastal location and proximity to Balikpapan makes it a prime candidate for high-value niche crops such as oranges as well as a base for downstream

95
DRAFT
agricultural processing. As Penajam Paser Utara develops its palm oil sector, it is important to ensure plasma schemes are implemented, whereby plantation owners support surrounding smallholders of oil palm. Finally, the district has one HTI concession of 16,000 ha, the district can encourage the concession holder to invest to ensure best practice yields.
PASIR
Pasir, on East Kalimantan’s southern border, has a sizeable IDR 1.6 trillion economy with substantial coal deposits. Two-thirds of GDP comes from coal mining and agriculture and palm oil contribute significantly at 9 percent and 6 percent respectively. Its GDP per capita is roughly equal to that of Samarinda. Despite its development of natural resources, Paser still retains 50 percent forest cover, mainly in the mountainous interior.
Pasir’s 2005 emissions were approximately 12.3 MtCO2e in 2010, 6 percent of the province’s total. Land devoted to palm oil is expanding, from 95,000 ha with HGU to a potential 267,000 ha with IL, resulting in emissions of 2.1 MtCO2e from deforestation and an additional 1.6 MtCO2e from smallholder fires. Paser has 197,000 ha of HPH concessions; unsustainable logging practices in those areas produce annual emissions of 2.4 MtCO2e.
While emissions will grow under business as usual, there is potential to reduce emissions against business as usual by over 9.8 by 2030. Sustainable forestry in the HPH concessions could yield 1.2 MtCO2e in abatement; with just four companies, Pasir can easily monitor all of them as they implement reduced impact logging. Currently, there is only one HTI and that is for 9,000 ha, but it is inactive; however, moving future HTI expansions to degraded land could yield 2.4 MtCO2e in reductions. There is over 375,000 ha of suitable for reforestation (as opposed to land swaps for palm oil or acacia plantations); this would provide 1.1 MtCO2e abatement.
GDP improvement can come from improved productivity as well as increased use of degraded lands. Pasir has relatively large amounts of very critical and critical land, 173,000 ha, that can be used to expand agriculture and acquaculture. In particular, Pasir can encourage the growing of high-value estate crops in the smaller plots by smallholders. With agriculture and palm oil making up 15 percent of the economy, raising the yields could improve GDP significantly as well as rural incomes. Finally, Pasir can find an active operator for its one existing HTI concession.
SAMARINDA
Samarinda, on the banks of the Mahakam river, is East Kalimantan’s capital and largest city. With a population of 620,000, it is larger than Balikpapan. Whereas Balikpapan is a commercial center, Samarinda is East Kalimantan’s adminstirative center. Two-thirds of its IDR 9.9 trillion economy is from services, mainly public administration; Samarinda is home to the provincial ministries, parliament, as well as other agencies. The city is also home to the large Mulawarman University with over 33,000 students. While the city has no palm oil or forest plantations, it does contain coal deposits, which generate 4 percent of GDP.
With just 3.3 MtCO2e in emissions, Samarinda is less than 2 percent of East Kalimantan’s total emissions. As the city comprises only 72,000 ha and is already primarily deforested, there are few emissions from changes in land use. However, Samarinda does have small amounts of peat, around 20,000 ha, which are degraded and decomposing, releasing an estimated 1.7 MtCO2e. However, most of the city’s emissions are due to the power and transportation needs of its manufacturing and service sectors, which combined produce 2 MtCO2e.
Samarinda’s abatement options will yield small reductions but can be symbolic. With low current emissions, there is not much room for reduction. As the province’s capital, though, Samarinda’s abatement initiatives can have symbolic value. Events such as the Kaltim Green Bike Event can demonstrate commitment to reducing emissions from transportation. Rehabilitating

96
DRAFT
the city’s peatlands would also be an important visible act. The city’s 38,000 ha of potentially and slightly critical lands can also be reforested under the Kaltim Green One Man Five Trees program.
TARAKAN
Tarakan is East Kalimantan’s only island city, with an economy built on trade and tourism. Its location near Malaysia has made it a natural crossing point between the two countries with daily ferries. Its IDR 2.1 trillion economy is dominated by the service sector (70 percent of GDP), which is focused on trade, hotels, and tourism. Manufacturing (11 percent of GDP) and agriculture (10 percent) are the other main sectors. The smallest city, Tarakan has retained more forest cover than the other cities with 20 percent remaining of its 25,000 ha. This includes mangrove forests, which are particularly important as they protect the island’s coasts from extreme weather conditions.
Tarakan also has the smallest CO2e emissions with a baseline of 0.3 MtCO2e in 2005. Tarakan is losing around 800 ha of forest a year, out of only 5,800 ha remaining, deforestation results in 70 percent of its emissions. Deforestation results in 70 percent of its emissions. The remainder is due to power consumption and transportation for its service and manufacturing sectors.
The city will have to look for small-scale improvements to reduce emissions. Stopping current deforestation could yield 0.1 MtCO2e of abatement. In addition, Tarakan has 7,000 ha of slightly and potentially critical lands that can be reforested under the One Man Five Trees program. Beyond these efforts, Tarakan could conduct a further assessment of transportation and power initiatives, such as moving to improved combustion engines for vehicles, enhanced public transport, and higher energy efficiency standards for buildings to match its emissions profile, which is more like that of a developed city than the large forested districts.
5. AdaptationClimate change poses significant potential risks to economies and people. Like many other countries, Indonesia is vulnerable to climate events such as floods, tropical storms, and other severe weather disasters. Climate change could significantly increase those risks as the increase in greenhouse gas emissions will result in changes in global air temperatures, frequency and amount of rainfall, and sea levels and temperatures. Climate change plays havoc on local economies through event hazards and gradual shift hazards. Event hazards are extreme weather events like storms, hurricanes, droughts, coastal flooding, inland flooding, and fires. Gradual shift hazards are gradual rises in sea levels and salinisation and climate zone shifts that impact agricultural yields or spread of vector-borne diseases such as malaria.
An adaptation strategy recognizes that some level of climate change is inevitable and seeks to prepare the economy and population to be more resilient to the negative effects of such climate changes. Even under the optimistic IPCC scenario, under which the world takes substantial action to cut current greenhouse gas emissions, atmospheric greenhouse gases are expected to reach 450 parts per million, resulting in a global warming of 2°C. In addition, IPCC’s Fourth Assessment Report shows that global warming to 2030 will be little influenced by greenhouse gas emissions in the next 20 years due to lags in the climate system. Thus, countries need to adopt adaptation measures to protect their people and economies from the negative effects of increasing climatic risks that will occur in the medium term.
The IPCC predicts several scenarios for global climate change reflecting the uncertainty of the world’s future greenhouse gas emissions. The B1 scenario assumes that the world moves toward an environmentally sustainable model and average temperatures increase by just 1.5°C by 2100. A scenario of rapid economic growth and balanced energy sources (A1B scenario) would see a 2.4°C increase by 2100. Finally, a scenario in which the world is economically focused
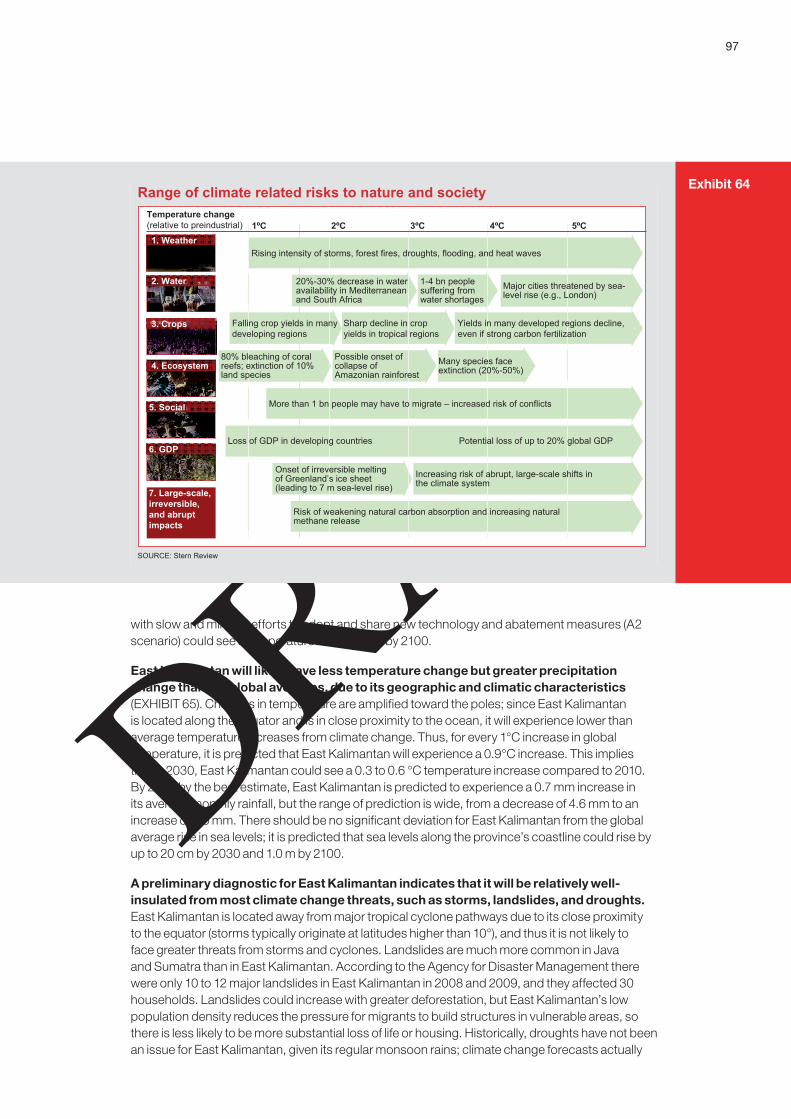
97
DRAFT
with slow and minimal efforts to adopt and share new technology and abatement measures (A2 scenario) could see a temperature rise of 3.2°C by 2100.
East Kalimantan will likely have less temperature change but greater precipitation change than the global averages, due to its geographic and climatic characteristics (EXHIBIT 65). Changes in temperature are amplified toward the poles; since East Kalimantan is located along the equator and is in close proximity to the ocean, it will experience lower than average temperature increases from climate change. Thus, for every 1°C increase in global temperature, it is predicted that East Kalimantan will experience a 0.9°C increase. This implies that in 2030, East Kalimantan could see a 0.3 to 0.6 °C temperature increase compared to 2010. By 2030 by the best estimate, East Kalimantan is predicted to experience a 0.7 mm increase in its average monthly rainfall, but the range of prediction is wide, from a decrease of 4.6 mm to an increase of 4.0 mm. There should be no significant deviation for East Kalimantan from the global average rise in sea levels; it is predicted that sea levels along the province’s coastline could rise by up to 20 cm by 2030 and 1.0 m by 2100.
A preliminary diagnostic for East Kalimantan indicates that it will be relatively well-insulated from most climate change threats, such as storms, landslides, and droughts. East Kalimantan is located away from major tropical cyclone pathways due to its close proximity to the equator (storms typically originate at latitudes higher than 10°), and thus it is not likely to face greater threats from storms and cyclones. Landslides are much more common in Java and Sumatra than in East Kalimantan. According to the Agency for Disaster Management there were only 10 to 12 major landslides in East Kalimantan in 2008 and 2009, and they affected 30 households. Landslides could increase with greater deforestation, but East Kalimantan’s low population density reduces the pressure for migrants to build structures in vulnerable areas, so there is less likely to be more substantial loss of life or housing. Historically, droughts have not been an issue for East Kalimantan, given its regular monsoon rains; climate change forecasts actually
Exhibit 64
7. Large-scale, irreversible, and abrupt impacts
1ºC 2ºC 3ºC 4ºC 5ºC
4. Ecosystem
6. GDP
Temperature change(relative to preindustrial)
1. Weather
2. Water
3. Crops
5. Social
Increasing risk of abrupt, large-scale shifts in the climate system
1-4 bn people suffering from water shortages
Major cities threatened by sea-level rise (e.g., London)
Many species face extinction (20%-50%)
Potential loss of up to 20% global GDP
Yields in many developed regions decline, even if strong carbon fertilization
Possible onset of collapse of Amazonian rainforest
Sharp decline in crop yields in tropical regions
Risk of weakening natural carbon absorption and increasing natural methane release
Onset of irreversible melting of Greenland’s ice sheet (leading to 7 m sea-level rise)
20%-30% decrease in water availability in Mediterranean and South Africa
80% bleaching of coral reefs; extinction of 10% land species
More than 1 bn people may have to migrate – increased risk of conflicts
Loss of GDP in developing countries
Falling crop yields in many developing regions
Rising intensity of storms, forest fires, droughts, flooding, and heat waves
Range of climate related risks to nature and society
SOURCE: Stern Review
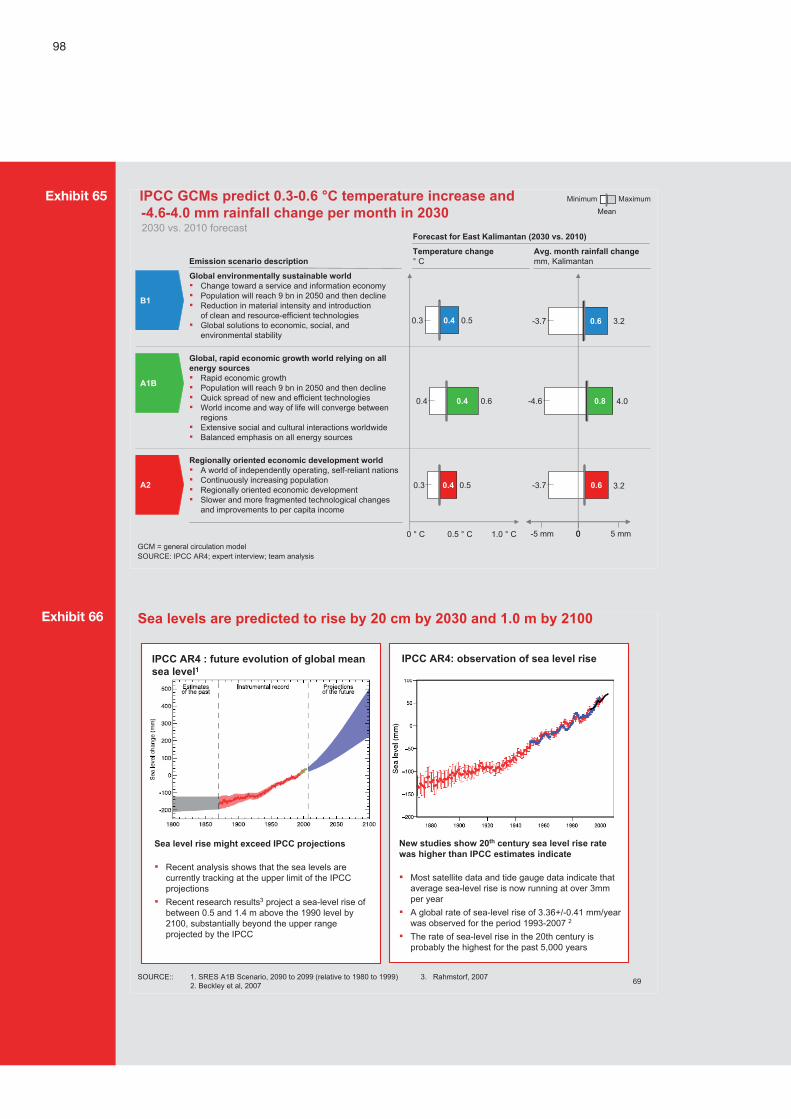
98
DRAFT
Exhibit 65
B1
A1B
A2
IPCC GCMs predict 0.3-0.6 °C temperature increase and -4.6-4.0 mm rainfall change per month in 2030
SOURCE: IPCC AR4; expert interview; team analysis
Emission scenario description
Global environmentally sustainable world! Change toward a service and information economy! Population will reach 9 bn in 2050 and then decline! Reduction in material intensity and introduction
of clean and resource-efficient technologies ! Global solutions to economic, social, and
environmental stability
Global, rapid economic growth world relying on all energy sources! Rapid economic growth! Population will reach 9 bn in 2050 and then decline! Quick spread of new and efficient technologies ! World income and way of life will converge between
regions! Extensive social and cultural interactions worldwide! Balanced emphasis on all energy sources
Regionally oriented economic development world! A world of independently operating, self-reliant nations! Continuously increasing population! Regionally oriented economic development! Slower and more fragmented technological changes
and improvements to per capita income
Forecast for East Kalimantan (2030 vs. 2010)
Temperature change° C
Avg. month rainfall changemm, Kalimantan
2030 vs. 2010 forecast
0.6-3.7
0.5 ° C 1.0 ° C0 ° C -5 mm 00 5 mm
-4.6 0.8
-3.7 0.6
0.60.4 0.4
Minimum Maximum
Mean
0.50.3 0.4
0.50.3 0.4 3.2
3.2
4.0
GCM = general circulation model
69
Sea levels are predicted to rise by 20 cm by 2030 and 1.0 m by 2100
SOURCE:: 1. SRES A1B Scenario, 2090 to 2099 (relative to 1980 to 1999) 3. Rahmstorf, 20072. Beckley et al, 2007
IPCC AR4: observation of sea level rise
New studies show 20th century sea level rise rate was higher than IPCC estimates indicate
! Most satellite data and tide gauge data indicate that average sea-level rise is now running at over 3mm per year
! A global rate of sea-level rise of 3.36+/-0.41 mm/year was observed for the period 1993-2007 2
! The rate of sea-level rise in the 20th century is probably the highest for the past 5,000 years
IPCC AR4 : future evolution of global mean sea level1
Sea level rise might exceed IPCC projections
! Recent analysis shows that the sea levels are currently tracking at the upper limit of the IPCC projections
! Recent research results3 project a sea-level rise of between 0.5 and 1.4 m above the 1990 level by 2100, substantially beyond the upper range projected by the IPCC
Exhibit 66

99
DRAFT
predict increased precipitation for the region. There is also a weaker link between climate change and droughts although there is a link to the El Nino Southern Oscillation (which in turn is linked to the low rainfall and dramatic spread of man-made fires in 1997 and 1998 in East Kalimantan).
Agricultural yields could be significantly affected. Whereas many plant species are adapted to seasonal temperature variations, tropical species typically have a much lower tolerance for changes in temperature. The World Bank predicts that by 2050 Indonesia could see a 10 percent decrease in major crop yields due to temperature and rainfall changes. Finally, vector-borne diseases can increase, as dengue- and malaria-carrying mosquitoes expand their habitats with rising temperatures. East Kalimantan currently has a low incidence of malaria; its future moderate temperature increase compared to global averages and mountainous interior (higher altitudes with lower temperatures) could serve to moderate any expansion of the habitat of vector-borne diseases.
East Kalimantan has extensive coral reefs, 86 percent of which are considered at risk.22 Indonesia’s longest continuous barrier reef system, the Sunda Barrier Reef, some 630 kilometers long, lies on the edge of the Sunda Shelf. It is largely unexplored despite its size and potential economic, social, and biological importance. East Kalimantan’s coral reefs are impacted by climate change in three ways. Coral bleaching occurs during abnormally high temperatures in the ocean and kills coral if they last more than two weeks. Coral drowning occurs when coral cannot grow fast enough to keep up with rising sea levels. Oceanic acidification occurs as more CO2 is dissolved in the ocean and disturbs coral growth.
However, the threats of coastal flooding and inland flooding could pose a moderate risk to the province overall and potentially substantial localized risk to specific districts. East Kalimantan has 1,185 km of coastline, 368 small islands, and several coastal cities, such as Tarakan, Bontang, and Balikpapan. While East Kalimantan is relatively protected from event-driven (or storm-driven) coastal flooding, it is susceptible to coastal flooding from gradual rises in sea
22 Based on Indonesia’s overall average as estimated by Reefs at Risks.
Exhibit 67East Kalimantan climate risk landscape: Current climate risks already pose a moderate threat to people and assets
Bontang
Balikpapan
Samarinda
Tarakan
NunukanRegion
MalinauRegion
Kutai TimurRegion
Kutai Kartanegara Region
Kutai Barat
Region
Penajam PU Region
Pasir Region
BerauRegion
Bulungan Region
! East Kalimantan has low incidence of landslides compared to Java or Sumatra
! Linked to rainfall intensity and land use
Landslides
Drought
! Low historical incidence outside; but increased fires of 1997-98 linked to El Nino
! Linked to ENSO, but weak climate change link
East Kalimantan is prone to event-driven natural hazards …… and also faces hazards from gradual climate change shifts
SOURCE: EM-DAT;East Kalimantan in Statistics BPS; press clippings; interviews; academic literature
Coastal flooding and sea-level rise
! East Kalimantan has a long coastline with major population centers
! Susceptible to sea level rise! Strong relationship to climate
change
Inland flooding
! El Niño Southern Oscillation and rainfall are strong drivers
! Flooding in Samarinda! Moderate link with climate
change
! Increasing temperature and rainfall are largely accepted as factors that increase malaria infection rates
Malaria and vector-borne diseases
! Agriculture is 5% of GDP but important in rural areas
! World Bank predicts yields could be negatively impacted by 10% in Indonesia due to climate change
Agriculture yield change
! Source of livelihood (fisheries, tourism, etc.) and natural barrier of protection
! Coral is killed by bleaching, drowning, and acidification, linked to climate
Damage to coral reefs
Moderate risk
Storms
! East Kalimantan is away from major tropical cyclone tracks, due to close proximity to the Equator (storms typically originate > 10 o)

100
DRAFT
level. Inland flooding has been a significant threat to areas such as the Mahakam delta and the capital city of Samarinda, which have substantial populations.
COASTAL FLOODING
East Kalimantan has 194,000 ha of land that is vulnerable to coastal flooding. While sea levels are estimated to rise by 20 cm by 2030, the threat is heightened as factors such as storms and the El Nino Southern Oscillation can amplify waves and the amount of land at risk of inundation. Given these factors, land that is less than 1 meter above sea level (ASL) is typically considered vulnerable. East Kalimantan has 194,000 ha that 1 meter or less ASL. Although this represents just 1 percent of the province’s land, four districts have disproportionally greater areas at risk: Tana Tidung (10.2 percent of its area is vulnerable), Samarinda (4.2 percent, although this land is more vulnerable to inland rather than coastal flooding), Bontang (3.8 percent), and Tarakan (3.6 percent). These estimates likely underestimate the threat to East Kalimantan’s coasts, though, as elevations are measured by satellite23 which can not penetrate East Kalimantan’s dense forests. An estimate of land that is 20 meter ASL or less, while certainly an overestimate, would compensate for low elevations covered in forest and gives an upper bound of over 2 million of vulnerable lands.
Coastal flooding will have a disproportionally large economic impact on East Kalimantan. Although the area that is vulnerable to coastal flooding is relatively small, it contains some of the province’s largest assets. East Kalimantan’s single international airport, Seppingan airport in Balikpapan, is on the coast and less than 1 meter ASL; Tarakan’s airport is similarly vulnerable. The multi-billion dollar LNG plant in Bontang, the single greatest capital investment in the province, is at risk. Similarly, the Pertamina refinery on the coast in Balikpapan is on vulnerable land. These two assets generated more than 27 percent of all of East Kalimantan’s GDP in 2008.
23 Shuttle Radar Topography Mission (SRTM)
Exhibit 68 1% of East Kalimantan’s land is vulnerable to coastal flooding
SOURCE: Radar Topography Mission (SRTM), team analysis
14
613
885
901
East Kalimantan 194,213
Malinau
Bontang
Balikpapan
Tarakan
Samarinda 3,033
Kutai Timur 6,941
Penajam Paser Utara 8,459
Kutai Barat 12,865
Paser 14,918
Berau 16,176
Nunukan 24,540
Bulungan 28,818
Tana Tidung 34,148
Kutai Kertanegara 41,902
1.0
0.0
3.8
1.7
3.6
4.2
0.2
2.7
0.4
1.4
0.7
1.7
2.2
10.2
1.6
Area less than 1 m ASLHa
As percent of total area

101
DRAFT
In addition to the refinery and airport, much of Balikpapan’s commercial and residential assets will also be vulnerable to coastal flooding.
A combination of hard and soft mitigations will be needed to adapt to coastal flooding. Making East Kalimantan’s major economic assets, such as airports and the refinery, more flood resilient justifies investment in infrastructure measures such as sea walls and dikes. Low level farmland could be more economically protected by restoring and protecting the provinces’ natural mangrove forests, which reduce wave intensity and inundation. Better disaster planning is critical for Balikpapan, a city with significant vulnerable urban areas; being able to quickly deploy sandbags, providing shelter for those whose homes are flooded, and facilitating access to insurance and credit will all help the city adapt to any increase in coastal flooding.
INLAND FLOODING
Inland flooding has been a challenge for East Kalimantan, displacing 80,000 people since 2007. The province has experienced at least 50 inland flooding events in the past four years. Most of these floods have been small, lasting just one day and reaching less then 0.5 meters in height. There are, however, occasional floods that are more severe. In June 2007, a month long flood in Kutai Barat and Kutai Kertanegara inundated over 34,000 square kilometers and displaced 60,000 people. In September that year, a flood covered Balikpapan in over 1 meter of water and caused the deaths of 4 people. In April 2009, flooding closed much of Samarinda and resulted in 20,000 people fleeing their homes. As climate change is forecasted to increase monthly precipitation in East Kalimantan (best estimate 0.7 mm increase, range of -4.6 to +4.0 mm), there is a risk of increased inland flooding; however, the relationship between inland flooding and rainfall depends on frequency and intensity of rainfall and not just the average amount, thus more study of rain patterns as well as specific hydrological characteristics of the province’s rivers is needed to fully understand the climate change impact on inland flooding in East Kalimantan.
Exhibit 69Some major economic assets are in flood vulnerable zones
SOURCE: Radar Topography Mission (SRTM), team analysis
LNG plant, Bontang Juwata Airport, Tarakan
Pertamina refinery, BalikpapanSepinggan International Airport, Balikpapan
<1m a.s.l.
<20m a.s.l.
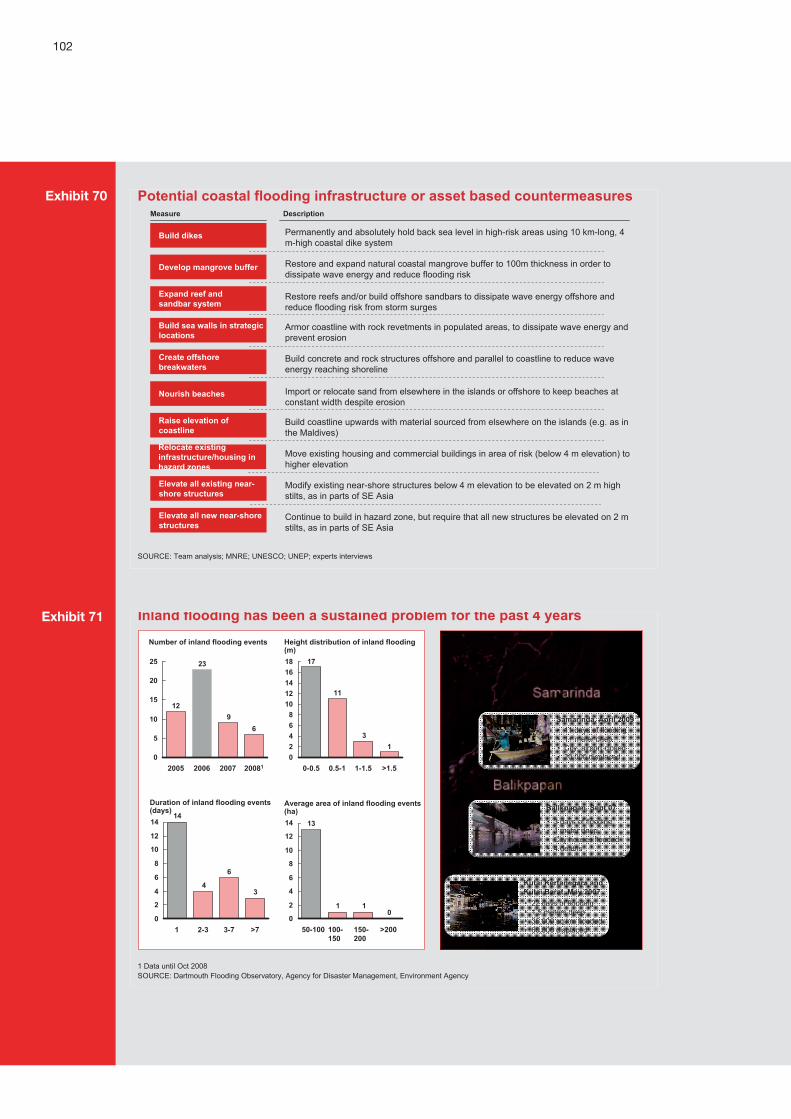
102
DRAFT
Exhibit 70
SOURCE: Team analysis; MNRE; UNESCO; UNEP; experts interviews
Build dikes Permanently and absolutely hold back sea level in high-risk areas using 10 km-long, 4 m-high coastal dike system
Create offshore breakwaters
Build concrete and rock structures offshore and parallel to coastline to reduce wave energy reaching shoreline
Expand reef and sandbar system
Restore reefs and/or build offshore sandbars to dissipate wave energy offshore and reduce flooding risk from storm surges
Develop mangrove buffer Restore and expand natural coastal mangrove buffer to 100m thickness in order to dissipate wave energy and reduce flooding risk
Build sea walls in strategic locations
Armor coastline with rock revetments in populated areas, to dissipate wave energy and prevent erosion
Nourish beaches Import or relocate sand from elsewhere in the islands or offshore to keep beaches at constant width despite erosion
Raise elevation of coastline
Build coastline upwards with material sourced from elsewhere on the islands (e.g. as in the Maldives)
DescriptionMeasure
Relocate existing infrastructure/housing in hazard zones
Move existing housing and commercial buildings in area of risk (below 4 m elevation) to higher elevation
Elevate all existing near-shore structures
Modify existing near-shore structures below 4 m elevation to be elevated on 2 m high stilts, as in parts of SE Asia
Elevate all new near-shore structures
Continue to build in hazard zone, but require that all new structures be elevated on 2 m stilts, as in parts of SE Asia
Potential coastal flooding infrastructure or asset based countermeasures
Inland flooding has been a sustained problem for the past 4 years
SOURCE: Dartmouth Flooding Observatory, Agency for Disaster Management, Environment Agency
69
23
12
0
5
10
15
20
25
20081200720062005
Number of inland flooding events
13
11
17
02468
1012141618
Height distribution of inland flooding(m)
>1.51-1.50.5-10-0.5
3
6
4
14
0
2
4
6
8
10
12
14
3-71 2-3
Duration of inland flooding events(days)
>7
011
13
0
2
4
6
8
10
12
14
Average area of inland flooding events(ha)
>200150-200
100-150
50-100
1 Data until Oct 2008
• 3 days of flooding• 1 meter deep• City houses flooded• 4 deaths
Balikpapan, Sept 07
Samarinda, April 2009• 11 days of flooding• 1+ meter deep• City, airport closed• 20,000 displaced
• 22 days of flooding• 1.5 meters deep• 35,000 sq km flooded• 60,000 displaced
Kutai Kertanegara and Kutai Barat, May 2007
Exhibit 71
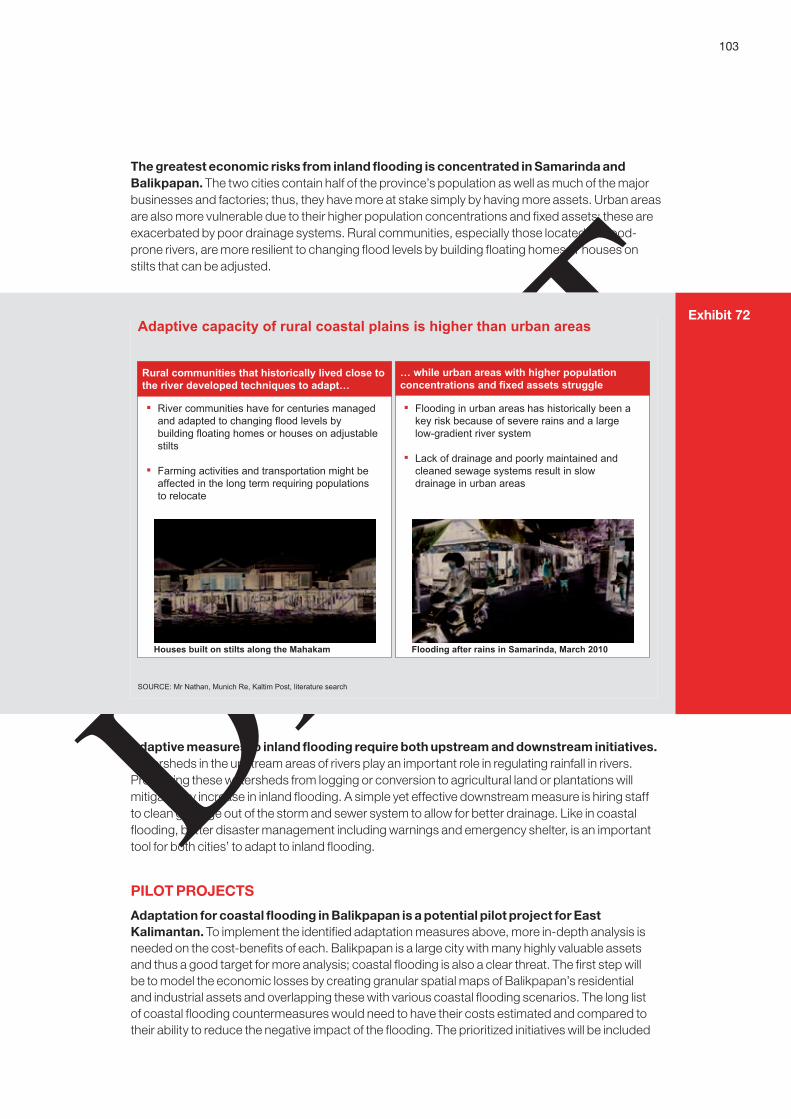
103
DRAFT
The greatest economic risks from inland flooding is concentrated in Samarinda and Balikpapan. The two cities contain half of the province’s population as well as much of the major businesses and factories; thus, they have more at stake simply by having more assets. Urban areas are also more vulnerable due to their higher population concentrations and fixed assets; these are exacerbated by poor drainage systems. Rural communities, especially those located on flood-prone rivers, are more resilient to changing flood levels by building floating homes or houses on stilts that can be adjusted.
Adaptive measures to inland flooding require both upstream and downstream initiatives. Watersheds in the upstream areas of rivers play an important role in regulating rainfall in rivers. Preserving these watersheds from logging or conversion to agricultural land or plantations will mitigate any increase in inland flooding. A simple yet effective downstream measure is hiring staff to clean garbage out of the storm and sewer system to allow for better drainage. Like in coastal flooding, better disaster management including warnings and emergency shelter, is an important tool for both cities’ to adapt to inland flooding.
PILOT PROJECTS
Adaptation for coastal flooding in Balikpapan is a potential pilot project for East Kalimantan. To implement the identified adaptation measures above, more in-depth analysis is needed on the cost-benefits of each. Balikpapan is a large city with many highly valuable assets and thus a good target for more analysis; coastal flooding is also a clear threat. The first step will be to model the economic losses by creating granular spatial maps of Balikpapan’s residential and industrial assets and overlapping these with various coastal flooding scenarios. The long list of coastal flooding countermeasures would need to have their costs estimated and compared to their ability to reduce the negative impact of the flooding. The prioritized initiatives will be included
Exhibit 72Adaptive capacity of rural coastal plains is higher than urban areas
SOURCE: Mr Nathan, Munich Re, Kaltim Post, literature search
Rural communities that historically lived close to the river developed techniques to adapt…
… while urban areas with higher population concentrations and fixed assets struggle
! River communities have for centuries managed and adapted to changing flood levels by building floating homes or houses on adjustable stilts
! Farming activities and transportation might be affected in the long term requiring populations to relocate
Houses built on stilts along the Mahakam
! Flooding in urban areas has historically been a key risk because of severe rains and a large low-gradient river system
! Lack of drainage and poorly maintained and cleaned sewage systems result in slow drainage in urban areas
Flooding after rains in Samarinda, March 2010
104
DRAFT
in development plans. In addition, there is potential to partner with insurance companies to help conduct these analyses as well as provide financial risk-sharing mechanisms.
6. Implementation and enablersAchieving successful environmentally sustainable economic growth will require new kinds of behavior and capabilities within government and the broader society of East Kalimantan. From an institutional standpoint, some of the challenges are organizational, as supporting environmentally sustainable growth requires coordination across the various government departments that will be critical to its success (e.g., planning (Bappeda), forestry, environment, agriculture, tourism, education, public works). Another challenge will be to build the capabilities within government to carry out this ambitious and urgent program, and to manage the stresses it creates. As with governments in other developing regions, the provincial administration of East Kalimantan is doubly challenged by critical priorities and constrained resources..
Strong leadership will be required to overcome the organizational challenge, build capabilities and change mindsets towards development across the province. While individual institutional enablers are explored in each sector strategy, five cross-cutting enablers have been identified:
Governance and climate change institutions
Spatial planning and policy
Monitoring, reporting, and verification (MRV) and carbon accounting
Community engagement
Financing
GOVERNANCE AND CLIMATE CHANGE INSTITUTIONS
Governance over natural resources is one of the greatest challenges facing any government. Resource governance can rarely be improved in isolation, but must be part of a larger program of governance reform, such as Indonesia has been implementing over the past decade. Beginning with the Regional Autonomy Law of 1999, decentralization has brought substantial changes. Efforts to improve law enforcement and combat corruption, generally and within natural resource sectors, have yielded important results, and perhaps most importantly, a sense of momentum and optimism.
But governance of natural resources in Indonesia is still complex, and often contested. While much authority over the areas outside the forest estate (Kawasan Hutan) has been given to local district governments, roles have been undermined by conflicting regulations from central government ministries and frequently-altered procedures. The provincial government certainly recognizes that much progress is needed to better incorporate stakeholder input, particularly from communities. Capacity to collect such feedback is limited, and mindset changes and institutional improvements may be needed to insure that such feedback is effectively incorporated in planning and decision making processes at all levels. Roles of companies and their relationships with rural communities remain unclear. Large areas of the forest estate lack a strong government presence, and are very hard to police and monitor.
East Kalimantan’s governance of climate change has developed organically as the threat has become clearer and more prominent. This is quite a common pattern, as any governments respond to new challenges by first empowering existing institutions to take on larger tasks before establishing new institutions. As the threat from climate change has grown in priority, East Kalimantan has established a number of institutions to provide capacity for specific threats. East Kalimantan has likewise created several new institutions to coordinate its response to climate
105
DRAFT
change issues. In December 2009 after participating in COP 15,24 the Governor of East Kalimantan created the Kaltim Green taskforce. Then in May 2010 he issued a decree establishing a new Kaltim REDD taskforce to coordinate REDD and peatland rehabilitation efforts in the province. These institutions provide an excellent basis to coordinate the broader environmentally sustainable growth activities in the province. Both institutions report directly to the Governor and have a mandate to coordinate efforts at the provincial and district levels.
Again, it is a relatively common pattern for a number of groups to be established to look after various aspects of an urgent and highly complex cross-cutting issue. Many existing institutions have overlapping responsibilities, and no one single agency has a complete overview. At a certain point, it may become necessary to establish an umbrella organization that both can have oversight and steers the activities of different taskforces. Many governments facing the urgent and complex challenges have resorted to a coordination structure that focuses on ensuring delivery of critical priorities across a complex policy landscape.
There is one strong example in the Indonesian experience. In Aceh, following the devastating tsunami in late 2004, the Indonesian Government established the Agency for the Rehabilitation and Reconstruction of Aceh and Nias (BRR) to coordinate and oversee the multi-year reconstruction process. As with moving to an sustainable economic development, recovery and reconstruction in Aceh required a new order of community outreach, a high order of coordination across many levels of government, responsible disbursement of external funding, and mobilization of technical and financial resources from across (and outside) the country. Box 9 discusses five lessons from BRR.
A review of the BRR and other domestic and international delivery units reveals some lessons that East Kalimantan will keep in view while developing its own institutional mechanisms for ensuring the successful implementation of a environmentally sustainable growth strategy (Box 9).
The two case studies of ongoing projects in East Kalimantan that follow illustrate some of the organizational innovations useful for the new Climate Change Agency. The Berau Forest Carbon Program is a comprehensively designed potential REDD demonstration program at the district level and thus has lessons for how to organize a province-wide program. The Heart of Borneo is a cross-district (as well as cross-national) program that is focusing on conservation and sustainable development and has lessons on how to work across levels of government.
24 UNFCCC Conference of Parties in Copenhagen, December 2009
International and Domestic Lessons on Organizing a Delivery Unit for Complex and Urgent Development Challenges
Delivery unit must have a direct relationship with and a clear mandate from the highest levels 1. of government (e.g., Aceh’s BRR, Morocco Economic Development Board, Guyana Presidential Delivery Unit)
Delivery unit needs to include representatives from different levels of government and non-2. governmental organizations (e.g., Brazil’s Amazon Fund, Indonesia’s Waclimad)
Relationships and decision-making rights must be clearly defined between the new delivery unit, 3. existing ministries, and other stakeholders (e.g., Bahrain’s Economic Development Board)
Employee compensation and value proposition must be competitive with the commercial sector 4. to attract top talent (e.g., Aceh’s BRR, Guyana Presidential Delivery Unit)
Delivery unit works best if it can develop rigorous performance management around a few 5. priority outcomes (e.g., Bahrain Economic Development Board)
Box 9

106
DRAFT
Governance Case Study 1: Berau Forest Carbon Program
The BFCP will be managed under the authority of a multi-stakeholder supervisory council supported by a secretariat. A joint working group of sectoral agencies, other stakeholders, and technical experts will support program design and implementation.
Select examples of the purpose and roles of the various groups depicted in the BFCP Structure Diagram (EXHIBIT 74 ) are as follows:
Supervisory Council (SC) is the principal governance body that holds ultimate authority and responsibility for technical and financial direction of BFCP on behalf of the Government of Indonesia. The Council is composed of senior officials appointed by the Berau District Head, the East Kalimantan Governor, the Ministry of Forestry, and other national government agencies, TNC, and members representing communities and other stakeholder groups. Its key responsibilities are: strategic direction of the BFCP, financial management, recruiting, carbon trading, stakeholder relations, support alignment of government resources, and sustainability of the BFCP.
BFCP Trust Fund is to receive funds from donors and potentially from carbon offsetters and distribute them to program implementers and beneficiaries. Public and private funders would contribute funds to the BFCP Trust Fund according to an agreed schedule and will receive annual progress and financial reports as well as periodic updates. Donors will be requested to provide funds with the least restriction possible to enable flexible implementation of BFCP programs..
Communities will have representatives sit on the Community Advisory Board to give input to the SC in managing the BFCP on cross-cutting issues related to community involvement in low-carbon development and more broadly on governance. Community leaders will be involved with Joint Working Group meetings and processes. The BFCP will directly engage target communities
Exhibit 73 Proposed organizational structure for provincial climate change agency
Steering committee! Chaired by Governor! Heads of Districts! DNPI! Representatives from key provincial
government ministries (e.g. Bappeda, Environment, Forestry)
! Selected representatives from private sector, NGOs and local communities
Ad-Hoc Advisory Council
Finance collection and distribution
! Attract international financing for REDD deals
! Develop financial collection and distribution vehicles
Monitoring and evaluation
! Establish a province-level emissions baseline and proxies for impact
! Develop consistent MRV methodology
Policy and planning
! Optimize land allocation and spatial planning
! Resolve land tenure disputes
! Develop enforcement mechanisms
Community engagement
! Develop engagement processes with local communities
! Develop behavioral change programmes
Infrastructure
! Develop infrastructure for abatement and to support alternative livelihoods (e.g. fire brigades, education)
Working Groups
Growth promotion
! Develop strategies to support growth and attract investment for identified growth priorities
Head
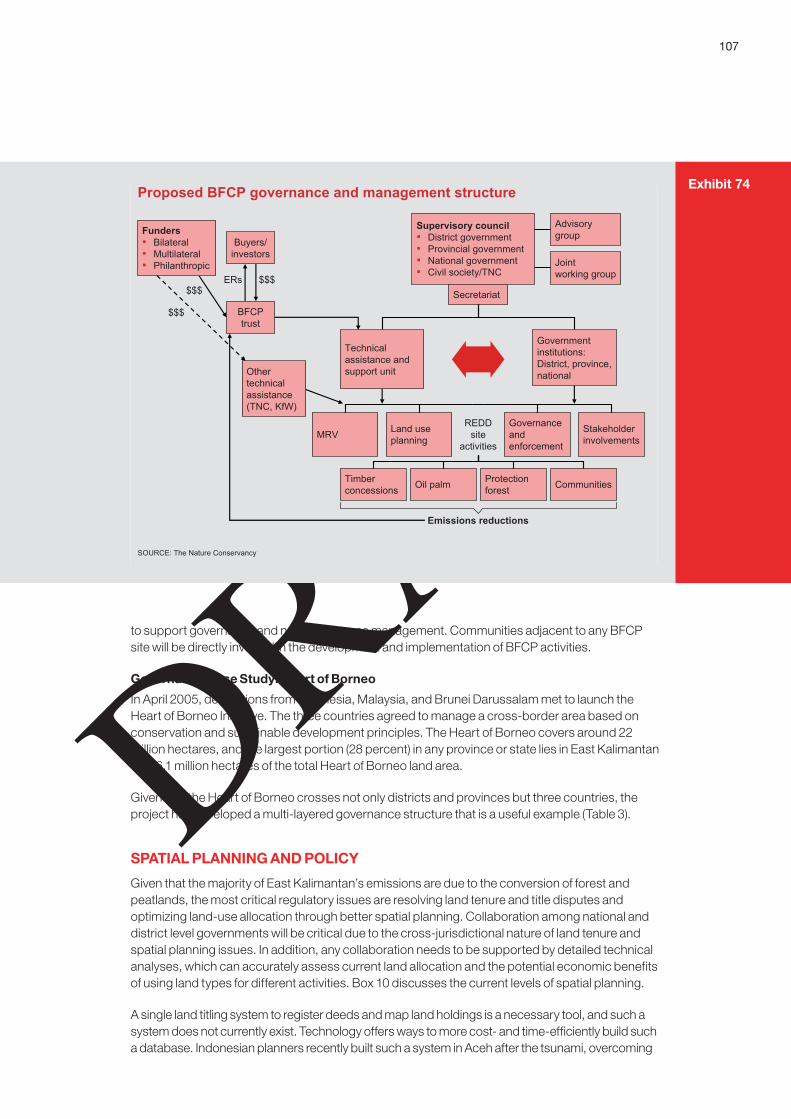
107
DRAFT
to support governance and natural resource management. Communities adjacent to any BFCP site will be directly involved in the development and implementation of BFCP activities.
Governance Case Study: Heart of Borneo
In April 2005, delegations from Indonesia, Malaysia, and Brunei Darussalam met to launch the Heart of Borneo Initiative. The three countries agreed to manage a cross-border area based on conservation and sustainable development principles. The Heart of Borneo covers around 22 million hectares, and the largest portion (28 percent) in any province or state lies in East Kalimantan with 6.1 million hectares of the total Heart of Borneo land area.
Given that the Heart of Borneo crosses not only districts and provinces but three countries, the project has developed a multi-layered governance structure that is a useful example (Table 3).
SPATIAL PLANNING AND POLICY
Given that the majority of East Kalimantan’s emissions are due to the conversion of forest and peatlands, the most critical regulatory issues are resolving land tenure and title disputes and optimizing land-use allocation through better spatial planning. Collaboration among national and district level governments will be critical due to the cross-jurisdictional nature of land tenure and spatial planning issues. In addition, any collaboration needs to be supported by detailed technical analyses, which can accurately assess current land allocation and the potential economic benefits of using land types for different activities. Box 10 discusses the current levels of spatial planning.
A single land titling system to register deeds and map land holdings is a necessary tool, and such a system does not currently exist. Technology offers ways to more cost- and time-efficiently build such a database. Indonesian planners recently built such a system in Aceh after the tsunami, overcoming
Exhibit 74Proposed BFCP governance and management structure
Advisory group
Jointworking group
Supervisory council! District government! Provincial government! National government! Civil society/TNC
Secretariat
Technical assistance and support unit
Government institutions:District, province, national
MRV Land use planning
REDD site
activities
Governance and enforcement
Stakeholderinvolvements
Oil palm Protection forest
Timber concessions Communities
Emissions reductions
BFCPtrust
Buyers/investors
Funders! Bilateral! Multilateral! Philanthropic
Other technical assistance (TNC, KfW)
ERs $$$
$$$
$$$
SOURCE: The Nature Conservancy
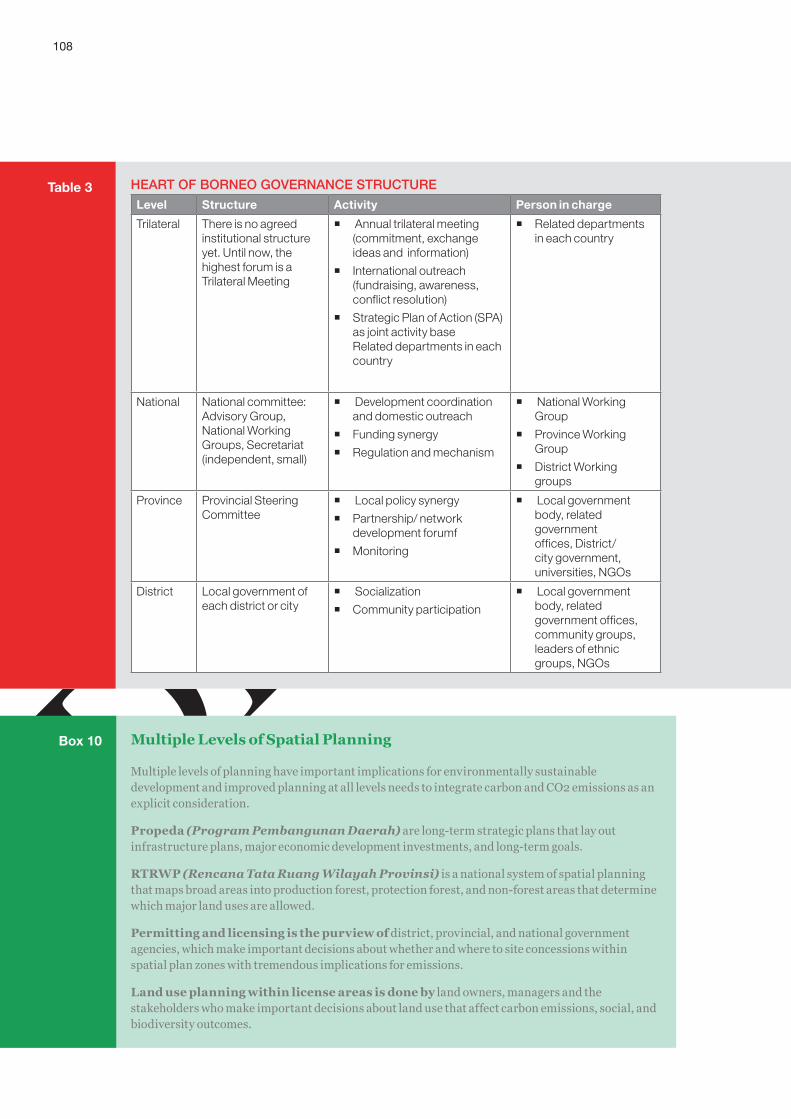
108
DRAFT
HEART OF BORNEO GOVERNANCE STRUCTURELevel Structure Activity Person in charge
Trilateral There is no agreed institutional structure yet. Until now, the highest forum is a Trilateral Meeting
Annual trilateral meeting (commitment, exchange ideas and information)International outreach (fundraising, awareness, conflict resolution)Strategic Plan of Action (SPA) as joint activity base Related departments in each country
Related departments in each country
National National committee: Advisory Group, National Working Groups, Secretariat (independent, small)
Development coordination and domestic outreachFunding synergy Regulation and mechanism
National Working GroupProvince Working GroupDistrict Working groups
Province Provincial Steering Committee
Local policy synergy Partnership/ network development forumfMonitoring
Local government body, related government offices, District/city government, universities, NGOs
District Local government of each district or city
Socialization Community participation
Local government body, related government offices, community groups, leaders of ethnic groups, NGOs
Table 3
Multiple Levels of Spatial Planning
Multiple levels of planning have important implications for environmentally sustainable development and improved planning at all levels needs to integrate carbon and CO2 emissions as an explicit consideration.
Propeda (Program Pembangunan Daerah) are long-term strategic plans that lay out infrastructure plans, major economic development investments, and long-term goals.
RTRWP (Rencana Tata Ruang Wilayah Provinsi) is a national system of spatial planning that maps broad areas into production forest, protection forest, and non-forest areas that determine which major land uses are allowed.
Permitting and licensing is the purview of district, provincial, and national government agencies, which make important decisions about whether and where to site concessions within spatial plan zones with tremendous implications for emissions.
Land use planning within license areas is done by land owners, managers and the stakeholders who make important decisions about land use that affect carbon emissions, social, and biodiversity outcomes.
Box 10

109
DRAFT
the lack of a strong system, the particular challenges of how long-term armed conflict had shaped claims about customary rights, and the loss of physical records due to the disaster. This exercise shows that land titling and spatial planning mix complex, historical, social, economic, and political issues, and that close community support is essential for these initiatives. The backbone of such a system is a community engagement approach that undertakes community-based land mapping and land adjudication, builds institutional capacity at the local level, ensures the process is done in a fair and transparent manner, and clearly communicates the benefits to the local people.
Environmental Impact Assessments (AMDAL) are very important tools for managing spatial planning and the process of licensing and permitting. But the role of assessments also needs to be strengthened, so that they provide a rigorous consideration of environmental concerns before licenses are issued. Assessments should be broadened to include a specific focus on carbon emissions and peatlands.
Box 11 discusses Indonesia’s Spatial Data Infrastructure and Box 12 introduces the concept of High Conservation-Value Forest.
MRV AND CARBON ACCOUNTING
National MRV standards and systems are likely to be a key components of a global deal on REDD and REDD+. East Kalimantan will need a technical support unit is needed to develop a basic MRV system for the province, and ensure that it is consistent with eventual national efforts. The MRV system will need to establish the province’s baseline and create basic proxies for lowered carbon emissions (such as reduced deforestation), used to assess reduction efforts and to monitor impact. The need for such a system has already been established in the Norway-Indonesian Partnership, which is intended to make payments for verified emissions, in its later stages. Brazil’s Amazon Fund, for example, already raises money on the basis of avoided deforestation achieved
Indonesia’s Spatial Data Infrastructure (SDI)
Good planning is impossible without high-quality data, broad sharing of data, and transparency. Indonesia is making an effort to address these challenges through the development of a Spatial Data Infrastructure (SDI). The Ministry of Forestry is leading on the data management for the Forest Estate through development of the Forest Resource Information System. There are currently several pilots of the SDI, but all are located in Java. Berau Government, TNC, and partners have been exploring the potential for an SDI pilot as part of BFCP.
High Conservation-Value Forest
The concept of High Conservation Value Forest (HCVF) emerged as part of the Forest Stewardship Council (FSC) standard for forest management to guide the identification of areas with exceptionally important social, cultural, or environmental value and to implement a system of management and monitoring to guarantee that this value would be maintained or enhanced.
Today, HCV is used for spatial planning in Indonesia at the national or provincial level, for guiding plantation development to minimize negative ecological and social effects from natural forest conversion. During the IUP or Izin Lokasi process, HCV areas are identified by developers in their submissions. and developers are required to set aside and protect HCV land as part of their permits. The Roundtable on Sustainable Palm Oil looks at compliance with HCV plans in assessing plantations for sustainability certification. Banks consider plantations’ records here as part of due diligence to assess loan requests.
Box 12
Box 11
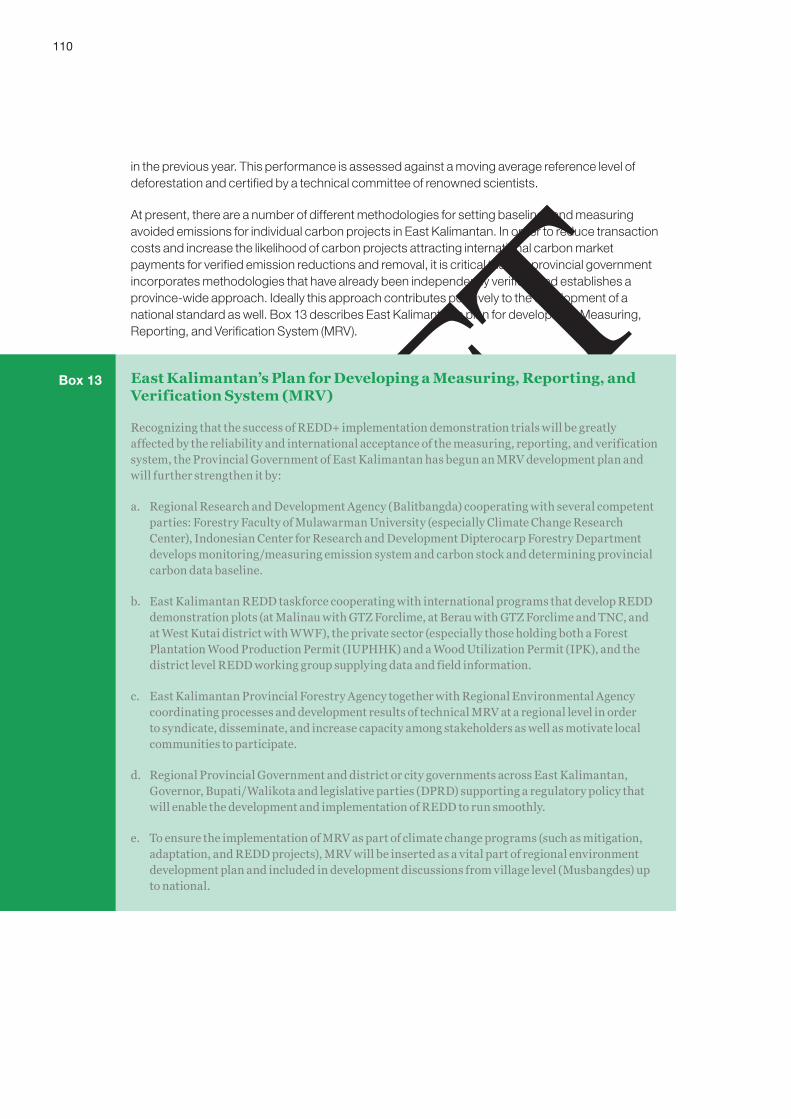
110
DRAFT
in the previous year. This performance is assessed against a moving average reference level of deforestation and certified by a technical committee of renowned scientists.
At present, there are a number of different methodologies for setting baselines and measuring avoided emissions for individual carbon projects in East Kalimantan. In order to reduce transaction costs and increase the likelihood of carbon projects attracting international carbon market payments for verified emission reductions and removal, it is critical that the provincial government incorporates methodologies that have already been independently verified, and establishes a province-wide approach. Ideally this approach contributes positively to the development of a national standard as well. Box 13 describes East Kalimantan’s plan for developing a Measuring, Reporting, and Verification System (MRV).
East Kalimantan’s Plan for Developing a Measuring, Reporting, and Verification System (MRV)
Recognizing that the success of REDD+ implementation demonstration trials will be greatly affected by the reliability and international acceptance of the measuring, reporting, and verification system, the Provincial Government of East Kalimantan has begun an MRV development plan and will further strengthen it by:
Regional Research and Development Agency (Balitbangda) cooperating with several competent a. parties: Forestry Faculty of Mulawarman University (especially Climate Change Research Center), Indonesian Center for Research and Development Dipterocarp Forestry Department develops monitoring/measuring emission system and carbon stock and determining provincial carbon data baseline.
East Kalimantan REDD taskforce cooperating with international programs that develop REDD b. demonstration plots (at Malinau with GTZ Forclime, at Berau with GTZ Forclime and TNC, and at West Kutai district with WWF), the private sector (especially those holding both a Forest Plantation Wood Production Permit (IUPHHK) and a Wood Utilization Permit (IPK), and the district level REDD working group supplying data and field information.
East Kalimantan Provincial Forestry Agency together with Regional Environmental Agency c. coordinating processes and development results of technical MRV at a regional level in order to syndicate, disseminate, and increase capacity among stakeholders as well as motivate local communities to participate.
Regional Provincial Government and district or city governments across East Kalimantan, d. Governor, Bupati/Walikota and legislative parties (DPRD) supporting a regulatory policy that will enable the development and implementation of REDD to run smoothly.
To ensure the implementation of MRV as part of climate change programs (such as mitigation, e. adaptation, and REDD projects), MRV will be inserted as a vital part of regional environment development plan and included in development discussions from village level (Musbangdes) up to national.
Box 13
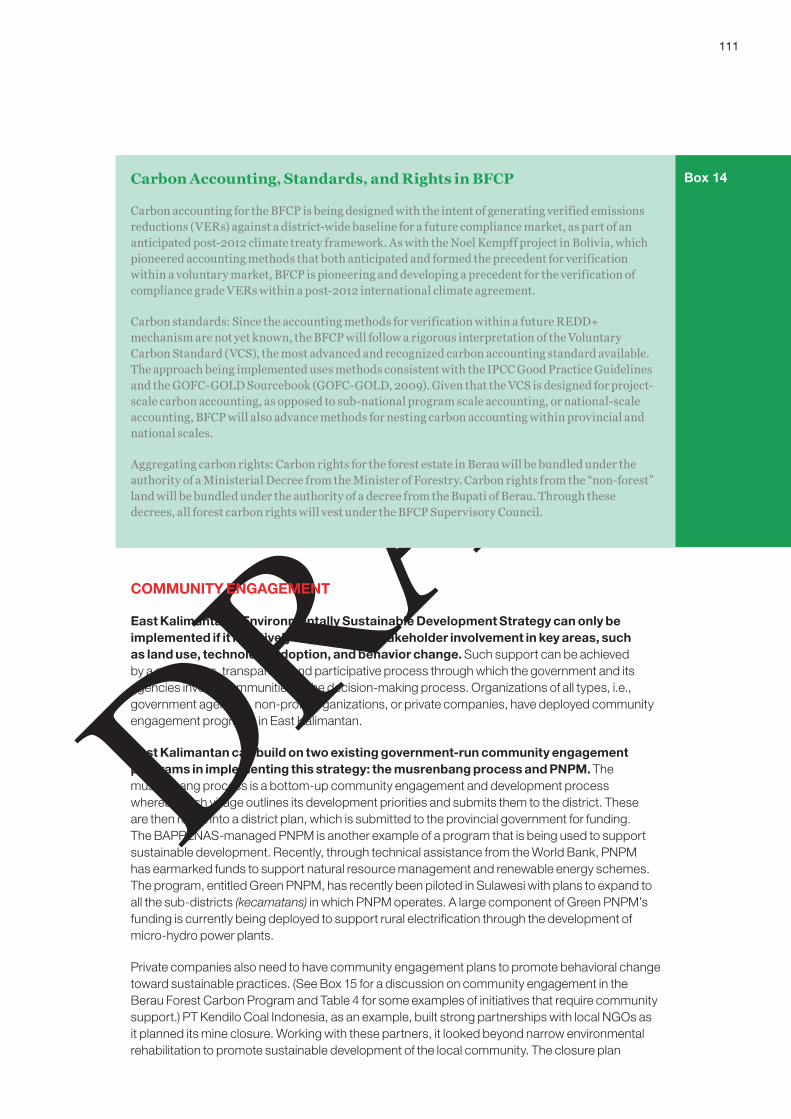
111
DRAFT
COMMUNITY ENGAGEMENT
East Kalimantan’s Environmentally Sustainable Development Strategy can only be implemented if it is actively supported by stakeholder involvement in key areas, such as land use, technology adoption, and behavior change. Such support can be achieved by a continuous, transparent, and participative process through which the government and its agencies involve communities in the decision-making process. Organizations of all types, i.e., government agencies, non-profit organizations, or private companies, have deployed community engagement programs in East Kalimantan.
East Kalimantan can build on two existing government-run community engagement programs in implementing this strategy: the musrenbang process and PNPM. The musrenbang process is a bottom-up community engagement and development process whereby each village outlines its development priorities and submits them to the district. These are then rolled into a district plan, which is submitted to the provincial government for funding. The BAPPENAS-managed PNPM is another example of a program that is being used to support sustainable development. Recently, through technical assistance from the World Bank, PNPM has earmarked funds to support natural resource management and renewable energy schemes. The program, entitled Green PNPM, has recently been piloted in Sulawesi with plans to expand to all the sub-districts (kecamatans) in which PNPM operates. A large component of Green PNPM’s funding is currently being deployed to support rural electrification through the development of micro-hydro power plants.
Private companies also need to have community engagement plans to promote behavioral change toward sustainable practices. (See Box 15 for a discussion on community engagement in the Berau Forest Carbon Program and Table 4 for some examples of initiatives that require community support.) PT Kendilo Coal Indonesia, as an example, built strong partnerships with local NGOs as it planned its mine closure. Working with these partners, it looked beyond narrow environmental rehabilitation to promote sustainable development of the local community. The closure plan
Carbon Accounting, Standards, and Rights in BFCP
Carbon accounting for the BFCP is being designed with the intent of generating verified emissions reductions (VERs) against a district-wide baseline for a future compliance market, as part of an anticipated post-2012 climate treaty framework. As with the Noel Kempff project in Bolivia, which pioneered accounting methods that both anticipated and formed the precedent for verification within a voluntary market, BFCP is pioneering and developing a precedent for the verification of compliance grade VERs within a post-2012 international climate agreement.
Carbon standards: Since the accounting methods for verification within a future REDD+ mechanism are not yet known, the BFCP will follow a rigorous interpretation of the Voluntary Carbon Standard (VCS), the most advanced and recognized carbon accounting standard available. The approach being implemented uses methods consistent with the IPCC Good Practice Guidelines and the GOFC-GOLD Sourcebook (GOFC-GOLD, 2009). Given that the VCS is designed for project-scale carbon accounting, as opposed to sub-national program scale accounting, or national-scale accounting, BFCP will also advance methods for nesting carbon accounting within provincial and national scales.
Aggregating carbon rights: Carbon rights for the forest estate in Berau will be bundled under the authority of a Ministerial Decree from the Minister of Forestry. Carbon rights from the “non-forest” land will be bundled under the authority of a decree from the Bupati of Berau. Through these decrees, all forest carbon rights will vest under the BFCP Supervisory Council.
Box 14
112
DRAFT
included programs to provide employees and local people with new skills, in anticipation of the time when the company would no longer be the economic engine of the community. These included training focused on the set up of mechanical workshops for cars and motorcycles, sewing services, small trading shops, and various farming endeavors, improved agricultural practices (beyond slash and burn), and new cash crops for trading.
Public awareness on climate change is also required in addition to community engagement programs focused on achieving projects. In 2001, East Kalimantan took part in the survey Knowledge, Attitudes, and Practices: Natural Resources Management, which was a comprehensive survey of awareness and attitudes toward environmental issues. Although quite some time has passed since the survey, its findings indicated that while environmental issues are relatively important to residents of East Kalimantan, there was a gap to people becoming actively involved in solutions. Public awareness and engagement can be even more important and challenging for climate change as its impact is not as clearly or immediately seen as that for poor environmental practices (such as water or air pollution). Kaltim Green and the Governor have been recently conducting a larger public awareness campaign on climate change, which has included
Community Engagement in the Berau Forest Carbon Program
TNC and its partners have been working with forest communities in Berau since 2002 and recently completed a study of 20 of the 107 villages in preparation for the BFCP. Villages in Berau vary widely in level of forest dependence, remoteness, level of cultural homogeneity, and experience with the market economy. Virtually all villages are in a process of transition in livelihood strategies and governance institutions, and in most cases village institutions are ineffective, particularly in the upland high forest areas. Land tenure is not formally recognized, and villages are not often not even included in district spatial and development plans. Many villages are located within timber and oil palm concession areas, and each has or will be affected by timber, oil palm, or mining concessions. Proximity and weakly-defined property rights often lead to latent or overt conflicts between communities and neighboring companies. Key issues in community-company relations include consent of communities for company operations, recognition of different types of community rights, legally required and voluntary fees and compensation to communities for use of the forest, and legally required investments by companies in community development.
The BFCP has identified six objectives for its community engagement plan:
Involvement in low-carbon development strategy: 1. Meaningfully involve communities in design and oversight of Berau’s low carbon development strategy. Forest communities are constructively engaged in BFCP governance and decision making at strategic and operational levels, as well as other important policy dialogs in Berau.
Free, prior, and informed consent: 2. Ensure informed consent for all agreements, to be implemented on a sustainable basis.
Strengthened village institutions: 3. Help villages develop better governance institutions, ones that will allow for effective community involvement in natural resource management and sustained implementation of BFCP.
Livelihoods: 4. Improve livelihoods, including alternative livelihoods that reduce pressure on the environment in the short, medium, and longer terms.
Benefit sharing: 5. Establish arrangements for fairly and sustainably apportioned streams of benefits for villages including women, (social services, community infrastructure, etc.)
Learning:6. Document and disseminate learning and scaling-up mechanisms from BFCP’s community involvement component.
Box 15

113
DRAFT
Green programs in various provincial ministries, conferences with business associations, public afforestation programs like “One man, five trees,” and public events such as city biking events to promote alternative transportation.
FINANCING
Three finance-related functions will be critical to the success of East Kalimantan’s environmentally sustainable development strategy. First, it is crucial to attract domestic and international financing to support East Kalimantan’s abatement initiatives. Second, revenue-sharing models will need to be established to allocate funds to various stakeholders (including national, provincial, and district level governments, as well as project developers, communities, and individuals). Third, finances must be managed and distributed among these parties in a fair and transparent manner. Good governance of this highly complex flow of funds is one of the greatest challenges for REDD and REDD+ systems, and East Kalimantan will benefit from an investment in developing the best possible system here.
East Kalimantan will require significant, near-term international support to succeed in its plans to create low-carbon prosperity (EXHIBIT 75). In 2012, for example, between USD 20 million and USD 30 million will be required to launch pilots and start abatement initiatives. These costs will ramp up as the environmentally sustainable development plan expands and more initiatives are launched and on a larger scale. By 2030, ongoing running costs to support implementation of carbon abatement and sustainable livelihood opportunities will reach between USD 370 million and USD 570 million. Although the overall required funding is substantial, the cost per tCO2e abated is relatively low; the full abatement cost per tCO2e abated (including implementation costs) ranges between USD 2.00 and 3.10.
East Kalimantan cannot wait for funds from international carbon markets to realize its ambitious emission reduction objectives through to 2030. In the short term, interim funding from sources such as the Forest Carbon Partnership Facility (FCPF), the UN-REDD program, and bilateral programs such as the Indonesia-Norway Climate Change partnership will be critical to supporting East Kalimantan’s efforts to establish its REDD readiness. The Informal Working Group on Interim
Table 4EXAMPLE INITIATIVES REQUIRING COMMUNITY ENGAGEMENT SUPPORTInitiative Community engagement required
Use of degraded land
Recognition of community rights and existing land tenure in degraded land area; agreement on compensation paid to communities in area
Zero burning policy Education of impact of use of fires; training and technology on alternative land clearing methods; support for community based fire brigades
Improved smallholder productivity
Provision of seedlings, training on the application of fertilizer, and techniques for planting, etc.
Mining reclamation and rehabilitation
Best practices related to efficient, safe, and more environmental friendly mining operations, and post-mining land use
REDD Training of forest management techniques with a focus on education principles and tools for baselining and monitoring, reporting, and verification
Water management Education on impact of use of drainage for peatland decomposition; training and provision of technology for water management

114
DRAFT
Financing for REDD+ (IWG-IFR) envisages a phased transition of funding, with REDD programs initially relying on grants to build institutional readiness, followed by payments for reduced emissions based on simple proxies (e.g., deforestation rates), and finally transitioning to an advanced monitoring system that would allow a well-governed international carbon market to fund verified emissions reductions.
The Ministry of Finance and the Ministry of Forestry, have already outlined some initial guidelines for REDD projects.25 In further developing the revenue-sharing model, some key design principles should be considered:
Ensure local individuals and communities are incentivized: In order to support the behavioral change required for environmentally sustainable growth, communities concerned must see clear benefits. In the Juma Sustainable Reserve in Brazil, for example, individuals receive direct payments based on regular inspections of local forests (Box 16).26 The payments should include incentives linked to input-based metrics (e.g., for building dams, planting trees), performance-based metrics (e.g., reducing fire outbreaks), and eventually outcome-based metrics (linked directly to GHG emissions or proxies for emissions). As so much of the decision-making power for land allocation currently resides at the district level and within local communities, these groups must directly benefit from these payments. Local communities, villages, and districts will need to be appropriately compensated to be willing to make the changes needed for a more programmatic approach to low-carbon growth. The Amazon Fund,
25 In July 2009, the Indonesian Ministry of Forestry suggested a revenue-sharing model with allocations depending on the type of forest ownership or permit, ranging from 10–50 percent for the government, 20–70 percent for local communities, and 20–60 percent for developers.
26 “The costs of REDD: lessons from Amazonas”, iIIED brie!ng paper, November 2009.
Exhibit 75 Required financial support increases over time
Total estimated annual costsUSD millions per year (2010-2030)
SOURCE: Team analysis
175
270
370
75
270
2025 2030
420
570
2012 2015 2020
2030
120
Aggressive estimate
Conservative estimate
Three types of costs are included:
• Technical costs which are the costs to install the appropriate low-emission technology for an initiative (e.g. fire brigades, relocation costs to degraded land)
• Implementation costs are the costs needed to support implementation of a specific initiative (e.g. mining monitoring unit to enforce reclamation, training on reduced impact logging techniques)
• General enablers include the costs that are not specific to any one initiative but required for overall readiness to implement the strategy (e.g. enhanced spatial planning, MRVbaseline)

115
DRAFT
for example, includes representatives from different levels of government in its decision-making process.
Lay the foundation for sustainable livelihoods: It is important that financing for emissions reductions does not become a form of welfare, but rather creates a foundation to support environmentally sustainable development. For example, the Juma Sustainable Reserve allocates a portion of funds to support income-generating activities based on sustainable land and resource use (Box 16, Box 17).
Create the right incentive structure and framework to engage the private sector: Private project developers will be critical to environmentally sustainable development, given their access to capital and the skills needed for detailed monitoring and project management. The World Bank convened a workshop in November 2008 where REDD project developers provided input on how to support REDD activities in Indonesia. Some of the recommendations included obtaining clarification from the national government on where authority lies for decisions on REDD implementation, helping to fast track the approval process for REDD projects, and providing clarity on whether avoided deforestation carbon credits (VERs) require national government approval before being sold.27 At present, land usage decisions are split between the Ministry of Forestry, local governments, and community groups. The provincial government could help facilitate a more integrated process and ensure that the concerns of the private sector operators are addressed.
Once the revenue-sharing model is defined, there needs to be a method of allocating funds to the various recipients that complies with basic standards for efficiency, fiduciary oversight, and transparency. Recognizing the critical importance of maintaining the integrity in its operations, Aceh’s BRR used a combination of internal audits (carried out by BRR’s internal audit team as well as the Financial and Development Supervisory Agency), anti-corruption initiatives (carried out by BRR’s Anti-Corruption Unit), external audits (carried out by the Supreme Audit Agency), and public disclosure of financial flows (BRR regularly opened the agency’s balance sheet to the public, for example) as well as making all employees sign an “Integrity Pact”, which included forbidding employees from receiving any compensation beyond their agreed-upon market salary.28
For those funds earmarked for local communities and individuals, there are some existing successful financial distribution platforms, such as Indonesia’s Planning Department’s (Bappenas)
27 “Report on Implementation of a Learning Workshop: Developing a Market for REDD in Indonesia,” World Bank, January 2009.
28 “Finance – Seven Keys to Effective Aid Management”, BRR NAD-NIAS, April 2009.
Brazil’s Amazon Fund
The Amazon Fund, created in August 2008 by the Brazilian Government, mobilizes international funding to combat deforestation. The Amazon Fund operates on a donation basis, raising money on the basis of avoided deforestation achieved in the previous year. Performance is assessed against a moving average reference level of deforestation, adjusted every five years. A Technical Committee with six renowned scientists certifies the emission reductions claimed.
Managed by BNDES, Brazil’s Economic and Social National Development Bank, the fund grants funding to projects that contribute to the prevention of deforestation as well as to the conservation and sustainable use of the Amazon biome. A multi-stakeholder committee, organized in a three-chamber system with representatives of local government, national ministries, and civil society (including indigenous peoples, traditional communities, NGOs, industry, and scientists), determines funding allocations. Decisions are taken on the positive vote of all three chambers.
Box 16
116
DRAFT
PNPM program, which could be potentially augmented and refined to distribute these funds. Funds could initially be allocated at the community level, but potentially gradually evolve to be allocated to individuals, similar to Brazil’s Juma Sustainable Development Reserve.
IMPLEMENTATION
This analysis represents just the first step to achieving environmentally sustainable development. We see momentum developing through three phases.
Phase 1 - Define the Environmentally Sustainable Development Strategy: The first step is to develop an environmentally sustainable development strategy (as summarized in this report) that identifies the major opportunities for abatement and new sector growth, the critical actions required for success, and an estimate of the associated costs. This strategy then will be circulated to experts, community representatives, and other interested parties in all districts as part of an extensive process of integration, socialization and refinement to reconcile the priorities emerging from high-level analysis with the priorities that our communities feel on the ground.
Phase 2 - Develop basic readiness structures: The next phase requires the development of the basic architecture needed to attract international financing and support sustainable development. This includes finalizing the organizational design of the “green” delivery unit (including establishing reporting and decision-making processes), working with district pilots to prepare initiatives, and begin to build critical enablers such as enhanced spatial planning and MRV baselines.
Phase 3 - Pilot environmentally sustainable development initiatives: This phase will launch an initial pilot program to support an approach to sustainable growth that focuses on the prioritized opportunities for abatement and new growth sectors. Following the pilot and a review of the lessons learned, it is envisaged that there would be a progressive rollout to other districts, with the eventual transition to a province-wide approach.
Our analysis tells us that we can achieve growth and cut our carbon emissions. Our experience warns us that this is difficult, but also gives us faith that much can be achieved, as we look at our province’s record of development over the last decades.
East Kalimantan is a highly diverse society, as befits the richness and variety of our natural environment, from our forests and mountains to our seashores along the trading routes of Southeast Asia. To develop, we must unleash the drive and creativity of all members of our society. Environmentally sustainable development means that this creativity and drive will be built on a foundation of respect for our god-given natural heritage.

117
DRAFT

118
DRAFT

119
DRAFT
Sources2010, Kesiapan Kalimantan Timur Dalam Kerjasama Menghadapi Perubahan Iklim Melalui Pengurangan Emisi Dari Deforestasi Dan Degradasi (REDD).
A. Hooijer, Current and future CO2 emissions from drained peatlands in Southeast Asia, Biogeosciences Discussion (2009)
A. Hooijer et al, PEAT-CO2, Assessment of CO2 emissions from drained peatlands in SE Asia, Delft Hydraulics report (December 2006)
Abdullah Naim et al, JATAM, Mautnya Batubara Pengerukan Batubara & Generasi Suram Kalimantan (2010)
Agriculture Survey, Luas Lahan Menurut Penggunaannya Di Indonesia, Perpustakaan Badan Pusat Statistik (2007)
Alan Grainger, Difficulties in tracking the long-term global trend in tropical forest area, The National Academy of Sciences of the USA (January 2008)
Alison Hoare et al, Estimating the cost of building capacity in rainforest nations to allow them to participate in a global REDD mechanism, Office of Climate Change (August 2008)
Andreas Langner and Florian Siegert, Spatiotemporal fire occurrence in Borneo over a period of 10 years, Global Change Biology (2009)
Anne Casson, Oil Palm and REDD Opportunities in Berau, East Kalimantan, TNC, (July 2008)
Asosiasi Pengusaha Hutan Indonesia Komisaris Daerah Kalimantan Timur, Studi Rekalkulasi Sumberdaya Hutan dan Redesign Kelola Hutan Provinsi Kalimantan Timur (2008)
Badan Koordinasi Penanaman Modal, Peraturan Kepala Badan Koordinasi Penanaman Modal Nomor 13 Tahun 2009 Tentang Pedoman Dan Tata Cara Pengendalian Pelaksanaan Penanaman Modal (2010)
Badan Koordinasi Penanaman Modal, Peraturan Kepala Koordinasi Penanaman Modal Nomor 7 Tahun 2010 Tentang Perubahan Atas Peraturan Kepala Badan Koordinasi Penanaman Modal Nomor 13 Tahun 2009 Tentang Pedoman Dan Tata Cara Pengendalian Pelaksanaan Penanaman Modal (2010)
Badan Perencanaan Pembangunan Daerah Kabupaten Berau, Berau Dalam Angka 2008, Badan Pusat Statistik Kabupaten Berau (2009)
Badan Perencanaan Pembangunan Daerah Kabupaten Bulungan, Badan Pusat Statistik Kabupaten Bulungan, Kabupaten Bulungan Dalam Angka 2009 (2009)
Badan Perencanaan Pembangunan Daerah Kabupaten Kutai Barat, Kutai Barat Dalam Angka 2008 (2008)
Badan Perencanaan Pembangunan Daerah Kabupaten Kutai Kartanegara, Kutai Kartanegara Dalam Angka 2009, Badan Pusat Statistik Kabupaten Kutai Katanegara (2009)
Badan Perencanaan Pembangunan Daerah Kabupaten Malinau, Kabupaten Malinau Dalam Angka 2009, Badan Pusat Statistik Kabupaten Malinau (2009)
Badan Perencanaan Pembangunan Daerah Kabupaten Nunukan, Nunukan Dalam Angka 2009 (2009)

120
DRAFT
Badan Perencanaan Pembangunan Daerah Kabupaten Paser, Kabupaten Penajam Paser Utara Dalam Angka 2007, Badan Pusat Statistik Kabupaten Paser (2007)
Badan Perencanaan Pembangunan Daerah Kabupaten Tana Tidung, Kabupaten Tana Tidung Dalam Angka 2009, Badan Pusat Statistik Kabupaten Bulungan (2009)
Badan Perencanaan Pembangunan Daerah Kalimantan Timur, Pembangunan Kalimantan Timur 2009 (2009)
Badan Perencanaan Pembangunan Daerah Kota Samarinda, Kota Samarinda Dalam Angka 2009, Badan Pusat Statistik Kota Samarinda (2009)
Badan Perencanaan Pembangunan Daerah Kota Tarakan, Kota Tarakan Dalam Angka 2009, Badan Pusat Statistik Kota Tarakan (2009)
Badan Perencanaan Pembangunan Daerah, Kalimantan Timur Dalam Angka 2009, Badan Pusat Statistik Provinsi Kalimantan Timur (2009)
Badan Perencanaan Pembangunan Daerah, Balikpapan Dalam Angka 2008, Badan Pusat Statistik Kota Balikpapan (2008)
Badan Perijinan dan Penanaman Modal Daerah Kalimantan Timur, Daya Tarik Investasi Kalimantan Timur.
Badan Perijinan dan Penanaman Modal Daerah Kalimantan Timur, Kajian Informasi Peluang Pasar Potensi Informasi Kaltim Serta Rencana Dan Sasaran Promosi Investasi Kaltim Dalam Dan Luar Negeri (2009)
Badan Perijinan dan Penanaman Modal Daerah Propinsi Kalimantan Timur, Kawasan Budidaya Pertanian Berbasis Padi (2009)
Badan Perijinan dan Penanaman Modal Daerah Provinsi Kalimantan Timur, Potensi dan Peluang Investasi Kalimantan Timur.
Badan Perijinan dan Penanaman Modal Daerah Provinsi Kalimantan Timur, Prasarana dan Sarana Fasilitas Infrastruktur Kalimantan Timur.
Badan Perijinan dan Penanaman Modal Daerah Provinsi Kalimantan Timur, Investasi Industri Minyak Goreng Kelapa Sawit (2009)
Badan Perijinan dan Penanaman Modal Daerah Provinsi Kalimantan Timur, Peta Prioritas Pengembangan Investasi Kalimantan Timur (2009)
Badan Perijinan Dan Penanaman Modal Propinsi Kalimantan Timur, Budidaya Tanaman Jagung Terintegrasi Dengan Industri Pakan Ternak (2009)
Badan Perijinan Dan Penanaman Modal Propinsi Kalimantan Timur, Budidaya Rumput Laut Di Kalimantan Timur (2009)
Badan Perijinan Dan Penanaman Modal Propinsi Kalimantan Timur, Investasi Ikan Kerapu Yang Menguntungkan (2009)
Badan Perijinan Dan Penanaman Modal Propinsi Kalimantan Timur, Investasi Budidaya Kakao (2009)
Badan Perijinan Dan Penanaman Modal Propinsi Kalimantan Timur, Investasi Industri Minyak Goreng Kelapa Sawit (2009)
Badan Perijinan Dan Penanaman Modal Propinsi Kalimantan Timur, Kawasan Budidaya Pertanian Berbasis Padi (2009)
Badan Perijinan Dan Penanaman Modal Propinsi Kalimantan Timur, Komoditi Ekspor Karet Alam Di Kalimantan Timur (2009)
Badan Perijinan Dan Penanaman Modal Propinsi Kalimantan Timur, Pengembangan Sapi Potong Di Kalimantan Timur (2009)

121
DRAFT
Badan Perijinan Dan Penanaman Modal Propinsi Kalimantan Timur, Prospek menguntungkan Investasi Budidaya Komoditi Kelapa (2009)
Badan Pusat Statistik Indonesia, Produk Domestik Regional Bruto Provinsi-Provinsi di Indonesia Menurut Lapangan Usaha 2004-2008.
Badan Pusat Statistik Jakarta Indonesia, Produk Domestik Regional Bruto Propinsi-Propinsi di Indonesia Menurut Lapangan Usaha (Gross Regional Domestic Product of Provinces in Indonesia By Industrial Origin) 1994-1997.
Badan Pusat Statistik Jakarta Indonesia, Tabel Input Output Indonesia (Indonesian Input-Output Table) 2005 (2007)
Badan Pusat Statistik Jakarta, Produk Domestik Regional Bruto Propinsi-Propinsi Di Indonesia Menurut Lapangan Usaha 2001 – 2005.
Badan Pusat Statistik Jakarta, Produk Domestik Regional Bruto Propinsi-Propinsi Di Indonesia Menurut Lapangan Usaha 1988 – 1993.
Badan Pusat Statistik Jakarta, Produk Domestik Regional Bruto Propinsi-Propinsi Di Indonesia Menurut Lapangan Usaha 1998 – 2001.
Badan Pusat Statistik Jakarta, Produk Domestik Regional Bruto Propinsi-Propinsi Di Indonesia Menurut Lapangan Usaha 1999 – 2002.
Badan Pusat Statistik Jakarta, Produk Domestik Regional Bruto Propinsi-Propinsi Di Indonesia Menurut Lapangan Usaha 1995 – 1998.
Badan Pusat Statistik Kabupaten Kutai Timur, Kutai Timur Dalam Angka (2009)
Badan Pusat Statistik Kalimantan Timur, Analisis SE06 Mengenai Ketenagakerjaan Kalimantan Timur (2008)
Badan Pusat Statistik Kalimantan Timur, Keadaaan Angkatan Kerja Kalimantan Timur 2008 (2009)
Badan Pusat Statistik Kalimantan Timur, Keadaan Sosial PEnduduk Kalimantan Timur 2008 (2009)
Badan Pusat Statistik Kota Bontang, Kota Bontang Dalam Angka 2008 (2008)
Badan Pusat Statistik Propinsi Kalimantan Timur, Statistik Ekspor Kalimantan Timur (Export Statistics of Kalimantan Timur) 2008 (2009)
Badan Pusat Statistik Provinsi Kalimantan Timur, Indikator Industri Besar dan Sedang Kalimantan Timur 2002 – 2006 (2009)
Badan Pusat Statistik Provinsi Kalimantan Timur, Kalimantan Timur Dalam Angka 2008 (2008)
Badan Pusat Statistik Provinsi Kalimantan Timur, Kondisi Sosial Ekonomi dan Indikator Penting Kalimantan Timur 2008 (2009)
Badan Pusat Statistik Provinsi Kalimantan Timur, Produk Domestik Regional Bruto Kalimantan Timur Menurut Lapangan Usaha (Gross Regional Domestic Product of Kalimantan Timur by Industrial Origin) 2000-2007.
Badan Pusat Statistik Provinsi Kalimantan Timur; Analisis Tabel Input-Output Kalimantan Timur 2007, Badan Perencanaan Pembangunan Daerah Pemerintah Provinsi Kalimantan Timur (2008)
Badan Pusat Statistik Provinsi Kalimatan Timur, Statistik Industri Besar dan Sedang 2006 (2009)
Badan Pusat Statistik, K eadaan Pekerja Di Indonesia Februari 2008.
122
DRAFT
Badan Pusat Statistik, Pendapatan Regional Propinsi-Propinsi di Indonesia Menurut Lapangan Usaha 1983-1989.
Bappeda Propinsi Kalimantan Timur, Profil Daerah Kalimantan Timur 2009.
Bappeda Provinsi Kalimantan Timur, 8 (Delapan) Kelompok Data Sistem Informasi Profil Daerah Provinsi Kalimantan Timur Tahun 2007-2009 (2009)
BAPPENAS, Republic of Indonesia, Reducing carbon emissions from Indonesia’s peat lands, Interim Report of a Multi-Disciplinary Study (December 2009)
Biro Hukum, Peraturan Daerah Propinsi Daerah Tingkat I Kalimantan Timur (1993)
BPS Jakarta-Indonesia, Indonesian Palm Oil Statistic (2008)
Brad Sanders, Final Report and Recommendations for Master Plan to Deal with Land and Forest Fires for Muaro Jambi Regency on Fire Prevention and Suppression Capability, Capacity and Resources of Government Agencies, Plantation Companies and Select Villages in Muaro Jambi Regency, Singapore National Environment Agency, Jambi Province and Asia Pacific Resources International Ltd (August 2009)
Business Insight Malaya, Climate Change to Cost 6% of GDP Each Year : IMF (2010)
C. Barr and C. Cossalter, China’s development of a plantation-based wood pulp industry: government policies, financial incentives, and investment trends, International Forestry Review (2004)
Center for International Forestry Research REDD, forest governance and rural livelihoods, The emerging agenda.
Centre of Forest Inventory and Mapping Forest Planning Agency Ministry of Forestry Republic of Indonesia, Indonesia’s Forest Monitoring And Assessment System (FOMAS)
Charlie Parker et al, The Little REDD Book, Global Canopy Programme, Global Canopy.org (2009)
Charlotte Streck et al, Architecture for REDD+: Management and Flows of Funds, Climate Focus.
Charlotte Streck et al, The Challenge of Urgency, Incentivizing Private Sector Early Action in REDD+, Climate Focus.
Cheng Hai Teoh, Key Sustainability Issues in the Palm Oil Sector, The World Bank, IFC.
Christina Seeberg Elverfeldt, Carbon Finance Possibilities for Agriculture, Forestry and Other Land Use Projects in a Smallholder Context, Natural Resources Management and Environment Department Food and Agriculture Organization of the United Nations (FAO) (February 2010)
Christopher Barr et al, Financial governance and Indonesia’s Reforestation Fund during the Soeharto and post-Soeharto periods, 1989–2009, A political economic analysis of lessons for REDD+, Center for International Forestry Research.
Christopher Barr, Intensively Managed Forest Plantations in Indonesia, Overview of Recent Trends and Current Plans, Center for International Forestry Research (March 2007)
Colin Hunt, The costs of stopping deforestation in Indonesia, School of Economics, The University of Queensland
Daftar Nama IUPHHK pada Hutan Alam Di Wilayah Prov Kalimantan Timur Tahun 2010.
Daniel Murdiyarso and Louis Lebel, Southeast Asian forest and land Fires: how can vulnerable ecosystems and peoples adapt to changing climate and fire regimes?, iLEAPS Newsletter (2007)
123
DRAFT
Daniel Murdiyarso et al, Measuring and monitoring forest degradation for REDD, Implications of country circumstances, CIFOR (November 2008)
Desi Ariyadhi Suyamto and Meine van Noordwijk, Scenario Studies Of Land Use In Nunukan, East Kalimantan (Indonesia): Drivers, Local Livelihood Aand Globally Relevant Carbon Stocks.
Dinas Perkebunan, Rekapitulasi Data Kesesuaian Perizinan Perusahaan Perkebunan Dan Aktifitas Lapangan Posisi s/d Januari 2010 (2010)
Dinas Pertambangan dan Energi, Data Izin Usaha Pertambangan (IUP) Yang Diterbitkan Pemerintah Kabupaten Se Kalimantan Timur Tahun 2006 – 2009.
Direktori Pra Fs Komoditi Unggulan Kalimantan Timur.
Dr. Asril Darussamin (IPOC), Fitrian Ardiansyah and Suhandri (WWF-Indonesia), IPOC/WWF-Indonesia Impact Assessment on Oil Palm Development (October 2004)
Dwi Rahmad Muhtaman and Ferdinandus Agung Prasetyo, Forest Certification in Indonesia, Center for International Forestry Research (June 2004)
Eliasch Review, Climate Change:Financing Global Forests.
Elisabeth Rötheli, An analysis of the economic implications of developing oil palm plantations on deforested land in Indonesia, WWF (July 2008)
Erin Myers Madeira, REDD in Design: Assessment of Planned FirstGeneration Activities in Indonesia.
Fahmuddin Agus, Carbon Dioxide Emission In Land Use Transition To Plantation, Jurnal Litbal Petanian (2009)
Finn Danielsen et al, Biofuel Plantations on Forested Lands: Double Jeopardy for Biodiversity and Climate, Society For Conservation Biology (2008)
Food And Agriculture Organization Of The United Nations International Tropical Timber Organization, Best practices for improving law compliance in the forestry sector (2005)
Forest Watch Indonesia, The State of Forest Indonesia. World Resource Institute, Global Forest Watch.
Francis E. Putz and Pieter A. Zuidema, Conserving carbon in tropical forests: pitfalls and possibilities (January 2010)
Francis E. Putz and Robert Nasi, Carbon Benefits From Avoiding And Repairing Forest Degradation, International Society of Tropical Foresters (January 2010)
Francis E. Putz, Improved Tropical Forest Management for Carbon Retention.
Furniture Grade Acacia Timber From Plantations in Indonesia, IFC Program for Eastern Indonesia SME Assistance (PENSA)
G. R. van der Werf et al, Climate regulation of fire emissions and deforestation in equatorial Asia, PNAS (December 2008)
G. R. van der Werf et al, CO2 emissions from forest loss, Nature Geoscience (November 2009)
Gero Becker, Cable Systems for the Selective Logging of Tropical Natural Forests in Mountainous Areas – An Overview, Ministry of Forestry in Cooperation with Deutsche Gesselschaft furTechnische Zusammenarbeit (GTZ) (July 2001)
Haris Iskandar et al, A comparison of damage due to logging under different forms of resource access in East Kalimantan, Indonesia, Forest Ecology And Management (September 2006)
124
DRAFT
Harri Vasander and Jyrki Jauhianen, Uncertainties, Deficiencies and Unknown in Greenhouse, Gas Emission From Tropical Peatland, University of Helsinki, Department of Forest Ecology.
Howard J. Sargeant, Vegetation Fires In Sumatra Indonesia, Oil Palm Agriculture In The Wetlands Of Sumatra: Destruction or Development? Forest Fire Prevention And Control Project Dinas Kehutanan Propinsi Sumatera Selatan, European Union Ministry of Forestry (February 2001)
I Nyoman N. Suryadiputra and Prianto Wibowo, Study on PT ITCI’s Perian Swamp Forest In East Kalimantan, Indonesia, Wetlands International.
Ian E Hansen, The Carbon Cost of Palm Oil Production in Malaysia, The Planter, (2008)
IFCA, Reducing Emissions From Deforestation And Forest Degradation in Indonesia (2008)
International Timber Plantation Organization, Encouraging Industrial Forest Plantations In The Tropics, Report of a global study (August 2009)
International Timber Plantation OrganizationThe Pros And Cons Of Procurement, Developments and progress in timber-procurement policies as tools for promoting the sustainable management of tropical forests, (April 2010)
Irma Herdiyanti and Endah Sulistyawati, Carbon Stocks In Acacia mangium Willd. Stands of Different Ages, Institut Teknologi Bandung.
J. Jaenicke, Determination of the amount of carbon stored in Indonesian peatlands, Geoderma (2008)
Jane Dunlop, REDD, Tenure and Local Communities, A Study from Aceh, Indonesia, International Development Law Organization.
John Couwenberg et al, Greenhouse gas fluxes from tropical peatlands in Southeast Asia, Global Change Biography.
Jonah Busch et al, Comparing climate and cost impacts of reference levels for reducing emissions from deforestation, IOP Publishing Ltd (October 2009)
Joseph Fargione et al, Land Clearing and the Biofuel Carbon Debt, Science express, February 2008.
K.I. Paul et al, Change in soil carbon following afforestation, Forest Ecology And Management (2002)
Kawasan Hutan dan Perairan Prov. Kalimantan Timur Dirinci Menurut Fungsi dan Luas
Kirk Hamilton and Marianne Fay, A Changing Climate For Development, Finance and Development, 2009.
Krystof Obidzinski and Agus Andrianto, Illegal Forestry Activities in Berau and East Kutai Districts, East Kalimantan: Impacts on Economy, Environment and Society, Center for International Forestry Research (April 2005)
LTS international, Capability and cost assessment of the major forest nations to measure and monitor their forest carbon for Office of Climate Change Final report (April 2008)
Luca Tacconi, Center For International Forestry Research, Fires in Indonesia: Causes, Costs and Policy Implications.
Luis Ugalde and Osvaldo Pérez, Mean Annual Volume Increment of Selected Industrial Forest Plantation Species, Forestry Department Food and Agriculture Organization of the United Nations (April 2001)

125
DRAFT
Marcus Colchester et al, Promise Land, Palm Oil and Land Acquisition in Indonesia: Implication for Local Communities and Indigenous Peoples.
Marisa Meizlish et al, Carbon Finance for Reduced Emissions from Deforestation & Degradation at the Forest Frontier, New Forest (December 2007)
Maryanne Grieg-Gran, The Cost of Avoiding Deforestation, International Institute for Environment and Development (October 2006)
Meridian Institute, Reducing Emissions from Deforestation and Forest Degradation (REDD): An Options Assessment Report (March 2009)
Ministry of Forestry, Forestry Statistic in Indonesia 2007 (2008)
Mirja Cosonen, Financial, Economic, and Environmental Profitability of Reforestation of Imperata Grassland in Indonesia, Forest Ecology and Management (1997)
Mohd. Basri Wahid et al, Oil Palm – Achievements and Potential, Web site www.cropscience.org.au (2004)
Nancy L Harris et al, Identifying optimal areas for REDD intervention: East Kalimantan, Indonesia as a case study, Environmental Research Letter (September 2008)
Natalia Tamirisa, Climate Change and The Economy, Finance and Development (2008)
Nyoman N. Suryadiputra et al, The Mahakam Lakes of East Kalimantan, Indonesia, Wetlands International.
Pablo Gutman and Bruce Cabarle, At the Crossroads? The Nexus between public and private finance for REDD+ , WWF-US (February 2010)
Pemerintah Propinsi Kalimantan Timur, Dinas Kehutanan Dalam Angka 2008.
Pemerintah Provinsi Kalimantan Timur Dinas Kehutanan, Neraca Sumber Daya Hutan Provinsi Kalimantan Timur Tahun 2007 (2008)
Pemerintah Provinsi Kalimantan Timur Dinas Pertambangan dan Energi Samarinda, Perjalanan Dunia Menuju Kesejahteraan Masyarakat Kalimantan Timur (2008)
Pemerintah Provinsi Kalimantan Timur, Rancangan Rencana Pembangunan Jangka Panjang (RPJP) Provinsi Kalimantan Timur Tahun 2005 – 2025 2007.
Pemerintah Provinsi Kalimantan Timur, Rencana Tata Ruang Wilayah Provinsi Kalimantan Timur 2008-2027.
Pemerintah Provinsi Kalimantan Timur. Rencana Tata Ruang Wilayah Provinsi Kalimantan Timur 2008 – 2027.
Pemerintahan Kabupaten Paser, Kabupaten Paser Dalam Angka 2009, Badan Perencanaan Pembangunan Daerah, Badan Pusat Statistik (2009)
Pengelolaan Pertambangan Migas Di Kalimantan Timur (2010)
Plinio Sista and Nicolas Nguyen-The, Logging damage and the subsequent dynamics of a dipterocarp forest in East Kalimantan (1990–1996), Forest Ecology and Management (2002)
Plinio Sista et al, Harvesting Intensity Versus Sustainability in Indonesia, Forest Ecology and Management (1998)
Pusat Inventarisasi dan Perpetaan Hutan Badan Planologi Kehutanan, Rekalkulasi Penutupan Lahan Indonesia Tahun 2008, (2008)
R. D. Lasco et al, Carbon Stocks Assessment Of A Selectively Logged Dipterocarp Forest And Wood Processing Mill In The Philippines, Journal Of Tropical Forest Science (2006)
126
DRAFT
RED NET.ORG, REDD-plus after Copenhagen: what does it mean on the ground? PLOS Biology July 2008 (January 2010)
Regional Investment And Permittance Board of East Kalimantan Province, Borneo Prima Orange Agribusiness Profitable Investment (2009)
Regional Investment And Permittance Board of East Kalimantan Province, Profile of Rubber Plantation Project in East Kalimantan (2009)
Regional Investment And Permittance Board of East Kalimantan Province, Attractive Prospect of Cocoa Agribusiness Investment (2009)
Regional Investment And Permittance Board of East Kalimantan Province, Seaweed Aquaculture In East Kalimantan (2009)
Regional Investment And Permittance Board of East Kalimantan Province, Profitable Prospect Investment of Coconut Plantation (2009)
Regional Investment and Permittance Board of East Kalimantan Province, Profile of Grouper Project in East Kalimantan (2009)
Regional Investment and Permittance Board of East Kalimantan Province, Profile of Beefcattle Project in East Kalimantan (2009)
Regional Investment and Permittance Board of East Kalimantan Timur, Integrated Corn Plantation and Livestock Feed Industry (2009)
Rekapitulasi Izin Pinjam Pakai Kawasan Hutan
Rekapitulasi Titik Api di Provinsi Kalimantan Timur Tahun 1997 – 2010.
Rhett A. Butler, REDD in the red: palm oil could undermine carbon payment schemes, Wiley Periodicals, Inc (2009)
Robin Naidoo, PhD, Economic Value of Carbon in the Heart of Borneo, WWF-US.
Romain Pirard and Christian Cossalter, The Revival of Industrial Forest Plantations in Indonesia’s Kalimantan Provinces, Will they help eliminate fiber shortfalls at Sumatran pulp mills or feed the China market? Center for International Forestry Research.
Ross W. Gorte, Carbon Sequestration in Forests, Congressional Research Service (August 2009)
RSPO, Green House Gas Emission From Palm Oil Production (November 2009)
Scott Alexander Stanley, Preliminatry Biomass Estimate In PT Mamberamo Alas Mandiri Concession Papua, Indonesia, Forest Carbon (February 2009)
The World Bank, Investing In A More Sustainable Indonesia (2009)
Thomas Fairhurst and David McLaughlin, Sustainable Oil Palm Development on Degraded Land in Kalimantan, WWF (January 2009)
Uwe Ballhorna et al, Derivation of burn scar depths and estimation of carbon emissions with LIDAR in Indonesian peatlands, Columbia University, New York, NY(approved October 14, 2009)
Warta Ekonomi, edisi 05 Tahun XXII 8 Maret – 21 Maret (2010)
Wiliam Boyd, Regulatory Design Option for Subnational REDD Mechanism, University of Colorado Law School (February 2010)
WWF Indonesia, Samarinda Office, Identifikasi Lanskap Kawasan Hutan Bernilai Konservasi Tinggi Di Dalam Dan Sekitar Heart of Borneo, Kalimantan Timur, (May 2008)

127
DRAFT
Yosep Ruslim et al, STUDY ON IMPLEMENTATION OF REDUCED IMPACT TRACTOR LOGGING, Ministry of Forestry and Estate Crops Co-operation with Deutsche Gesellschaft für Technische Zusammenarbeit (GTZ) (2000)

Copyright © 2010,


