32
Analyst briefing 2Q15 performance results 13 th August 2015
| Date post: | 23-Apr-2019 |
| Category: |
Documents |
| Upload: | nguyentruc |
| View: | 219 times |
| Download: | 0 times |
Analyst briefing2Q15 performance results
13th August 2015
2
DISCLAIMER
The views expressed here contain information derived from publicly available sources that have not been independently verified. No representationor warranty is made as to the accuracy, completeness or reliability of the information. Any forward looking information in this presentation has beenprepared on the basis of a number of assumptions which may prove to be incorrect. This presentation should not be relied upon as a recommendationor forecast by PT. Indo Tambangraya Megah Tbk. Nothing in this release should be construed as either an offer to buy or sell or a solicitation of anoffer to buy or sell shares in any jurisdiction
3
Financial reviewCommercial reviewOperational reviewIntroduction
4321
4
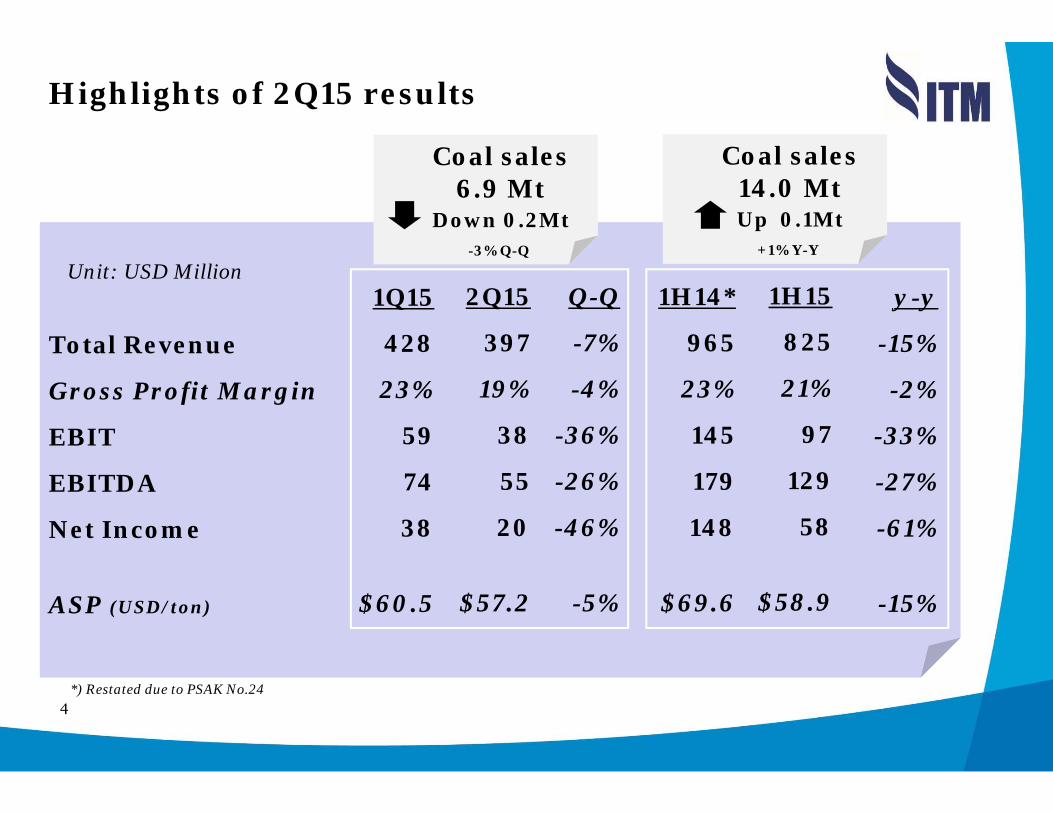
Highlights of 2Q15 results
Unit: USD Million
Total Revenue
Gross Profit Margin
EBIT
EBITDA
Net Income
ASP (USD/ton)
1Q15
428
23%
59
74
38
$60.5
y-y
-15%
-2%
-33%
-27%
-61%
-15%
2Q15
397
19%
38
55
20
$57.2
Q-Q
-7%
-4%
-36%
-26%
-46%
-5%
1H14*
965
23%
145
179
148
$69.6
Coal sales6.9 Mt
Down 0.2Mt -3% Q-Q
Coal sales14.0 MtUp 0.1Mt
+1% Y-Y
1H15
825
21%
97
129
58
$58.9
*) Restated due to PSAK No.24
5
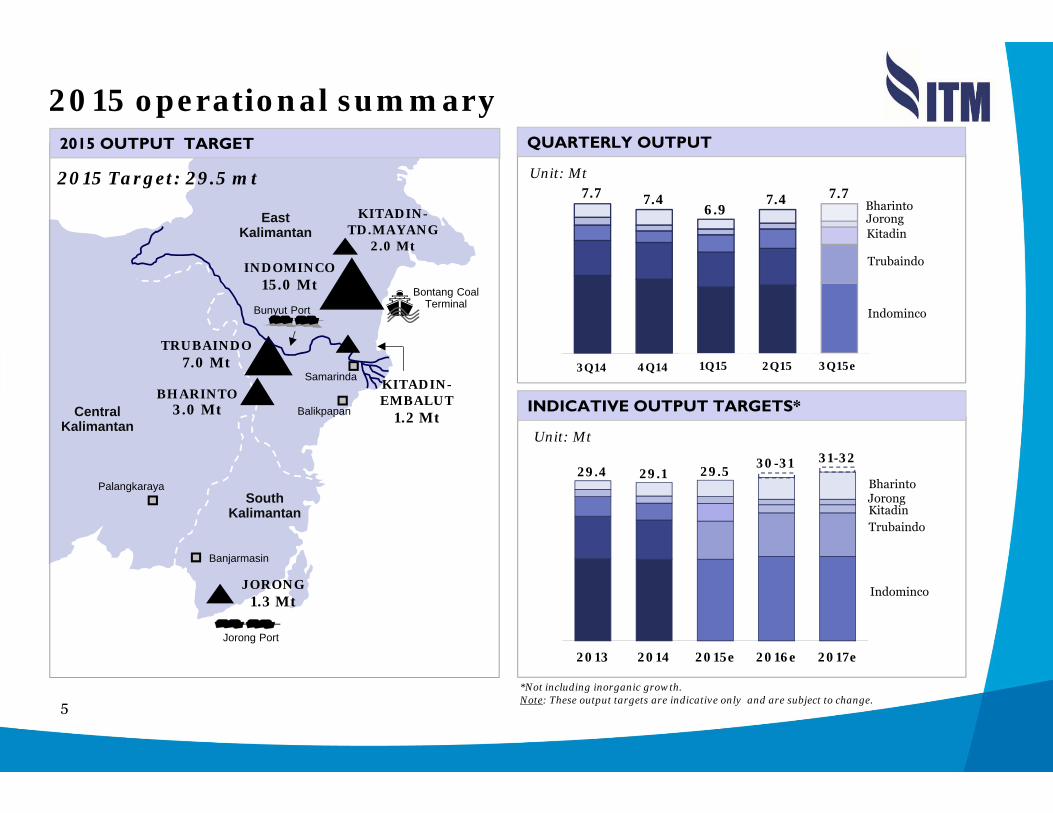
2015 operational summary
East Kalimantan
Bunyut Port
Balikpapan
Palangkaraya
Banjarmasin
Central Kalimantan
South Kalimantan
KITADIN-EMBALUT
1.2 Mt
INDOMINCO 15.0 Mt
TRUBAINDO 7.0 Mt
BHARINTO3.0 Mt
JORONG 1.3 Mt
Samarinda
Jorong Port
Bontang Coal Terminal
2015 Target: 29.5 mt
2015 OUTPUT TARGET
KITADIN-TD.MAYANG
2.0 Mt
2013 2014 2015e 2016e 2017e
3Q14 4Q14 1Q15 2Q15 3Q15e
Unit: Mt
Indominco
Trubaindo
Bharinto
KitadinJorong
INDICATIVE OUTPUT TARGETS*
*Not including inorganic growth.Note: These output targets are indicative only and are subject to change.
QUARTERLY OUTPUT
3Q14
Unit: Mt
TrubaindoKitadinJorongBharinto
Indominco
31-3229.4 29.1 29.5
4Q14
7.7
1Q15
30-31
2Q15
7.46.9
7.4
3Q15e
7.7

6
Financial reviewCommercial reviewOperational reviewIntroduction
4321
7
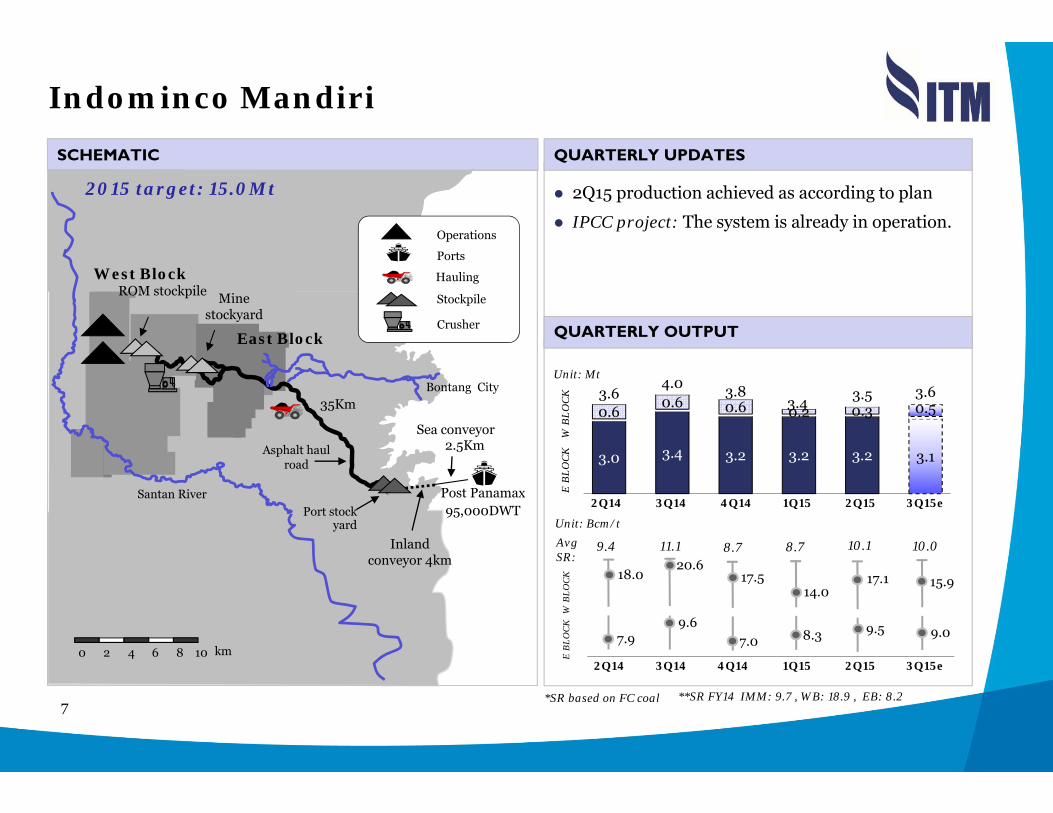
Indominco Mandiri
2Q15 production achieved as according to plan
IPCC project: The system is already in operation.
QUARTERLY UPDATESSCHEMATIC
East Block
Santan RiverPort stock
yard
Bontang City
Asphalt haul road
2.5Km
35Km
Sea conveyor
Mine stockyard
Inland conveyor 4km
0 106 82 km4
West Block
Operations
Stockpile
Ports
Hauling
Crusher
ROM stockpile
Post Panamax95,000DWT
2015 target: 15.0Mt
E B
LOC
KW
BLO
CK
E B
LOC
KW
BLO
CK
Unit: Mt
Unit: Bcm/t
QUARTERLY OUTPUT
AvgSR:
17.5
7.0
8.7
17.1
9.5
10.1
15.9
9.0
10.0
2Q14 3Q14 4Q14 1Q15 2Q15 3Q15e
18.0
7.9
9.4
**SR FY14 IMM: 9.7 , WB: 18.9 , EB: 8.2
20.6
9.6
11.1
3.0 3.4 3.2 3.2 3.2 3.1
0.60.6 0.6 0.2 0.3 0.5
3.64.0 3.8
3.4 3.5 3.6
2Q14 3Q14 4Q14 1Q15 2Q15 3Q15e
14.0
8.3
8.7
*SR based on FC coal
8
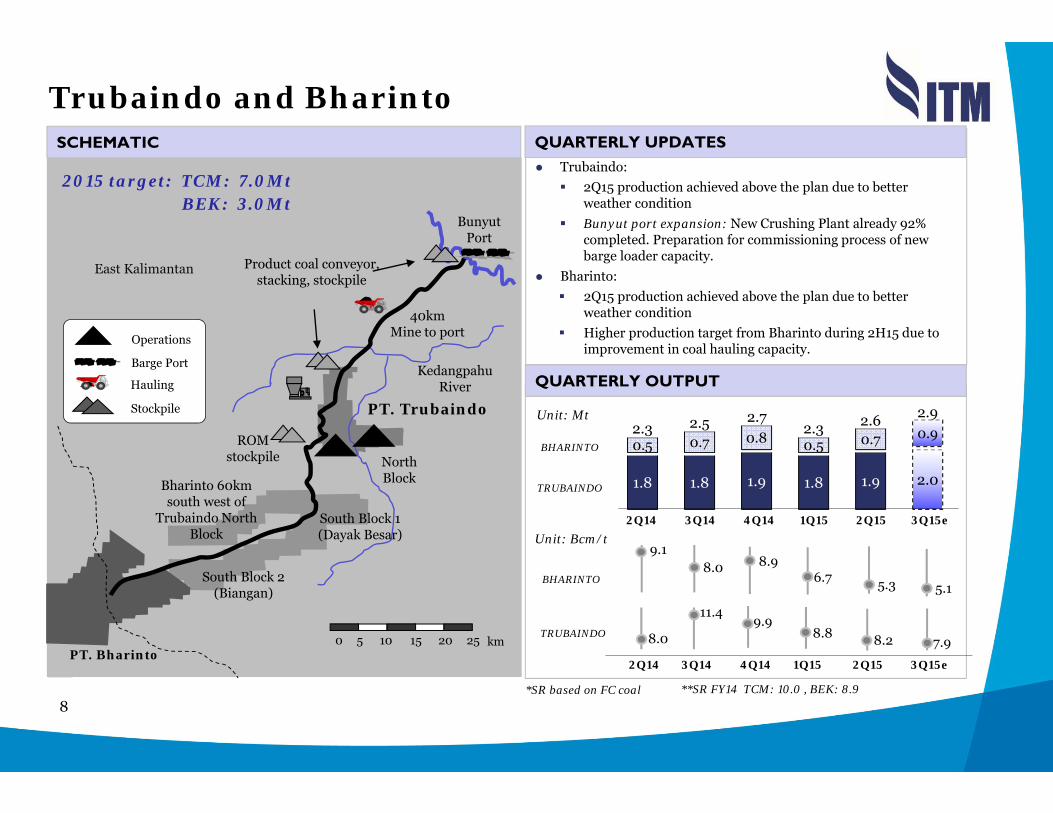
Trubaindo and Bharinto
Trubaindo: 2Q15 production achieved above the plan due to better weather condition Bunyut port expansion: New Crushing Plant already 92% completed. Preparation for commissioning process of new barge loader capacity.
Bharinto: 2Q15 production achieved above the plan due to better weather conditionHigher production target from Bharinto during 2H15 due to improvement in coal hauling capacity.
QUARTERLY UPDATESSCHEMATIC
Mahakam River
South Block 1(Dayak Besar)
North Block
40kmMine to port
KedangpahuRiver
ROM stockpile
BunyutPort
0 10 2515 205 km
Product coal conveyor, stacking, stockpile
East Kalimantan
Bharinto 60km south west of
Trubaindo North Block
South Block 2(Biangan)
PT. Bharinto
PT. Trubaindo
Operations
Stockpile
Hauling
Barge Port
2015 target: TCM: 7.0Mt BEK: 3.0Mt
TRUBAINDO
TRUBAINDO
BHARINTO
Unit: Mt
Unit: Bcm/t
BHARINTO
QUARTERLY OUTPUT
1.8 1.8 1.9 1.8 1.9 2.0
0.5 0.7 0.8 0.5 0.7 0.92.3 2.5 2.72.3 2.6 2.9
9.9
8.9
8.2
5.3
7.9
5.1
8.0
9.1
2Q14 3Q14 4Q14 1Q15 2Q15 3Q15e
**SR FY14 TCM: 10.0 , BEK: 8.9
11.4
8.0
2Q14 3Q14 4Q14 1Q15 2Q15 3Q15e
8.8
6.7
*SR based on FC coal
9
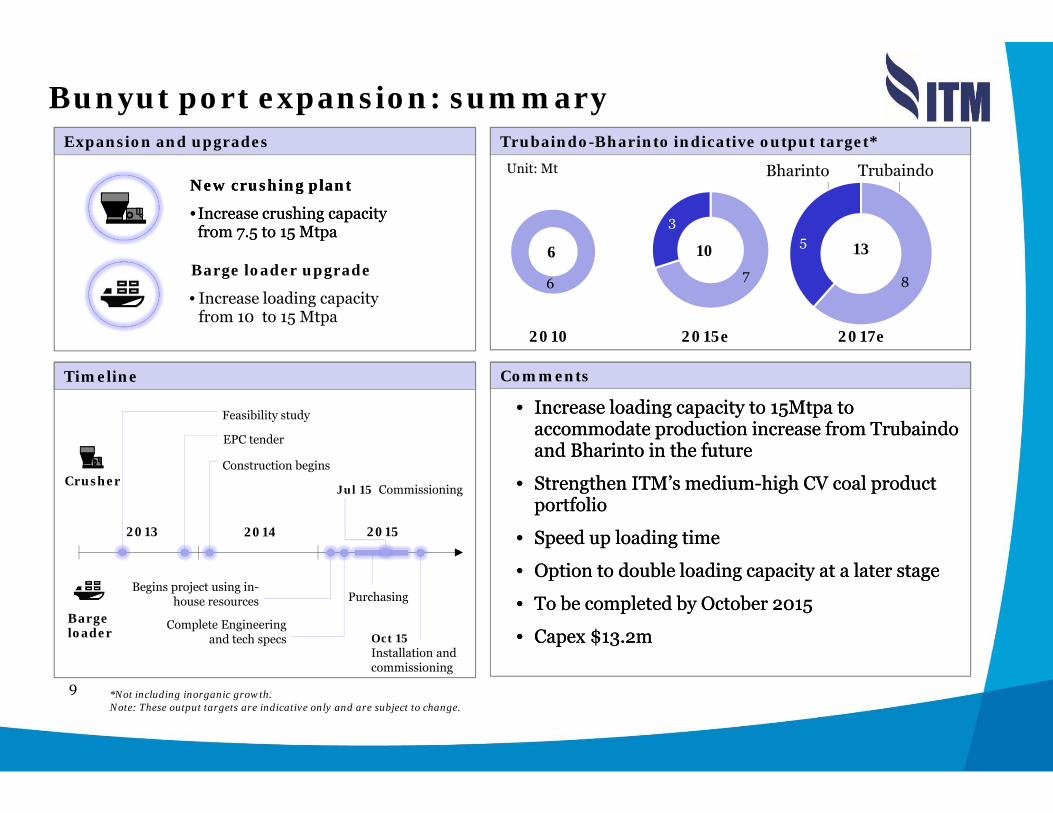
Bunyut port expansion: summaryExpansion and upgrades
New crushing plant
• Increase crushing capacity from 7.5 to 15 Mtpa
New crushing plant
• Increase crushing capacity from 7.5 to 15 Mtpa
Barge loader upgrade
• Increase loading capacity from 10 to 15 Mtpa
Comments
• Increase loading capacity to 15Mtpa to accommodate production increase from Trubaindoand Bharinto in the future
• Strengthen ITM’s medium-high CV coal product portfolio
• Speed up loading time
• Option to double loading capacity at a later stage
• To be completed by October 2015
• Capex $13.2m
• Increase loading capacity to 15Mtpa to accommodate production increase from Trubaindoand Bharinto in the future
• Strengthen ITM’s medium-high CV coal product portfolio
• Speed up loading time
• Option to double loading capacity at a later stage
• To be completed by October 2015
• Capex $13.2m
*Not including inorganic growth.Note: These output targets are indicative only and are subject to change.
Trubaindo-Bharinto indicative output target*Unit: Mt
6 7
3
8
5
Bharinto Trubaindo
2010 2015e 2017e
6 10 13
Timeline
Barge loader
Crusher
Feasibility study
2013
EPC tender
Construction begins
2015
Complete Engineering and tech specs
Purchasing
Oct 15Installation and commissioning
2014
Begins project using in-house resources
Jul 15 Commissioning
10
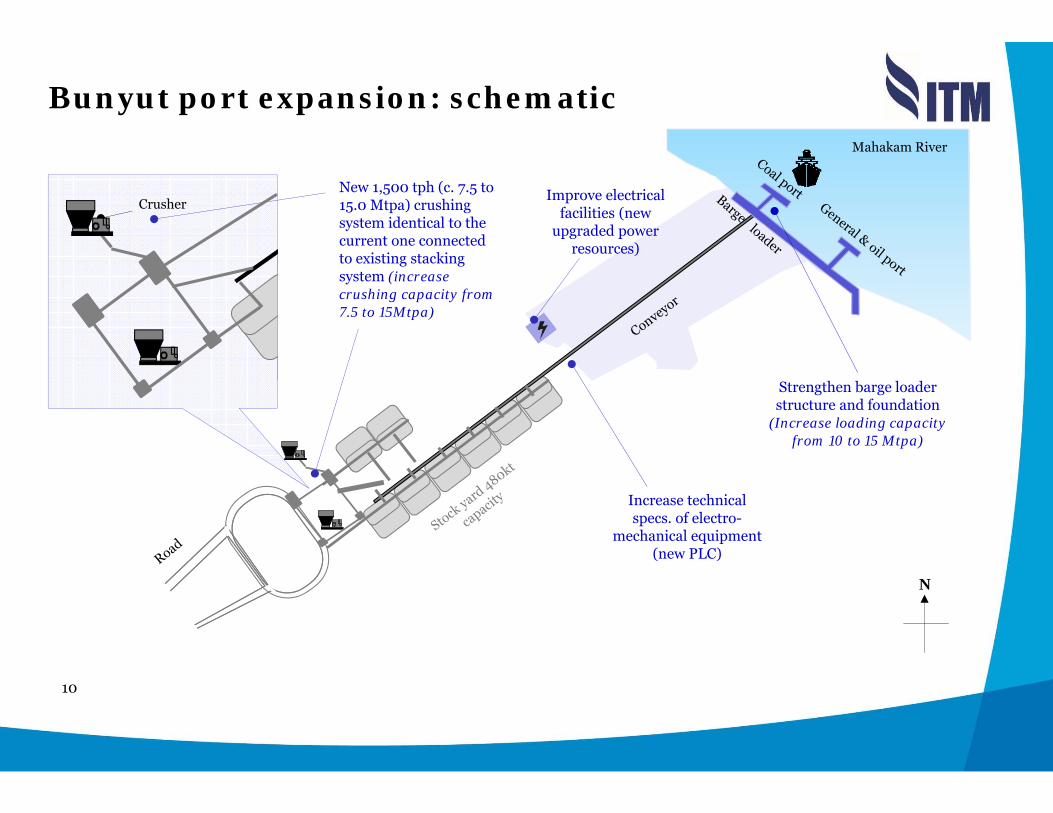
Bunyut port expansion: schematicMahakam River
New 1,500 tph (c. 7.5 to 15.0 Mtpa) crushing system identical to the current one connected to existing stacking system (increase crushing capacity from 7.5 to 15Mtpa)
Improve electrical facilities (new
upgraded power resources)
Increase technical specs. of electro-
mechanical equipment (new PLC)
N
Strengthen barge loader structure and foundation
(Increase loading capacity from 10 to 15 Mtpa)
Crusher
11
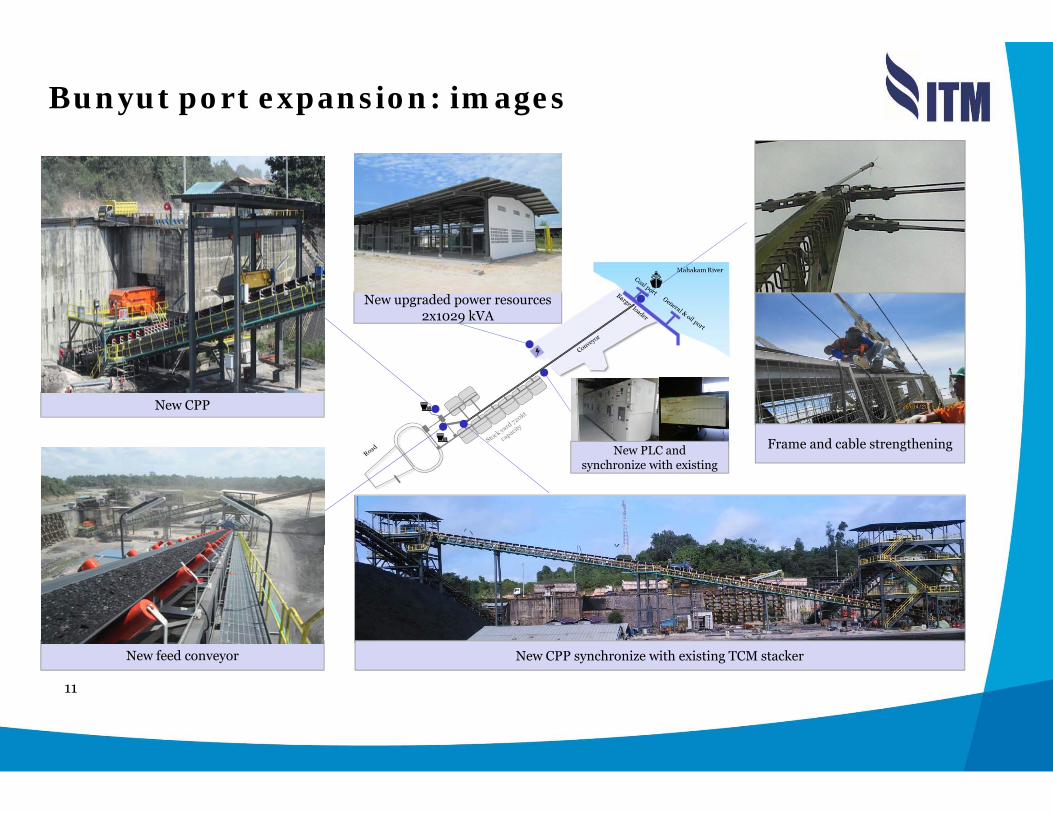
Bunyut port expansion: images
New CPP
New feed conveyor New CPP synchronize with existing TCM stacker
Frame and cable strengthening
New upgraded power resources 2x1029 kVA
New PLC and synchronize with existing
12
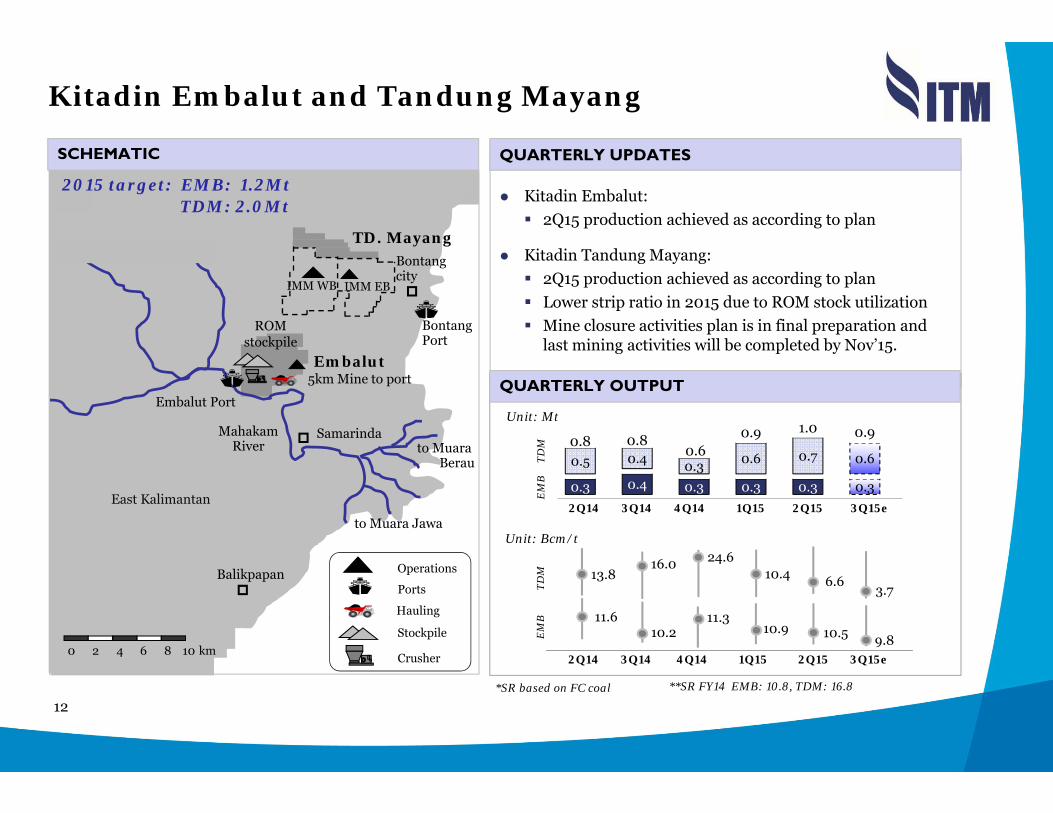
Kitadin Embalut and Tandung Mayang
Kitadin Embalut: 2Q15 production achieved as according to plan
Kitadin Tandung Mayang:2Q15 production achieved as according to planLower strip ratio in 2015 due to ROM stock utilizationMine closure activities plan is in final preparation and last mining activities will be completed by Nov’15.
QUARTERLY UPDATES
QUARTERLY OUTPUT
Balikpapan
MahakamRiver
Samarindato Muara
Berau
Bontangcity
Embalut
Embalut Port
to Muara Jawa
ROM stockpile
Operations
Stockpile
Ports
Hauling
Crusher0 106 82 km4
5km Mine to port
TD. Mayang
East Kalimantan
IMM EBIMM WB
BontangPort
TDM: 2.0Mt
TDM
EM
B
Unit: Mt
Unit: Bcm/t
2015 target: EMB: 1.2Mt
**SR FY14 EMB: 10.8, TDM: 16.8
2Q14 3Q14 4Q14 1Q15 2Q15 3Q15e
SCHEMATIC
EM
BTD
M
11.3
24.6
10.5
6.6
9.8
3.7
11.6
13.8
2Q14 3Q14 4Q14 1Q15 2Q15 3Q15e
10.2
16.0
10.9
10.4
*SR based on FC coal
0.3 0.4 0.3 0.3 0.3 0.3
0.5 0.4 0.3 0.6 0.7 0.60.8 0.8
0.60.9 1.0 0.9
13
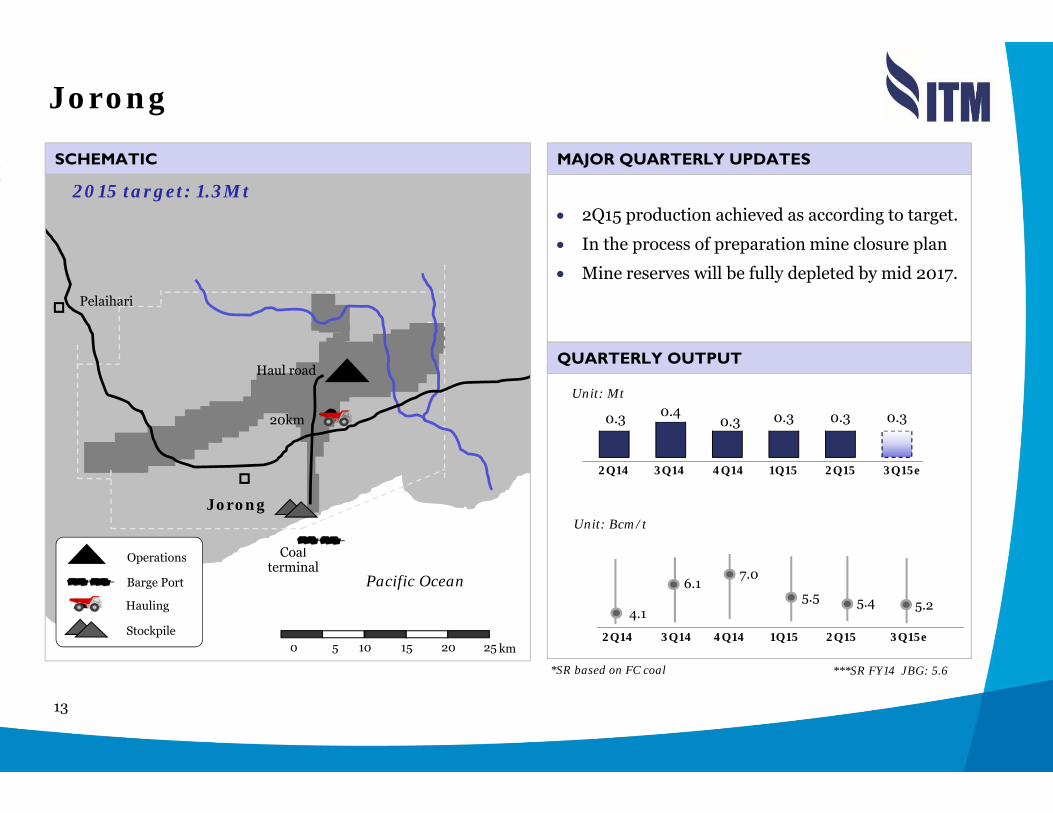
Jorong
Coal terminal
Jorong
Pelaihari
Pacific Ocean
Haul road
0 10 2515 205 km
20km
Operations
Stockpile
Hauling
Barge Port
2015 target: 1.3Mt • 2Q15 production achieved as according to target.
• In the process of preparation mine closure plan
• Mine reserves will be fully depleted by mid 2017.
SCHEMATIC
Unit: Mt
Unit: Bcm/t
0.3 0.40.3 0.3 0.3 0.3
2Q14 3Q14 4Q14 1Q15 2Q15 3Q15e
7.0
5.24.1
2Q14 3Q14 4Q14 1Q15 2Q15 3Q15e
***SR FY14 JBG: 5.6
6.15.5 5.4
*SR based on FC coal
MAJOR QUARTERLY UPDATES
QUARTERLY OUTPUT
14
Financial reviewCommercial reviewOperational reviewIntroduction
4321
15
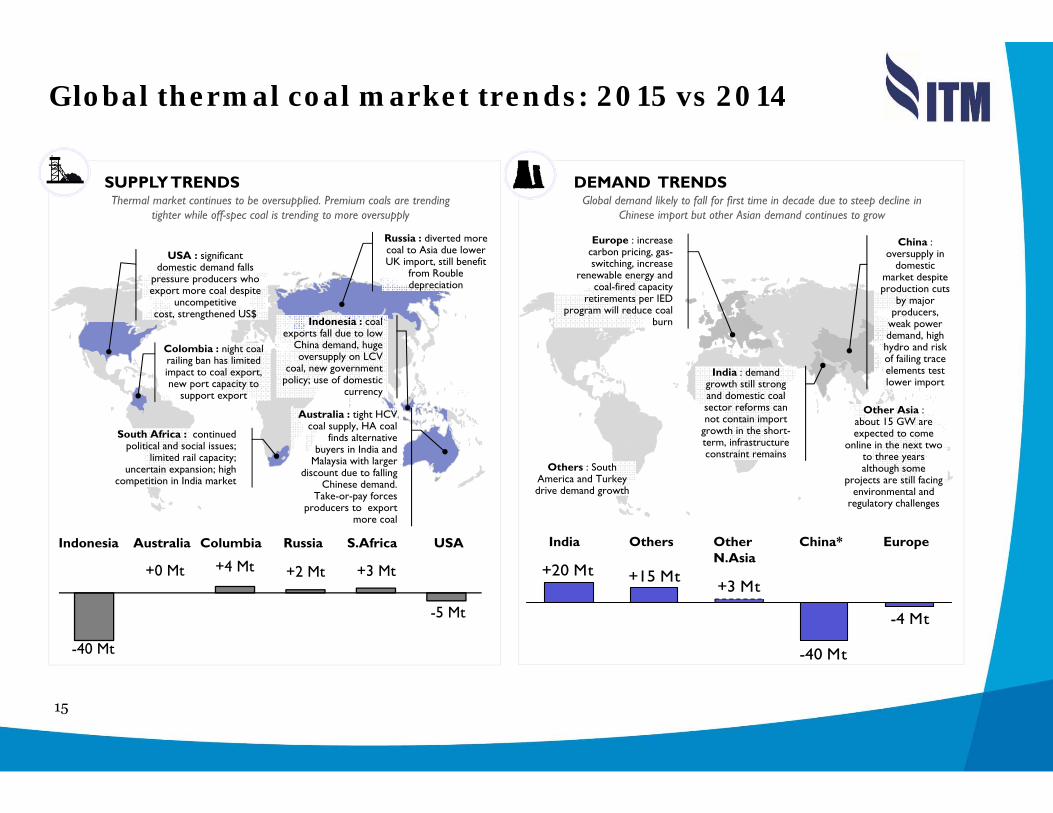
Global thermal coal market trends: 2015 vs 2014
SUPPLY TRENDS
-40 Mt
+0 Mt +4 Mt +2 Mt +3 Mt
-5 Mt
USA : significant domestic demand falls
pressure producers who export more coal despite
uncompetitivecost, strengthened US$
Russia : diverted more coal to Asia due lower UK import, still benefit
from Rouble depreciation
Indonesia : coal exports fall due to low
China demand, huge oversupply on LCV
coal, new government policy; use of domestic
currency
Australia : tight HCV coal supply, HA coal
finds alternative buyers in India and
Malaysia with larger discount due to falling
Chinese demand. Take-or-pay forces
producers to export more coal
Colombia : night coal railing ban has limited impact to coal export, new port capacity to
support export
South Africa : continuedpolitical and social issues;
limited rail capacity; uncertain expansion; high
competition in India market
Indonesia Australia RussiaColumbia S.Africa USA
Thermal market continues to be oversupplied. Premium coals are trending tighter while off-spec coal is trending to more oversupply
DEMAND TRENDS
India Others OtherN.Asia
EuropeChina*
Europe : increase carbon pricing, gas-switching, increase
renewable energy and coal-fired capacity
retirements per IED program will reduce coal
burn
China : oversupply in
domestic market despite production cuts
by major producers,
weak power demand, high hydro and risk of failing trace elements test lower import
India : demand growth still strong and domestic coal sector reforms can not contain import
growth in the short-term, infrastructure constraint remains
Others : South America and Turkey drive demand growth
Other Asia :about 15 GW are expected to come
online in the next two to three years although some
projects are still facing environmental and
regulatory challenges
Global demand likely to fall for first time in decade due to steep decline in Chinese import but other Asian demand continues to grow
-4 Mt
+3 Mt+15 Mt+20 Mt
-40 Mt
16
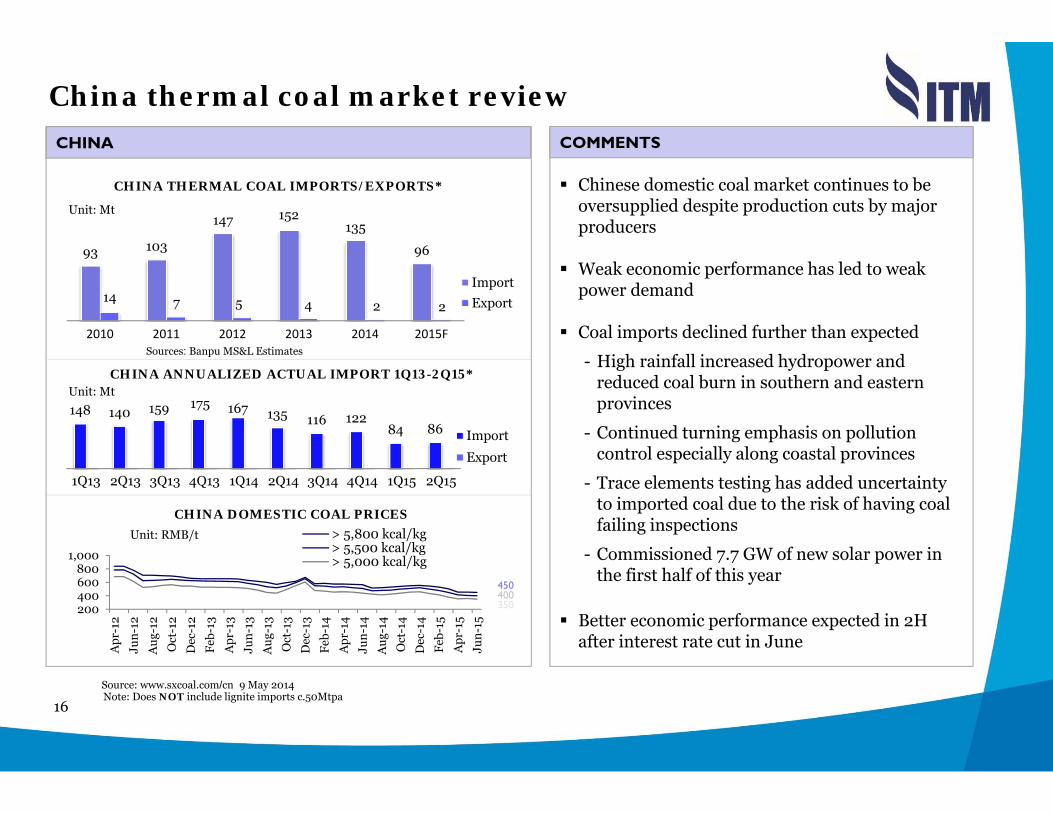
China thermal coal market review
Note: Does NOT include lignite imports c.50Mtpa
CHINA ANNUALIZED ACTUAL IMPORT 1Q13-2Q15*
CHINA THERMAL COAL IMPORTS/EXPORTS*
CHINA DOMESTIC COAL PRICES
93 103
147 135
96
14 7 5 4 2 2
2010 2011 2012 2013 2014 2015F
ImportExport
Sources: Banpu MS&L Estimates
Unit: Mt 152
148 140 159 167 135 116 12284 86
1Q13 2Q13 3Q13 4Q13 1Q14 2Q14 3Q14 4Q14 1Q15 2Q15
Import
Export
Unit: Mt
200400600800
1,000
Apr
-12
Jun-
12
Aug
-12
Oct
-12
Dec
-12
Feb-
13
Apr
-13
Jun-
13
Aug
-13
Oct
-13
Dec
-13
Feb-
14
Apr
-14
Jun-
14
Aug
-14
Oct
-14
Dec
-14
Feb-
15
Apr
-15
Jun-
15
> 5,800 kcal/kg> 5,500 kcal/kg> 5,000 kcal/kg
Unit: RMB/t
400350
CHINA
175
450
Source: www.sxcoal.com/cn 9 May 2014
Chinese domestic coal market continues to be oversupplied despite production cuts by major producers
Weak economic performance has led to weak power demand
Coal imports declined further than expected
- High rainfall increased hydropower and reduced coal burn in southern and eastern provinces
- Continued turning emphasis on pollution control especially along coastal provinces
- Trace elements testing has added uncertainty to imported coal due to the risk of having coal failing inspections
- Commissioned 7.7 GW of new solar power in the first half of this year
Better economic performance expected in 2H after interest rate cut in June
COMMENTS
17
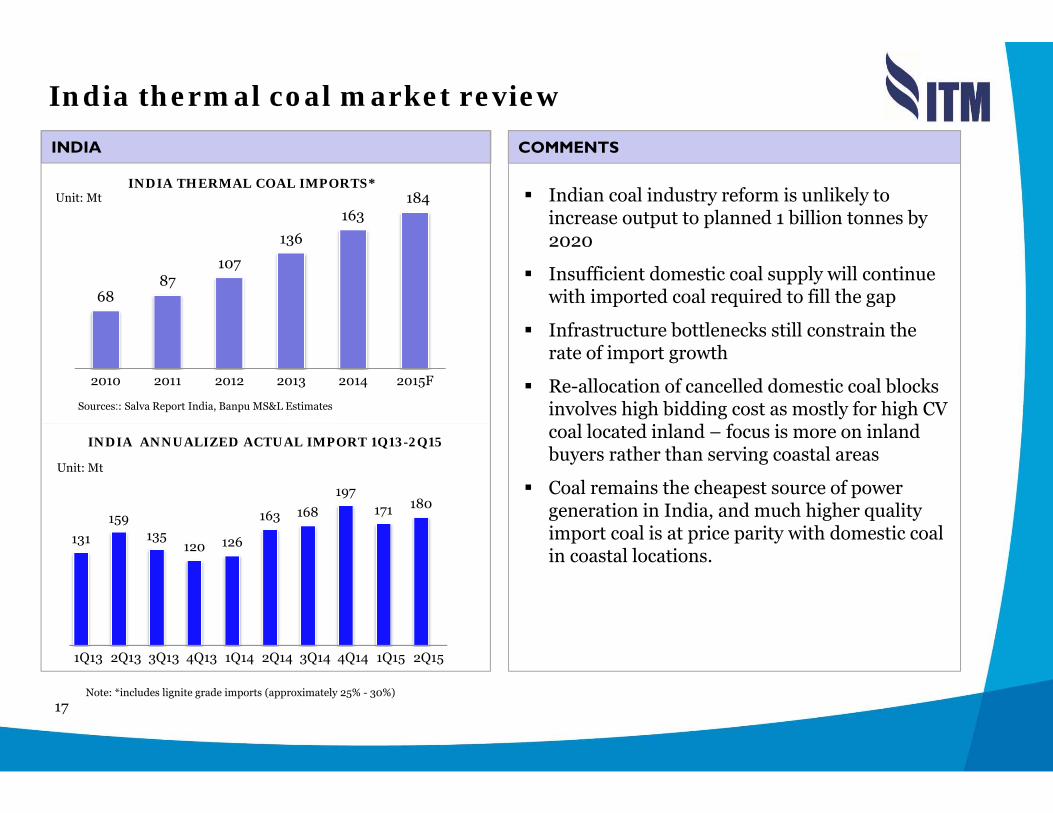
India thermal coal market review
INDIA THERMAL COAL IMPORTS*
INDIA ANNUALIZED ACTUAL IMPORT 1Q13-2Q15
Sources:: Salva Report India, Banpu MS&L Estimates
131159
135120 126
163 168197
171 180
1Q13 2Q13 3Q13 4Q13 1Q14 2Q14 3Q14 4Q14 1Q15 2Q15
Unit: Mt
Unit: Mt
Indian coal industry reform is unlikely to increase output to planned 1 billion tonnes by 2020
Insufficient domestic coal supply will continue with imported coal required to fill the gap
Infrastructure bottlenecks still constrain the rate of import growth
Re-allocation of cancelled domestic coal blocks involves high bidding cost as mostly for high CV coal located inland – focus is more on inland buyers rather than serving coastal areas
Coal remains the cheapest source of power generation in India, and much higher quality import coal is at price parity with domestic coal in coastal locations.
INDIA
Note: *includes lignite grade imports (approximately 25% - 30%)
COMMENTS
6887
107
136163
2010 2011 2012 2013 2014 2015F
184
18
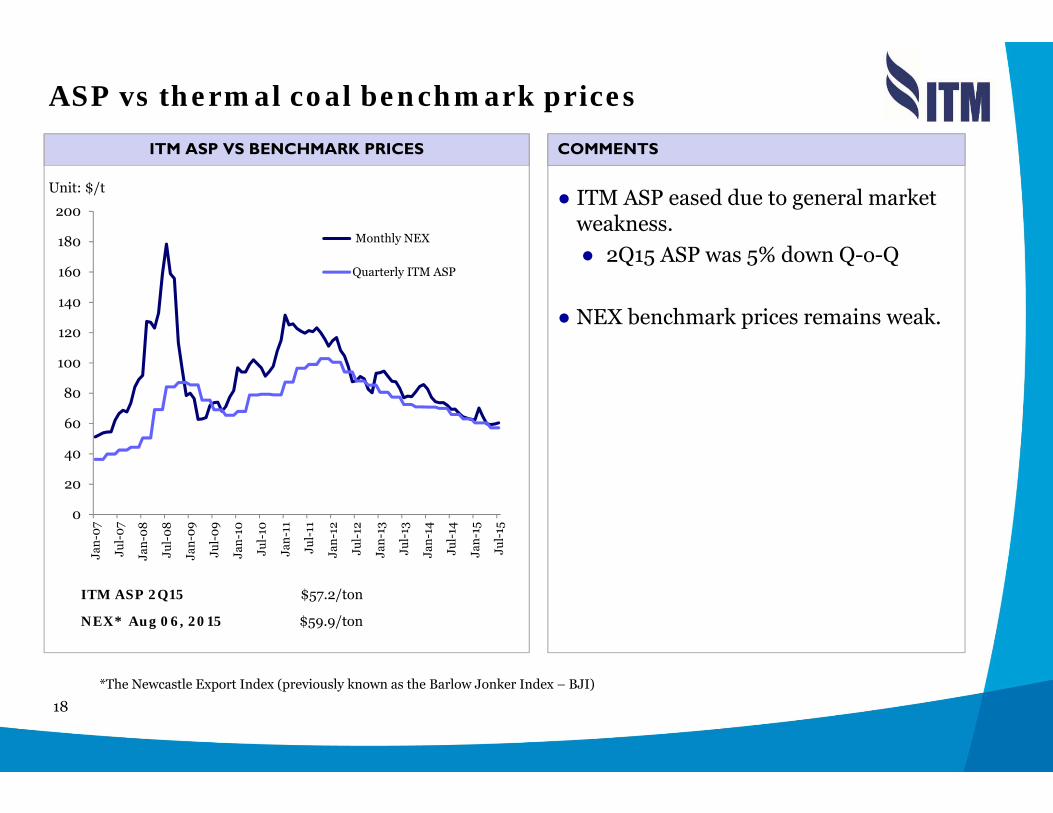
ASP vs thermal coal benchmark prices
● ITM ASP eased due to general market weakness.● 2Q15 ASP was 5% down Q-o-Q
● NEX benchmark prices remains weak.
ITM ASP VS BENCHMARK PRICES
*The Newcastle Export Index (previously known as the Barlow Jonker Index – BJI)
ITM ASP 2Q15 $57.2/ton
NEX* Aug 06, 2015 $59.9/ton
Unit: $/t
COMMENTS
0
20
40
60
80
100
120
140
160
180
200
Jan-
07
Jul-
07
Jan-
08
Jul-
08
Jan-
09
Jul-
09
Jan-
10
Jul-
10
Jan-
11
Jul-
11
Jan-
12
Jul-
12
Jan-
13
Jul-
13
Jan-
14
Jul-
14
Jan-
15
Jul-
15
Monthly NEX
Quarterly ITM ASP
19
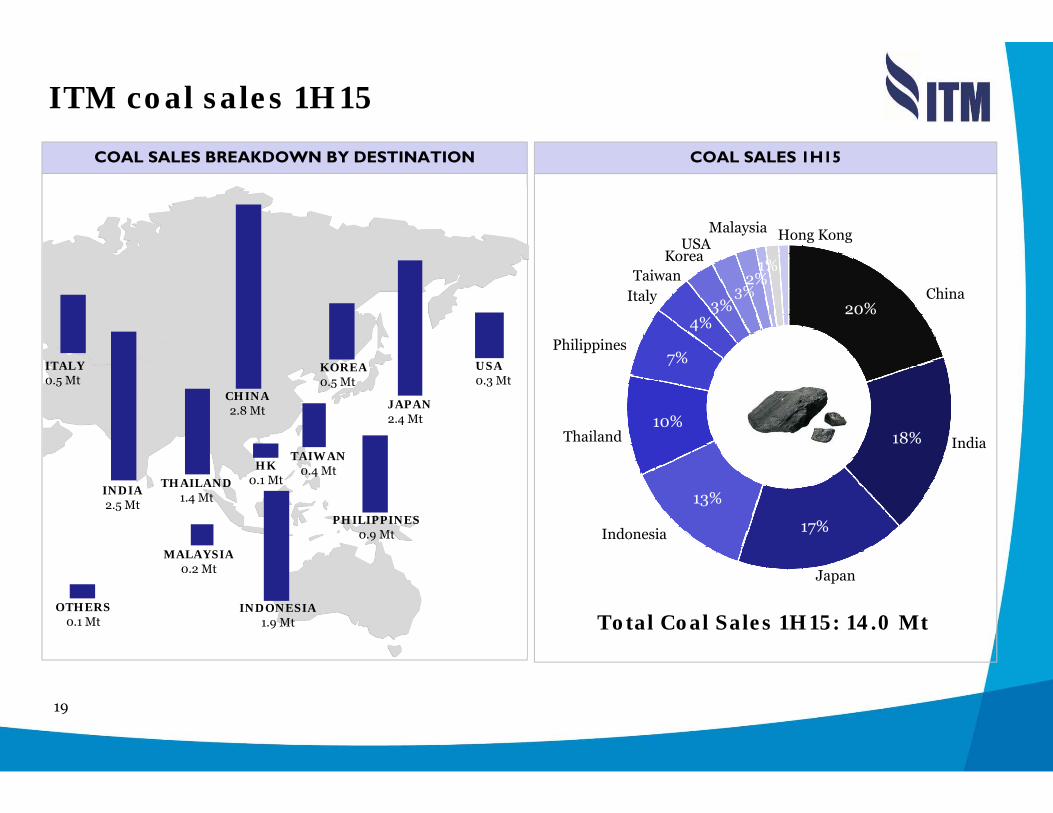
ITM coal sales 1H15
COAL SALES 1H15 COAL SALES BREAKDOWN BY DESTINATION
Total Coal Sales 1H15: 14.0 Mt
JAPAN2.4 Mt
PHILIPPINES 0.9 Mt
THAILAND1.4 MtINDIA
2.5 Mt
HK0.1 Mt
KOREA0.5 Mt
CHINA2.8 Mt
TAIWAN0.4 Mt
ITALY0.5 Mt
1.5
INDONESIA1.9 Mt
MALAYSIA0.2 Mt
OTHERS0.1 Mt
USA0.3 Mt
20%
18%
17%
13%
10%
7%
4%3%
3%2%
1%
Japan
ChinaTaiwan
Korea
Italy
Thailand
Philippines
Hong Kong
India
Indonesia
MalaysiaUSA
20
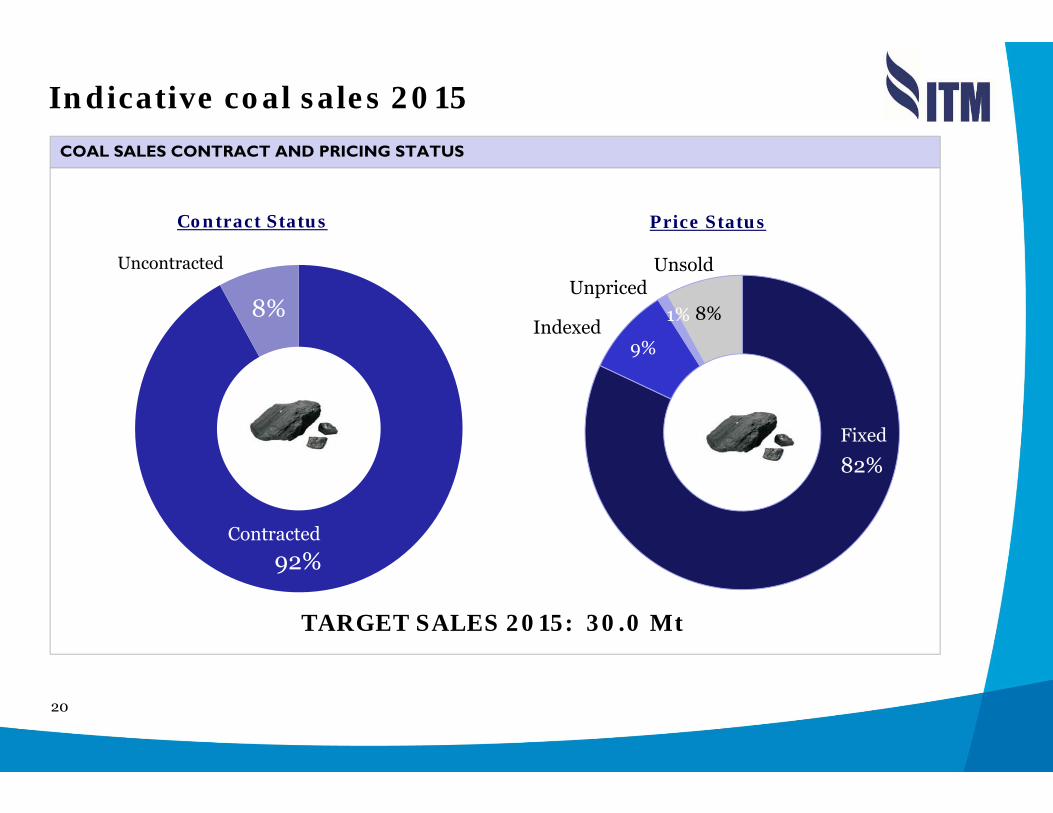
Indicative coal sales 2015COAL SALES CONTRACT AND PRICING STATUS
TARGET SALES 2015: 30.0 Mt
Contract Status Price Status
82%
1%
Fixed
Indexed
92%
8%
Contracted
UnpricedUnsold
9%
8%
Uncontracted
21
Financial reviewCommercial reviewOperational reviewIntroduction
4321
22
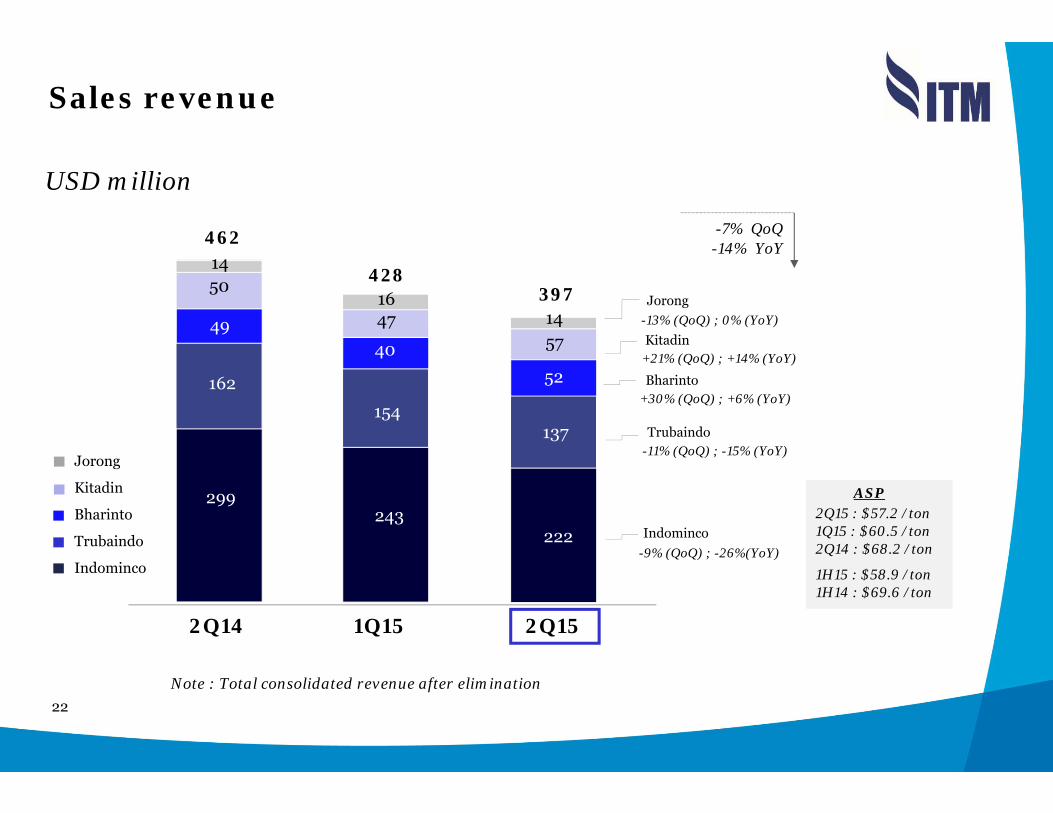
Sales revenue
Note : Total consolidated revenue after elimination
USD million
2Q14 1Q15 2Q15
397
222
137
52
5714
-7% QoQ
Jorong
Kitadin
Bharinto
Trubaindo
Indominco
-14% YoY
Indominco-9% (QoQ) ; -26%(YoY)
Trubaindo-11% (QoQ) ; -15% (YoY)
Bharinto+30% (QoQ) ; +6% (YoY)
Kitadin+21% (QoQ) ; +14% (YoY)
Jorong-13% (QoQ) ; 0% (YoY)
ASP2Q15 : $57.2 /ton1Q15 : $60.5 /ton2Q14 : $68.2 /ton
1H15 : $58.9 /ton1H14 : $69.6 /ton
462
299
162
49
5014
428
243
154
40
4716
23
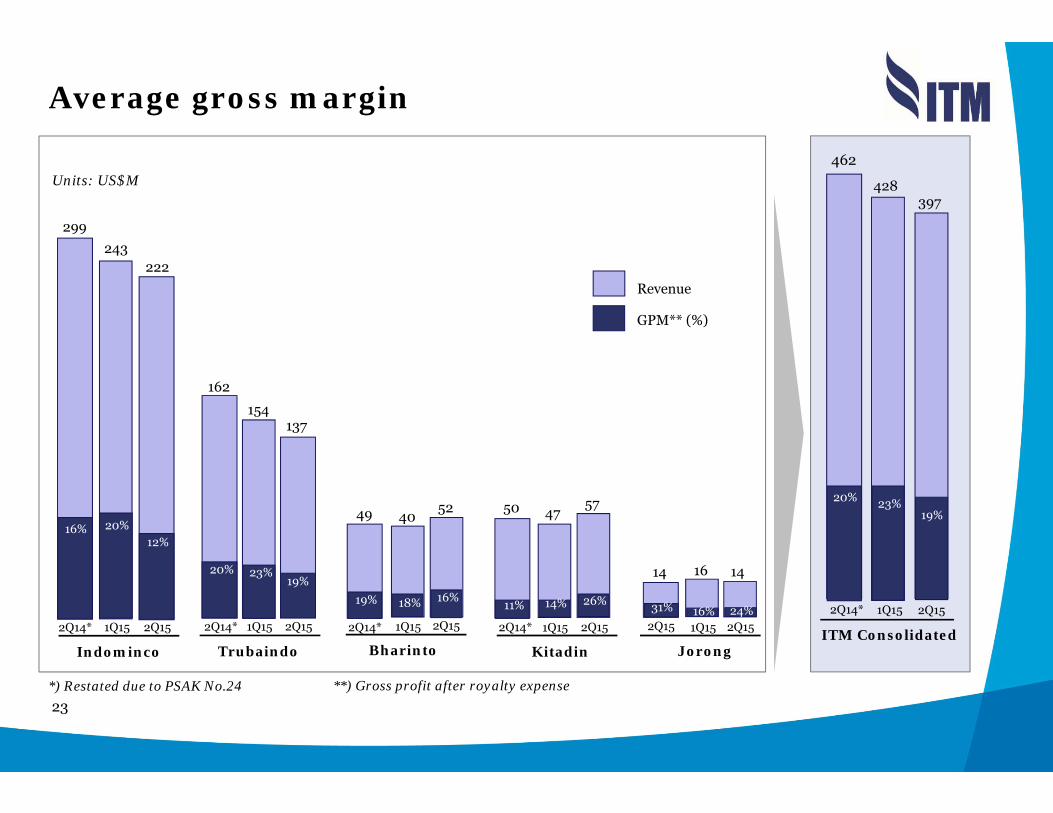
Average gross margin
Revenue
GPM** (%)
Units: US$M
Indominco Trubaindo Kitadin Jorong
39%
28%
Bharinto
243
20%
1Q15
154
23%
47
14%
14
16%
4049
1Q15 1Q15 1Q152Q14* 1Q15
18%
ITM Consolidated
2Q15
397
19%
1Q15
428
23%
2Q14*
462
20%
299
16%
2Q14*
162
20%
2Q14*
50
11%
2Q14*
14
31%2Q15
222
12%
137
19%
57
26%
16
24%
52
16%
2Q15 2Q15 2Q15 2Q152Q15
19%
*) Restated due to PSAK No.24 **) Gross profit after royalty expense

24
Cash cost
2Q14 3Q14 4Q14 1Q15 2Q15
Unit: US$/Ltr
2Q14 3Q14 4Q14 1Q15 2Q15
Unit: Bcm/t Unit: US$/t
WEIGHTED AVERAGE STRIP RATIO CASH PRODUCTION COST
FUEL PRICE
Avg. FY13: 11.2Avg. FY14: 10.0
Avg. FY13: $45.2/tAvg. FY14: $43.6/t
Avg. FY13: $1.02/ltrAvg. FY14: $1.02/ltr
9.2
10.9
1.10
9.8
1.11
0.82
Unit: US$/t
TOTAL CASH COST*
* Cash production cost + royalty + SG&A
Avg. FY13: $60.3/tAvg. FY14: $57.7/t
8.7
0.57
8.6
0.61
2Q14 3Q14 4Q14 1Q15 2Q15
2Q14 3Q14 4Q14 1Q15 2Q15
42.347.3
40.433.5 33.7
56.861.1
54.947.0 46.3
25
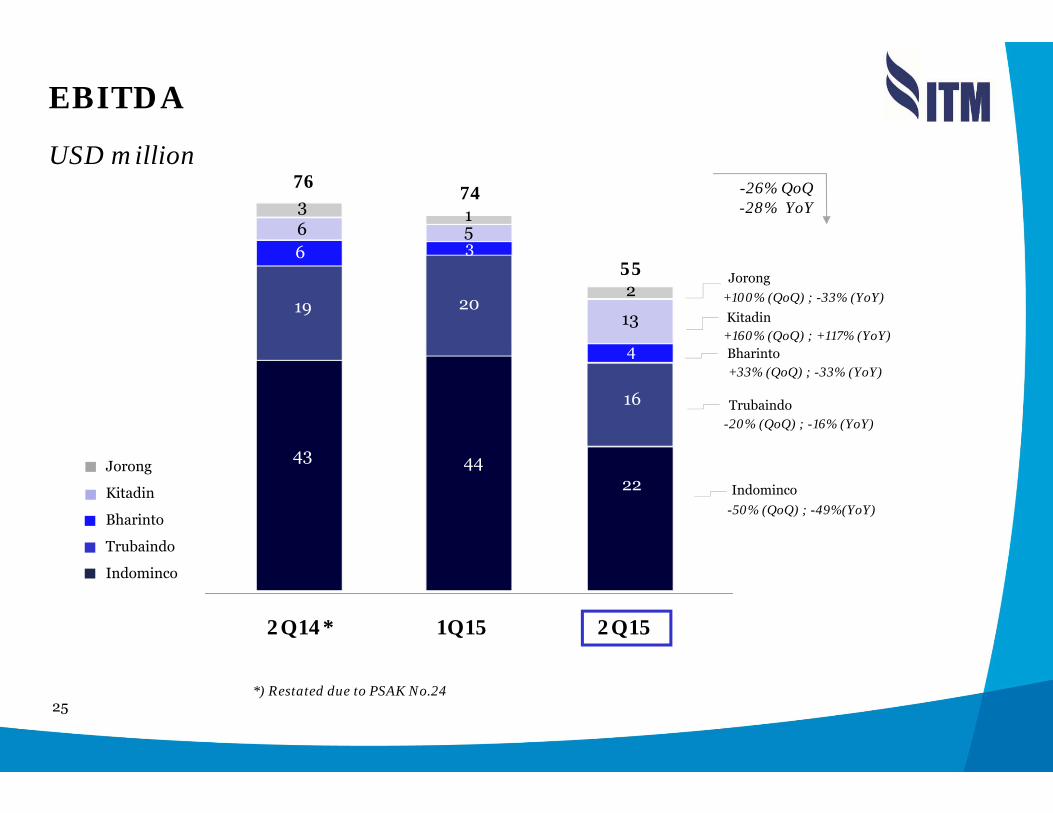
EBITDA
USD million
55
22
16
4
13
2
Jorong
Kitadin
Bharinto
Trubaindo
Indominco
2Q14* 1Q15 2Q15
-26% QoQ-28% YoY
Indominco-50% (QoQ) ; -49%(YoY)
Trubaindo-20% (QoQ) ; -16% (YoY)
Bharinto+33% (QoQ) ; -33% (YoY)
Kitadin+160% (QoQ) ; +117% (YoY)
Jorong+100% (QoQ) ; -33% (YoY)
*) Restated due to PSAK No.24
76
43
19
663
74
44
20
351
26
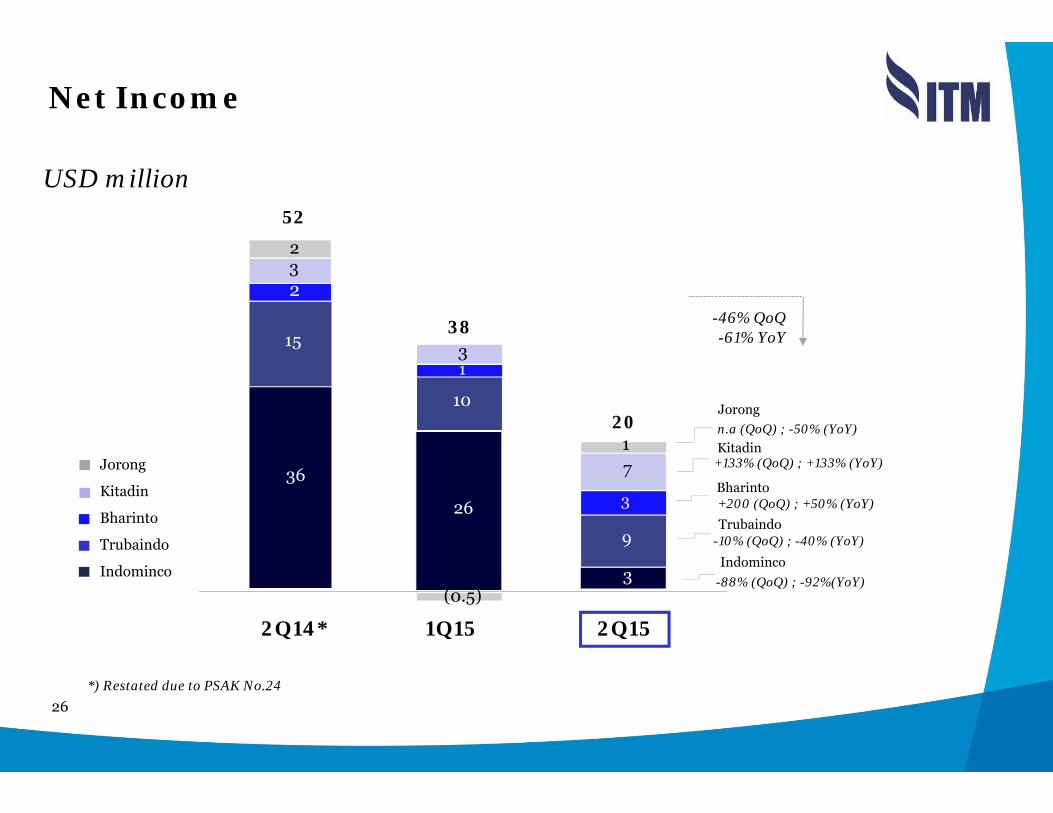
Net Income
USD million
20
3
9
3
7Jorong
Kitadin
Bharinto
Trubaindo
Indominco
2Q14* 1Q15 2Q15
-46% QoQ-61% YoY
Indominco-88% (QoQ) ; -92%(YoY)
Trubaindo-10% (QoQ) ; -40% (YoY)
Bharinto+200 (QoQ) ; +50% (YoY)
Kitadin+133% (QoQ) ; +133% (YoY)
Jorongn.a (QoQ) ; -50% (YoY)
*) Restated due to PSAK No.24
52
36
15
23
1
2
38
26
10
13
(0.5)
27
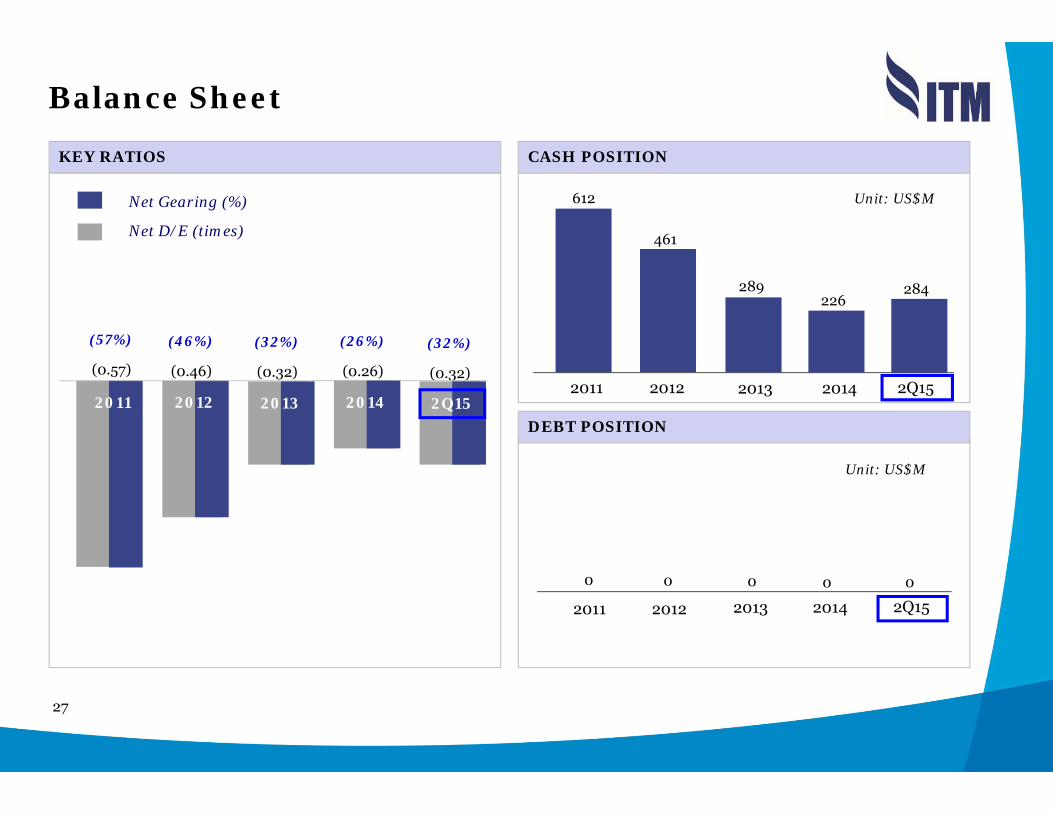
Balance Sheet
CASH POSITION
Net Gearing (%)
Net D/E (times)
KEY RATIOS
Unit: US$M
2Q15
(0.32)
(32%)
(0.57)
(57%)
2011 2012
(0.46)
(46%)
2013
(0.32)
(32%)
2014
(0.26)
(26%)
DEBT POSITION
2011
612
2Q152012
461
2013
289
2014
226284
Unit: US$M
0
2011
0 0
2012 2013
0
2014
0
2Q15
28
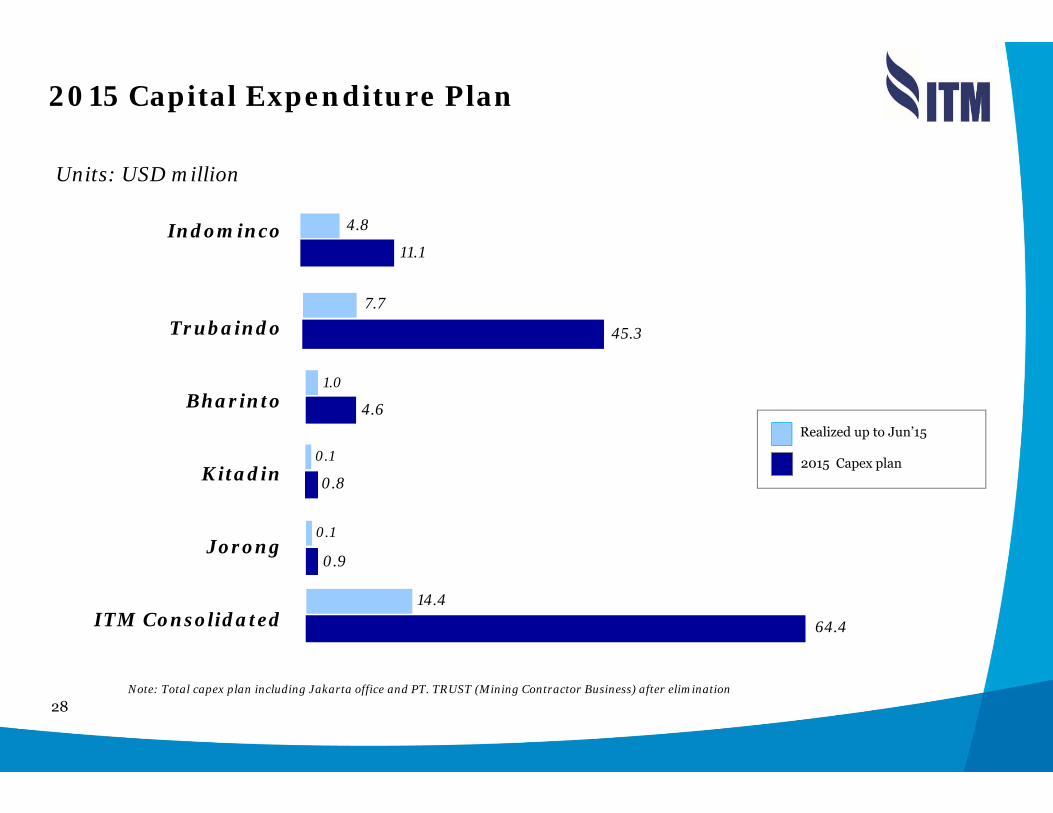
2015 Capital Expenditure Plan
Note: Total capex plan including Jakarta office and PT. TRUST (Mining Contractor Business) after elimination
Units: USD million
Realized up to Jun’15
2015 Capex plan
Indominco
Trubaindo
Bharinto
Kitadin
Jorong
ITM Consolidated
4.8
11.1
45.3
4.6
64.4
0.8
14.4
0.9
0.1
7.7
1.0
0.1
29
Appendices
30
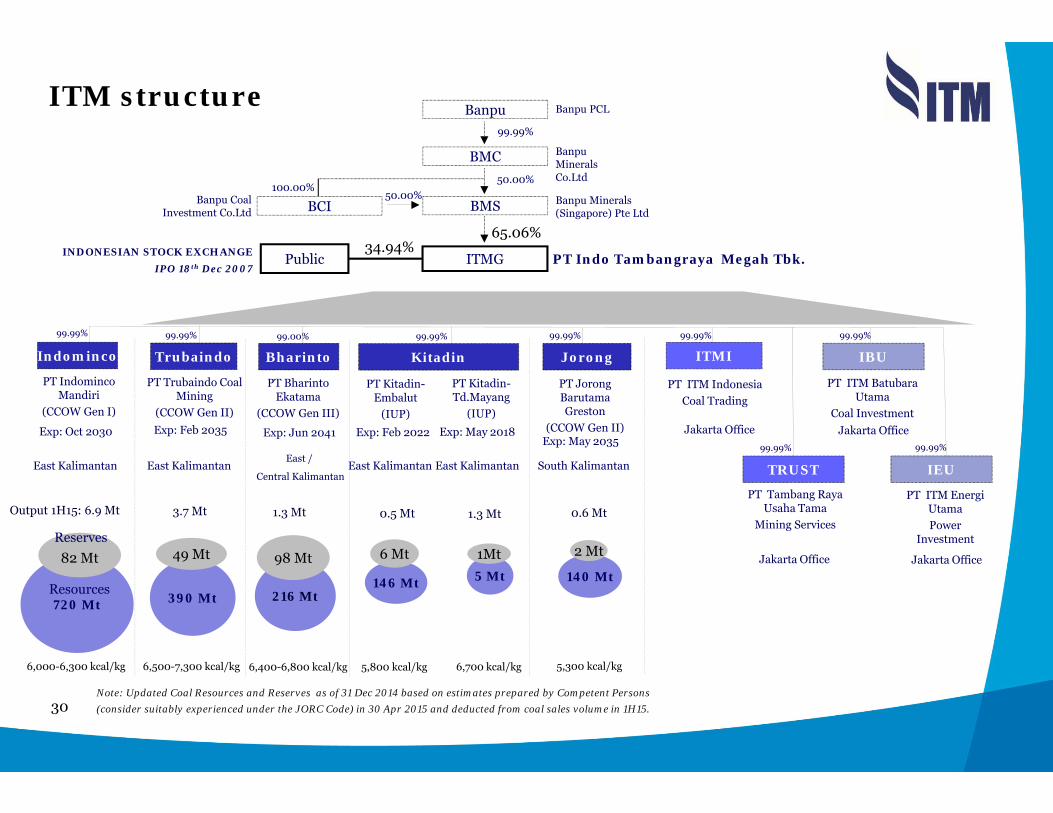
ITM structure
ITMG
65.06%
PT Indominco Mandiri
(CCOW Gen I)
PT Trubaindo Coal Mining
(CCOW Gen II)
PT Kitadin-Embalut
(IUP)
PT JorongBarutama Greston
(CCOW Gen II)
50.00%
PT Indo Tambangraya Megah Tbk.
Banpu Minerals (Singapore) Pte Ltd
99.99% 99.99% 99.99% 99.99%
BanpuMinerals Co.Ltd
BMS
99.99%
BMC
Banpu PCLBanpu
Public34.94%
PT Kitadin-Td.Mayang
(IUP)
BCI50.00%
100.00%Banpu Coal
Investment Co.Ltd
East Kalimantan East Kalimantan South KalimantanEast Kalimantan
INDONESIAN STOCK EXCHANGEIPO 18th Dec 2007
6,500-7,300 kcal/kg6,000-6,300 kcal/kg 5,800 kcal/kg 6,700 kcal/kg 5,300 kcal/kg
Output 1H15: 6.9 Mt 3.7 Mt 0.5 Mt 0.6 Mt
PT Bharinto Ekatama
(CCOW Gen III)
99.00%
East /
Central Kalimantan
6,400-6,800 kcal/kg
1.3 Mt
East Kalimantan
720 Mt
82 Mt
Resources
Reserves
390 Mt
49 Mt
146 Mt
6 Mt
216 Mt
98 Mt140 Mt5 Mt
1Mt
99.99%
Jakarta Office
PT Tambang Raya Usaha Tama
Mining Services
99.99%
Jakarta Office
PT ITM IndonesiaCoal Trading
Exp: Oct 2030 Exp: Feb 2035Exp: May 2035
Exp: May 2018Exp: Jun 2041 Exp: Feb 2022
PT ITM EnergiUtamaPower
Investment
PT ITM Batubara Utama
Coal Investment
99.99%
99.99%
Jakarta Office
Jakarta Office 2 Mt
ITMI
TRUST
Indominco Trubaindo KitadinBharinto Jorong
IEU
IBU
1.3 Mt
Note: Updated Coal Resources and Reserves as of 31 Dec 2014 based on estimates prepared by Competent Persons (consider suitably experienced under the JORC Code) in 30 Apr 2015 and deducted from coal sales volume in 1H15.
31
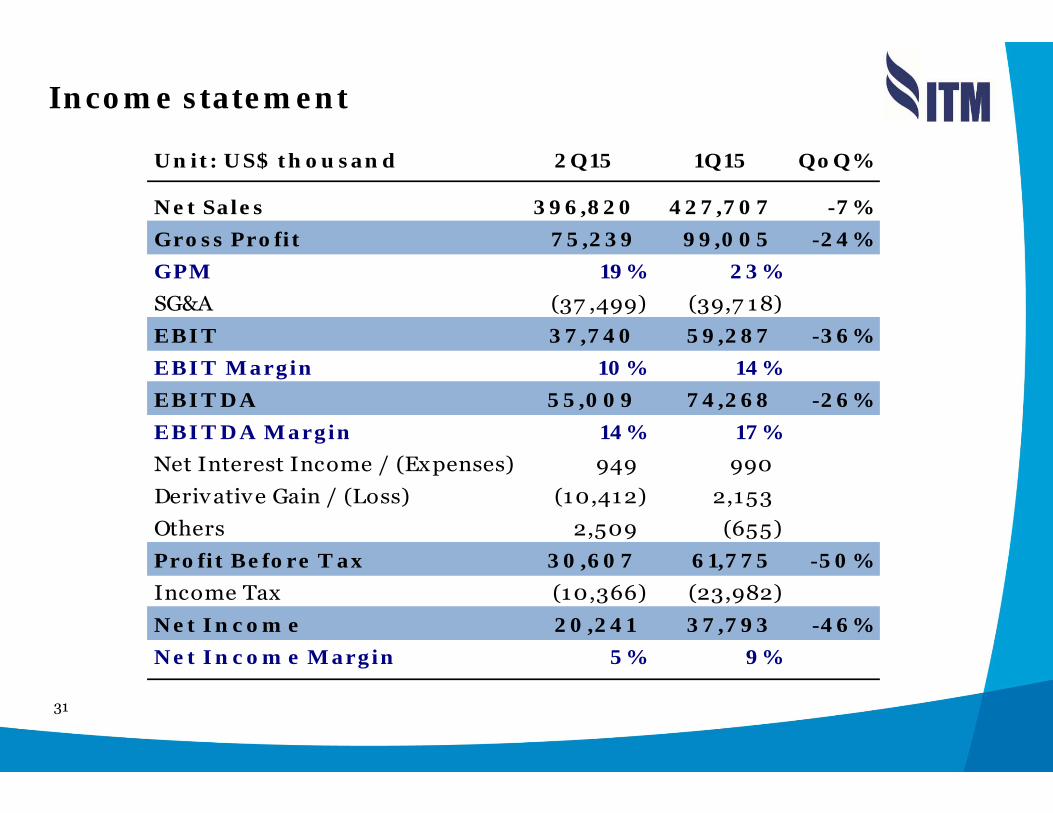
Income statement
Unit: US$ thousand 2Q15 1Q15 QoQ%
Net Sales 396,820 427 ,7 07 -7 %Gross Profit 7 5,239 99,005 -24%GPM 19% 23%SG&A (37 ,499) (39,7 18) EBIT 37 ,7 40 59,287 -36%EBIT Margin 10% 14%EBIT DA 55,009 7 4,268 -26%EBIT DA Margin 14% 17 %Net Interest Income / (Expenses) 949 990 Deriv ative Gain / (Loss) (10,412) 2,153 Others 2,509 (655) Profit Before T ax 30,607 61,7 7 5 -50%Income Tax (10,366) (23,982) Net Incom e 20,241 37 ,7 93 -46%Net Incom e Margin 5% 9%
32
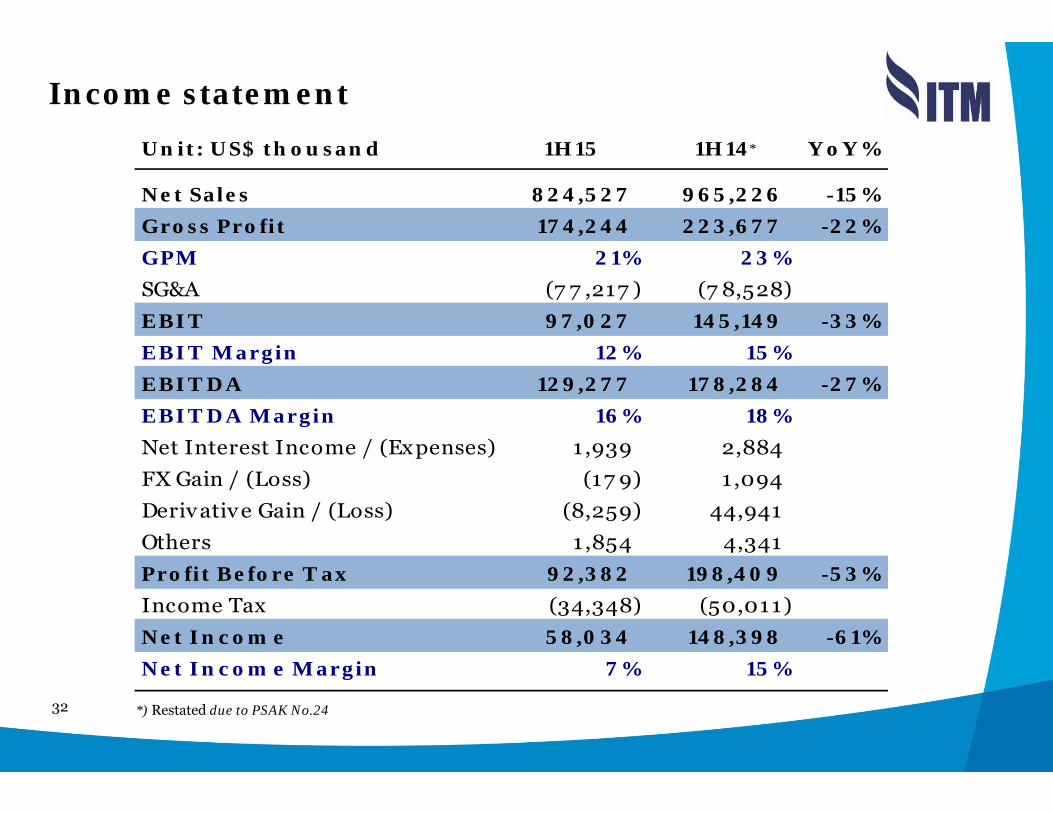
Income statementUnit: US$ thousand 1H15 1H14 YoY%
Net Sales 824,527 965,226 -15%Gross Profit 17 4,244 223,67 7 -22%GPM 21% 23%SG&A (7 7 ,217 ) (7 8,528) EBIT 97 ,027 145,149 -33%EBIT Margin 12% 15%EBIT DA 129,27 7 17 8,284 -27 %EBIT DA Margin 16% 18%Net Interest Income / (Expenses) 1 ,939 2,884 FX Gain / (Loss) (17 9) 1 ,094 Derivative Gain / (Loss) (8,259) 44,941 Others 1 ,854 4,341 Profit Before T ax 92,382 198,409 -53%Income Tax (34,348) (50,011) Net Incom e 58,034 148,398 -61%Net Incom e Margin 7 % 15%
*) Restated due to PSAK No.24
*


