67
EBA REPORT ON NPLs PROGRESS MADE AND CHALLENGES AHEAD

EBA REPORT ON NPLs
PROGRESS MADE AND CHALLENGES AHEAD

EBA REPORT ON NON-PERFORMING LOANS
2
Contents
List of figures 3
Executive summary 8
1. Introduction 10
2. Non-performing loans 11
2.1 General trend in non-performing loans 11
Text box: Convergence of asset quality ratios 12 Text box: EBA NPL transaction templates 18
2.2 Non-performing loans by past-due category 19
Text box: EBA Guidelines on management of non-performing and forborne exposures 22
2.3 Non-performing loans by type of exposure 23
2.4 Coverage of non-performing loans 28
Text box: Provisioning policies 31
2.5 Texas ratio 33
3. An assessment of asset quality based on IFRS 9 stages 35
3.1 Distribution of loans by IFRS 9 stages 35
3.2 Off-balance-sheet exposures 39
4. Forbearance measures and early warning signals 42
4.1 Exposures with forbearance measures 42
4.2 Forbearance measures used by the banks 48
4.3 Early warning signals 50
Text box: EBA Guidelines on loan origination and monitoring 53
5. Outlook and policy actions 55
5.1 Views of the banks on impediments to resolving NPLs 55
5.2 Country-specific policy actions 57
5.3 Ongoing work of the EBA and other EU institutions 58
5.4 Conclusion 60
Annex 1 — NPL ratios by country 61
Annex 2 — NPLs and total loans by country 62
Annex 3 — Coverage ratios by country 63
Annex 4 — NPLs by country and past due category 64
Annex 5 — FBL ratios by country 65
Annex 6 — NPL and FBL ratios, by segment and by country 66

EBA REPORT ON NON-PERFORMING LOANS
3
List of figures
Figure 1: Quarterly trend in NPL and NPE ratios (%) and NPL volumes (EUR billion) — December 2014 to June 2019 11
Figure 2: Quarterly trend in NPL ratio, defaulted loan ratio and impaired loan ratio (%) — December 2014 to June 2019 13
Figure 3: NPL ratios by country in June 2015 and June 2019 (%) and p.p. change between June 2015 and June 2019 14
Figure 4: NPL ratio (%) by bank in June 2015 and the change between June 2015 and June 2019 (p.p.) 15
Figure 5: Trend in NPL volumes (EUR billion) by country — June 2015 to June 2019 16
Figure 6: Main drivers of the reduction in NPL levels during the past few years — banks’ and analysts’ RAQ, autumn 2019 17
Figure 7: NPL volumes (EUR billion) by past due category and yearly trend of EU NPL ratio (%) — June 2015 to June 2019 20
Figure 8: NPL volumes (EUR billion) by past-due category and NPL ratio (%) by country — June 2019 21
Figure 9: Distribution of NPL volumes (%) by past due category and by country — June 2019 21
Figure 10: Trend in NPL volumes (EUR billion) past due > 1 year (left-hand side) and UTP (right-hand side), by lending segment — June 2015 to June 2019 22
Figure 11: Trend in NPL volumes by lending segment (EUR billion) — June 2015 to June 2019 23
Figure 12: Trend in NPL ratios (%) by lending segment — June 2015 to June 2019 24
Figure 13: Trend in NPL ratios (%) by lending sub-segment — June 2015 to June 2019 25
Figure 14: NPL ratio (%) for SME and CRE segments, by country in June 2019 and change in p.p. since June 2015 26
Figure 15: Loans and advances to NFCs: NPL ratio and coverage ratio (%) and percentage of NPL volumes to total by NACE code — June 2019 27
Figure 16: NPL ratios (%) for NFCs and for major NACE categories by country — June 2019 27
Figure 17: NPL ratio (%) for mortgages and consumer credit segments, by country in June 2019, and change in p.p. since June 2015 28
Figure 18: Trends in EU coverage ratio (%), numerator and denominator (EUR billion) — June 2015 to June 2019 29
Figure 19: NPL coverage ratio (%) through impairments and collateral by country — June 2019 30
Figure 20: Coverage ratio (%), by country, and change in p.p. between June 2015 and June 2019 30
Figure 21: Trend in coverage ratios (%), by lending sub-segment — June 2015 to June 2019 31
EBA REPORT ON NON-PERFORMING LOANS
4
Table 1: Provisioning calendar 32
Figure 22: Dispersion of Texas ratios (%) by bank, showing 5th and 95th percentiles, interquartile ranges and medians — December 2014 to June 2019 33
Figure 23: Texas ratio (%) by bank between June 2015 and June 2019 34
Figure 24: Distribution (%) of loans and advances recognised at amortised cost among stages 1, 2 and 3, by country — June 2019 36
Figure 25: Change in allocation of loans and advances recognised at amortised cost in stage 2 and stage 3 (p.p.) between June 2018 and June 2019 37
Figure 26: Distribution (%) of loans and advances among stages 1, 2 and 3, by bank — June 2019 37
Figure 27: Coverage ratio (%) of stages 2 and 3, by country — June 2019 38
Figure 28: Coverage of stages 1, 2 and 3 (%), by bank — June 2019 39
Figure 29: Off-balance-sheet exposures (EUR trillion) and (%) NPL ratio and stage 3 items — June 2019 39
Figure 30: Off-balance-sheet exposures coverage ratios (%), by asset stage — June 2019 40
Figure 31:Percentages of stage 3 and non-performing off-balance-sheet exposures of the total, by countries and by category — June 2019 41
Figure 32: Trend in FBL and FBE ratios (%) in the EU banking sector — December 2014 to June 2019 42
Figure 33: A composite credit weakness ratio of NPLs and performing forborne loans (%), December 2014 to June 2019 43
Figure 34: Change in volume of quarterly forbearance loans (performing and non-performing) (%) — December 2014 to June 2019 44
Figure 35: FBL ratio (%), by country, in June 2019 and change since June 2015 (p.p.) 45
Figure 36: FBL ratios (%), by lending segment — June 2015 to June 2019 46
Figure 37: FBL ratios (%), by lending segment and by country —June 2019 47
Figure 38: Distribution (%) of banks’ FBL ratios in June 2015 and June 2019 48
Figure 39: Distribution (%) of forborne exposures classified as NPLs and forborne exposures classified as performing, by country — June 2019 49
Figure 40: Ratio of FBLs with modifications in their terms and conditions (%) — June 2019 50
Figure 41: Total past-due loans at carrying amount, average trend in share of > 30 days past-due instruments classified as stage 1 and > 90 days past-due instruments classified either as stage 1 or stage 2 (%) — March 2018 to June 2019 51
Figure 42: Share of more than 30 days past-due instruments classified as stage 1 and more than 90 days past-due instruments classified either as stage 1 or stage 2 (%) — June 2019 52
Figure 43: Deterioration rate (%) by country — June 2018 and June 2019 53
EBA REPORT ON NON-PERFORMING LOANS
5
Figure 44: Movements to stage 3 rate (%), by country — June 2018 and June 2019 53
Figure 45: Trend in impediments to resolving NPLs (%) — banks’ RAQs, autumn 2019 55
Figure 46: Impediments to resolving NPLs (%) — banks’ RAQ, spring 2019 56
Figure 47: Reasons identified for the inefficiency of the legal framework and judiciary processes to resolve insolvency and enforce collateral (%) — banks’ RAQ, autumn 2019 56
Figure 48: Most commonly applied strategies for NPL reduction (%) — banks’ RAQ, spring 2019 57

EBA REPORT ON NON-PERFORMING LOANS
6
Abbreviations
ABS asset-backed securities
AMC asset management company
AQR asset quality review
bps basis points
CET1 Common Equity Tier 1
CRE commercial real estate
CRR Capital Requirements Regulation
DRAT Detailed Risk Analysis Tools
DTC deferred tax credit
DUTB Bank Assets Management Company of Slovenia
EBA European Banking Authority
ECB European Central Bank
ECL expected credit loss
EDIS European Deposit Insurance Scheme
EEA European Economic Area
EU European Union
FBE forborne exposures
FBL forborne loans
FINREP financial reporting
GACS Garanzia Cartolarizzazione Sofferenze
IAS 39 International Accounting Standard 39
IFRS International Financial Reporting Standard
IFRS 9 International Financial Reporting Standard 9
ITS implementing technical standards
NACE classification of economic activities
NAMA National Asset Management Agency
NFC non-financial corporations
NPE non-performing exposures
NPL non-performing loan
p.p. percentage points

EBA REPORT ON NON-PERFORMING LOANS
7
RAQ risk assessment questionnaire
SAREB Sociedad de Gestión de Activos procedentes de la Reestructuración Bancaria
SMEs small and medium enterprises
SPV special purpose vehicle
SREP supervisory review and evaluation process
SSM Single Supervisory Mechanism
UTP unlikely to pay that are not past due or are past due by 90 days

EBA REPORT ON NON-PERFORMING LOANS
8
Executive summary
This report aims to take
stock of the progress made
so far on tackling NPLs in
Europe
In the aftermath of the financial crisis, non-performing loans (NPLs) have been
a major concern for supervisors, policymakers and market participants in the
EU. In July 2017 the Council of the EU published a comprehensive action plan
to address legacy assets in Europe. This report aims to give an update on the
progress made so far, taking stock of the ongoing initiatives, identifying
challenges ahead, and indicating possible areas of further action.
Asset quality has improved
significantly since 2015
The asset quality of EU banks has improved significantly in the past 4 years.
As of June 2019, the weighted average NPL ratio stood at 3%, compared with
6% in June 2015. This is the lowest since the EBA introduced a harmonised
definition across European countries of NPLs in 2014. On average, the NPL
ratio has improved by 75 bps each year.
Comprehensive effort and
work took place involving
several stakeholders
The supervisory attention and the political determination to address
effectively the NPL issue were coupled by banks’ efforts to enhance their NPL
management capabilities. These were also helped by positive economic
growth, low interest rates and decreasing unemployment.
NPL volumes have
decreased by 50% since
2015, but country dispersion
remains wide
Reductions in NPL volumes, the numerator of the ratio, mostly drove the
improvement. Total NPLs as of June 2019 stood at EUR 636 billion, down by
almost 50% compared with June 2015. The decrease in NPLs is mostly
attributed to NPL sales and securitisations. Although reductions were
reported across all countries, predominantly by those with higher starting
ratios, NPLs remain unevenly distributed (from less than 1% in Sweden to 39%
in Greece) and remain elevated for some countries.
Improvements across all
loans categorised by past
due days
Banks also report the breakdown of NPLs by past due days. Banks with higher
NPL ratios tend to have a larger share of loans past due by more than 1 year.
Although these legacy assets have been declining the most compared with
other categories, they are considered more difficult to manage.
SMEs and CREs remain the
riskiest lending segments,
despite significant
reductions in NPL ratios
NPLs ratios are higher for lending segments such as SMEs, CREs and consumer
credit. As of June 2019, the average ratio for SMEs and for CREs stood at 8.5%
and 8.1%, respectively, and for consumer credit at 5.6%. However, the riskiest
lending segments also showed the biggest improvements over the last
4 years.

EBA REPORT ON NON-PERFORMING LOANS
9
Coverage ratios have largely
remained constant in the
last 4 years, with high
dispersion between
countries and across banks
The average coverage ratio of NPLs reported as of June 2019 was 44.9%. The
ratio has been on a slight upwards trend since June 2015 (when it was 43.6%),
supported by a faster decline of NPLs than provisions. The coverage ratio is
highly dispersed across banks and countries. Banks with lower provisioning
levels tend, however, to hold higher collateral values and vice versa.
The forbearance ratio has
improved in line with the
NPL ratio
Forbearance ratios have been decreasing constantly since June 2015, down
to 1.9% from 3.7% 4 years earlier. The decrease was mainly due to the
decrease in forborne loans, decreasing from EUR 700 billion to
EUR 400 billion during this period. Loans to non-financial corporates have a
considerably higher forbearance ratio than other loans.
IFRS 9 data confirm the
improvement of asset
quality in recent quarters
IFRS 9 data of on-balance-sheet and off-balance-sheet items confirm the
significant improvement achieved in asset quality. The share of stage 1 assets
has been increasing relative to other stages, and there was a limited migration
from stage 1 to stages 2 or 3.
Robust framework is in
place to effectively manage
NPLs
A much more solid and robust framework for banks to deal with NPLs is now
in place, benefiting, to a large extent, from the work of the EBA, the ECB and
the European Commission. This includes the EBA guidelines on management
of non-performing and forborne exposures that should support banks and
supervisors in their efforts to identify in good time and address NPE issues
effectively and efficiently. In addition, an amendment to the CRR, the
‘prudential backstop’, requires the banks to have minimum loss coverage for
non-performing exposures.
Impediments to the further
resolution of NPLs
Impediments to resolving NPLs, as identified by the banks, remain significant
in a few countries, and in particular in those with higher NPL ratios. The
differences in the speed recovery procedures across countries, caused by an
inefficient legal framework and the lack of a market for NPLs, are the
responses most often cited by the banks as impediments to the further
resolution of NPLs.
Legacy assets are still
material, and ongoing
monitoring is required in
the light of a weakening
economic environment
Despite substantial improvements, legacy assets remain material and are
concentrated in a few countries. There are significant ongoing initiatives that
aim to boost further the reduction in legacy assets in those countries, such as
Greece and Cyprus, that still have double-digit NPL ratios. However, in the
light of weakening economic conditions, banks should closely monitor asset
quality to identify any possible deterioration, especially in riskier segments,
and to continue to actively manage the NPLs from their balance sheets.

EBA REPORT ON NON-PERFORMING LOANS
10
1. Introduction
The financial crisis and ensuing recessions, coupled with structural factors and inadequate loan
origination practices, have left a number of banks in the EU struggling with NPLs1 in their balance
sheets. For many years, NPLs have been a major concern for banks, supervisors and market
participants, as their negative effects pose risks to the overall economy and financial system. In
addition to other effects, NPLs affect banks’ profitability, consume productive resources and may
limit banks’ capacities to lend to the real economy.
In 2014 the EBA introduced a harmonised definition across European countries of NPLs, which has
been the benchmark for monitoring the asset quality of the European banking sector. As of June
2015, banks reporting to the EBA had accumulated almost EUR 1.2 trillion of NPLs. Since then,
banks have made a significant effort to restructure their business models and to reduce NPLs. In
parallel, supervisors have implemented various measures that have addressed NPLs. In addition,
the Council of the EU, in an effort to provide a bold response to tackle NPLs, announced in July 2017
an action plan to tackle NPLs in Europe.
This report aims to give an update on the progress made so far, taking stock of the ongoing
initiatives, identifying challenges ahead and indicating possible areas of further action.
The figures included in this report are based on a sample of around 150 banks2, and they are aligned
with the EBA risk dashboard, covering more than 80% of the EEA banking sector (by total assets),
at the highest level of consolidation, while country aggregates may also include large subsidiaries.
All risk indicators and their ITS data points used in this report can be found in the ‘EBA
methodological guide — risk indicators and DRATs’ 3.
1 Non-performing loans or exposures are those that satisfy either of the following criteria: (a) material exposures that are more than 90 days past due; and (b) the debtor is assessed as unlikely to pay its credit obligations in full without realisation of collateral, regardless of the existence of any past due amount or of the number of days past due. 2 The number and composition of contributors is subject to variation. These changes may influence the indicator magnitudes, especially at an individual country level. The list of banks can be found at https://eba.europa.eu/risk-analysis-and-data
3 https://eba.europa.eu/risk-analysis-and-data/guides-on-data

EBA REPORT ON NON-PERFORMING LOANS
11
2. Non-performing loans
2.1 General trend in non-performing loans
The asset quality of banks in the EU area has improved significantly in the past 4 years. As of June
2019, the weighted average NPL ratio stood at 3%, compared with 6% as of June 2015 (Figure 1).
The NPL ratio has therefore improved by an average of 75 bps each year; however, the pace of
adjustment has considerably decreased in recent quarters (the ratio has decreased by just 60 bps
in the last year). Reductions in the NPL volume, the numerator of the ratio, mostly drove the
improvement. The total volume of NPLs as of June 2019 stood at EUR 636 billion, which is almost
half the NPL volume recorded in June 2015 (EUR 1 152 billion). The ratio further improved as the
result of increasing total loans. Loan volumes as of June 2019 stood at EUR 21.2 trillion, an increase
of 10% compared with June 2015 (EUR 19.2 trillion).
The NPE4 ratio improved in parallel with the NPL ratio and also moved at a slower pace in the most
recent quarters. As of June 2019 the NPE ratio stood at 2.6%, down from 5.1% in June 2015 (Figure
1).
Figure 1: Quarterly trend in NPL and NPE ratios (%) and NPL volumes (EUR billion) — December
2014 to June 2019
4 Non-performing exposures include non-performing loans and advances and debt securities.

EBA REPORT ON NON-PERFORMING LOANS
12
Text box: Convergence of asset quality ratios
The improvement in asset quality is also
confirmed when looking at other risk
indicators such as the ratio of defaulted loans
to total loans or the ratio of impaired loans to
total loans.
Asset quality can be measured according to
different metrics based on accounting,
prudential or reporting definitions:
• impaired assets, based on the accounting
definition (IFRS and/or local generally
accepted accounting principles);
• defaulted assets, based on the prudential
(CRR) definition;
• NPL/NPE, based on the EBA definition (ITS)
for supervisory reporting.
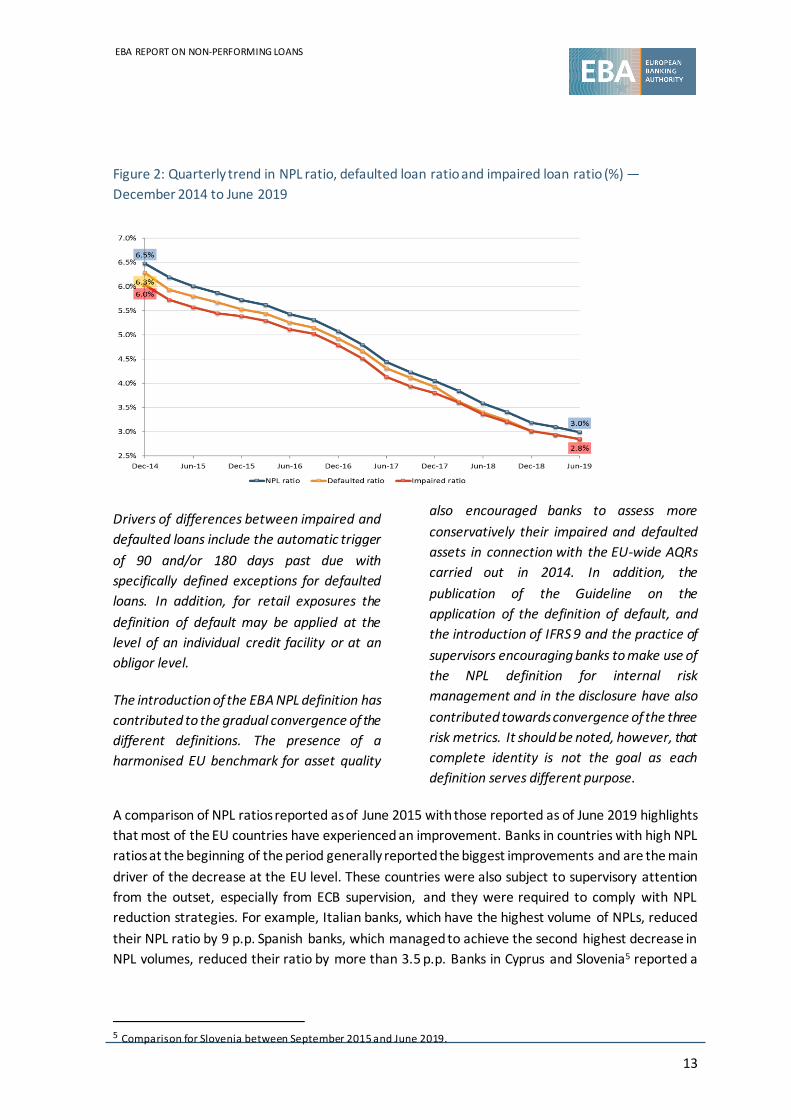
These three ratios diverged significantly in
December 2014, (NPL ratio: 6.5%; defaulted
ratio: 6.3%; and impaired ratio: 6.0%). In the
course of the last 4.5 years, these ratios have
converged significantly, and their difference
now stands at only 20 bps (Figure 2).
The main drivers of the differences between
the risk metrics were the automatic factors
used in the NPL definition, which are not
applied for default/impaired definitions.
These include:
a. a 1-year cure period to exit the NPL
status;
b. an NPL categorisation of > 90 days
past due that is strictly applied for
NPLs;
c. an NPL categorisation due to
second forbearance or 30 days past
due of a performing forborne in
probation;
d. NPL categorisation due to the 20%
‘pulling effect’;
e. different materiality thresholds.
EBA REPORT ON NON-PERFORMING LOANS
13
Figure 2: Quarterly trend in NPL ratio, defaulted loan ratio and impaired loan ratio (%) —
December 2014 to June 2019
Drivers of differences between impaired and
defaulted loans include the automatic trigger
of 90 and/or 180 days past due with
specifically defined exceptions for defaulted
loans. In addition, for retail exposures the
definition of default may be applied at the
level of an individual credit facility or at an
obligor level.
The introduction of the EBA NPL definition has
contributed to the gradual convergence of the
different definitions. The presence of a
harmonised EU benchmark for asset quality
also encouraged banks to assess more
conservatively their impaired and defaulted
assets in connection with the EU-wide AQRs
carried out in 2014. In addition, the
publication of the Guideline on the
application of the definition of default, and
the introduction of IFRS 9 and the practice of
supervisors encouraging banks to make use of
the NPL definition for internal risk
management and in the disclosure have also
contributed towards convergence of the three
risk metrics. It should be noted, however, that
complete identity is not the goal as each
definition serves different purpose.
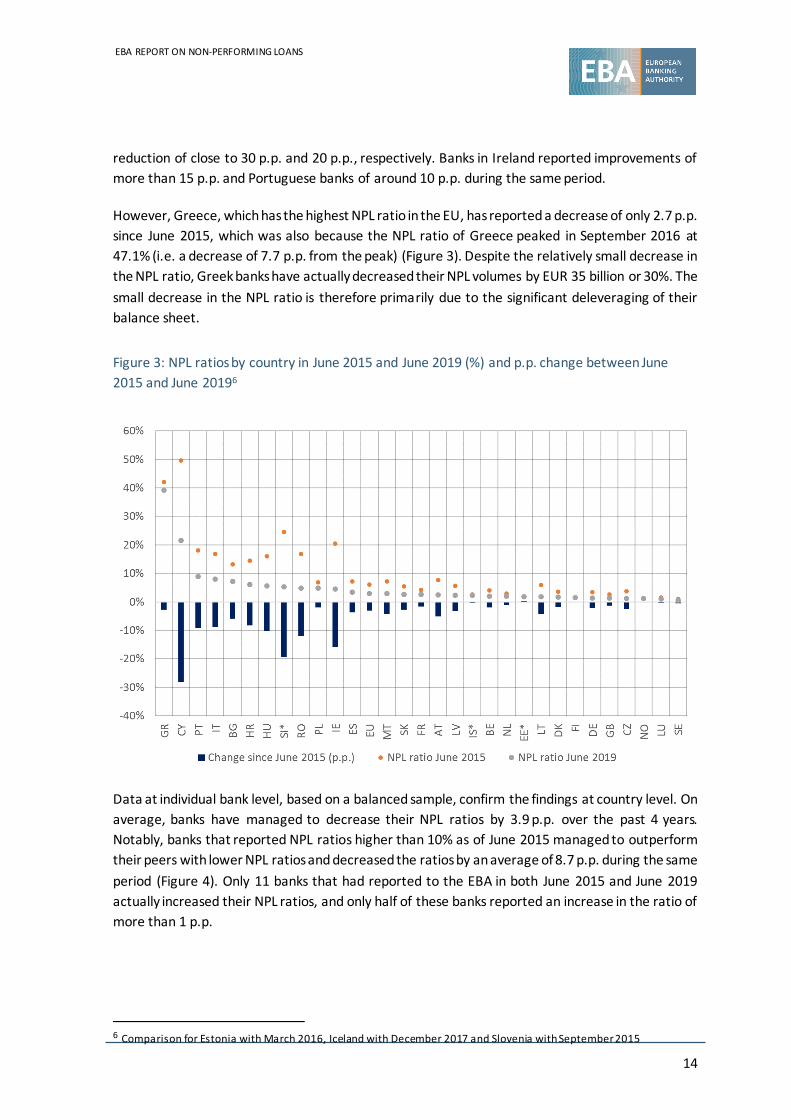
A comparison of NPL ratios reported as of June 2015 with those reported as of June 2019 highlights
that most of the EU countries have experienced an improvement. Banks in countries with high NPL
ratios at the beginning of the period generally reported the biggest improvements and are the main
driver of the decrease at the EU level. These countries were also subject to supervisory attention
from the outset, especially from ECB supervision, and they were required to comply with NPL
reduction strategies. For example, Italian banks, which have the highest volume of NPLs, reduced
their NPL ratio by 9 p.p. Spanish banks, which managed to achieve the second highest decrease in
NPL volumes, reduced their ratio by more than 3.5 p.p. Banks in Cyprus and Slovenia5 reported a
5 Comparison for Slovenia between September 2015 and June 2019.
EBA REPORT ON NON-PERFORMING LOANS
14
reduction of close to 30 p.p. and 20 p.p., respectively. Banks in Ireland reported improvements of
more than 15 p.p. and Portuguese banks of around 10 p.p. during the same period.
However, Greece, which has the highest NPL ratio in the EU, has reported a decrease of only 2.7 p.p.
since June 2015, which was also because the NPL ratio of Greece peaked in September 2016 at
47.1% (i.e. a decrease of 7.7 p.p. from the peak) (Figure 3). Despite the relatively small decrease in
the NPL ratio, Greek banks have actually decreased their NPL volumes by EUR 35 billion or 30%. The
small decrease in the NPL ratio is therefore primarily due to the significant deleveraging of their
balance sheet.
Figure 3: NPL ratios by country in June 2015 and June 2019 (%) and p.p. change between June
2015 and June 20196
Data at individual bank level, based on a balanced sample, confirm the findings at country level. On
average, banks have managed to decrease their NPL ratios by 3.9 p.p. over the past 4 years.
Notably, banks that reported NPL ratios higher than 10% as of June 2015 managed to outperform
their peers with lower NPL ratios and decreased the ratios by an average of 8.7 p.p. during the same
period (Figure 4). Only 11 banks that had reported to the EBA in both June 2015 and June 2019
actually increased their NPL ratios, and only half of these banks reported an increase in the ratio of
more than 1 p.p.
6 Comparison for Estonia with March 2016, Iceland with December 2017 and Slovenia with September 2015

EBA REPORT ON NON-PERFORMING LOANS
15
Figure 4: NPL ratio (%) by bank in June 2015 and the change between June 2015 and June 2019
(p.p.)
Italy recorded the biggest decrease in NPL volumes (EUR 145 billion) between June 2015 and June
2019. It was followed by Spain (EUR 81 billion), the United Kingdom (EUR 60 billion) and Germany
(EUR 43 billion). All four countries recorded at least a 50% decrease in their NPLs. These countries
were followed by Ireland (decrease of EUR 35 billion or 80%) and Portugal (decrease of
EUR 20 billion), quite notable amounts when one considers the size of these banking sectors. Greek
and Cypriot banks, which reported the highest NPL ratios, have decreased their NPL volumes by
EUR 35 billion (-30%) and EUR 17 billion (-73%), respectively (Figure 5).

EBA REPORT ON NON-PERFORMING LOANS
16
Figure 5: Trend in NPL volumes (EUR billion) by country — June 2015 to June 20197
There are three main pillars that determined the overall reduction in NPLs. The first pillar is the
clear policy stance of the EBA and the supervisory community, and the Council of the EU’s action
plan. The second pillar is banks’ efforts to improve NPL management capabilities, by enhancing NPL
strategies in monitoring and restructuring, by investing in information technology and by
strengthening governance. Banks leverage on instruments for NPL management that are available
to banks, such as write-offs, collateral repossession, collateral liquidation, cash collections and sales
(which also require substantial amounts of preparatory work and investment on the bank’s side to
ensure good availability of data and documentation, etc., and are thus also crucial preconditions
for any market solutions). The banks’ efforts were combined with the wider use of external
workouts and the development of companies with expertise in the area of NPL management. These
were coupled with the development of the secondary market for NPLs in a selected number of
countries. The third pillar is the positive economic growth, lower unemployment, low interest rates
and positive development in real estate markets in the EU during the past 4 years. These factors
together enhanced investors’ appetite for yields, reduced the inflow of NPLs and provided tailwinds
for transaction activity in the jurisdictions that had high volumes of legacy assets.
Analysts and banks generally agree with this assessment. Nearly 80% of the banks responding to
the EBA’s RAQ in autumn 2019 mainly attribute the decrease in the NPL volumes to successful
internal workouts and more efficient NPL strategies. These are focused not only on cures but also
on sales, write-offs, cash collections and in some cases foreclosures. Analysts rank the increased
investor appetite for NPLs as the main driver and agree that economic growth, low unemployment
rates and the development of a secondary market for NPLs were important contributors (Figure 6).
7 Comparison for Estonia with March 2016, Iceland with December 2017 and Slovenia with September 2015

EBA REPORT ON NON-PERFORMING LOANS
17
Figure 6: Main drivers of the reduction in NPL levels during the past few years — banks’ and
analysts’ RAQ, autumn 2019
Supervisory data are not yet available to monitor NPL inflows and outflows8. It is therefore difficult
to exactly value the drivers of the reduction in NPLs, i.e. how much of these are driven by sales,
securitisation, write-offs or internal workouts.
Market statistics show that the major contributor in the reduction of NPLs has been the sales or
securitisations in the secondary market, specifically for those countries with high levels of NPLs. In
the previous years, the main focus of these markets has been countries such as Italy, Spain and
Ireland. During the course of last year there were also significant transactions in Greece and Cyprus,
whereas Portuguese banks have announced further NPL sales that should take place during the
course of the second half of this year. Data9 show that announced and completed NPL transactions
in 2018 across EU Member States was about EUR 200 billion in gross book value (up from around
EUR 156 billion in 2017 and EUR 112 billion in 201610 ). The activity during 2019 seems to have
slowed down compared with previous years, suggesting that NPL sales may have peaked in 2018.
In Italy, the introduction of the GACS scheme by the government in 2016 has been instrumental in
the reduction in NPLs. The public guarantee covers only the senior tranches (i.e. the lower risk
notes) and aims to increase the credit worthiness of the senior ABS, reduce the funding cost of the
SPV and incentivise banks to sell NPLs. In the period 2016-2018, Italy has been the most active
market for NPLs in Europe, with sales in gross book value of around EUR 123 billion (excluding the
transfer of NPLs to bad banks, following banks resolution and liquidation). The critical mass of NPLs
8 Supervisory data on NPL inflows and outflows will become available with the amendments to t he ITS on supervisory reporting with regard to FINREP (ITS 2.9), as of June 2020.
9 A global NPL perspective: sellers and investors look to the big picture – Debtwire, Ashurst (https://www.ashurst.com/en/news-and-insights/insights/a-global-npl-perspective/).
10 ECB financial stability review May 2018 — Euro area financial institutions.

EBA REPORT ON NON-PERFORMING LOANS
18
in the country also presumably made it easier to establish an NPL market and attract investor
interest.
The establishment of AMCs in Ireland (NAMA), Spain (SAREB) and Slovenia (DUTB) acted as catalysts
for their banks to decrease radically their NPLs but also for the development of secondary NPL
markets. However, since then the EU regulatory context has changed and this type of solution is
now more difficult to implement (see European Commission, AMC blueprint11).
Banks in Greece and Cyprus report the highest NPL ratios in the EU and are still facing challenges
to clean up their balance sheets and move closer to the EU average NPL ratio. In this respect, in
both countries a systemic solution has been considered vital in order to speed up the NPL clean-up
process and allow banks to concentrate on lending to the healthy and viable businesses and
individuals that will further support economic growth.
Greek banks were slow to enter NPL secondary markets, but during 2018 they managed to sell
EUR 11 billion of NPEs, including retail, corporate and other mixed portfolios, mostly using
securitisation deals. In Greece, securitisation is considered the most efficient tool to offload NPLs
in good time because of the legal certainty and the sufficient investor protection that the law
provides and the lower cost compared with outright sales. An improved macroenvironment, the
removal of legal and judicial impediments, the existence of expert NPE servicers and the increased
provisions taken by the banks in the previous years have also supported the transactions in Greece.
In addition, in October 2019, the European Commission approved a Greek asset protection scheme,
stating that state guarantees are to be remunerated at market terms according to the risk taken.
The scheme, called ‘Hercules’ is similar to the Italian GACS scheme and aims to further support the
reduction of NPLs.
Cyprus is now going through a major banking sector restructuring, with the transfer of non-
performing assets of the second largest bank, by assets of the country at the time of its
restructuring, to a state-owned asset management company. At the same time performing assets
and deposits were transferred to the third largest banking institution of the country. As a result of
this, the total NPLs in the banking sector were reduced significantly. In addition, Cypriot banks have
announced NPL sales in excess of EUR 3 billion, which represent 20% of the total NPL volumes.
Text box: EBA NPL transaction templates
In December 2017, the EBA published its
standardised data templates specifying
information for the transaction of NPLs in the
secondary markets. The EBA has further
revised these templates in September 2018,
following the practical experience and
11 https://eur-lex.europa.eu/legal-content/EN/TXT/?uri=CELEX:52018SC0072
feedback received from the testing of the
original version.
One of the impediments to NPL sales in
Europe was information asymmetry and
opacity in the markets. Disparities in the
quality and quantity of data provided by
banks to investors and the absence of

EBA REPORT ON NON-PERFORMING LOANS
19
common conventions and definitions
ultimately creates delays, generates higher
transaction costs and impairs price discovery.
With this in mind, to address data
discrepancies and challenges in the NPL
secondary markets, the EBA provided these
templates to allow banks to supply
comparable and standardised data on NPLs
to meet the needs of investors and other
stakeholders.
These EBA NPL templates are based on actual
data needs in such transactions, and include
information at the most granular level,
covering exposure, counterparty, collateral
and status of the enforcement process, where
applicable. The seven templates that are
included are asset class specific covering (a)
residential, (b) CRE, (c) SME and corporate, (d)
unsecured, (e) leasing and asset-backed
finance, (f) automotive, (g) others and
specialised loans.
The EBA NPL templates, which are available
for voluntary use, are aimed at providing a
market standard for NPL transactions. The
templates have also been considered in
similar regulatory and secondary market
initiatives to tackle NPLs in Europe, such as
the EU-wide NPL transaction platform, the
AMC blueprint, and as a reference point for
the data collection and management of loan
origination and monitoring.
2.2 Non-performing loans by past-due category
Early acknowledgement of problematic loans and appropriate intervention measures are crucial in
keeping NPLs at a low level. Although there has been substantial progress in dealing with legacy
assets across all countries, the non-performing assets still found on banks’ balance sheets may be
getting older. The consequences of this are twofold: first, older NPLs may be harder to cure and,
second, the value of these assets have considerably depreciated. This also partly explains some
stickiness in the NPL ratios and volumes in some countries over the recent quarters.
The general downwards trend in NPL volumes holds true across all past-due buckets, but it is more
pronounced in buckets that are past due by more than 1 year. This has led to an increasing share
of NPLs that are classified as unlikely to pay (UTP) and are less than 90 days past due. As of June
2019, this category accounted for 40% of total NPLs, while 14% were past due for between 90 days
and 1 year, 29% were past due for more than 1 year and 17% were past due for more than 5 years.
In 2015, 32% of total NPLs were categorised as UTP, 16% were past due for between 90 days and
1 year and 52% were past due for more than 1 year (Figure 7).

EBA REPORT ON NON-PERFORMING LOANS
20
Figure 7: NPL volumes (EUR billion) by past due category and yearly trend of EU NPL ratio (%) —
June 2015 to June 2019
Countries with lower NPL ratios generally reported a larger share of NPLs in the UTP category. This
is in contrast to countries with higher NPL ratios, which have a larger share in the past-due buckets
of 1 year and more (Figure 8 and Figure 9). For example, more than 65% of Cyprus and Greece NPLs
were past due for at least 1 year and around 60% of those were past due for more than 5 years.
Similarly, Bulgaria and Hungary reported more than half of their NPLs as being past due for more
than 1 year, of which at least half were past due for more than 5 years. Italy is an exception in this,
as although around 60% of its NPLs are past due for more than 1 year only one quarter of these are
past due for more than 5 years.

EBA REPORT ON NON-PERFORMING LOANS
21
Figure 8: NPL volumes (EUR billion) by past-due category and NPL ratio (%) by country — June
2019
Figure 9: Distribution of NPL volumes (%) by past due category and by country — June 2019
Comparing NPLs that are past due by more than 1 year with those that are categorised as UTP
reveals different trends in the composition of the two categories. While the composition of UTP
loans has stayed the same for the last 4 years, the share of household loans that are past due for

EBA REPORT ON NON-PERFORMING LOANS
22
more than 1 year has increased over the same period. As of June 2019, household loans represent
almost 40% of all NPLs in this maturity bucket (see Figure 10). This reflects the fact that NPLs in the
corporate segment decreased much more than those in the household segment. For social and
political reasons, banks might be more reluctant to tackle aggressively household NPLs (e.g. to
foreclose residential property, especially primary residences). In addition, the legal framework and
impediments to foreclose collateral vary significantly across countries.
Figure 10: Trend in NPL volumes (EUR billion) past due > 1 year (left-hand side) and UTP (right-
hand side), by lending segment — June 2015 to June 2019
Text box: EBA Guidelines on management of non-performing and forborne
exposures
The EBA Guidelines on management of non-
performing and forborne exposures 12
(published in October 2018) are one of the key
regulatory initiatives that support banks’ NPE
risk reduction processes.
The guidelines introduce standards for banks’
management of NPEs on their balance sheets.
They aim to ensure that banks, in particular
those with elevated levels of NPLs, implement
comprehensive and sustainable NPE
reduction strategies together with adequate
operational arrangements for their
implementation. In particular, the guidelines
require banks with an NPL ratio of 5% or
above to establish clear targets for the
reduction of NPEs for each relevant portfolio
12 EBA/GL/2018/06 (https://eba.europa.eu/regulation-and-policy/credit-risk/guidelines-on-management-of-non-performing-and-forborne-exposures).
over realistic but sufficiently ambitious time
horizons. These targets and measures should
be in line with banks’ strategic objectives and
approaches and supported by governance
structure and operational arrangements that
enable banks to address NPE issues effectively
and efficiently, be it through sales,
securitisation or workouts. The NPE strategies
should also be supported by adequate
decision-making, operating models, internal
controls and monitoring.
The guidelines cover various phases of the
‘lifecycle’ of a bank’s NPEs and should be
reflected in the strategy, governance and
operations, including early warning systems,

EBA REPORT ON NON-PERFORMING LOANS
23
NPE recognition, forbearance, impairment
and write-offs, and collateral valuation.
The assessment of banks’ NPE reduction
strategies and related operational framework
forms part of the supervisory dialogue
between authorities and banks under the
supervisory review and evaluation process
(SREP).
2.3 Non-performing loans by type of exposure
As of June 2019, NPLs to NFCs stood at EUR 364 billion (down from EUR 705 billion in June 2015),
and NPLs to households stood at EUR 250 billion (down from EUR 396 billion 4 years earlier). SMEs,
mortgages and CREs have been the largest sub-segments by volume of NPLs. As of the second
quarter of 2019, NPLs to SMEs stood at EUR 181 billion (28.5% of the total), mortgages at
EUR 141 billion (22%) and NPLs to CREs at EUR 117 billion (18.4%). The largest percentage decrease
was reported by large corporates, down to EUR 58 billion from EUR 145 billion in June 2015 (a 60%
reduction) (Figure 11).
Figure 11: Trend in NPL volumes by lending segment (EUR billion) — June 2015 to June 2019
Households reported lower NPL ratios than NFCs. As of June 2019, the NPL ratio for households
stood at 3.1% compared with 5.5% for the NFCs. In fact, this difference was more pronounced
4 years earlier, as the NPL ratio for the NFCs was 11% and for households was 5.3% (Figure 12).

EBA REPORT ON NON-PERFORMING LOANS
24
Figure 12: Trend in NPL ratios (%) by lending segment — June 2015 to June 2019
Differences across segments are even more pronounced in the sub-categories of NFCs and
households. In particular, NPL ratios for SMEs, CREs and consumer credit are considerably higher
than for large corporates and mortgages. As of June 2019, the average NPL ratios for SMEs and for
CREs stood at 8.5% and 8.1%, respectively, and for consumer credit at 5.6%. However, these lending
segments also showed the biggest improvements over the last 4 years. For example, both SME and
CRE segments improved significantly from the NPL levels of around 18% reported in June 2015.
Large corporates generally showed a significantly lower NPL ratios than the other categories and,
as of June 2019, showed the lowest ratio of all other segments (Figure 13).

EBA REPORT ON NON-PERFORMING LOANS
25
Figure 13: Trend in NPL ratios (%) by lending sub-segment — June 2015 to June 2019
Loans to non-financial corporations
The segments with the highest NPL ratios have also improved the most. The improvement for SMEs
and CREs is driven by banks in countries with high NPL ratios (Figure 14). A comparison of the NPL
ratios reported as of June 2019 with those reported as of June 2015 shows that the vast majority
of banks reported significant reductions in NPL ratios for both segments. The largest improvements
were reported by banks in Slovenia13, Ireland and Cyprus, with reductions in NPL ratios for both
segments close to 40 p.p. Banks in Croatia and Romania have also achieved significant reductions
of approximately 30 p.p. since June 2015. Nevertheless, there are still obvious vulnerabilities in
these sectors in a few countries. Almost half of the total NFCs of Greek banks’ exposures and close
to 60% of exposures to SMEs and CREs are non-performing. In addition to this, there are a few
countries in which especially SME and CRE exposures have high shares of NPLs.
13 Comparison for Slovenia between September 2015 and June 2019.

EBA REPORT ON NON-PERFORMING LOANS
26
Figure 14: NPL ratio (%) for SME and CRE segments, by country in June 2019 and change in p.p.
since June 201514
Supervisory data also provide a further split in NFC exposures by economic activity. An analysis of
NPLs by NACE code shows that the construction industry had the highest NPL ratio (15%) in June
2019. Loans to the accommodation and food services sector and to the arts, entertainment and
recreation sector have also heightened NPL ratios (9% and 8%, respectively) (Figure 15). Important
sectors, such as manufacturing and the wholesale and retail trade, which account for roughly 15%
of the total NFCs each, have an NPL ratio of around 6%, which is slightly above average. On the
other side, the lowest NPL ratios were towards exposures to public administration (1%) and around
utilities, e.g. water supply, electricity and gas, which reported an NPL ratio of around 3%.
14 Comparison for Estonia with March 2016, Iceland with December 2017 and Slovenia with September 2015

EBA REPORT ON NON-PERFORMING LOANS
27
Figure 15: Loans and advances to NFCs: NPL ratio and coverage ratio (%) and percentage of NPL
volumes to total by NACE code — June 2019
At a country level, Greece stands out as it has the highest NPL ratios in the four largest sectors by
volume of NPLs (manufacturing, construction, wholesale and retail, and real estate activities). Other
countries with heightened NPL ratios for the four sectors are Cyprus, Croatia, Italy, Portugal and
Slovenia (Figure 16).
Figure 16: NPL ratios (%) for NFCs and for major NACE categories by country — June 2019

EBA REPORT ON NON-PERFORMING LOANS
28
Loans to households
A general trend of improving NPL ratios could also be observed for mortgages and consumer credit
(Figure 17). A comparison of NPL ratios reported as of June 2019 with those reported as of June
2015 shows that the vast majority of banks reported significant reductions in NPL ratios for both
segments. The largest improvements were reported by banks in Cyprus, with an average reduction
in NPL ratios for mortgages of close to 21 p.p. For the same segment, banks in Bulgaria, Hungary
and Ireland have achieved significant reductions of more than 10 p.p. since June 2015. Banks in
Greece represent an exception to this trend, as they reported an increase of 7 p.p. in the NPL ratio
for mortgages over the 4-year period, which as of June 2019 stood at 45%. It is noted that in all
other segments Greece has shown a decrease, albeit small, in NPL ratios. The increase in mortgage
NPLs may also be attributed to changes in the Greek legal framework that provide protection from
foreclosure to home owners and therefore have incentivised strategic defaulters.
Figure 17: NPL ratio (%) for mortgages and consumer credit segments, by country in June 2019,
and change in p.p. since June 201515
2.4 Coverage of non-performing loans
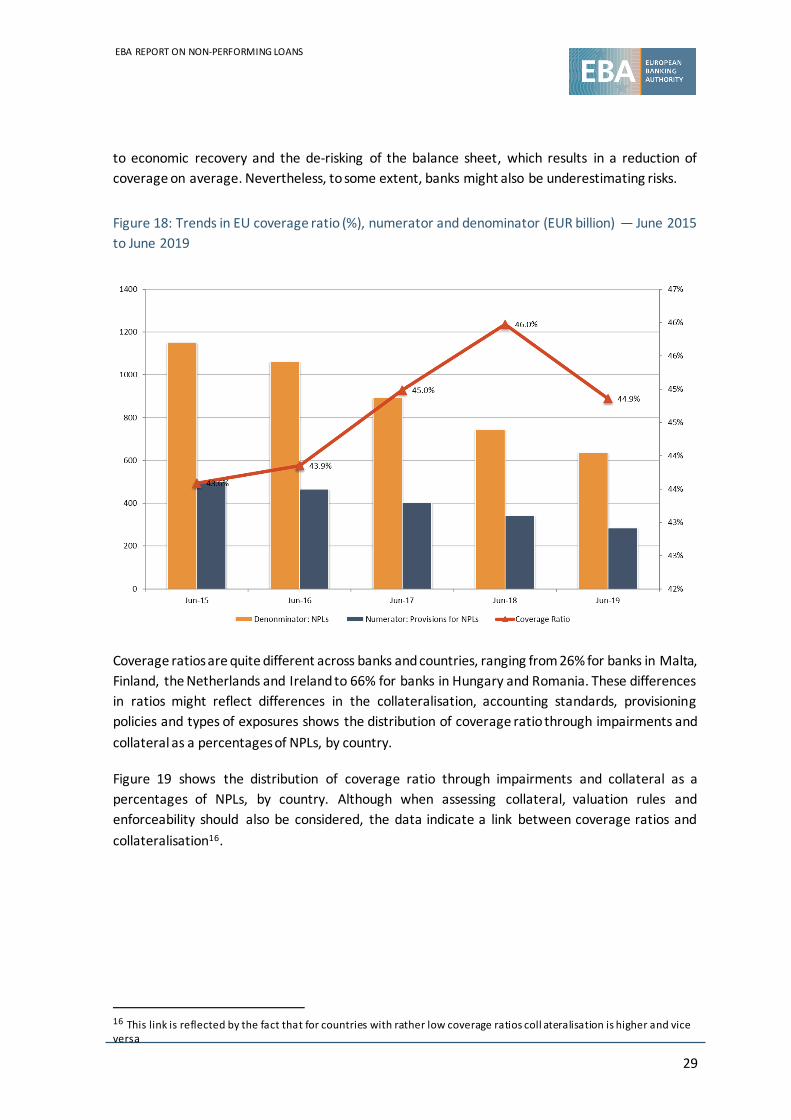
The average coverage ratio of NPLs reported as of June 2019 was 44.9%, an increase of 130 bps
since 2015. This trend is the result of a faster decline in NPLs than in provisions. However, the
coverage ratio has declined in the most recent year (down from 46% reported as of June 2018).
This recent decline was due to a significant fall in provisions (-17% since June 2018), which was
more pronounced than the continuing decline in NPLs (-15% since June 2018) (Figure 18). There are
a few possible reasons underlying the decrease in provisioning, such as the lower cost of risk owing
15 Comparison for Estonia with March 2016, Iceland with December 2017 and Slovenia with September 2015
EBA REPORT ON NON-PERFORMING LOANS
29
to economic recovery and the de-risking of the balance sheet, which results in a reduction of
coverage on average. Nevertheless, to some extent, banks might also be underestimating risks.
Figure 18: Trends in EU coverage ratio (%), numerator and denominator (EUR billion) — June 2015
to June 2019
Coverage ratios are quite different across banks and countries, ranging from 26% for banks in Malta,
Finland, the Netherlands and Ireland to 66% for banks in Hungary and Romania. These differences
in ratios might reflect differences in the collateralisation, accounting standards, provisioning
policies and types of exposures shows the distribution of coverage ratio through impairments and
collateral as a percentages of NPLs, by country.
Figure 19 shows the distribution of coverage ratio through impairments and collateral as a
percentages of NPLs, by country. Although when assessing collateral, valuation rules and
enforceability should also be considered, the data indicate a link between coverage ratios and
collateralisation16.
16 This link is reflected by the fact that for countries with rather low coverage ratios coll ateralisation is higher and vice versa

EBA REPORT ON NON-PERFORMING LOANS
30
Figure 19: NPL coverage ratio (%) through impairments and collateral by country — June 2019
Although coverage in the EU has only slightly increased in the past years (Figure 18), some countries
have shown a considerable change in provisions. In particular, countries with higher NPL ratios have
increased noticeably their coverage, e.g. Cyprus, Portugal, Italy, Hungary and Greece (Figure 20).
Figure 20: Coverage ratio (%), by country, and change in p.p. between June 2015 and June 201917
The differences across countries in coverage ratios can be mainly explained by differences in
exposures to specific segments. NPLs to large corporates, for example, attract a higher level of
17 Comparison for Estonia with March 2016, Iceland with December 2017 and Slovenia with September 2015

EBA REPORT ON NON-PERFORMING LOANS
31
provisioning than mortgages, which have higher collateral. Hence, a bank focused on business with
corporate clients is likely to report a higher coverage ratio than a bank with a strong focus on
mortgages. (Figure 21)
Figure 21: Trend in coverage ratios (%), by lending sub-segment — June 2015 to June 2019
Banks that consistently apply timely stringent provisioning policies are in a better position to
manage NPLs. This enables banks not only to strengthen their balance sheets but also to focus on
their core business. For this purpose, various European authorities, including the ECB and the
Commission have applied provisioning expectations and policies to enhance prudential treatment.
Text box: Provisioning policies
Various initiatives across EU institutions have
been introduced to increase banks’ prudential
provisioning against NPLs. The EBA has
strongly supported these initiatives and
believes that these initiatives will improve the
resilience of the EU banking sector by
preventing the excessive build-up of NPEs in
the future and the possible spillover effects
that these may have on economic growth and
financial stability.
18 https://www.bankingsupervision.europa.eu/ecb/pub/pdf/ssm.npl_addendum_201803.en.pdf
First, the ECB’s Banking Supervision (SSM)
published in March 2018 an addendum to the
ECB Guidance18 to banks on NPLs, indicating
quantitative expectations of prudential
provisioning. These quantitative expectations
target new NPEs classified as such from
1 April 2018, regardless of the date of the
loan origination. The implementation of these
expectations will be through the supervisory
dialogue (SREP process).

EBA REPORT ON NON-PERFORMING LOANS
32
In parallel, the European Commission
proposed an amendment to the CRR as
regards the minimum loss coverage for non-
performing exposures, and the ‘prudential
backstop’ was adopted by the Council of the
EU in April 201919. The requirement targets
new NPEs for loans that are originated and
become non-performing after the
implementation date of the regulation.
According to the new rules, institutions
should reach a minimum coverage level but,
if there is a shortfall, then the amount should
be deducted from institutions’ CET1 (Pillar 1
treatment).
In August 2019, the SSM revised its
supervisory expectations for prudential
provisioning20 in order to account for the new
Pillar 1 requirements and maintain the
treatment of NPEs more consistently. In this
regard, the scope of the ECB’s supervisory
expectations for new NPEs will be limited to
NPEs arising from loans originated before
26 April 2019, which are not subject to Pillar 1
NPE treatment. It is noted that NPEs arising
from loans originated from that date onwards
will be subject to Pillar 1 treatment.
Further to the above, the SSM has also
published in July 2018 a communication on
the supervisory approach to increasing
provisioning of the stock of NPLs21, based on
bank-specific expectations, which are guided
by banks’ current individual NPL ratios and
main financial features in a consistent way
across comparable banks. The policy aims to
achieve the same coverage of NPL stock and
flow over the medium term.
Table 1: shows the provisioning time frames
for loans originated after 26 April 2019 as set
out by Regulation (EU) 2019/630 amending
the CRR (Regulation (EU) No 575/2013)
Table 1: Provisioning calendar
After year of vintage
1 2 3 4 5 6 7 8 9
CRR
Secured by immovable
collateral
– – 25% 35% 55% 70% 80% 85% 100%
Secured by movable collateral
– – 25% 35% 55% 80% 100%
Unsecured – 35% 100%
19 https://data.consilium.europa.eu/doc/document/PE-2-2019-INIT/en/pdf 20 https://www.bankingsupervision.europa.eu/press/lett
erstobanks/shared/pdf/2019/ssm.supervisory_coverage_expectations_for_NPEs_201908.en.pdf
21 https://www.bankingsupervision.europa.eu/press/pr/date/2018/html/ssm.pr180711.en.html

EBA REPORT ON NON-PERFORMING LOANS
33
2.5 Texas ratio
The Texas ratio22 is one of the metrics for assessing the banks’ riskiness and robustness against the
legacy assets held on its balance sheet. In the last 4 years the aggregate EU-weighted average Texas
ratio has halved (from 47% to 23%), reconfirming the progress achieved in the recovery of the
banking sector. Strengthening of the banks’ capital base has also contributed to this. Nevertheless,
the Texas ratio should be read with caution, especially at aggregate levels, as it assumes that equity
and provisions accumulated (the denominator) compensate for weaker banks or countries.
The dispersion of the ratio has considerably narrowed since December 2014. The 95th percentile
stood at 92% as of June 2019, down from 145%. At the same time the upper interquartile range
(75th percentile) decreased from 83% to 39% (Figure 22).
Figure 22: Dispersion of Texas ratios (%) by bank, showing 5th and 95th percentiles, interquartile
ranges and medians — December 2014 to June 2019
On a bank-by-bank level, Figure 23 shows those banks that have increased their Texas ratio
between June 2015 and June 2019 (banks above the line). In fact, in the EBA sample, only a few
banks increased their Texas ratio. Nevertheless, there are still a few banks reporting a Texas ratio
higher than 100%, which reveals vulnerabilities.
22 Texas ratio is comparing the stock of NPLs with a credit institution ’s equity. NPLs (gross carrying amount) over equity and accumulated impairments accumulated negative changes in fair value due to credit risk a nd provisions on NPLs

EBA REPORT ON NON-PERFORMING LOANS
34
Figure 23: Texas ratio (%) by bank between June 2015 and June 2019

EBA REPORT ON NON-PERFORMING LOANS
35
3. An assessment of asset quality based on IFRS 9 stages
3.1 Distribution of loans by IFRS 9 stages
As of January 2018, IFRS 9 replaced the previous accounting standard for financial instruments
(IAS 39), changing, among other aspects, the approach that banks are required to follow in the
calculation of credit losses. With the new accounting standard, provisions need to be determined
based on an expected credit loss (ECL) model instead of an incurred loss model. The introduction
of IFRS 9 also requires banks to allocate financial instruments subject to ECL requirements in three
different stages (stages 1, 2 and 3), according to their credit risk level. Those financial assets that
have experienced a significant increase in credit risk are assigned to stage 2 and those that are
credit impaired are assigned to stage 3.
The latter is similar to the IAS 39 definition of impaired but is still different from the EBA’s NPL
definition, as the 90 days past-due criterion does not necessarily mean stage 3 classification. The
following section provides an overall view of the asset quality that complements the section on
NPLs with the forward-looking view provided by the expected credit loss model.
In June 2019, banks in the EU allocated on average 90.4% of the loans and advances recognised at
amortised cost in stage 1, 7% in stage 2 and 2.6% in stage 3. These allocations compare favourably
with those of 1 year earlier (88.2%, 7.7%, and 4%, respectively). These figures resemble, to a great
extent, the respective NPL ratios.
The share of stage 3 financial assets as of June 2019 was highest in Greece (41%) and Cyprus (31%),
followed by Portugal (9%). The share of stage 2 financial assets was highest for banks in Cyprus
(15%), followed by Greece and Romania (both 14%). On the contrary, Czechia and Sweden had the
highest share of loans and advances in stage 1 (both more than 95%), followed by Norway and
Germany (Figure 24).

EBA REPORT ON NON-PERFORMING LOANS
36
Figure 24: Distribution (%) of loans and advances recognised at amortised cost among stages 1, 2
and 3, by country — June 2019
From June 2018 to June 2019, only 2 countries (Estonia and Luxembourg) reported an increase in
the share of their stage 3 loans and advances, albeit very small, while the rest of the countries
managed to decrease the allocation of their stage 3 assets. The most significant improvement was
reported by banks in Cyprus, with a decrease in stage 3 assets of almost 13 p.p. (-4 p.p. in stage 2).
Although the majority of the countries managed to decrease their stage 2 share as well, a few
countries (Germany, Hungary and Bulgaria) reported an increased stage 2 share in the last year.
This is mainly explained by a decreasing stage 3 share but also in some cases by a decreasing stage 1
share. (Figure 25).

EBA REPORT ON NON-PERFORMING LOANS
37
Figure 25: Change in allocation of loans and advances recognised at amortised cost in stage 2 and
stage 3 (p.p.) between June 2018 and June 201923
Data at bank level show that as of June 2019 roughly 50% of the banks allocated at least 10% of
their assets either in stage 2 or stage 3 (Figure 26). This may reflect that there are possible
vulnerabilities in the asset quality of some banks’ balance sheets.
Figure 26: Distribution (%) of loans and advances among stages 1, 2 and 3, by bank — June 2019
The weighted average of the EU banking sector coverage in June 2019 stood at 46.3% for stage 3,
down from 47.5% in June 2018. Coverage for stage 2 (3.5%) and stage 1 (0.2%) assets remained
23 Relevant information with respect to LU for the purposes of this analysis are not available due to a substantial change in the sample of banks serving as a reference
EBA REPORT ON NON-PERFORMING LOANS
38
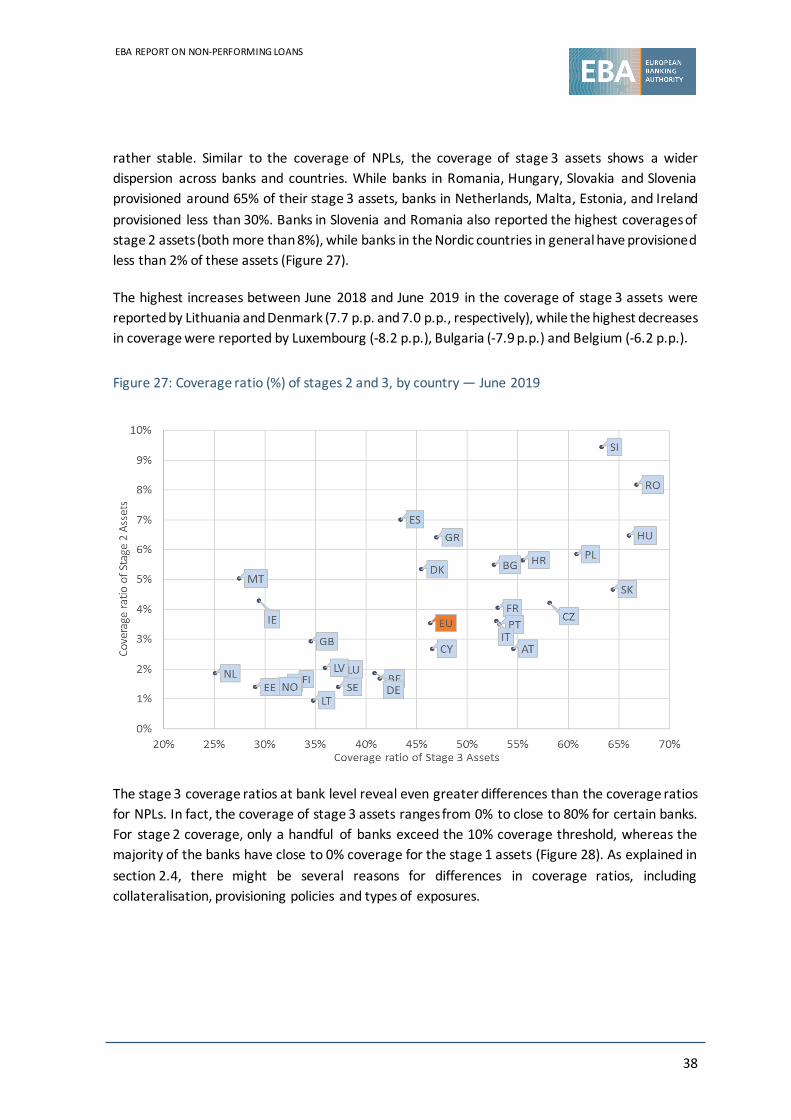
rather stable. Similar to the coverage of NPLs, the coverage of stage 3 assets shows a wider
dispersion across banks and countries. While banks in Romania, Hungary, Slovakia and Slovenia
provisioned around 65% of their stage 3 assets, banks in Netherlands, Malta, Estonia, and Ireland
provisioned less than 30%. Banks in Slovenia and Romania also reported the highest coverages of
stage 2 assets (both more than 8%), while banks in the Nordic countries in general have provisioned
less than 2% of these assets (Figure 27).
The highest increases between June 2018 and June 2019 in the coverage of stage 3 assets were
reported by Lithuania and Denmark (7.7 p.p. and 7.0 p.p., respectively), while the highest decreases
in coverage were reported by Luxembourg (-8.2 p.p.), Bulgaria (-7.9 p.p.) and Belgium (-6.2 p.p.).
Figure 27: Coverage ratio (%) of stages 2 and 3, by country — June 2019
The stage 3 coverage ratios at bank level reveal even greater differences than the coverage ratios
for NPLs. In fact, the coverage of stage 3 assets ranges from 0% to close to 80% for certain banks.
For stage 2 coverage, only a handful of banks exceed the 10% coverage threshold, whereas the
majority of the banks have close to 0% coverage for the stage 1 assets (Figure 28). As explained in
section 2.4, there might be several reasons for differences in coverage ratios, including
collateralisation, provisioning policies and types of exposures.

EBA REPORT ON NON-PERFORMING LOANS
39
Figure 28: Coverage of stages 1, 2 and 3 (%), by bank — June 2019
3.2 Off-balance-sheet exposures
In June 2019, around EUR 38 billion of the banks’ off-balance-sheet exposures in the EU banking
sector were classified as non-performing (0.6% of total off-balance-sheet exposures) and
EUR 36 billion were classified as stage 3 (0.5% of total off-balance-sheet exposures), both slightly
lower than 1 year earlier. The total off-balance-sheet exposures amounted to EUR 6.8 trillion, of
which more than 70% were loan commitments given (Figure 29).
Figure 29: Off-balance-sheet exposures (EUR trillion) and (%) NPL ratio and stage 3 items — June
2019
EBA REPORT ON NON-PERFORMING LOANS
40
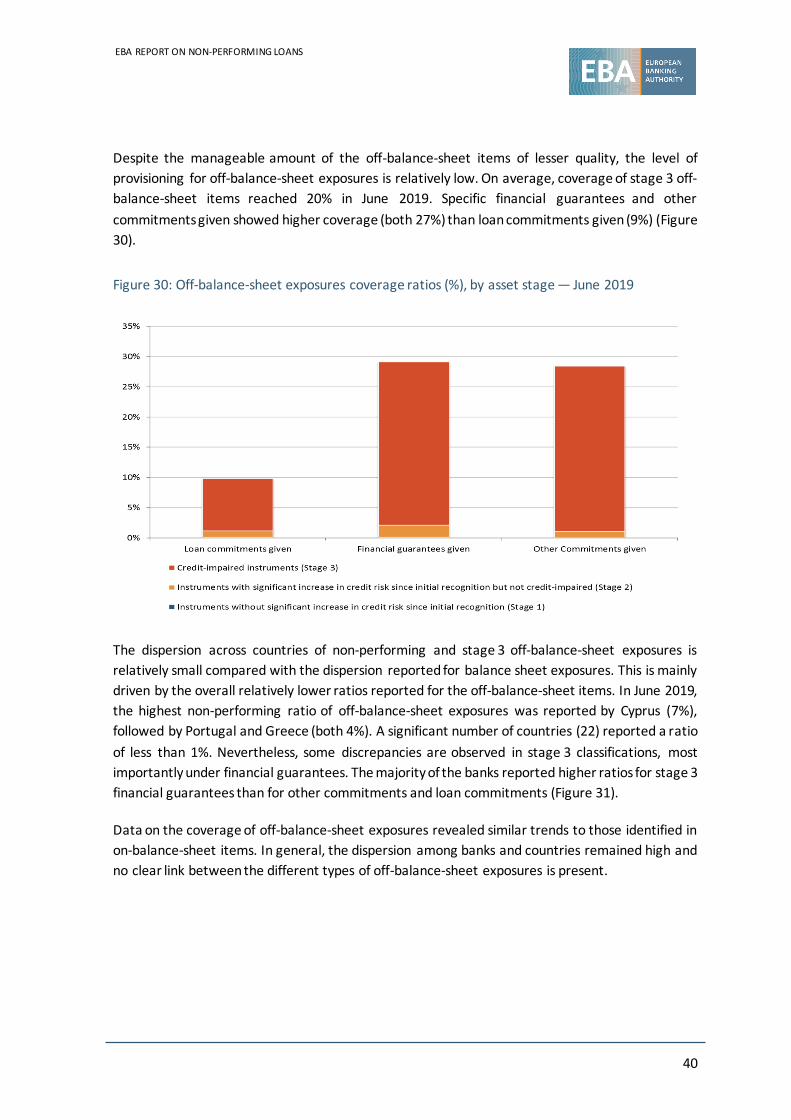
Despite the manageable amount of the off-balance-sheet items of lesser quality, the level of
provisioning for off-balance-sheet exposures is relatively low. On average, coverage of stage 3 off-
balance-sheet items reached 20% in June 2019. Specific financial guarantees and other
commitments given showed higher coverage (both 27%) than loan commitments given (9%) (Figure
30).
Figure 30: Off-balance-sheet exposures coverage ratios (%), by asset stage — June 2019
The dispersion across countries of non-performing and stage 3 off-balance-sheet exposures is
relatively small compared with the dispersion reported for balance sheet exposures. This is mainly
driven by the overall relatively lower ratios reported for the off-balance-sheet items. In June 2019,
the highest non-performing ratio of off-balance-sheet exposures was reported by Cyprus (7%),
followed by Portugal and Greece (both 4%). A significant number of countries (22) reported a ratio
of less than 1%. Nevertheless, some discrepancies are observed in stage 3 classifications, most
importantly under financial guarantees. The majority of the banks reported higher ratios for stage 3
financial guarantees than for other commitments and loan commitments (Figure 31).
Data on the coverage of off-balance-sheet exposures revealed similar trends to those identified in
on-balance-sheet items. In general, the dispersion among banks and countries remained high and
no clear link between the different types of off-balance-sheet exposures is present.

EBA REPORT ON NON-PERFORMING LOANS
41
Figure 31:Percentages of stage 3 and non-performing off-balance-sheet exposures of the total, by
countries and by category — June 2019

EBA REPORT ON NON-PERFORMING LOANS
42
4. Forbearance measures and early warning signals
4.1 Exposures with forbearance measures
Forbearance measures consist of concessions towards a debtor that is experiencing or about to
experience difficulties in meeting its financial commitments (‘financial difficulties’). Similarly to the
trend observed in NPL ratios, forbearance ratios of the EU banking sector have been decreasing
constantly since June 2015. The average forbearance loan ratio24 (FBL) of the sector, as of June
2019, stood at 1.9%, down from 3.7% in June 2015. The same trend also holds true for the
forbearance exposure ratio25 (FBE), which has reduced from 3.2% to 1.7% over the past 4 years
(Figure 32).
Figure 32: Trend in FBL and FBE ratios (%) in the EU banking sector — December 2014 to June
2019
A combination of performing FBLs26 (which might in general be considered more vulnerable assets
than performing loans) with NPLs provides a composite credit weakness indicator. Still, also on this
24 FBL ratio is calculated as follows: loans with forbearance measures (including both non-performing and performing) for loans and advances/total gross loans and advances.
25 Forbearance exposures include both loans and debt securities with forborne measures. 26 Performing forborne loans are loans that may have been non-performing loans that were applied forbearance measures in the past and are currently under probation as pe rforming forborne loans, or they have never been

EBA REPORT ON NON-PERFORMING LOANS
43
basis, the enhancement of asset quality is obvious, as it decreased from 7.5% in June 2015 to 3.7%
in June 2019 (Figure 33).
Figure 33: A composite credit weakness ratio of NPLs and performing forborne loans (%),
December 2014 to June 2019
The decrease in the FBL ratio was mainly due to the decrease in the forborne loans — from
EUR 700 billion in June 2015 to EUR 400 billion in June 2019 (or roughly -40%) — recording an
average decrease of -3% per quarter (Figure 34). At the same time, the total loans of the EU banking
sector, the denominator, increased by 10%.
considered as non-performing but required forbearance measures. These loans are in general considered more vulnerable than performing loans.

EBA REPORT ON NON-PERFORMING LOANS
44
Figure 34: Change in volume of quarterly forbearance loans (performing and non-performing) (%)
— December 2014 to June 2019
While the dispersion of FBL ratios is narrower than that of NPL ratios, it is still wide, ranging from
23% in Greece to close to 0% (Luxembourg). In fact, Greece’s FBL ratio has increased by around
7 p.p. in the last 4 years (also driven by the deleveraging of the banking sector), and Norway
reported a slightly higher FBL ratio in June 2019 compared with 4 years earlier. On the other hand,
the highest decreases in the FBL ratio were reported by Cyprus and Ireland (both -11 p.p.), followed
by Slovenia27 (-10 p.p.) (Figure 35).
27 Comparison for Slovenia between September 2015 and June 2019.

EBA REPORT ON NON-PERFORMING LOANS
45
Figure 35: FBL ratio (%), by country, in June 2019 and change since June 2015 (p.p.)28
Loans extended by EU banks to NFCs have a considerably higher forbearance ratio than other loans.
In June 2019, around 40% of the total loans with forbearance measures were extended to
households and 57% to NFCs. The FBL ratio as of June 2019 for NFCs stood at 3.5% and for
households at 2%, marking a downwards trend in the ratios during the past 4 years (Figure 36).
28 Comparison for Estonia with March 2016, Iceland with December 2017 and Slovenia with September 2015

EBA REPORT ON NON-PERFORMING LOANS
46
Figure 36: FBL ratios (%), by lending segment — June 2015 to June 2019
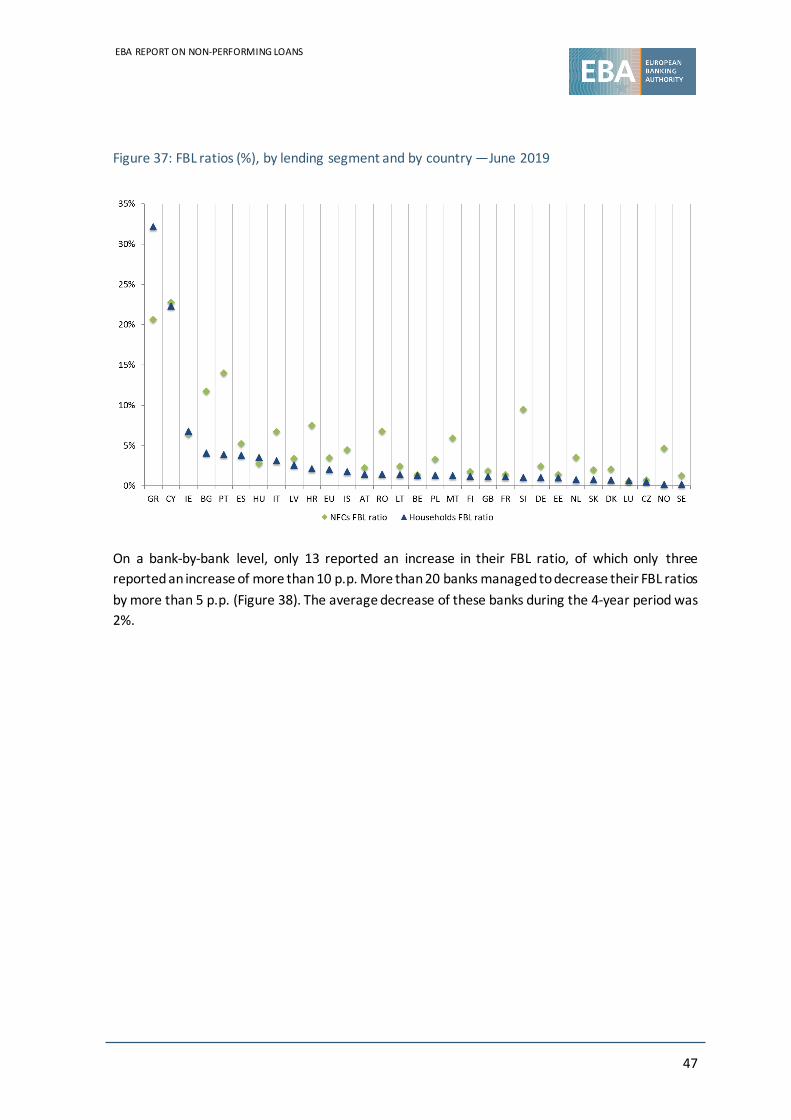
The highest FBL ratios for NFCs in June 2019 were reported by banks in Cyprus (23%) and Greece
(21%), followed by Portugal (14%). In total, banks in five countries reported double-digit FBL ratios
for NFCs. Banks in Greece reported the highest FBL ratio for households (32%), followed by Cyprus
(22%), while banks in all other countries reported ratios of less than 7% (Figure 37).
EBA REPORT ON NON-PERFORMING LOANS
47
Figure 37: FBL ratios (%), by lending segment and by country —June 2019
On a bank-by-bank level, only 13 reported an increase in their FBL ratio, of which only three
reported an increase of more than 10 p.p. More than 20 banks managed to decrease their FBL ratios
by more than 5 p.p. (Figure 38). The average decrease of these banks during the 4-year period was
2%.

EBA REPORT ON NON-PERFORMING LOANS
48
Figure 38: Distribution (%) of banks’ FBL ratios in June 2015 and June 2019
4.2 Forbearance measures used by the banks
63% of the total loans with forbearance measures (EUR 253 billion in June 2019) were NPLs. This
share has been slightly increasing over the past 4 years (59% in June 2015). In fact, performing
exposures with forbearance measures have decreased by 46% in this period, whereas non-
performing exposures were down by just 36% (Figure 34). Nevertheless, supervisory data do not
show the vintage of these assets nor do they clarify which parts of the NPLs with forbearance
measures are due to re-defaults. Anecdotal evidence shows that the majority of re-defaults usually
takes place in either the second or third quarters after the restructuring of the loan.
In June 2019, only Finland, Norway and Iceland reported less than 50% of their total loans with
forbearance measures as being NPLs (Figure 39). In contrast, Malta, Hungary and Romania reported
the highest ratios of NPLs with forbearance measures to total loans with forbearance measures (all
more than 80%), followed by Croatia and Portugal.

EBA REPORT ON NON-PERFORMING LOANS
49
Figure 39: Distribution (%) of forborne exposures classified as NPLs and forborne exposures
classified as performing, by country — June 2019
Banks prefer to modify the loan’s terms and conditions (restructuring) when granting forbearance
measures rather than refinancing29 a bad loan, which is less applied, according to the supervisory
data, revealing a reluctance to extend new contracts to counterparties with NPLs. On aggregate EU
level, 75% of the loans with forbearance measures used instruments with modification in their
terms and conditions, whereas only 25% were refinanced.
One would expect some differentiation between NFCs and households (i.e. banks would stand
ready to provide refinancing to troubled NFCs as part of restructuring solutions — which might also
involve a debt-to-asset/equity swap), but the data do not point in that direction.
Banks in Croatia, Spain, Cyprus and Norway use extensive refinancing as a means of forbearance
measure. Banks in Greece, which reported the highest FBL ratios, are among those that use
refinancing the least (7%) (Figure 40).
29 A total or partial refinancing refers to the process of taking out a new loan to pay off one or more outstanding loans.

EBA REPORT ON NON-PERFORMING LOANS
50
Figure 40: Ratio of FBLs with modifications in their terms and conditions (%) — June 2019
4.3 Early warning signals
This section takes a closer look at the last few quarters to assess whether there were warning
signals on the asset quality. This section is based on IFRS 9 data that have only been available since
March 2018. In order to assess early warning signals the section looks into the percentage of
performing past-due loans and the movements towards a stage of lesser quality (e.g. from stage 1
to stage 2 or 3). It is noted that data used for the following analysis are only on financial assets
subject to impairment that are past due. Therefore, countries that may have a very low percentage
of past-due assets in their total assets might appear with a high percentage of performing past-due
loans. It is therefore important that the following analysis is read in conjunction with the analysis
of the relative NPL ratios and the volume of NPLs of each country.
Performing past-due loans
The improvement between June 2018 and June 2019 in the asset quality outlook as suggested by
the decreasing allocation of financial assets under stage 3 (see section 3.1) is also seen in the total
carrying amount (net of provisions) of past-due loans in the EU. Specifically, as of June 2019 the
total past-due loans (net of provisions) stood at EUR 512 billion, down from EUR 759 billion in
March 2018 (-33%). With a decreasing amount of past-due loans, the improvement in asset quality
outlook is also confirmed by the slight reduction in the percentage of those assets that are:
a) more than 30 days past due and are classified as stage 1;
b) 90 days past due and classified as stage 1 or stage 2.
The share of loans that are 30 days or more past due and classified as stage 1 has decreased from
7.9% in March 2018 to 6.7% in June 2019. Similarly, the share of stage 1 or stage 2 assets that are

EBA REPORT ON NON-PERFORMING LOANS
51
past due by more than 90 days has gradually decreased from 5.5% in March 2018 to 3.9% in June
this year (Figure 41).
Figure 41: Total past-due loans at carrying amount, average trend in share of > 30 days past-due
instruments classified as stage 1 and > 90 days past-due instruments classified either as stage 1 or
stage 2 (%) — March 2018 to June 2019
These assets have an increased probability of turning into non-performing (or stage 3), as they are
already in a delinquent state, but banks do not deem them as impaired and still classify them as
stage 1 or stage 2. This also implies that banks reporting a smaller share in these two categories,
i.e. reporting a higher share of stage 3 assets, might follow a more conservative approach.
On a country-by-country basis, five countries have more than 10% of their loans past due for more
than 30 days still classified as stage 1. Luxembourg reports the highest percentage of loans that are
past due > 30 days and are classified as stage 1 (27%), followed by France (16%) and Finland (13%).
Italy has the highest share of instruments that are past due > 90 days and not classified as stage 3
(10%), followed by Denmark and Luxembourg (both 7%). Notably, a few countries, including
Greece, Malta, Hungary and Norway, report nearly 0% of delinquent assets under stage 1 or
stage 2, revealing perhaps a more conservative approach in their expected loss estimations. It
should also be noted that these figures show considerable variation over quarters (Figure 42).

EBA REPORT ON NON-PERFORMING LOANS
52
Figure 42: Share of more than 30 days past-due instruments classified as stage 1 and more than
90 days past-due instruments classified either as stage 1 or stage 2 (%) — June 2019
Deterioration rate and movements to stage 3
The deterioration rate — defined as the movement of an asset to a higher credit risk bucket (e.g.
from stage 1 to stage 2 or from stage 2 to stage 3) — at aggregate EU level was just less than 2%
during the second quarter of 2019, which was stable compared with the same quarter last year.
Nevertheless, this ratio is seasonal, as the majority of EU countries show an increased deterioration
rate in the last quarter of the year (Figure 43).
In June 2019, the highest deterioration rates were reported by Malta, Iceland, Denmark, Cyprus
and Estonia, which saw at least 2% of their assets migrating to a stage of higher credit risk. In fact,
Malta also had the highest increase in p.p. compared with the same quarter of last year (2.7 p.p.),
followed by Finland (1.6 p.p.) and Luxembourg (1 p.p.) (Figure 43).

EBA REPORT ON NON-PERFORMING LOANS
53
Figure 43: Deterioration rate (%) by country — June 2018 and June 2019
In the EU, 0.3% of assets moved to stage 3 from stage 1 or stage 2 in the last quarter, remaining
stable compared with a year earlier. Greece stood out from other countries with a movement to
stage 3 rate of 1.5% (just slightly higher than in June 2018). It was followed by Cyprus (1%) and
Hungary (0.8%). At the lower end, Sweden, Malta, Czechia and Germany reported movements to
stage 3 rates of just over 0.1% (Figure 44).
Figure 44: Movements to stage 3 rate (%), by country — June 2018 and June 2019
Text box: EBA Guidelines on loan origination and monitoring
In June 2019, the EBA published the
consultation paper on Guidelines on loan
origination and monitoring 30 . Within the
30 EBA/CP/2019/04 (EBA Guidelines on Loan Origination and Monitoring)
overall objective to tackle NPLs in Europe, the
objective of these guidelines is to ensure that
banks have robust and prudent standards for

EBA REPORT ON NON-PERFORMING LOANS
54
credit risk taking, management and
monitoring and that newly originated
(performing) loans are of high quality.
The guidelines cover a broad range of topics
including banks’ internal governance and
control framework; policies and procedures
for credit granting; loan origination, including
borrower’s creditworthiness assessment; risk-
based pricing; collateral valuation; and the
ongoing monitoring of loans and credit
review of the borrowers.
As part of the loan origination requirements,
the guidelines define the type and extent of
information that banks should collect for the
purpose of assessing borrower’s
creditworthiness and sets the requirements
for the assessment of the borrowers’
creditworthiness for various types of lending.
The EBA plans to publish the final guidelines
in the first half of 2020.

EBA REPORT ON NON-PERFORMING LOANS
55
5. Outlook and policy actions
5.1 Views of the banks on impediments to resolving NPLs
Figure 45 shows that around 60% of the banks participating in the risk assessment questionnaires
run by the EBA identify the lengthy and expensive judiciary process in cases of insolvency and
collateral enforcement as the main impediment to resolve NPLs. The lack of market for NPLs comes
second, but it has decreased significantly compared with 2 years ago, due to the establishment of
expert servicers in all regions and to increased investor appetite. Other reasons, such as tax
disincentives to provision and write off NPLs and the lack of out-of-court settlements of minor
claims score lower.
Figure 45: Trend in impediments to resolving NPLs (%) — banks’ RAQs, autumn 2019
The view that an inefficient legal framework is the main impediment to resolving NPLs is most
pronounced in banks from countries with an NPL ratio above the EU-weighted average (Figure 46).
In particular, almost all banks from high NPL countries participating in the survey cite the judiciary
process as the main impediment to resolving NPLs. A similar difference between countries with a
high NPL ratio and those with a low NPL ratio is seen for the lack of out-of-court tools for settlement
of minor claims (40% and 20%, respectively) and the tax incentives to provision and write off NPLs
(25% and 15%, respectively).
Of specific importance is the fact that banks from countries that have an NPL ratio below the EU
average rank as second the lack of a market for NPLs/collaterals; this indicates that NPL investors
focus on the regions with high NPL ratios that could translate into lower valuations and increased
returns.

EBA REPORT ON NON-PERFORMING LOANS
56
Figure 46: Impediments to resolving NPLs (%) — banks’ RAQ, spring 2019
Of those banks identifying the inefficiency of the legal framework and judiciary processes as the
main impediment to resolving NPLs (60% in the RAQ in autumn 2019, which is similar to previous
questionnaires), at least 75% believe that this is due to the lengthy duration of the process and 40%
that the inefficiency is caused by the complexity of the process (Figure 47).
Figure 47: Reasons identified for the inefficiency of the legal framework and judiciary processes to
resolve insolvency and enforce collateral (%) — banks’ RAQ, autumn 2019
Differences in the strategies pursued to reduce NPLs are less evident among the two groups of
countries. Not surprisingly, countries with higher NPL ratios have active NPL portfolio sales high on
their agenda (75%), followed by their hold and forbearance strategies (70%) (Figure 48). This of

EBA REPORT ON NON-PERFORMING LOANS
57
course also reflects both the investors’ appetite for these portfolios and the supervisory pressure
to reduce legacy assets within set timeframes. Conversely, banks with lower NPL ratios do not have
a priority to sell NPL portfolios and they are seeking to cure NPLs either through internal work-out
strategies or through legal proceedings. This also reflects the ability and flexibility of these banks,
due to their lower NPL ratios, to wait and hold on to their non-performing assets.
Figure 48: Most commonly applied strategies for NPL reduction (%) — banks’ RAQ, spring 2019
5.2 Country-specific policy actions
As discussed, authorities still consider NPLs as a high priority, and in a number of countries there
are ongoing initiatives to assist the final clean-up of legacy assets. For example, in order to further
boost the NPL reduction process, Greek authorities are seeking to introduce a systemic solution to
tackle NPLs. In this regard, the Bank of Greece has proposed a scheme that would allow banks to
transfer a significant part of NPLs along with part of the deferred tax credits (DTCs), which are
booked on bank balance sheets, to a special purpose vehicle (SPV). The proposal suggests that
banks would be able to absorb the loss through the transfer at ‘near-market prices’ without
triggering a DTC-related rights issue that would dilute existing shareholders’ positions.
In parallel, the Hellenic Financial Stability Fund, which holds stakes in Greek banks, has proposed
the set-up of an asset protection scheme called ‘Hercules’, similar to the Italian GACS scheme. This
is a crucial measure that may facilitate the de-risking process, as it could cover NPLs in excess of
EUR 20 billion (25% of the stock). The proposal was approved by the European Commission in
October 2019, as it has deemed that the Greek state will be remunerated in line with market
conditions for the risk it will assume by granting a guarantee on securitised NPLs. This, according to
the European Commission, does not involve state aid within the meaning of the EU rules.
In Cyprus, the government has introduced in 2019 the ‘Estia’ scheme, a special government scheme
that aims, first, to protect the primary residency of vulnerable borrowers and, second, to mitigate

EBA REPORT ON NON-PERFORMING LOANS
58
the issue of NPLs in the Cypriot banking system. According to reports, a similar initiative is being
discussed by the Greek authorities.
Other national initiatives that aim to tackle NPLs swiftly are the coordination platforms established
in Portugal and in Greece. In Portugal the coordination platform aims to integrate negotiations with
the debtor on behalf of multiple creditors. The objective is to support the turnaround of viable
debtors and the maximum recovery of NPLs. There is a similar initiative in Greece, where banks
have formed a committee to discuss common exposures to large corporates. These relate to around
100 counterparties with exposures larger than EUR 30 million and a total of EUR 8 billion of NPEs.
In parallel, Greek banks agreed to transfer to an SPV of around EUR 2 billion SME loans of multibank
exposures. The servicing of these loans is performed by an independent third party servicer without
the interaction of any bank. This is considered a breakthrough initiative for Greek banks, and the
efficiency of the project will be monitored in order to expand the perimeter to another EUR 2-
4 billion.
5.3 Ongoing work of the EBA and other EU institutions
NPL transaction platforms
As part of the Council of the EU ‘s action plan on tackling NPLs, the EBA contributed to the joint
work of the European Commission, the EBA and the ECB on promoting secondary markets for the
resolution of NPLs and establishing a European platform to facilitate NPL sales by banks. The vision
and operational proposal for such a platform is an electronic market place where sellers and
professional buyers can exchange information and transact loans and was published as a
Commission staff working document in November 201831.
The proposal centred on the private sector-led initiative of organising existing (or new) transaction
platforms under the umbrella of a ‘standard-setting body’, setting out standards for the governance
and operational requirements for the platforms, data sharing and legal documentation, where
relevant. Such a standard-setting body could also act as an overseeing body, issuing a ‘seal of
quality’ to the participating platforms and performing the oversight of the ongoing adherence to
the set standards and requirements.
To achieve the objectives of boosting the secondary markets for NPLs and maximising economic
benefits, the NPL platform would need to be open to all types of loans and sellers and professional
buyers, and its geographical scope of operation should be wide, preferably European Union wide.
Furthermore, the platform would take further the EBA work on NPL templates and help to improve
NPL data quality and data standardisation, as well as defining standards for data validation that
would be performed by banks. In this way it might improve transparency between willing buyers
and sellers of NPL portfolios. Moreover, as an electronic market place, it could facilitate
transactions by offering a price discovery mechanism for participants to use and by intermediating
31 https://eur-lex.europa.eu/legal-content/EN/TXT/?uri=CELEX:52018SC0472

EBA REPORT ON NON-PERFORMING LOANS
59
between investors and third-party service providers such as appraisers, loan servicers and
transaction advisers.
Since the publication of the Commission staff working paper, the Commission, the EBA and the ECB
have been engaging with the industry stakeholders to take the initiative forward.
Enhancements in capacities for risk analysis and monitoring
As discussed in the report, there are still limitations in the risk analysis that one can perform based
on the data available form institutions. This will be alleviated to some extent by (1) enhanced NPE
and FBE disclosure requirements stemming from the implementation of the EBA Guidelines on
disclosure of NPE and FBE32, and (2) the amendments to the ITS on supervisory reporting with
regard to FINREP.
New guidelines on NPE and FBE disclosure aim at increasing overall the level of information banks
should provide regarding their NPE and FBE and set enhanced disclosure requirements and uniform
disclosure formats regarding NPEs, forborne exposures and foreclosed assets. The guidelines also
require more detailed disclosure and breakdowns of information from the institutions with
elevated levels of NPL ratios.
The amendments to FINREP aim to improve the reporting requirements on NPEs and forbearance
in order to strengthen supervisors’ abilities to assess and monitor banks’ strategies for managing
these exposures. The first reporting reference date will be 30 June 2020.
The amended reporting requirements cover new information on CRE exposures as well as on
exposures secured by immovable property by level of collateralisation; enhanced and new
information on performing exposures, NPEs and forbearance towards selected counterparty types
(SMEs, households); additional information on inflows and outflows of NPLs and enhanced
information on collateral and guarantees received.
In addition, to ensure proportionality, banks that are ‘not small and non-complex’ and have a gross
NPL ratio equal to or greater than 5% shall report further details to provide deeper insights into
banks’ NPEs portfolios and NPEs management strategies. In particular, they shall report additional
breakdowns and more granular information on loans and advances; information on the drivers for
inflows and outflows of NPLs, impairments and write-offs; information on inflows and outflows of
collateral obtained by taking possession; and more granular information on the forbearance
management and the quality of forbearance.
Work on call for advice to the EBA for the purposes of a benchmarking of national loan enforcement frameworks from a bank creditor perspective
Further to the above, there is ongoing work at the EBA as part of the Council of the EU’s action plan
on insolvency benchmarking, based on the call for advice to the EBA33. The purpose of the exercise
32 EBA/GL/2018/10 https://eba.europa.eu/regulation-and-policy/transparency-and-pillar-3/guidelines-on-disclosure-of-non-performing-and-forborne-exposures 33 https://eba.europa.eu/sites/default/documents/files/documents/10180/2556373/1593a7ff-69e1-487f-9e8f-adbfe294a496/CfA%20EBA%20ins%20bmkg%20draft%207424809.pdf

EBA REPORT ON NON-PERFORMING LOANS
60
is to understand the efficiency of country-level loan enforcement procedures in terms of recovery
rates and times to recovery. The data should give insights into the formal enforcement procedures,
both by creditors individually and in the context of collective proceedings in insolvency. As part of
this exercise, the EBA will provide the EU with portfolio-specific, country-by-country benchmarks
of national loan enforcement regimes (including insolvency), based on loan-by-loan data for loans
that have entered an enforcement process. In addition, the EBA will try to identify the most
important factors of the national loan enforcement regimes that may explain the differences in
recovery outcomes.
EBA Opinion on securitisation framework
In October 2019, the EBA has published an opinion on the regulatory treatment of securitisations
of NPE34. The purpose of this opinion is to examine the role of securitisations as a funding tool for
NPE disposal and to outline the specific constraints on this role arising from the securitisation
regulatory framework in EU law, which were not addressed by the NPE action plan-related
legislation. The opinion recommends various amendments to the Capital Requirements Regulation
(CRR) as well as to the Securitisation Regulation to remove the identified constraints.
5.4 Conclusion
The de-risking of the banking sector has been a high political and supervisory priority also because
some views deem it to be a prerequisite to the introduction of the EDIS in order to complete the
European banking union. Data confirm the remarkable improvement in the asset quality over the
past few years. Banks’ determination to proceed with the clean-up of their balance sheets has been
critical in this effort. It is important to stress that vulnerabilities in the asset quality are still present,
especially in the view of a weakening macroenvironment and the persistently low profitability of
the sector, which may limit the capacity of the banks to finally put behind them their legacy assets.
This is also important, as the unaddressed stock of NPLs is now getting older and it may be more
difficult to resolve.
Although this report has mainly looked at the long-term trend, recent quarters’ data suggest that
the pace of reduction in the NPLs has been slowing down in the past few quarters. The report has
identified a number of reasons for this, with the most important being the fact that older legacy
assets may be more difficult to resolve, also given the inefficiency of the legal framework and
judicial processes of some European countries. In addition to this, a large part of the legacy assets
are mortgage loans that banks tackle with caution due to social aspects. Therefore, additional effort
is still needed to further reduce the NPLs in line with pre-crisis levels.
It is therefore important that banks remain vigilant in their assessment of the asset quality, continue
to monitor closely the developments of their portfolios’ asset quality, and to apply in good time
and effectively their NPL reduction strategy once it is deemed necessary.
34 https://eba.europa.eu/eba-publishes-opinion-regulatory-treatment-non-performing-exposure-securitisations

EBA REPORT ON NON-PERFORMING LOANS
61
Annex 1 — NPL ratios by country

EBA REPORT ON NON-PERFORMING LOANS
62
Annex 2 — NPLs and total loans by country

EBA REPORT ON NON-PERFORMING LOANS
63
Annex 3 — Coverage ratios by country

EBA REPORT ON NON-PERFORMING LOANS
64
Annex 4 — NPLs by country and past due category

EBA REPORT ON NON-PERFORMING LOANS
65
Annex 5 — FBL ratios by country

EBA REPORT ON NON-PERFORMING LOANS
66
Annex 6 — NPL and FBL ratios, by segment and by country

EUROPEAN BANKING AUTHORITY
20 avenue André Prothin CS 30154 92927 Paris La Défense CEDEX, France
Tel. +33 1 86 52 70 00 E-mail: [email protected]
https://eba.europa.eu/


