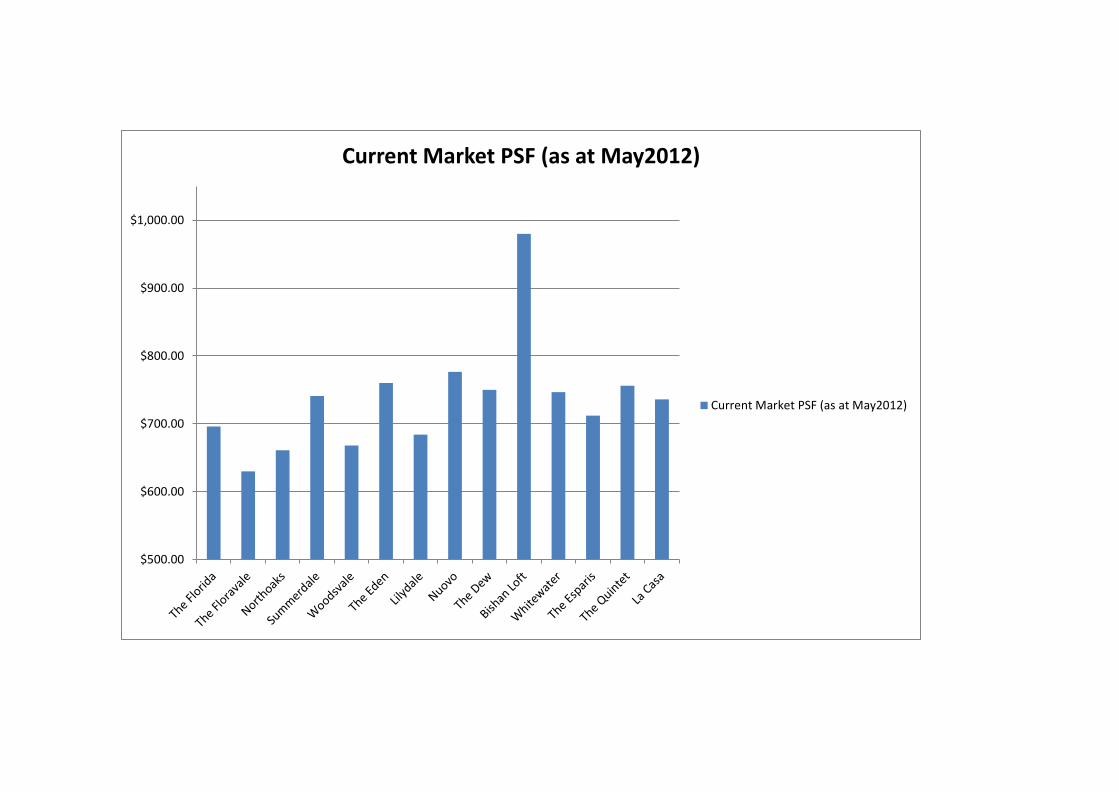
TOP Executive CondoCurrent Market PSF
(as at May2012)
Appreciation
PercentileEst. Launch PSF
Age of EC
(yrs)
2001 The Florida $696.00 93.82% $359.10 11.38
2001 The Floravale $630.00 67.44% $376.26 11.38
2001 Northoaks $661.00 66.93% $395.98 11.38
2001 Summerdale $741.00 100.48% $369.61 11.38
2001 Woodsvale $668.00 70.35% $392.13 11.38
2003 The Eden $760.00 81.01% $419.87 9.38
2003 Lilydale $684.00 76.07% $388.48 9.38
2004 Nuovo $776.60 89.28% $410.30 8.38
2004 The Dew $750.00 88.05% $398.84 8.38
2004 Bishan Loft $980.00 112.15% $461.94 8.38
2005 Whitewater $746.60 92.02% $388.80 7.38
2005 The Esparis $712.00 80.25% $395.01 7.38
2006 The Quintet $756.00 98.92% $380.05 6.38
2008 La Casa $736.00 79.59% $409.83 4.38
0.00%
20.00%
40.00%
60.00%
80.00%
100.00%
120.00%
The
Flo
rid
a
The
Flo
rava
le
No
rth
oak
s
Sum
me
rdal
e
Wo
od
sval
e
The
Ed
en
Lily
dal
e
Nu
ovo
The
Dew
Bis
han
Lo
ft
Wh
itew
ater
The
Esp
aris
The
Qu
inte
t
La C
asa
2001 2001 2001 2001 2001 2003 2003 2004 2004 2004 2005 2005 2006 2008
Executive Condominium Appreciation Chart
Appreciation Percentile
Land successfully
awarded for EC
Tender Price Land Area (sq m) PPR / SQ. FT. Est. Launch
Price
Average
PSF
Low Median High
Woodlands Avenue
5/ Woodlands Drive
16
$247,000,000.00 25800 $317.64 $717.64 $1,089.20 $1,225.35 $1,361.50
Fernvale Lane $245,000,000.00 21999.9 $295.59 $695.59 $1,055.74 $1,187.70 $1,319.67
Punggol Central/
Edgefield Plains
$136,700,000.00 13241.8 $319.68 $719.68 $1,092.30 $1,228.83 $1,365.37
Upper Serangoon
View/ Upper
Serangoon Road
$141,480,000.00 12392.2 $303.04 $703.04 $1,067.04 $1,200.41 $1,333.79
OneCanberra $213,780,000.00 27153.5 $292.56 $692.56 $1,051.14 $1,182.53 $1,313.92
Watercolours $122,200,000.00 18576.1 $291.02 $720.00 $1,092.78 $1,229.38 $1,365.97
Twin Waterfalls $219,468,000.00 25164.2 $270.08 $720.08 $1,092.89 $1,229.51 $1,366.12
The Tampines
Trilliant
$278,800,000.00 22000 $392.43 $762.43 $1,157.18 $1,301.83 $1,446.48
The Rainforest $170,100,000.00 17589.8 $320.85 $720.85 $1,094.07 $1,230.83 $1,367.59
Blossom Residences
$181,990,000.00 20834.1 $270.50 $700.50 $1,063.19 $1,196.08 $1,328.98
Arc @Tampines $187,590,000.00 20600 $302.14 $707.14 $1,073.26 $1,207.41 $1,341.57Belysa $89,888,000.00 15142.2 $262.61 $687.61 $1,043.62 $1,174.07 $1,304.52
Based on Average Percentile
Projection (5yrs to 10yrs)
$500.00
$600.00
$700.00
$800.00
$900.00
$1,000.00
Current Market PSF (as at May2012)
Current Market PSF (as at May2012)


![K EC, KVKE EC, TFSR EC, TFSK EC, KVO EC, KD EC ec, kvke ec, tfsr ec, tfsk ec, kvo ec, kd ec ... sk si gb fr ... 1=min 5 (10,0v) 0 0.5 1 1.5 2 0 200 400 600 [m/s] [pa]](https://static.documents.pub/doc/80x56/5ad4f62a7f8b9a571e8ce97b/k-ec-kvke-ec-tfsr-ec-tfsk-ec-kvo-ec-kd-ec-ec-kvke-ec-tfsr-ec-tfsk-ec-kvo.jpg)


