39
| Date post: | 08-Apr-2018 |
| Category: |
Documents |
| Upload: | seana-geddes |
| View: | 219 times |
| Download: | 0 times |
8/7/2019 EC10E_Basic_Economic_Tools_and_Principles_revised Lecture Notes 1
http://slidepdf.com/reader/full/ec10ebasiceconomictoolsandprinciplesrevised-lecture-notes-1 1/39

8/7/2019 EC10E_Basic_Economic_Tools_and_Principles_revised Lecture Notes 1
http://slidepdf.com/reader/full/ec10ebasiceconomictoolsandprinciplesrevised-lecture-notes-1 2/39
y What is Economics?

8/7/2019 EC10E_Basic_Economic_Tools_and_Principles_revised Lecture Notes 1
http://slidepdf.com/reader/full/ec10ebasiceconomictoolsandprinciplesrevised-lecture-notes-1 3/39
y Economics is the study of decision making in the faceof scarce resources
y Important point resources are scarce
y This implies that individuals and societies mustchoose

8/7/2019 EC10E_Basic_Economic_Tools_and_Principles_revised Lecture Notes 1
http://slidepdf.com/reader/full/ec10ebasiceconomictoolsandprinciplesrevised-lecture-notes-1 4/39
y Micro individual units, eg. households andfirms
y Macro economy as a whole national
economiesy Macro is based on micro

8/7/2019 EC10E_Basic_Economic_Tools_and_Principles_revised Lecture Notes 1
http://slidepdf.com/reader/full/ec10ebasiceconomictoolsandprinciplesrevised-lecture-notes-1 5/39
y Positive = what is or will be = objective
y Normative = what should be = subjective
8/7/2019 EC10E_Basic_Economic_Tools_and_Principles_revised Lecture Notes 1
http://slidepdf.com/reader/full/ec10ebasiceconomictoolsandprinciplesrevised-lecture-notes-1 6/39
y A n economic theory is a set of ideas about theeconomy that has been organized in a logicalframework egs. the theory of the firm, the law of
demandy A n economic model is a mathematical representation,
based on economic theory, of a firm, a market or someother entity

8/7/2019 EC10E_Basic_Economic_Tools_and_Principles_revised Lecture Notes 1
http://slidepdf.com/reader/full/ec10ebasiceconomictoolsandprinciplesrevised-lecture-notes-1 7/39
y A simplification is a representation of a problem in aform that is more easily understood without loss of information
yA bstraction involves ignoring non-vital details in orderto focus on the most important aspects of a problem

8/7/2019 EC10E_Basic_Economic_Tools_and_Principles_revised Lecture Notes 1
http://slidepdf.com/reader/full/ec10ebasiceconomictoolsandprinciplesrevised-lecture-notes-1 8/39
y Ceteris Paribus with other things the same
y A llows us to analyze the relationship between twovariables

8/7/2019 EC10E_Basic_Economic_Tools_and_Principles_revised Lecture Notes 1
http://slidepdf.com/reader/full/ec10ebasiceconomictoolsandprinciplesrevised-lecture-notes-1 9/39
y A graph typically illustrates the relationship betweentwo variables
y General formula for the equation of a straight line:
y Where y = variable on the vertical axis
x = variable on the horizontal axis
m = slope
c = y-intercept
cmxy !

8/7/2019 EC10E_Basic_Economic_Tools_and_Principles_revised Lecture Notes 1
http://slidepdf.com/reader/full/ec10ebasiceconomictoolsandprinciplesrevised-lecture-notes-1 10/39
y P = 4 2Q
y Two points (Q1,P1) and (Q2,P2)
y I choose (0,4) and (2,0)
8/7/2019 EC10E_Basic_Economic_Tools_and_Principles_revised Lecture Notes 1
http://slidepdf.com/reader/full/ec10ebasiceconomictoolsandprinciplesrevised-lecture-notes-1 11/39
y Two Common Fallacies:
1. Post-Hoc Fallacy after this thereforebecause of this
2. Fallacy of Composition what is true forpart is true for the whole

8/7/2019 EC10E_Basic_Economic_Tools_and_Principles_revised Lecture Notes 1
http://slidepdf.com/reader/full/ec10ebasiceconomictoolsandprinciplesrevised-lecture-notes-1 12/39
y Scarcity the problem of infinite human needs andwants in a world of finite resources
y Therefore choices have to be made
y This leads us to the concept of opportunity cost

8/7/2019 EC10E_Basic_Economic_Tools_and_Principles_revised Lecture Notes 1
http://slidepdf.com/reader/full/ec10ebasiceconomictoolsandprinciplesrevised-lecture-notes-1 13/39
y Opportunity cost is the value of the next bestalternative that the decision maker is forced to forgo
y If resources are fixed, in order to produce more of one
good a country must produce less of something else

8/7/2019 EC10E_Basic_Economic_Tools_and_Principles_revised Lecture Notes 1
http://slidepdf.com/reader/full/ec10ebasiceconomictoolsandprinciplesrevised-lecture-notes-1 14/39

8/7/2019 EC10E_Basic_Economic_Tools_and_Principles_revised Lecture Notes 1
http://slidepdf.com/reader/full/ec10ebasiceconomictoolsandprinciplesrevised-lecture-notes-1 15/39
y It is impossible to make anyone better off withoutmaking someone worse off
y It is impossible to produce more output without using
more inputy Production occurs at the lowest possible per unit cost

8/7/2019 EC10E_Basic_Economic_Tools_and_Principles_revised Lecture Notes 1
http://slidepdf.com/reader/full/ec10ebasiceconomictoolsandprinciplesrevised-lecture-notes-1 16/39
y Productive efficiency the economy is using all itsresources and technology to produce the maximumamount of output
y
The PPF shows the maximum amount of a good thatcan be produced for any given amount of another goodgiven the economys technology and the factors of production available
8/7/2019 EC10E_Basic_Economic_Tools_and_Principles_revised Lecture Notes 1
http://slidepdf.com/reader/full/ec10ebasiceconomictoolsandprinciplesrevised-lecture-notes-1 17/39
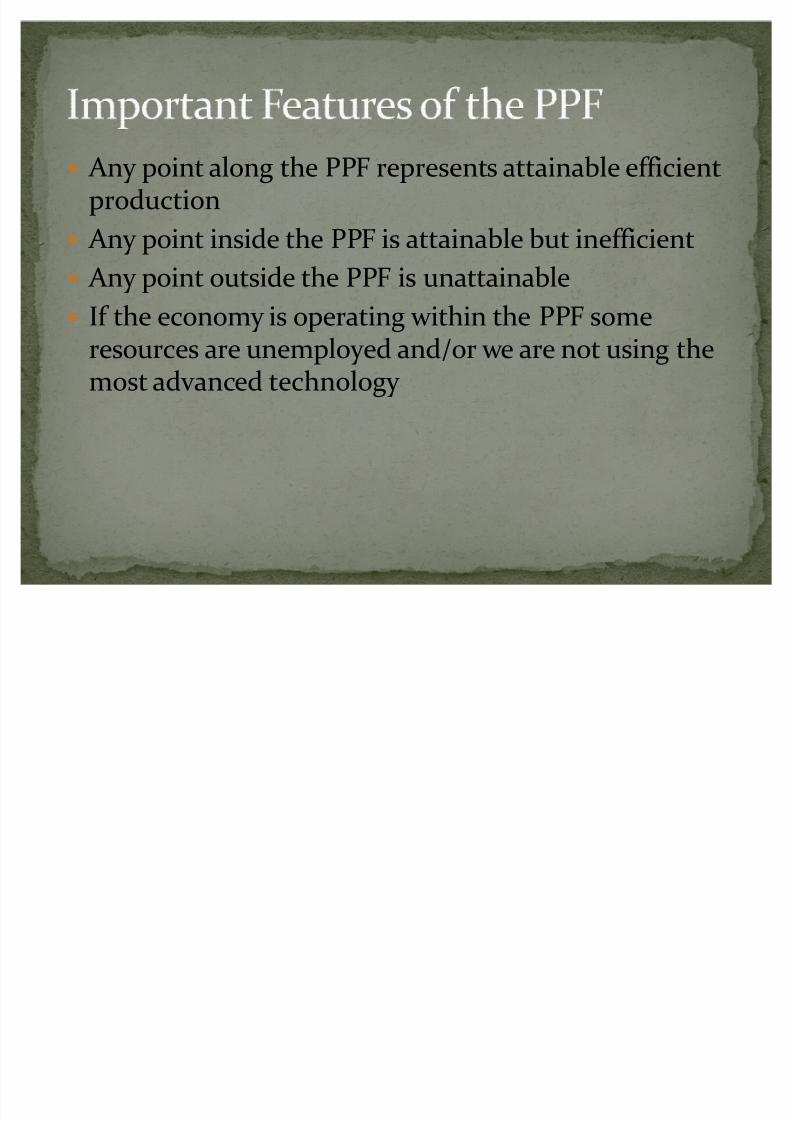
y A ny point along the PPF represents attainable efficientproduction
y A ny point inside the PPF is attainable but inefficient
y A ny point outside the PPF is unattainabley If the economy is operating within the PPF some
resources are unemployed and/or we are not using themost advanced technology

8/7/2019 EC10E_Basic_Economic_Tools_and_Principles_revised Lecture Notes 1
http://slidepdf.com/reader/full/ec10ebasiceconomictoolsandprinciplesrevised-lecture-notes-1 18/39
y It has a negative slope
y It is bowed outwards represents the principle of
increasing opportunity cost

8/7/2019 EC10E_Basic_Economic_Tools_and_Principles_revised Lecture Notes 1
http://slidepdf.com/reader/full/ec10ebasiceconomictoolsandprinciplesrevised-lecture-notes-1 19/39
y Economic growth is an increase in the productivecapacity of an economy
y It is represented by an outward shift of the PPF
y Can be cause by an increase in resources and/or animprovement in technology

8/7/2019 EC10E_Basic_Economic_Tools_and_Principles_revised Lecture Notes 1
http://slidepdf.com/reader/full/ec10ebasiceconomictoolsandprinciplesrevised-lecture-notes-1 20/39
y What?
y How?
y For Whom?

8/7/2019 EC10E_Basic_Economic_Tools_and_Principles_revised Lecture Notes 1
http://slidepdf.com/reader/full/ec10ebasiceconomictoolsandprinciplesrevised-lecture-notes-1 21/39
y Command Economy the government
y Laissez-Faire/FreeMarket the market
y Mixed Economy - both

8/7/2019 EC10E_Basic_Economic_Tools_and_Principles_revised Lecture Notes 1
http://slidepdf.com/reader/full/ec10ebasiceconomictoolsandprinciplesrevised-lecture-notes-1 22/39
y The Basic Decision-Making Unitsy Households consuming units
y Firms producing units

8/7/2019 EC10E_Basic_Economic_Tools_and_Principles_revised Lecture Notes 1
http://slidepdf.com/reader/full/ec10ebasiceconomictoolsandprinciplesrevised-lecture-notes-1 23/39
y Product/OutputMarkets
y Factor/InputMarkets
8/7/2019 EC10E_Basic_Economic_Tools_and_Principles_revised Lecture Notes 1
http://slidepdf.com/reader/full/ec10ebasiceconomictoolsandprinciplesrevised-lecture-notes-1 24/39
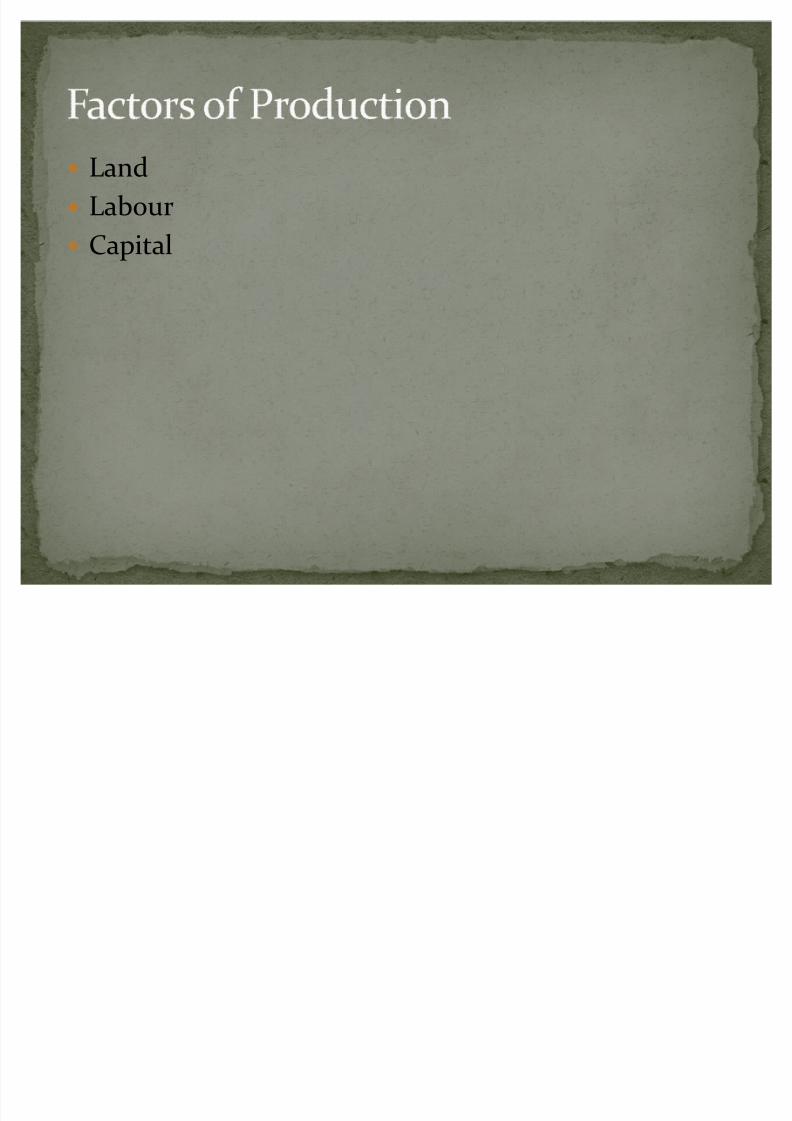
y Land
y Labour
y Capital

8/7/2019 EC10E_Basic_Economic_Tools_and_Principles_revised Lecture Notes 1
http://slidepdf.com/reader/full/ec10ebasiceconomictoolsandprinciplesrevised-lecture-notes-1 25/39
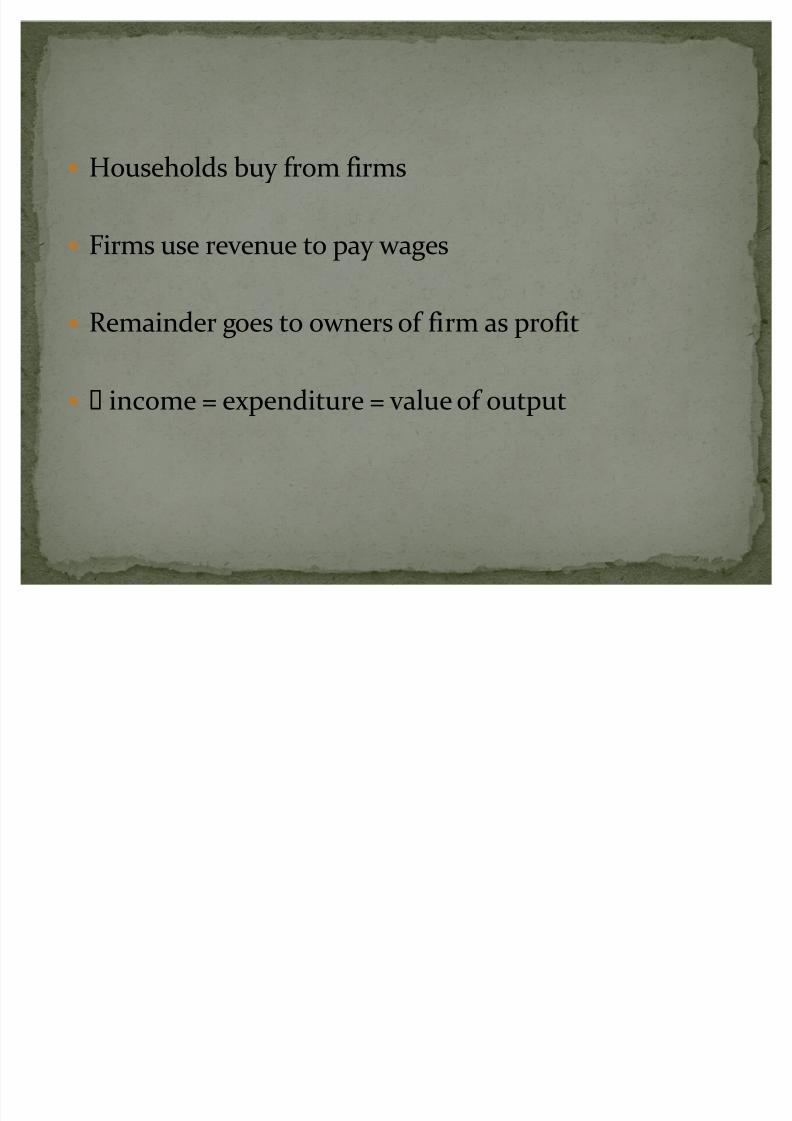
y The outer loop represents the flow of dollars
y The inner loop represents the flow of goods andservices
y Households sell their labour to firms
y Firms use labour to produce goods and services
y Firms sell goods and services to households
8/7/2019 EC10E_Basic_Economic_Tools_and_Principles_revised Lecture Notes 1
http://slidepdf.com/reader/full/ec10ebasiceconomictoolsandprinciplesrevised-lecture-notes-1 26/39

8/7/2019 EC10E_Basic_Economic_Tools_and_Principles_revised Lecture Notes 1
http://slidepdf.com/reader/full/ec10ebasiceconomictoolsandprinciplesrevised-lecture-notes-1 27/39
y The quantity of a good demanded is the amount of that good that an individual is willing and able to buy in a given time period, at a particular price
y
The demand curve is the relationship between thequantity of a good that consumers are willing and ableto buy and the price of the good
y The demand curve slopes downwards reflecting the
law of demand

8/7/2019 EC10E_Basic_Economic_Tools_and_Principles_revised Lecture Notes 1
http://slidepdf.com/reader/full/ec10ebasiceconomictoolsandprinciplesrevised-lecture-notes-1 28/39
y It has a negative slope
y It cuts the quantity axis
y It cuts the price axis

8/7/2019 EC10E_Basic_Economic_Tools_and_Principles_revised Lecture Notes 1
http://slidepdf.com/reader/full/ec10ebasiceconomictoolsandprinciplesrevised-lecture-notes-1 29/39

8/7/2019 EC10E_Basic_Economic_Tools_and_Principles_revised Lecture Notes 1
http://slidepdf.com/reader/full/ec10ebasiceconomictoolsandprinciplesrevised-lecture-notes-1 30/39
y Market demand is the quantity of the good that allconsumers in a market will buy at a particular price
y It is the sum of the individual demand curves of allconsumers in a particular market

8/7/2019 EC10E_Basic_Economic_Tools_and_Principles_revised Lecture Notes 1
http://slidepdf.com/reader/full/ec10ebasiceconomictoolsandprinciplesrevised-lecture-notes-1 31/39
y Quantity supplied is the amount of a particular goodthat a firm would be willing and able to offer for sale ina given time period, at a particular price
y
The supply curve shows the quantity of a good thatproducers are willing to sell at a given price
y The curve is upward sloping reflecting the law of supply

8/7/2019 EC10E_Basic_Economic_Tools_and_Principles_revised Lecture Notes 1
http://slidepdf.com/reader/full/ec10ebasiceconomictoolsandprinciplesrevised-lecture-notes-1 32/39
y It has a positive slope
y It intersects the price axis

8/7/2019 EC10E_Basic_Economic_Tools_and_Principles_revised Lecture Notes 1
http://slidepdf.com/reader/full/ec10ebasiceconomictoolsandprinciplesrevised-lecture-notes-1 33/39
y The price of the good
y Cost of inputs
y Technology
y Prices of Related Products

8/7/2019 EC10E_Basic_Economic_Tools_and_Principles_revised Lecture Notes 1
http://slidepdf.com/reader/full/ec10ebasiceconomictoolsandprinciplesrevised-lecture-notes-1 34/39
y Market supply is the sum of all that is supplied by allproducers in a single market per period
8/7/2019 EC10E_Basic_Economic_Tools_and_Principles_revised Lecture Notes 1
http://slidepdf.com/reader/full/ec10ebasiceconomictoolsandprinciplesrevised-lecture-notes-1 35/39
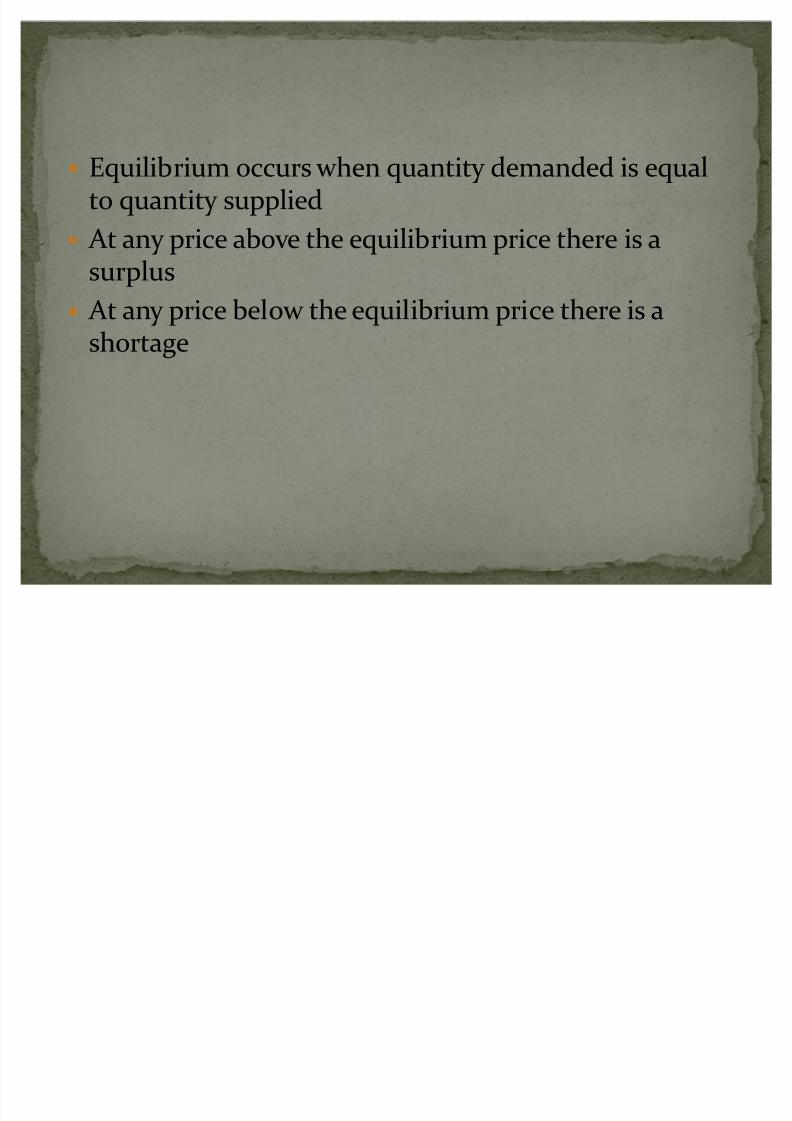
y Equilibrium occurs when quantity demanded is equalto quantity supplied
y A t any price above the equilibrium price there is a
surplusy A t any price below the equilibrium price there is a
shortage

8/7/2019 EC10E_Basic_Economic_Tools_and_Principles_revised Lecture Notes 1
http://slidepdf.com/reader/full/ec10ebasiceconomictoolsandprinciplesrevised-lecture-notes-1 36/39
y Shifts in the demand and/or supply curves will causechanges in equilibrium

8/7/2019 EC10E_Basic_Economic_Tools_and_Principles_revised Lecture Notes 1
http://slidepdf.com/reader/full/ec10ebasiceconomictoolsandprinciplesrevised-lecture-notes-1 37/39
y We move from micro to macro analysis by aggregatingor combining the individual markets into one overallmarket
y Some argue that this ignores distinctions amongdifferent products
y Others argue differences between goods areinsignificant when analyzing economy wide issues

8/7/2019 EC10E_Basic_Economic_Tools_and_Principles_revised Lecture Notes 1
http://slidepdf.com/reader/full/ec10ebasiceconomictoolsandprinciplesrevised-lecture-notes-1 38/39
y Domestic Product = the total value of all goods andservices produced in the economy in a year
y Price = overall price level = average price
y A D = aggregate demand = the economy wide demandfor output
y AS = aggregate supply = the total amount of output
that firms supply

8/7/2019 EC10E_Basic_Economic_Tools_and_Principles_revised Lecture Notes 1
http://slidepdf.com/reader/full/ec10ebasiceconomictoolsandprinciplesrevised-lecture-notes-1 39/39
y A D curve = a diagram showing the relationshipbetween the price level and the economy wide demandfor output
y AS curve = a diagram showing the relationshipbetween the price level and the total amount thatfirms supply


