ECO-BIOLOGY AND FISHERIES OF THE WHELK, BABYLONIA SPIRATA (LINNAEUS, 1758) AND BABYLONIA ZEYLANICA (BRUGUIERE, 1789) ALONG KERALA COAST, INDIA Thesis submitted to Cochin University of Science and Technology in partial fulfillment of the requirement for the degree of Doctor of Philosophy Under the faculty of Marine Sciences By ANJANA MOHAN (Reg. No: 2583) CENTRAL MARINE FISHERIES RESEARCH INSTITUTE Indian Council of Agricultural Research KOCHI 682 018 JUNE 2007
Transcript
ECO-BIOLOGY AND FISHERIES OF THE WHELK,
BABYLONIA SPIRATA (LINNAEUS, 1758) AND
BABYLONIA ZEYLANICA (BRUGUIERE, 1789)
ALONG KERALA COAST, INDIA
Thesis submitted to Cochin University of Science and Technology in
partial fulfillment of the requirement for the degree of
Doctor of Philosophy
Under the faculty of Marine Sciences
By
ANJANA MOHAN
(Reg. No: 2583)
CENTRAL MARINE FISHERIES RESEARCH INSTITUTE
Indian Council of Agricultural Research KOCHI 682 018
JUNE 2007
®edi'catec[ to MyTarents. . .
Certificate
This is to certify that this thesis entitled “Eco-biology and fisheries ofthe whelk, Babylonia spirata (Linnaeus, 1758) and Babylonia zeylanica(Bruguiere, 1789) along Kerala coast, India” is an authentic record of researchwork carried out by Anjana Mohan (Reg.No. 2583) under my guidance andsupervision in Central Marine Fisheries Research Institute, in partial fulfillmentof the requirement for the Ph.D degree in Marine science of the CochinUniversity of Science and Technology and no part of this has previously formedthe basis for the award of any degree in any University.\Dr. V. ipa
(Supervising guide)Sr. Scientist, Mariculture DivisionCentral Marine Fisheries Research Institute.
Date: 3?-95' LN?‘
Declaration
I hereby declare that the thesis entitled “Eco-biology and fisheries of thewhelk, Babylonia spirata (Linnaeus, 1758) and Babylonia zeylanica (Bruguiere,1789) along Kerala coast, India” is an authentic record of research work carriedout by me under the guidance and supervision of Dr. V. Kripa, Sr. Scientist,Mariculture Division, Central Marine Fisheries Research Institute, in partialfulfillment for the Ph.D degree in Marine science of the Cochin University ofScience and Technology and no part thereof has been previously formed the basisfor the award of any degree in any University.
(ANJAN A MOHAN)
Date: 2.7» 05- 07
Acknowledgement
I am greatly indebted to Dr. V. Kripa(supervising guide), Sr. Scientist, MaricultureDivision, Research Center of CMFRI, Calicut for herguidance, valuable suggestions, constantencouragement, criticism and support during the courseof my investigation and documentation.
I owe many thanks to Dr. Mohan Joseph Modayil,Director, CMFRI, Kochi for extending all thefacilities for successful completion of this researchwork.
I express my deep sense of gratitude to Dr. K.Sunilkumar Mohamed, HOD, Molluscan Division, CMFRI forhis constant help, guidance, subjective criticism andencouragement in preparing the thesis.
It is my pleasure to acknowledge Dr. K.K.Appukuttan, former HOD anui Principal Scientist,Molluscan Fisheries Division of CMFRI for helping mecarry out my work and in the preparation of themanuscript.
I acknowledge my deepest sense of gratitude toDr. M. Srinath, HOD, FRAD, Dr. T.S. Velayudhan,Principal Scientist, Dr. P. Laxmilatha, SeniorScientist; Dr. Shoji Joseph, Senior Scientist; Dr.Somy Kuriakose, Scientist Sr. Scale; for their helpduring the course of my study.
I am highly indebted to Dr. Paul Raj, Scientistin Charge, PGPM, CMFRI for the timely help in allmatters concerned with my Ph. D programme. The helpand support extended kqriflua PGPM staff':Ms gratefullyacknowledged.
I wish to express my sincere thanks to time OIClibrary and other staff members" for the help andcooperation extended.
I am thankful to Dr. Sarala Devi, Scientist, Mrs.Jasmine, Dr. Jayaraj, Research scholars, NIO, Kochifor their help rendered to me during the tenure ofwork.
I zmn grateful to [hm P. PL Radhakrishnan, <OIC,CMFRI RC, Calicut for providing facilities to prepare
i
the manuscript. I also thank other staff members ofCalicut RC of CMFRI for their help.
I thank Shri P. Radhakrsihan, Shri. MathewJoseph, Shri. P.S. Alloycious, Smt. Jenny Sharma,Shri. M.N. Sathyan, Smt N. Ambika, Mrs. Sheela, Shri.Zainudeen, Shri. Jeevanraj staff of MolluscanFisheries Division, CMFRI for their great help andconstant encouragement in carrying out my work.
My special thanks are due ix) Mr. Ramalinga, Dr.R. Gireesh, Mr. P. S. Sivaprasad, Dr. S. Balu, Mr. M.Vinod, Dr. K.P. Abdu Rahiman, Dr. Satish Sahayak, Dr.Anikumari, Mrs. Sreejaya, Mrs. Leena Ravi, Mrs. R.Jugnu, IMiss. ‘Neetha. Susan David, lflr. PL Hashinl andother Senior Research Fellows of CMFRI, Kochi fortheir timely help auui constant encouragements duringthe course of my study.
I greatly acknowledge the financial assistancefrom tfluz AP Cess fund. of Indian Council ofAgricultural Research in the form of Senior ResearchFellowship under the project “Development ofseafarming techniques for commercially importantwhelk, Babylonia spp.”.
I thank Mr. Shaji, Mr. Marshal Mr. Lknz and allthose who have helped me collecting the samples.
Above all, I am greatly obliged to my parents andfamily for their kdessings and encouragement withoutwhich the completion of this work would only have beena dream.
Anjana Mohan
H
Contents
Acknowledgement
Chapter 1.
Chapter 2.
2.12.22.32.42.5
Chapter 3.
3.13.2
Chapter 4.
4.14.24.34.44.5
4.64.74.84.9
Introduction
Review of literature
Eco-biology of gastropodsFisheryUtilizationBy—catchManagementMaterials and methods
SamplingAnalysisResults
HydrologySediment characteristicsWhelk distribution and abundanceAssociated FaunaRelationship of whelk abundance withabiotic and biotic factorsReproductive biologyFood and feedingBiometric relationshipsLength frequency distribution
4.10 Mean length4.11 Growth4.12 Fishery
Chapter 5.
Chapter 6.
References
Discussion
Summary
1-11
l
8
18232426
2830
4046495275
778788919597101
ll-4
145
149
Cfiapter 1
Introduction
1. Introduction
Molluscs form one of the earliest recorded groups of living organisms. Their
presence on planet earth since the Paleozoic era 540 million years ago has been
proved beyond doubt. Abundance, size and diversity and their dual roles as predators
and prey make molluscs an indispensable component of tropical marine ecosystems.
With more than 80,000 species, the phylum Mollusca is second only to the phylum
Arthropoda. Of these, only about 28 species of bivalves and 65 species of gastropods
are of commercial importance either in shell trade or for edible purpose and 14
species of cephalopods are exploited commercially. Although only a few reliable
comparative data exist, molluscs probably comprise 15-40% numerically of benthic
macro invertebrates and are exceeded only by polychaetes and crustaceans in tropical
lndo-West Pacific coastal marine environments (Longhurst and Pauly, 1987).
Species of the class Gastropoda of phylum Mollusca with their omamental
shell and succulent meat have been harvested since time immemorial. The
production has increased considerably from 30,499 tomies in 1950 to l,2l,657 t in
2003 (FAO, 2003). The peak during the period 1950 to 2003 has been in 1996, when
1,4 l ,780 t were harvested from the natural beds. During the past 25 years the number
of countries involved in gastropod fishing rose from 23 to 47. (Leiva and Castilla,
2002). The four major gastropod groups which contributed to world fisheries in 2003
were whelks (30.9%), stromboid conchs (19.5%), turbo snails (18.7%) and abalone
(10.3%). The dominant species were Buccinum undatum (31,492 t), Strombus spp.
where, Amax is Maximum age (y-1); Mmax is Maximum individual body mass (gDM); T is Bottomwater temperature (;C)
The fishing mortality coefficient (F) was calculated from the formula
F= Z-M
Here, the Z and M values estimated using Brey’s equations were used for thecalculations.
3.2.12. Probability of capture
The complete length range of fish or shellfish are not always under full
exploitation and the selectivity is determined by the cod end mesh size in trawl nets.
The mean length (L650) at which a fish has 50% chance of being retained by the net
(0.5 probability of being caught) is estimated for suggesting the regulatory measures
of the gear. The probability of capture by length of the animals was estimated using
FiSAT program. The mortality coefficients estimates using Brey’s (1999) equations
were used here for the analyses.
3.2.13. Relative yield-per-recruit (Y ’/R)
Beverton and Holt (I966) proposed relative yield-per-recruit (Y’/R) based on
the concept that what matters is the relative difference of Y/R for different values of
F. The model is suitable for assessing the effect of mesh size regulations. The Y’/R
and B’/R were obtained from the estimated growth parameters and probabilities of
capture by length (Pauly and Soriano, 1986). The estimates were made using FiSAT.
38
3.2.14. Length cohort analysis
Length based cohort analysis (Jones 1981) was performed to estimate the
dynamics of abundance and fishing mortality and number of survivors for each of the
length class. Here it is assumed that all length classes caught during one year reflects
that of a single cohort during it entire life span. The input parameters used Were, L..,,
K, F/Z.
39
C/iapter 4
Resufiis
4.1. Hydrology
The results of the ecological variations of the surface and bottom water along
the two depth zones, 10-20m (N1) and 20—30m (N2) in the northern and southem zone
(S; and S2) of the study area are given below.
a. Temperature:
In the whelk beds, the sea surface temperature (SST) ranged between 29 and
31°C, while the sea bottom temperature (SBT) was between 28 and 30°C. Along
north zone, the average SST was 29.6°C:b1.4 and 29.3°C i 1.2 at NI and N2
respectively, where as the SBT showed a slight decrease, 28.8°C, and 28.9°C at N;
and N2 respectively. Along southem zone, the average SST at site N1 was 29°C and at
N2 29.5°C. The SBT was slightly lower than the SST at both the sites, 28 and 29°C
respectively (Fig. 4). ANOVA showed no significant variation in water temperature
with depth and zone (P > 0.05).
b. Salinity:
In the north zone, salinity of surface water ranged between 29 and 36ppt and
bottom water salinity varied between 29 and 37 ppt. The average surface water
salinity at N1 was 33.2 d: 3.97, and at N; 33 :b 3.63 ppt (Fig. 5). The surface water
salinity of the southern zone varied between 30 and 37 ppt and between 30 and 36 ppt
for bottom water. The average surface water salinity at S1 and S; were 35.5 i 0.71
and 33.5 i 4.95 ppt, while the average bottom water salinity at these sites was 36 and
32 i 2.83 ppt respectively. Though there were variations in average values of salinity
in both the zones, these variations were not statistically significant (P > 0.05).
c. pH:
In the northem zone, the surface as well as bottom water pH were almost
similar in both the sites. The surface water pH ranged between 8 and 8.4, while the
pH of bottom water varied between 8 and 8.3 and the average pH of both surface and
bottom water in this region were 8.2. In the southern zone, surface water pH ranged
between 8.3 and 8.5, while that of the bottom water ranged from 8.3 to 8.6. The
average surface water pH at S, and S; were 8.5 i 0.1and 8.4 i 0. lrespectively, and
40
anQQ
31
30.5
30
29.5
29
28.5
28
27.5
27
26.5
F |g. 4 Average temperature ( C) of surface and bottom water at the four s|tes
I surfaceI bottom
40 I surfaceI bottom38
36
34
32
30
28
26
24
22
20 ;_
Fng § Average sal|n|ty of surface and bottom water at the four s|tes
same values were obtained for bottom water in this zone. From the statistical analysis
it was found that there was no significant variation in pH between the 2 depths in the
northem and southem zones during the study period. However the pH values varied
significantly between surface water of N1 and S; (P<0.05 & F =6.106), N2 and S2,
(P<0.01 F =13. 636) and N; and S2 (P<0.05 F =6. 0) of bottom water. The average pH
values with standard deviation of the four sites are presented in Fi g. 6.
d. Dissolved oxygen
During the study period, dissolved oxygen content of the surface and bottom
waters showed variations among sites in the north zone and dissolved oxygen in the
surface water was higher than bottom water at all stations. The DO of surface water
varied between 3.05 mg and 5.8 mg 1", while that of bottom water ranged from 2.2 to
5.5 mg 1". The average level of dissolved oxygen at N1 and N2 were 5.31 i 0.44 mg
1"‘ and 4.9 4 1.05 mg 1", while it was 4.6 Iii 0.76 mg 1-‘ and 3.8 4 1.34 mg 1"‘
respectively for bottom waters (Fig. 7). In south zone, the bottom water showed
higher dissolved oxygen content compared to surface water in shallower region (Fig.
7). In this region, the values ranged between 5.4 and 6.5 mg 1'1 for surface water and
5.9 to 6.2 mg l‘1 for bottom waters. The average values obtained for surface water at
s1 and s2 were 5.6 4 0.2 mg 1" and 6.4 4 0.08 mg 1", while the values were same (6.1
mg 1") for bottom water in both the sites. The statistical analysis showed significant
variation in DO of surface water between N1 and N2 (P<0.05, F =34. 8). The bottom
water DO showed statistically significant variation between N1 and S; (P<0.05,
F=6.48).
e. Ammonia
The ammonia content of surface waters was lower than in the bottom water.
The ammonia in sea water of the north zone ranged from 0.338 to 5.83 umols ll,
while in the bottom waters it was between 0.93 a.nd 5.83 pmols 1". The average value
recorded for surface water in N1 and N2 were 2.3 dc l.55 and 3.4 i 2 p.II1OlS I"
respectively, while for bottom water the values were 3.3 i 2.5 and 3.8 :i: 1.8 umols l“'.
No significant variations were found in the statistical analysis between the sites
(P> 0.05).
42
8.7 V
8.6 —
8.5
8.4
8.3 ~e
8.2
8.1 ~
3 ..
7.9 ~
7.8
7.7
mg I"
I surface 3I bottom
7 ' 7" 7'1N1 N2 S1 S2** Significant variation between zones
Fig. 6 Average pH of surface and bottom water at the four sites
surface
I bottom
N1 N2 S1 S2* Significant variation within sites ** Significant variation between zonesFig. 7 Average dissolved oxygen of surface and bottom water at the four sites
43
In south zone, the dissolved ammonia content was similar at S1 as in north
zone, where as in the surface waters ammonia was higher at S; (Fig. 8). The values
varied from 2.2 to 6.2 pmols 1'1 and 1.2 to 5.6 umols 1" for surface and bottom water
respectively. The average values for surface water at both the sites were 3.3 il.6 and
4.5 i 2.8 umols 1']; where as the average ammonia content in bottom water were 4.5
:i:l.5 and 3.3 i 2.9 umols 1" respectively. No significant variation was found between
sites and between zones statistically (P> 0.05).
f Phosphate
The phosphate content in the surface water varied between 0.078 and 0.544
pmols 1", while the bottom water phosphate content ranged from 0.088 tol.865
|.l.l'l'lO1S 1-1. The average values of phosphate at N1 and N; were 0.39 :t 0.18 pmols 1"
and 0.32 a 0.2 pmols 1"‘, while it was 0.63 a 0.5 umols 1"‘ and 0.72 e 0.6 pmols 1"‘
respectively for bottom waters (Fig. 9). The respective values for surface water
ranged between 0.381 and 0.707 pmols 1'], where as in the bottom water the valuesI
varied from 0.435 to 0.707 umols 1' . Though phosphate content of north and south
zone showed variations, only N; and S; expressed statistically significant variation
(P<0.05).
g. Nitrite and Nitrate
In the northem zone off Kollam, the surface as well as bottom water nitrite
and nitrate forms of nitrogen were almost similar in both the transects. The values
showed an increase with depth for both surface and bottom water (Fig. 10). The
nitrite and nitrate ranged between 0.032 and 0.413 umols 1", and 0.298 and 2.318
umols lil respectively for surface water, while the values for bottom water ranged
from 0.032-0.586 umols 12' and 0.446-3.589 umols 1"‘ respectively.
Along the south zone also the nitrite and nitrate forms of nitrogen showed
similar variations as in north zone (Fig. 10). The surface water nitrite and nitrate
ranged from 0.029 to 0.157 pmols 1" and 0.51 to 0.662 pmols 1'1 respectively, while
in bottom water the nitrogen content varied from 0.079-0.608 umols 1" and 0.401
6.l5l pmols 1" respectively. Though there were variations in values among sites and
zone, the variations were not statistically significant.
44
‘I
8 e I surfaceI bottom1 it
ft] 11 i
pmos-F
2
1
O N1 N2 S1 S2Fig. 8 Average ammonia of surface and bottom water at the four sites
1.6on ISUl'f3Celbottom i
1.2 ‘
1 .
MOS
.°on
I-'
oca
Q r—~ no N1 N2 S1 S2** Significant variation between zones
Fig. 9 Average phosphate of surface and bottom water at the four sites
45
h. Total suspended solids (TSS)
The average values of total suspended solids of surface water of N1 and N; in
the north zone were 20.li5.8 and 23.8:l:7.9 mg 1" respectively. The TSS values
ranged between 13.6 and 34.8 mg 1" and 15.6 and 35.4 mg 1" in surface and bottom
waters respectively in this region. The bottom water had more suspended solids
compared to surface water (Fig. 11).
The TSS of surface water ranged between 22.4 and 31.2 mg, where as in
bottom water the values ranged from 27.8 to 42.4 mg 1" and the variation was
statistically significant (P<0.05, F =29.06). Between north and south zone also the
TSS values varied significantly (P<0.05, F =6. 73) between N1 and S1.
4.2. Sediment characteristics
a. Total organic carbon
The total organic carbon of the sediment of north zone showed an increase
with depth (Fig. 12). The percentage of organic carbon ranged between 0.87 and
1.75, with an average TOC of 1.18 i 0.4% at N1 and 1.28 :1: 0.2% at N2. In contrast to
this, along south zone the organic carbon content of sediment decreased with increase
in depth. The values varied from 0.051 to 1.051 % and the averages obtained at S1
and S2 were 1.05 i 0.09% and 0.13 d: 0.1% respectively. The TOC showed no
significant variation among both the sites of north zone, while there was significant
variation in TOC of S1 and S2 (P<0.05 F = 76. 8). The statistical analysis between the
zones showed no significant variation in TOC of N1 and S1, however there was
significant variation in TOC between N2 and S; of north and south zones (P<0.001,
F =46.2).
b. Grain size distribution
The sediment texture along north zone of Kollam was found to be silt-loam at
all stations during the study period. Percentage of clay and sand were obsewed to
increase with increase in depth, where as the contribution of silt was found to
decrease with increase in depth. The percentage of clay varied from 12.0 to 26.5%
and that of silt ranged from 45.2 to 64.7%. Among sand fraction, fine sand
46
'.'
pmo smg?’8
3
(D
40 ' an
Fig. I0 Average nitrite and nitrate of surface and bottom water at the four sites
ififi
N2 S1* Significant variation within sites ** Significant variation between zones
Fig. II Average total suspended solids of surface and bottom water at the four sites
I Ntrite surface
I Ntrite bottom
I Ntrate surface
I Nitrate bottom
I surfaceI bottom
1.81.6 **1.4 I1.2 A 1.1 T
% TOC
7"‘O
0.8
0.6
0.40.20.0 i eN1 N2 S1
* Significant variation within sites ** Significant variation between zones
S2
Fig. I2 Average total organic carbon of sediment at the four sites
i100 e
90
8070 ..60 *‘50
40
30
20
0 L10
* Significant variation within sites ** Significant variation between zones
Fig. I3 Grain size distribution of sediment at the sites
48
“ El %Sand1 OI Alsm1:1
—I—°/<> Clay
* QN1 N2 S1 S2
dominated over the coarse sand at all stations and the total sand fraction ranged
between 16.8 and 31.7% during the period. The details are depicted in Fig. 13.
Along the south zone, sand fraction dominated the sediment texture at all
stations and the texture was sand-loam at S, and sandy at S2. The sand fraction varied
between 70.2 and 93.6% and coarse sand formed the major component. The silt and
clay fractions were very meager and ranged from 0.8 to 9% and 3.3 to 17.85%
respectively. The sediment fractions showed significant variation between S; and S;
(sand, P<0.05 F =151.3; silt P<0.05 F=19.5 and clay P<0.05 F =290.2). There was
significant variation in sand (P<0.001 F =183.4) and silt (P<0. 001 F =124.3)
fractions at N, of north and S1 of south zones, while the three fractions sand (P<0.001
F=319.4), silt (P<0.001 F =848. 4) and clay (P<0.05 F=16. 0) showed highly
significant variation between N; and S2.
4.3. Whelk distribution and abundance
In the north zone, Babylonia spirata was present at both the sites N1 and N;
and in the southem zone at S1 at a low density and was absent in S; B. zeylanica was
observed only at site S2. Both the species were never found to co-exist. The density
of B. spirara varied among sites and maximum density was observed at N2 (6 ind/ 10
m2) and minimum at st (0.14 ind/10 m2). The density of B. zeylanica (2 ma/10 mt)
was low compared to the density of B. spirata at the same depth in the north zones.
Biomass of B. spirata was 30.9 g and 88.8 g/l0 m2 at N1 and N2 respectively, while it
was lower (1.6 g/10 m2) at s,. The biomass of B. zeylanica observed in the site S2
was 31 g/10 m2. The details of density and biomass of whelk is given in Table-1.
Table-l Average density and biomass of whelk at the four sites
Site Species 9 Density Biomass“pg (ims/10m’) pg (g/10m’)
N 1 B. spirata 2 30.9N; B. spirafa 6 88.8S1 B. spirata 0.14 1.6S; B. zeylanica 2 31
49
Length (shell height, SH) composition of B. spirata population occurring in
the two zones was found to be almost similar. The average shell height of B. spirata
at N1 and N2 was 40.8 i 3.6 mm and 40.4 i 3.5 mm respectively, while it was 35.4 i:
4.7 mm at S1. 93.8% of B. spirata at N1 were in the length range 34 to 46 mm with
two modes at, 40-(42 and 42-44 mm. Small size whelks of SH<34 mm formed 2.8%
of the population and 3.4% were >46 mm at N1. Similar pattem of length
composition of whelk was observed at N2, where the modal class was 42-44 mm
(22.7%) and next dominant class was 38-40 mm (21.5%). 95.9 % of the whelks were
of 34-46 mm length and 1.8 % smaller than 34 mm. The smallest specimen of B.
spirata in the N] and N2 measured 22.2 mm and 22.8 mm respectively, while the
maximum SH recorded were 49.7 mm and 47.2 mm respectively. The average shell
width (SW) of B. spirata was 27.2 and 26.9 mm at N1 and N2, the average total
weight 15.5 and 14.8 g and average meat weight was 5.5 and 5.8 g respectively. Sex
ratio (male: female) was similar, l:l.3 and l:l.4 at N; and N;
The SH of B. spirata ranged between 30.4 and 41.5 mm with an average of
35.4 i 4.7 mm. Other shell and weight characters of B. spirata population at S1 were;
average SW 23.5 :l: 2.5 mm, average weight 11.6 :t 4.lg and meat weight 3.7 i 1.2g.
The sex ratio was 110.5 and males dominated the population. The morphometric
characters and length frequency composition of the population are given in Table-2
and Fig. l4 respectively. The shell height and width of B. zeylanica at site S2 of south
zone ranged between 36.3-52.9 mm and 21.9-30 mm respectively and the average SH
of whelk in the population was 45.4 :b 3.6 mm and girth 26.3 :1: 1.8 mm. The
population of B. zeylanica was dominated by animals of 42 to 50mm (81.8%) SH,
where the model class was 44-46 mm (40.9%). The total weight of B. zeylanica
ranged between 9.l-22.4g and meat weight 3.9-9.8 g, with an average of 15.5 3: 3 g
and 6.8 i l.5 g respectively. The population was slightly dominated by females; the
sex ratio was l:l.2.
50
Table-2. Biometric characters and sex ratio of the whelk population at the four sites
Fig. I4 Length frequency distribution of whelk along the four sites
51
4.4. Associated Fauna
Fauna associated with B. spirata and B. zeylanica population in the north and
south zones were segregated, identified and quantified to elucidate the community
structure of the region.
4.4.1. Community structure of macrobenthos
The benthic community of north zone comprised of six macrofaunal
invertebrate taxa and fish larvae. Annelids, mainly polychaetes were the most
predominant group forming 81.2% of the population. Species belonging to major
Phyla like coelentrata, crustacea, mollusca and echinodermata and in the minor phyla
like sipuncula and nemeitene were present. Along south zone five invertebrate
groups identified were annelids, sipunculids, crustaceans, molluscs and echinoderms.
The univariate diversity measures of the four sites are given in Table- 3. The
macrofauna along north zone was more diverse and evenly distributed than the south
zone. The species were found to be more diverse and evenly distributed at N2 and the
indices were minimum at S1, though the number of species was lowest at S2_ The
density and biomass of macrofauna along south and north zone are given in Table-4
and the percentage contribution of density and biomass of each taxa to the total is
shown in Fig. 15a & b. Density of total benthos was found to be higher at site S1
(l24l0ind/m2), while the biomass was higher at N2 (1 l.087g/m2). The total macro
faunal density of transect N1 ranged from 500 to 4525 ind/m2 and at N2 1125 to 7750
ind/m2. Though density of polychaetes was higher at N2, their percentage
contribution to the total abundance was lower compared to N1. Crustaceans were the
second dominant group at north zone, followed by sipunculids and other taxa which
were represented in meager numbers. Molluscs were observed only in the benthos
samples from N2 (512 ind/m2).
52
Table-3 Diversity indices of macrofauna at the four sitesSites Species Evenness Diversity Dominance indexrichness index (1-Lambda’)N1 5.28N3 6.95S1 2.33S3 2.55
0.70
0.73
0.370.70
2.59
2.96
1.16
2.11
0.83
0.91
0.460.80
Table-4 Average density (nos/m2) and biomass (g/m2) of the different resources ofbenthos which occurred along with the whelks at the four sites
g Density (nos/m2) Biomass (8/"127_ N2 _ 51 .,32 N1 N1 S] Sq
3@ *6EL ad“W2 adJO M: WmBMW Q; H15Ha P g mmgla W; CW9“97% Pg $38|? MS 3?038$ UUMEQNANNBflsg QU_=:“N\@NQ__wE£ GUEBKNVNQ%Q‘HO V: T63% Q; 5H3 P VS 5%WZi $6wz $6wz 868|? MS CW9“8% MS 3'9“gig M: 36¢DEE BUNZGNAVN265 3_5E®N225 g_§§@NQQQQOh)m%B@§+a_3H§m@AohémwE VS 5HakgzwNéwil %%%% $6W Q8mz adw 2d_mz adM2 66Q99‘ vi; 91%CW2“ Q; 813$3 _§ El;91% M; QHAK21: MS $391; VS $8Ojwaa QHUKMQWO_dE£ sE_S__nOfiga EaggBfifia 35??2058 EE__%U358 EE__%QQMNQMNMNW gog JO VS 2%$2 $6 26 vs W52 $6 Ha F MS HIEgig W; 32AKA; M; 91;O99“ MS 91;O_mE §§_&_4268 §§~h_$_DEE sS__%MNQ_m’’’’’ __°\°m 2_O_m l__3_W_E_9_E “mm ‘B 2:; m m__8g__“_______z__§_E8scamm2U2_m8_EU~®N ‘Q Ea G“Qk_HR_m_ _m 2650'“ E8 DEE MO mfi____O_Hw “Em Eostmu MO W303 “B b:g_g mpfimg he <>OUz< MO 8_a3_ R 05:‘
in 2001 and 2002 respectively. The percentage of smaller B. spirata was maximum
in August (28 %) followed by September (12%) and November (1 1.4%) during 2001.
During 2002, the presence of smaller animals was negligible (0.9%) compared to
2001, when they occurred during January, April, September, November and
December. The presence of bigger snails (>46mm) were also negligible (0.57% and
6.6 % in 2001 and 2002 respectively). The annual mode of the fishery during 2001
was 36-38 mm and 38-40 mm during 2002. The monthly length frequency
distribution of B. spirata in 2001 and 2002 is shown in Fig. 28a & b.
5G
::e%lllll llli2:2.
Length CIOIIQP
, 13
B _ ' J-an I Feb i Mar I Apr i Mag ' Juraiiiil Jul 'iQui§W' Sop i Oct ' Nov ' Dec '
Smallest ML : 21.0 mm, Largest ML : 53.0 mm, Class interval : 2.0 mm
Fig. 28a Length frequency distribution of B. spirata during 2001
fee T it T T T
__.=[fl1=.._
_=n3n1._
_=r:l]Il==.
_D411jlm____lZ‘ij]:|_|:ElI|=_=_
___=i:l:l1m==_
......-==lIl]:i=.
_¢dj]Il=.
‘icon...
T 50»?i rI; In .T a
l
I
48‘ .i
lT 39 f" it29*
10
L 8- [Jan l Feb ' Han ' Q1:>_r_-villas i Jun 0' nay ' Se? _i__9_Ql=ig'_'l7lbF ' Dec I
Smallest ML : 21.0 mm, Largest ML : 59.0 mm, Class interval : 2.0 mm
Fig. I!8b Length frequency distribution of B. spirata during 2002
94
B zeylanica of 40-60 mm (87.5%) supported the fishery through out the year
2002. The smallest animal observed in the fishery was 24.2 mm and the largest 68
mm during the study. Snails below 40 mm formed 4.7 % of 8IlI1Ll2ll landing and
above 60mm formed 7.7%. During the peak fishing season (April — June) 46-64 mm
length dominated the fishery (87.2%) and B. zeylanica above and below this range
formed 8.2 and 4.6% respectively. The smaller snails less than 40mm were
maximum during December (14.3%) followed by August (11.2%) and October
(10.3%), and in other months the presence was negligible or nil. Larger snails
(>60mm) fonned 25.5% during June. The monthly length frequency distribution of B.
zeylanica is shown in Fig. 29.
E541 iii l 411
Lenytlfig (MM)
33?
29
19f
gg B - ‘Jan 'Fe!>TFMa!\TF0Pr_Fi"lagjiIun=' .1111"? Rust W Sell?) 3 06$ l N00 1 Dee 1
Smallest ML : 25.0 mm, Largest ML : 67.0 mm, Class interval : 2.0 mm
Fig. 29 Length frequency distribution of B. zeylanica during 2002
4.10. Mean length
The annual mean length of B. spirata showed an increase from 37.4 mm in
2001 to 40.1 mm in 2002. The monthly mean shell height of B. spirata was greater in
2002 than in 2001 (Fig. 30). The mean shell height of the fishery attained a
maximum in June and smallest was observed in August for both years. This indicates
that the main recruitment to the fishery is in August. The multiple cohorts observed
in the population supports that B. spirata is a continuous breeder with peak breeding
seasons.95
6()__
40DC]
I}?__._U?_‘ '_
DCliigii—c1
Cl
___Ui__ZU€__
D4
Cl
U
CIQ_____U__
Cl
2O‘Jn NM; J F! ;\iMiJ'AiS‘OBN’D2(I)1 2G)2Fig. 30 Variation in monthly mean length of B. spirata for 2001 and 2002
The annual mean shell height of B. zeylanica in 2002 was 49.9mm. The
highest mean length was observed in June and the least was in October (Fig. 31).
U__
U
-r__\>a _ -W--7-i@_a€_4
_§,_
__% iiI
B
J
~~- % +~~- n § 1 1 l 1 r IF M A M J A S Q N D
Fig. 31 Variation in monthly mean length of B. zeylanica in 2002
96
4.1 1. Growth
The shell length of B. spirata and B. zeylanica ranged between 21 to 58.9 mm
and 25.5-66.9 mm respectively in the samples. Size frequency of B. spirata and B.
zeylanica exploited along off Kollam during the study is detailed in section 3.8 and
Fig. 28a & b and 29. Using this data, a preliminary estimate of asymptotic length
(L00) was obtained by Powell and Wetherall method (1986) as 58.5 mm for B. spirata
and 65.9 mm for B. zeylanica.
The Loo thus obtained for the 2 species used for further analysis of length
frequency data in ELEFAN I for estimation of growth parameters. The preliminary
estimates of K values obtained in scan of K values for B. spirata and B. zeylanica
were 1.2 and 1.0 respectively.
The analysis also gave the estimation of (D (growth perfonnance index) 3.61
and 3.64 for B. spirata and B. zeylanica respectively. From further analyses in
Response surface analysis and Automatic search routine, the best fitting (with high
goodness of fit) growth curves were selected. The Loo was estimated at 68.7 and K at
1.08 for B. spirata. The corresponding growth curve with L/F data is shown in Fig.
32a & b.. 68 _
.~., _ _ . . . . . . ." " rpg _|? sa. §.--iW . L *a .w . k‘ E . E ~ _. 1 I an m =I a Q
‘“_ *‘“‘”‘iI T7.‘ “in?‘:1
ll 9 9 3 7---""' B" 6 in1. 203' y 3 A l1: '7"€ -“F1 u -—"1a+ IM".. ~>$7'°‘.-‘P. ll -"$0.r ll ,,,-",
i Jan Fish Mar arr» Has Jun Jul has Sn fiat rm Den
Fig. 32a. Growth curve of B. spirata fitted to length- frequency data using L... - 68.7mm,K - 1.08, Starting length 36mm (Rn = 179)
97
Taff
run)‘
3 191'
T T T 1
an/eaB‘ its t-6 " 1 _ 'l t ‘ -6 I | ‘ ‘Jan Feb Mar Ber Hay Jun Jul Buy Sep " Oct Nov Dec
Fig. 32b. Growth curve of B. zeylanica fitted to length- frequency data using L.,@- 76,K - 1.15, Starting length 44mm (Rn = 221)
Further, the growth parameters were estimated using Gulland & Holt (Fig.
33a&b), Munr0’s (Fig. 34a&b) and Faben’s (Fig. 35a&b) methods in FiSAT
program. The von Bertalanffy growth parameters obtained in the different analysis
carried out are given in the Table- 28. The observed Lmx of B. spirata and B.
zeylanica were 58.9 mm and 68 mm respectively.
Table- 28 The Loo and growth constant estimated for whelk using different methods
B. spirataLoo k B. zeylanicaL00 kELEFAN I 68.7 1.08Gulland & Halt 70.91 1.33Munro's 70 1.33Faben's 56.2 :|: 6.6 1.97 :1: 0.77
76 1.1572.68 1.1358.64 3.64
66.2 1; 8.92 1.72 i 1.025
98
v
.77C.-\, '
-I
.2!
M"
//;”m“?\\s (,\
Q@%63?
0‘);r ' Q‘6
£fi“T&nmY§”
~ T\
(QL/fit)Growth rate
.174-—3 P2 2 .122
.139 @E @9'9
*\-v_,__w‘.\~ g. 134 — '“”7-~_\_~‘-N‘-K-.0 ~“”'”"'"-
.934 »;
I Ll: 2 I3 7 42 4?_l932Mean 1 ength
O ° 1 \
*2 fie ~ <06 .<>'Loo = 70.9 W114 = 1.98
Fig. 33a. Gulland & Holt plot fitted to .B. spirata
$8 ’ E -H.“-5 Q vw-v_w 0.,» guy ---»~ .-<-... J--5; cw-w. ~.--..w
5.1
3'4
Q1
\ _-"Q-{,.p
Z 5," Estimates:Loo
v 9*‘ s. e. {Loo}.. J K
w;;;;i;:
*4;‘$1
.3;
Ii? iff= s. e. (K)
\VU\
-4
' _ _ \ ,__,: .~.:v'~'-~ -""’°'°'..~.-=-W'
__w:_;..>¢
. ”%%_i% " V “%" % ._Brlative aw; (urav~t# )
I
66.22?8.9241321.025
' X
sf
i
l
‘.;.
<‘I
1‘:41‘nL.
ii‘I
it
§l
,
-1
wk
itA
F
1
l§_
N
4‘,
QL
Fig. 35b Faben’s plot fitted to B. zeylanica
100
_->
The parameters obtained in ELEFAN I is considered as most suitable because
the LOO obtained in Gulland & Holt and MLmro’s were much higher than the observed
Lam of B. spirata, where as in Faben’s estimate the Loo was less than L,,,a,,. In the case
B. zeylanica, the La. estimated by Munro’s and Faben’s method are lower than the
Lmax. The values obtained in ELEFAN I were substituted in the von Bertalanffy’s
growth equation for both the species as given below.
B. spirata L,=68.7 (1-e'1'O8("t°))B. zeylanica L,=76(1-e“'-““‘-‘<>’)
where, L,= length at time r; k = growth coefficient; t = age; to = age when length is zero.
Both the species appears to grow at faster rate and attains maximum size
within 3 years. The life span of B. spirata was calculated as 2.8 years using the K
value as 1.08/year and of B. zeylanica as 2.6 years when the K value is 1.15/year.
4.12. Fishery4.12.1. Gastropod Landing
Gastropods were landed through out the year, except during the month of July,
when trawl-ban was enforced by the Government of Kerala. The annual landing of
gastropods at Neendakara - Sakthikulangara was estimated as 780.6 t, 879 t and 659.8
t during the period 2001, 2002 and 2003 respectively. The estimated average annual
landing was 773.1 t. Gastropods formed 1.2% of marine landing at the center in 2001
and 2002 and 2.4% in 2003.
The estimated average monthly landing of gastropods for the three years
showed an increasing trend from January to reach a peak in May (Fig. 36). The
highest landing in May was estimated as 322 t, 301 t and 204 t respectively during the
period 2001 to 2003. The lowest landing (2 t) was observed in December 2003. The
monthly landing for the study period is given in Table-29.
The percentage contribution of gastropods to the total landing also showed
wide monthly variations. In June 2001, gastropods formed 17.29% of the total
marine landing while during the same year their contribution was as low as 0.15% in
August and January. In following two years, percentage contribution of gastropods.
ranged between 0.2 and 6.69 and 0.62 to l0.7 respectively (Fig. 37).101
Table- 29 The estimated total marine landing, landing of gastropods, B. spirata and B. zeylamca atNeendakara - Sakthikulangara harbour, Kollam, Kerala during the period 2001 to 2003
Months Total trawl Gastropods (t) B. spirata (t) B.zeyIam'ca (t)landing (t)
2001January
FebruaryMarch
April
MayJune
August
SeptemberOctober
November
December
Total
1950
3163
1734
1286
6572
568
18177
12298
7396
4826
7132
65102
3.0
22.0
20.0
160.0
322.0
98.2
27.0
39.0
34.0
32.4
23.0
Z39-.6.
1.4
9.0
12.0
16.6
1.2
9.2
8.0
11.2
9.8
13.5
11.2
103.1
0.1
0.3
0.9
85.4
157.5
49.9
1.3
1.0
2.3
3.9
2.7
305.1
2002
January
FebruaryMarch
April
MayJune
August
SeptemberOctober
November
December
T9!=!! 1
4258
4815
5745
5036
4721
1883
19754
11077
8697
3093
2376
71455
22.0
43.0
64.0
157.0
301.0
126.0
59.0
30.0
17.0
29.0
31.0
379;‘!
9.8
12.9
27.1
33.7
95.2
52.8
10.9
8.5
5.8
13.0
16.5
286.1
1.1
0.8
2.3
86.5
156.5
51.0
0.5
0.4
0.4
0.4
0.4
300.3
2003
January
FebruaryMarch
April
MayJune
August
SeptemberOctober
November
DecemberTotal
844
2330
777
2430
2015
1523
10273
1569
3361
325
2623
25.9
25.9
31.7
78.0
204.9
163.0
80.1
12.3
20.7
15.3
2.0659.8
15.1
11.4
11.2
18.6
24.4
42.0
17.6
2.5
9.3
8.3
9.5
0.3
0.6
0.4
38.2
146.2
98.0
0.2
0.2
0.3
0.4
0.4
_ 2169.9 285.3
102
1 gastropods300 _wne|k 90-—t—- °/o Of Whélk_/-~ 8C’250 e /I \_\/A’\“ / \ /A 7Q//I II,/ \ // /200 t ' so\ /\ » /‘
Fig. 36 Estimated average monthly landing of gastropods and whelk and the percentagecontribution of whelk to total gastropods landed at Neendakara-Sakthikulangarafishing harbour for the period of January 2001 to December 2003
20-9- 2001
1816 —I—— 2002—A— 2003
14
12
$10
8
6
4
20 4 __ _Jan Feb Nlar Apr May Jun Aug Sep Oct Nov Dec
Fig. 37 Monthly percentage contribution by gastropods to the total marine trawl landingduring the period 2001 to 2003 at Neendakara - Sakthikulangara harbour, Kollam
103
The effort was high during the post-monsoon period in all the years.
Maximum effort (22993 units) was recorded in August 2001 and the minimum 1455
units in November 2003. The average CPUE for gastropods was 14.1, 9.8 and 13 kg
during 2001, 2002 and 2003 respectively. _CPUE of gastropods also showed monthly
variation and was highest during June in 2001 and lowest during January in 2001.
Monthly effort and CPUE are given in Table-30.
4.12.2. Estimated whelk landing at Kollam
Two species of whelks, Babylonia spirata and Babylonia zeylanica were
landed in the commercial trawl catches at Kollam and the landing data of these two
species was pooled and considered for estimating the total landing of whelk. The
average estimated whelk landing for the period 2001-2003 was 487 t contributing to
62.5% of the total gastropod landing. During the study period the annual catch was
lowest at 419.4 t during 2001 and highest at 586.5 t during 2002 indicating an
increase of 28.5% within a year. This was followed by a decline of 22.4%, when the
catch dropped to 455 t in 2003. The total whelk landed contributed to 53.7%, 66.7%
and 67.1% of the gastropods landed at Kollam during the years 2001, 2002 and 2003
respectively. The monthly percentage contribution of whelk to the total gastropods is
shown in Fig. 38.
Monthly variations in whelk landing showed a similar pattern as that of
gastropods. The landing were low during the post-monsoon period but showed an
increasing trend during February to May in all the three years. The highest estimated
monthly landing of whelk in each year during the period 2001 to 2003 was 169.9 t,
251.6 t and 170.6 t respectively. However, the highest percentage contribution of
whelk during the period did not coincide with the peak landing except in May 2002,
when the whelks formed 83.6% of the gastropods landed. In the year 2001, the whelk
contribution to gastropod landing was highest (64.7%) in June and in 2003, the
highest contribution of whelk was recorded as 85.9% in June. Though whelk formed
more than 50% of the gastropod landed in 15 months of the 33 months observation
period, their contribution was low, less than 25% of the gastropod landing in August
2002 and 2003.1 04
Neendakara - Sakthikulangara harbour, Kollam, Kerala during the year 2001- 2003Table- 30 Total whelk landed, effort expended and catch per unit effort of Gastropods and whelk at
Whelk (kg) Effort CPUE of CPUE_(no. of units) whe_1_1§__(kg) __ 7 Gastropods (kg)
2001
January
FebruaryMarch
April
MayJune
August
SeptemberOctober
November
December
Average __ __ _
1468
9300
12944
101924
169912
59050
9250
12180
12085
17356
13880
38123
4586
6846
5276
5556
7324
1620
22993
12468
11954
7665
10383
8788.3
0.3
1.4
2.5
18.3
23.2
36.5
0.40
0.98
1.0
2.3
1.3
8.0
0.7
3.2
3.8
28.8
44.0
60.6
1.2
3.1
2.8
4.2
2.2
14.1
2002
January
FebruaryMarch
April
MayJune
August
SeptemberOctober
November
December
Average
10900
13674
29423
120261
251696
103729
11390
8800
6220
13424
16902
53310.8
7358
7926
9359
9236
10112
4392
17126
11101
10659
8101
5375
ggjigflfi
1.5
1.7
3.1
13.0
24.9
23.6
0.7
0.8
0.6
1.7
3.1
6.8
3.0
5.4
6.8
17.0
29-.8
28.7
3.4
2.7
1.6
3.6
5.8
9.8
2003
January
FebruaryMarch
April
MayJune
August
SeptemberOctober
November
DecemberAverage
15404.0
11955.0
11669.0
56776.0
170624.0
140005.0
17831.0
2681.0
9570.0
8730.0
9383.0
41375.3
2603
5136
3571
6936
6547
3339
14666
5293
4537
1455
39105272.1
5.9
2.3
3.3
8.2
26.1
41.9
1.2
0.5
2.1
6.0
2.59.1
9.9
5.0
8.9
11.3
31.3
48.8
5-5
2.3
4.6
10.5
5.213.0
105
4.12.3. Estimated landing of B. spirata and B. zeylanica
Both, B. spirata and B. zeylanica were landed in all the months except during
July when there was a ban on trawl operations (P1. 6a & b). The estimated monthly
and annual landing of both the species during 2001 to 2003 is given in Table-29. The
armual landing of B. zeylanica was estimated as 305 t, 300 t and 285 t during the
period 2001, 2002 and 2003 respectively, while the annual landing of B. spirata was
114 t, 286 t and 169.8 t during the corresponding period. B. zeylanica formed more
than 50% of the whelk landing with contributions of 72.8%, 51.2% and 62.7% during
the three year period.
The estimated monthly landings of B. zeylanica followed the same pattern for
the 3 years. The monthly average of B. spirata and B. zeylanica are shown in Fig. 39.
B. zeylanica dominated whelk landing contributing to 61% of the annual average
landings and the rest by B. spirata (39%). However the monthly landings showed
variations throughout the year in all the 3 years. The landing of B. zeylanica ranged
from a low of 63 kg in Jan. 2001 to a high of 157.5 t in May 2001. The percentage
contribution varied from a low of 1.3% in August 2003 to a maximum 92.7% in May
2001. B. zeylanica dominated the fishery during April to June. The catch was
negligible during the post-monsoon months.
Monthly landing of B. spirata ranged from 1.4 t to 16.5 t in 2001- and in the
following year, the landings were higher ranging from 5.8 t to 95.1 t. In 2003, the
landing of the species decreased and ranged between 2.4 t and 42 t (Table-29).
The average estimated CPUE for whelk was 8, 6.8 and 9.1 kg during the
period 2001, 2002 and 2003 respectively (Table-30). The CPUE showed wide
monthly variations, ranging from 0.3 in January to 36.5 in June 2001; from a low of
0.6 kg in October to a maximum of 23.6 kg in August 2002 and 0.5 kg in August to
41.9 kg in June during 2003. In all the years maximum recorded CPUE was during
June.
106
—¢— 2001
—I— 2002
—:— 2003
1 00
90
so
70
so
$ sc»
4-1:
so
2-3»
1 0
Q1“:
Jan Feb Mar Apr May Jun Aug Sept Oct Nov Dec
Fig. 38 Monthly percentage contribution by whelk to the total gastropod trawl landingduring the period 200] to 2003 at Neendakara - Sakthikulangara harbour,Kollam
160El B.spirata140 I B. zeylanica
120
100
80
60
40
20
0E1_E|_U_
Jan
Feb
Mar
Apr
May
Jun
Aug F]
Se Fl
Q P
Nov F:
Dec Fl
-0-I -0-IQ. O
Fig 39 Estimated average monthly landing of the B. spimta and B. zeylanica landed atNeendakara-Sakthikulangara fishing harbour during the periodJanuary 2001 to December 2003
I07
PI. 6a. Commercial landing of Babylonia spirata at NeendakaraSakthikulangara harbour
PI. 6b. Commercial landing of Babylonia zeylanica atNeendakara- Sakthikulangara harbour
During the peak season (April-June), 20 to 40 boats were engaged in
exclusive fishing of whelk. The CPUE in the modified trawlers targeted for whelk
fishing was observed to range from 250 to 500 kg with an average of 400 kg.
The modified gear used for targeted fishing is a two seam high opening trawl.
The net has an upper and lower jib, wing, broad belly, throat and a cod end with mesh
size 40 mm. The head rope is having a length of around 22 m with floats. The foot
rope is having a length of 26 m and is attached with 200 lead weights of 200 g (Pl- 7).
Polyethylene rope of 14 mm diameter is used as trawling rope. The belly region of
the net has a mesh size of 60 mm with 185 meshes in depth. The throat with 150
meshes depth is made of 50 mm mesh size. The material used for making the net is
polyethylene twine having a diameter of 1.25 mm except for cod end. Polyethylene
twine of 1.5 mmiis used for the cod end. The cod end is of 150 meshes in depth. The
net weighs about 20.5 kg without the lead weights. V-type otter boards are used in
whelk trawls. The gear is operated in 15-30 m depth along north of Kollam coast for
B. spirata and at 25-40 m depth of south coast off Kollam for B. zeylanica.
The fishing starts in the early morning for B. spirata, the trawlers depart
around 6 o’clock in the morning and return by noon. There are 3-4 crew members in
each unit. The hauling is done for 5 to 6 times a day depending on the catch. Each
haul takes about 15 to 30 minutes. B. zeylanica is fished in the night hours. The
trawlers depart by 6 o’clock in the evening and come back by 6 to 8 in the morning.
The net is operated in medium sized trawlers of 13.6 to 16.6 m LOA to larger
trawlers of 18.5 m LQA_ The trawlers are equipped with 124 hp and 177 hp engines
respectively. Because the net weighs more than the normal trawl, the hauling of the
net requires more power and is operated at the maximum efficiency of the engine.
4.12.4. Probability of capture
Probability of capture of B. spirata and B. zeylanica by the trawl net was
estimated. The values L-25; L-50 and L-75 estimated are the average shell length at
108
Pl. 7. The modified foot rope of shrimp trawl net for whelk fishing
which 25%, 50% and 75% of animals are retained in the trawl nets. The values were
33.06, 35.2 and 37.09 mm respectively for B. spirata (Fig. 40). The estimated values
of L-25; L-50 and L-75 for B. zeylanica were 39.74, 41.7 and 43.52 mm respectively
(Fig. 41).
llll .+1.Y.5 . I -,- .-v~-,"..-...-.-Q---..»' l. lll .9- z.
bf capture
W_t,_
ll l ‘I _ .‘ll '7 F l lH 1.453-5 V . 1U -;3?
Prbbabi '1 5; ts
it "1..
W .2 ;- 335 § 12 1ai 5 -""" 2 _ l \l I i _ F _ 2__T.I .................. ..., llI..i1Ti§;.'.525%;-1!=%1£Z';'3I;.'.T.£f.'.!2.¢-;.5':7§:.7l.<.'. --l ......_.1.L;.‘:;;:. .;2I.+.1;t 7 21 25 29 " ea. 3?&~ Length classes-(an)1 ; .ill .L-25: 33 mm, L-50: 35.2 mm, L-75: 37.1 mm
Fig. 40 Probalility of capture of B. spirata
_ __ _ _ 1.3 r .
Ihoodoalailziiu; f 1caq?tuu0e
o§-E~.>E».1=-L»1B~l.1E==L=»=— 1 r——r—| | ‘e P"t' 0
NU1
N'-.0
WU
OJ'4
ah
*-L
i i i i i i i 4 i i i i 4 i i i i i 1‘I
I lll. ‘ ;
\-u- ,,11 __1__. - | 1 _'_I%A __ 2 I .._:1 n _
45I Length classes (nu)l ._ .. .- -. .2 _L-25: 39.7 mm, L-50: 41.7 mm, L-75: 43.5 mm
Fig. 41 Probability of capture of B. zeylanica
l09
4.12.5. Mortality coefficients
The total instantaneous mortality coefficient (Z)
The estimated values of ‘Z’ by Brey’s equation were 6.05 and 5.02
respectively for B. spirata and B. zeylanica. The ‘Z’ estimated by length converted
catch curve method was 8.4 and 4.26 for B. spirata and B. zeylanica respectively.
The instantaneous natural mortality coefficient (NI)
The instantaneous natural mortality coefficient (M) estimated by Brey’s
(1999) equation as 1.61 and 1.65 for B. spirata and B. zeylanica respectively, where
as the values were 2.88 and 3.37 respectively using Pauly’s (1980) equation.
The instantaneous fishing mortality coefficient (F)
The mortality coefficients Z and M estimated using Brey’s equation were
taken for further analysis of fishing mortality coefficient and the values obtained were
4.44 and 3.37 respectively for B. spirata and B. zeylanica.
4.12.6. Relative Yield-per-recruit (Y ’/R)
The relative yield-per-recruit (Y/R) and biomass—per-recruit (B/R) were
determined as a function of 1./¢/Lu, and M/K respectively. The Lc/L... and M/K at Ema,
for B. spirata were 0.512 and 1.074 respectively. The Fig. 42 shows the maximum
allowable limit of Y’/R for the study period. The present exploitation rate (0.73) has
exceeded the optimum exploitation rate Emax (0.68). The Em and E05 obtained were
0.6535 and 0.3681 respectively.
The Le/L... and M/K at Emax were 0.548 and 1.435 respectively for B.
zeylanica. The Fig. 43 shows the estimated values of Y’/R and B’/R for the study
period. The present exploitation rate E (0.71) has almost attained the optimum, E
max (0.77), where as the Em was 0.717 and E05 0.3769.
110
El. ,.ee.-e14.-Mm... (1o*~2">“1- no w 4:. 0| 0- 4 no
h»h~huh¢bmh@h¢hehwI
I
s
i
2
I
I
I
- -....-,...L:_- .3”: _- _ ...._
T
R
UO
_.z5 L5--
Qon
E Exploitation rate1
§\\
4
i:
U.:\ '.
i
1 I1
3 \
‘ .
J
1
,9.-'8?
5/recruit
.?¥
.6}
.5.
bionas
i
.21\
E
B .25 .5 .75 '1Exploitation rate
Q P5
++
__ .g_........_.... I
uptlmaiEma»: I£--.1E-.5:
B. 6828B. 55350.3681
Lc/LooM/RQ.
Q
1K’
I 8.511.8?
Fig. 42 Relative yield-per-recruit of B. spirata
yie d r mu t (10(0 uh
U'|HUlNlJIwU|;hU‘lU‘lU1O\
*2)
i-1-ijiii--mi
Ul
iI ecm
1
III
its
IZ0K _ . _ I.25 .5 .75
Exploitation rateA
1
‘L
er
1
I 9 h
I 8 .
biomass/recruit
I-N
? \.6.5»j————-—A4.I3‘,
.-I00:
A ,___ I1 .an .25 .5 .75 1Exploitation rate
°B.E£“iE—.1 : B.?1'?B H/KE—.S : 8.3769
B . 7738 Lc/Loo 8.551.43
Fig. 43. Relative yield-per-recruit of B. zeylanica
lll
4.12.7. Length Cohort analysis
The result of length cohort analysis of B. spirata for the 2 years, 2001 and
2002 pooled, showed that the ‘delta t’ increased from 0.04 in 20-22 mm size class to
1.25 in 58-60 mm size class (Table-31). Fishing mortality (F) increased to a
maximum of 5.98 in the length class 40-42 mm and the maximum exploitation (79.8
t) was in the size class 38-40 mm. The catch constituted mainly of 38-40 mm size
class. The biomass increased from 11.9 t in the size class 20-22 mm to the maximum
(22.3 t) in the size class 32-34 mm and gradually reduced to 0.3 t in 56-58 mm. The
total yield of B. spirata estimated was 423.26 t and standing stock was 216.15 t for
the 2 years. The spawning stock biomass was estimated as 92.87 t and the number
recruited were 84565.
Table- 31 Results of length cohort analysis (LCA) for B. spirata
Lower limit TimeLength Interval
Population Fishing Average AverageNumbers mortality Number biomass
Neogastropoda is a diverse group comprising of carnivorous whelks that are
scavengers and predators distributed from the intertidal to the abyssal zone in all the
oceans (Martell et al., 2002). In the present study, B. spirata was found to be distributed
in the region from 5-30 m depth in the region north of Kollam, while B. zeylanica was
found only in deeper sites more than 25 m depth in the southem region. Similarly, B.
spirata occurs in the 5-25 m depth region off Pondicherry and Porto Novo coast
(Ayyakkannu, 1994; Chidambaram, 1997). However, along the Tuticorin coast,
Selvarani (2001) has reported on the occurrence of whelks in deeper region. In the
present study B. zeylanica abundance was more in deeper regions. The 5 to 30 m zone
along the southeast lndian coast has supported the fishery of several commercially
important gastropods apart from the whelks. Chank distributions in Gulf of Mannar were
found to be similar to the whelk distribution, in 10 to 20 m zone with sandy bottom
(Homell, 1922) and in the Palk Bay chanks were found to occur in depths up to 12 m and
along Coromandel coast at depths varying from 6 to 20 m. The chank fished off the coast
of Trivandrum and Kanyakumari districts are also from the same depth zones (N ayar and
Mahadevan, 1973). However, in the Gulf of Kutch they are found to inhabit
comparatively shallower regions (N arasimham, 2005).
In the present study B. spirata and B. zeylanica were never found to coexist.
Though the faunal composition of benthos was basically the same, viz, dominated by
polychaetes, the two habitats were different in sediment texture. Consequently the
benthic faunal composition, with respect to the species of polychaetes and other minor
invertebrates was different in the two sites. One significant variation was the higher
contribution by sipunculids at the B. zeylanica beds. Laboratory studies related to feed
preference of adult B. spirata and B. zeylanica have shown that they are not active
predators. Hence, it can be presumed that it is the preference for a specific substratum,
viz, sandy substratum by B. zeylanica and more silty by B. spirata rather than the feed is
the causative factor for the heterogeneous population distribution. An almost similar
observation was made on the population of two marine mud snails Hydrobia ulvae and H.
114
ventrosa which are common in littoral muddy sediments and which partly coexist in a
homogenous habitat (Grudemo and Bohlin, 2000). However, along the Swedish coast, H.
ulvae dominated coarse grained sediments and H. ventrosa in fine grained and their
distribution was correlated to sediment type (Grudemo and J oharmesson, 1999).
In the present study B. spirata were found to prefer silt and showed negative
correlation with sand and B. zeylanica were observed only in sandy beds. However, B.
spirata and B. zeylanica were not observed in the same depth zone along south Kerala
presumably because of the different sediment texture. Occurrence of B. spirata and B.
zeylanica in the coastal zone off Kollam can be mainly due to the sediment structure.
Based on a study on distribution and relationship to mean grain diameter, silt-clay
content, abundance of dead shell materials and feeding type of 39 molluscan species
Driscoll and Brandon (1973) have found that the factors most clearly correlated with the
distribution of these species were the clay content of the sediment, abundance of dead
shell material and substratum stability. In the laboratory B. spirata and B. zeylanica have
been found to burrow in the substratum with only the probosis extended to the surface of
substrata. The soft bottom nature of the study area could be supporting the burrowing
behavior of B. spirata and B. zeylanica. The type of substratum in this geo-location has
been studied in detail by several oceanographers (Veerayya and Murty, I974; Varshney,
er al., 1988; Prakash, 2000).
Prakash (2000) has found that the shoreline changes its orientation from 290° to
350° N at Thangasseri headland. This demarcates the coast south of Thangasseri as
southem shelf and north of it as northem shelf. Most of the area is covered by sand and
silty clays while fine-grained ones (clay) occur in the northem most shelf. The southem
shelf is entirely covered by sand. Also, there are a few sandy patches off Chavara and in
the outer-innershelf of the northern shelf. In the present study also the sediment texture
has been found to be similar to that reported by Prakash (2000). The distribution of the
principal modes of coarse fraction demonstrated that the area is covered by fine to
medium sand category. In the same study he has found that the southem shelf was
carpeted by medium sand of moderately sorted nature whereas the outer-innershelf was
I15
dominated by moderately to poorly sorted medium sand. The rest of the shelf is covered
by poorly sorted silt and clay. In general, the sediments were found to be getting
progressively finer towards the northem side. High percentage of sand in the southern
shelf is attributed to the absence of estuaries or backwaters which trap coarser sediments
(Hashimi, er al., l98l). In addition, the winnowing action of waves aided by the steep
bathymetry might be another reason for high concentration of sand in the southern shelf
region. The high percentage of fine sand in the Cochin-Quilon region is the result of
trapping of coarse sediment by the Vembanad Lake near Cochin (Veerayya and Murty,
1974) and Ashtamudy backwater near Quilon (Rao, 1968). South of Quilon, rivers
comparable to, for example Periyar are absent, hence the percentage of fineness decreases
sharply and sand becomes the most prominent sediment type on the shelf (Harkantra er
aL,l980)
The TOC of the soil was found to be positively correlated to B. spirata
abundance. This can be related to their feeding habits. In a laboratory experiment during
the present study B. spirata of length >20 mm were not active predators, rather they
accepted dead meat of slnimp, fish, mussel and polychaetes. The whelk beds along
Kollam coast are trawling grounds and it is possible that whelks are exposed to ample
quantity of small fishes and crustaceans destroyed due to trawling, which can form their
food. The dead and injured fauna left on the sea floor or exposed in trawl tracks aid the
addition to the benthos of offal and dead moribund by-catch increases opportunities for
mobile scavengers/predators (Kaiser and Spencer, 1994; Kaiser and Ramsay, 1997).
Among the hydrographic parameters there was no significant correlation between
temperature, salinity and nutrients with the abundance of whelk. The variation in salinity
and other parameters were not pronounced when compared to the near-shore areas of the
same coast. B. spirara has been reported to be stenohaline, with salinity <19 ppt causing
high mortality (Patterson, 1994). Such low salinity conditions do not occur in the present
bed, since the sites are away from the points of freshwater discharge areas from the land.
116
The population changes of Nassarius reticulatus in Sweden has been found to be
highly influenced by the variation in temperature (Tallmark, 1980). In the field he had
observed that the different activities of the snails like, locomotory activity, inshore
migration, spawning, growth, offshore migration and quiescence in different years were
commenced at the same water temperature but in different dates. The threshold
temperature could be narrowly defined. For instance, the snails taken to the laboratory
before spawning were held at 10° C and they did not spawn for 30 days in this
temperature but at l2° C they started copulation within 2 days and produced egg capsules
after another 3 days (Tallmark, 1980). In B. spirata also, temperature was found to
influence the early development stages which was observed in the CMFRI hatchery as
part of the ICAR AP Cess funded project on Babylonia spp. However, direct observation
in the field was not possible.
Apart from the specific substratum dependent zonation of B. spirata and B.
zeylanica there was variation in density or abundance of the whelk within the specific
beds. Similar variation in distribution between two gastropods of commercial
importance, T rochus niloticus and Turbo marmoratus has been observed in Andaman and
Nicobar Islands (N ayar and Appukuttan, 1983). T. niloticus occurs in the intertidal and
mangrove area where they congregate undemeath rocks and coral boulders while, in the
same area T. marmoratus occur at depths of 12 to 25 m and rarely in shallow waters.
Distribution and abundance of coral reef associated herbivorous gastropods has been
related to density of micro-algae present, variation in physical and biological factors such
as desiccation and predation (Ompi, 1994). Soemodihardo and Kastoro (1982) found
more than 10 species of the genus Turbo distributed on various substrata at varying
densities from the intertidal to deeper waters.
The density of Stramonita (Thais) haemastoma, was low along the Israeli
Mediterranean coast (Rilov et al., 2001) compared to that of a subspecies S. haemastoma
floridana in the Gulf of Mexico, where in the intertidal habitats tens to hundreds of
individuals per m2 have been reported (Butler, 1985; Richardson and Brown, 1990).
Comparatively higher density of B. globulosum was found along the coast of Argentina.
I17
The distribution of benthic organisms has been found to be related to local enviromnental
factors, food availability, predation and competition (Ompi, 1994).
The distribution and abundance of whelk in the fishing grounds off Kollam has
been studied by seasonal experimental trawling and sampling in the fishing grounds as
the information is vital in fisheries management. The size distribution of whelk,
observed in the experimental trawling well represented the commercial fishery landings.
The population of both B. spirata and B. zeylanica skewed to large sized snails. The
length composition of B. spirata and B. zeylanica was different within their respective
populations in the study area, with B. spirata having different size groups of whelks in
the population. However, the occurrence of small sized B. spirata was low and young
ones of B. zeylanica were absent in the population in all the samples. The absence of
small size B. zeylanica and continued occurrence of large sized whelks in population was
conspicuous. In the fishery also, the percentage of small sized whelks were very less
through out the period of study. The presence of large whelks in the population indicates
a stable condition. Rilov et al. (2001) also found the population structure of whelks
skewed to large individuals in the Israeli Mediterranean coast. Small individuals were
absent through out the five year of their study, but mean whelk size increased. The
authors have suggested that the results imply impaired recruitment of whelks. Similarly
the size distribution of Nassarius reticulatus in the population in Gullmar Fjord, Sweden
showed absence or low number of small snails in deeper sites (Tallmark, 1980).
However, larger proportion of small snails occurred in some years in area outside the
Bay, which is shallow and richer in detritus.
Tallmark (1980) has made an extensive study to understand the variation in
population of the dog whelk, N. reticulatus, in Sweden. He found that settling of young
ones (recruits) took place only in areas with high organic matter and that metamorphosis
of larvae depends on the substrate and that detritus is the main food during the first three
years. Tallmark (1980) has indicated that the dog whelks change their diet with growth,
with larger whelks preferring carrion, while the younger ones feed on detritus. The larger
snails gathered around dead and dying fishes, crabs and bivalves stranded in shallow
118
water. Kohn (1961) has commented on the chemoreception of gastropods. Even
extremely low concentration of a certain glycoprotein from oyster fluid (1040 molar)
induced a 50% response in N. obsoletus (Gun-in and Carr, 1971).
Differential distribution of different size groups of a species in a geo-location has
been reported (Martin et al., 1995; Valentinsson et al., 1999). The muricid gastropod,
Bolinus brandaris showed a size distribution that correlated slightly with depth. The
small and medium sized specimens were found distributed in 3 to 25 m depth, while
larger one (>65 mm SL) were found from a depth of 20 m and were even absent in hauls
made in a protected zone at <15 m (Martin et al., 1995). Based on these results the
authors inferred that this species carries out an ontogenic migration towards deeper
waters. The fonnation of groups prior to spawning has also been reported (D’ Asaro,
1970). Similarly, size frequency distribution of common whelk, Buccinum undatum, was
markedly different between areas in the Swedish waters with larger individuals more in
deeper waters (Valentinsson et al., 1999). Similarly, in the present study also the young
ones must be settling in the inshore waters rich in detritus and which are more productive.
During the year 2005, some small whelks were observed in the pots kept for lobster
fishing in the near shore area. But continued occurrence was not observed. Enquiries
with fishermen also indicated that small whelks are not fished in the trawl grounds.
The variety and abundance of benthic fauna is determined greatly by the physical
and chemical structure of the substratum (Kimie, 1972). Small scale variations of benthic
distribution are attributed to sediment grain size, organic matter content etc. (Parsons, er
al., 1979). Along the Indian southwest coast, Harkantra er al. (1980) also found higher
organic carbon in fine substrate of clay and silt than sandy substrata. The community
structure and the dominant groups of the benthos observed in the present study are found
to be similar to their observations. Wijnsma et al. (1999) observed that in the tidal flats
and shallow inshore waters of the Banc d’ Arguin, in Mauritania, West Africa,
polychaetes were the most diverse group with 42 species belonging to 20 families.
However, they found that the total density was independent of any sediment
119
characteristic, probably because of large range of species. However, densities of
dominant species did show a correlation with sediment size.
In the bathyal (154-3400 m depth) macrofaunal community in the North Atlantic,
Eastern Pacific and Indian Oceans, latitude, sediment-organic carbon content and bottom
water oxygen concentration were the significant factors that together explained 52-87 %
of the variation in species richness (E(S100)), Shannon-Wiener Index (H’), Dominance
index (D) and evemiess (J ’) (Levin and Gage, 1998). In the shallow coastal waters also
annelids were the most abundant and depth, sediment grain size and sediment organic
matter content influenced the abundance, distribution and composition of benthos.
Temperature had no effect (Melake, 1993).
Apart from Babylonia spp, the whelk bed had rich resource of other gastropod
fauna. The co-occurrence of gastropods like, Bursa, Tibia, Natica and Conus in high
numbers in this region indicates the richness of the molluscan diversity.
The number of species of molluscs obtained in the experimental trawling from the
whelk bed was much lower than that obtained in the commercial trawls presumably
because of the low hauling duration and restricted fishing area. However, both results
indicate the rich molluscan diversity of the region. Similar rich molluscan fauna with
almost similar feeding habits (scavenger/preying) has been observed in other regions
along the Indian coast (Kasim, 1988; Ramesh er al., 1996; Jayabaskaran er al., 1996;
Murugan and Edward, 2000). In the present study the diversity index H’ was 2.145 with
an average number of 22 species. Kohn and Nybakken (1975) studied the diversity of
species of eastern Indian Ocean fringing reefs and found, number of species (S) as 15 and
species diversity (H’) as 2.3 in the most heterogenous habitat type, namely the
topographically complex subtidal reef platform. On subtidal reef platforms with large
areas of sand substrate and less coral limestone, mean values were S=lO and H’ = 1.6.
Whelk formed an important component of the shrimp trawler by-catch even a
decade back (Appukuttan and Philip, 1994). Apart from these resources, several
120
finfishes, crustaceans, molluscs, echinoderms and holothurians were recorded in the by—
catch landed at Sakthikulangara-Neendakara harbour in the present study. These
resources showed wide fluctuations and percentage contribution as well as the occurrence
of different species in by-catch varied during both the years. The Environmental Justice
Foundation, London (Annon, 2003) reported that shrimp trawling contribute to the
highest level of discard/catch ratio of any fisheries ranging from 3:1 to 15:1 and the
amount of by-catch varies in relation to target species, season and area.
In the present study juveniles/undersized crabs and cephalopods were observed.
Similarly, shrimp trawl by-catch in Visakhapatnam was found to have 25-30% of
juvenile shrimps (Rao, 1998) and he estimated the discard from Visakhaptnam coast as
2,00,000 tonnes. Kurup er al. (2003) have estimated the discard along Kerala coast as
2.62 and 2.25 lakh tones during 2000-Ol and 2001-02 respectively and they have
attributed the reason to the use of very small cod end mesh size against the statutory mesh
size of 35 mm prescribed by the Govt. of Kerala. Menon (1996) has also recorded high
diversity in the by-catch landed by trawlers in Karnataka, Kerala and Tamil Nadu. He
has also observed the occurrence of young ones of several fin fishes and cephalopods.
The trawl net being an efficient but unselective fishing gear with a small cod end
mesh size captures numerous small-sized species as well as juveniles of larger species,
compared to any other fishing gear. The increase in prawn landings in Kakinada, Andhra
Pradesh, during 1970s had been due to the gradual reduction in cod end mesh size of
trawl nets which, ultimately resulted in the reduction of average size of the prawns. The
quantity of juveniles and sub-adults in the by-catch depends upon the type of trawl net
used. In the south Indian states, an annual average of 6200 t of juveniles/young fishes
was recorded to be landed by trawl nets. The annual economic loss generated due to
catching of juvenile fishes by a single trawler in Kerala coast was estimated as 28.3 lakhs
(Bijukumar and Deepthi, 2006).
Crustaceans were the major group observed in the by-catch at Neendakara
Sakthikulangara. Kurup er al. (2003) have reported that in the discards of bottom
121
trawlers in Kerala crustaceans were represented by 8 species of shrimps, 2 species of
stomatopods and 12 crabs. Bijukumar and Deepthi (2006) have reported higher diversity
of crustaceans (4 species of prawns,42 species of crabs, 5 species of stomatopods, several
species of hermit crabs and 3 species of lobster) in the trawl by-catch of Kerala including
both discards and by-catch of trawlers. During the monsoon period high catch rates of
Charybdis smithii up to 1200 kg/haul, has been observed off Cochin. In general, they
have reported the catch per hour for crabs as 48 kg and the catch-per-unit as 450 kg and
the CPUE for C. smithii was computed as 395 kg/unit. Crabs were found to be the major
crustacean resource during June and in the present study also crabs were observed in the
by-catch.
The stomatopod, Oratosquilla nepa has been found to be a major component of
the by-catch during the period of study. This species is distributed up to 75 m throughout
the Kerala coast with higher abundance in north Kerala (Kurup et al., 2003). However,
considerable variation has been found in the quantity and percentage contribution of
stomatopods in by-catch. Squilla accounted for 81% of the annual landing of trawlers in
the southem region of India during 1985-90 (Menon, 1996) while in the recent years
(2000-02) the percentage contributed by this resource was found to be low 15 to 18%
(Kurup er al., 2003).
In the present study it was observed that shrimps formed nearly 43% of the by
catch at Sakthikulangara-Neendakara harbour. Sukumaran et al. (1982) made an
appraisal of the trawl fishery of Kamataka based on data obtained from Mangalore and
Malpe during the fishing seasons 1980-81 and 1981-82, and recorded that shrimps
represent only 13% of the annual average trawl catch. The trawl by-catch was as high as
85% during this period.
The quantity and the species contributing to the fintish resources landed as by
catch showed seasonal variation in the present study. Kurup er al. (2003) have reported
considerable higher number of finfish species (103) from the entire coast of the state and
Bijukumar and Deepthi (2006) have recorded more than double the number of finfish
122
species from the trawl by-catch and discards of Kerala. Silver bellies, flatfishes, goatfish,
sciaenid and other small sized fishes are landed through out the Indian coast. The
dominance of elasmobranches has been cited as a characteristic feature of the by-catch of
tropical penaeid shrimp fisheries (Hall, 1999). Teleosts have been found to dominate in
the prawn trawlers in the Gulf of Mexico (Nance and Scott-Denton, 1996). Ilona er al.
(2001) have observed that 82% of the trawl by-catch of Australian penaeid prawn fishery
was highly diverse with more than 350 species and dominated by species which occur
rarely (75% of species occurred in <10% of trawls) and in low abundance (<lOno h']) and
biomass (<lkg tr‘).
The utilization of the fin fishes landed as by-catch is a significant aspect of Indian
fisheries. In large trawlers performing multi-day fishing, the last day’s by-catch is
brought to the land and the larger economically important fish and shell fish in by-catch
are marketed fresh. Smaller variety or large species present in abundance (soles, lizard
fishes, anchovies, carangids, sardines, mackerel etc.) are either semi dried or salt dried.
George er al. (1981) have reported that the major quantity of sun dried fishes is used for
local consumption while some quantity is exported. During the present study it was
observed that all the fishes landed were utilized either after drying or in the icedcondition.
Molluscs formed the third major taxa represented in the by-catch of
Sakthikulangara-Neendakara harbour and were composed of species belonging to 21
genera. Several important species like, Sepia ellzptica and Sepiella inermis and Octopus
membranaceous were found to occur with Babylonia spp. They were landed in the
commercial catches also. The faunal diversity of gastropods was remarkable and the
population in the region off Kollam was heterogeneous comprising molluscs of important
families like, Bursidae, Muricidae, Fasciolariidae, Conidae, Strombidae, Olividae and
Cerithidae. Appukuttan and Philip (1994) have recorded 29 species from the same area.
Kutup er al. (2003) have reported 82 species of molluscs comprising 65 gastropods, l2
bivalves and 5 cephalopods from the entire Kerala coast while Bijukumar and Deepthi
(2006) have observed 140 species of molluscs from same maritime state. Menon (1996)
123
has found 23 genera of gastropods and 15 genera of bivalves in the trawl by-catch of
three states, Kamataka, Kerala and Tamil Nadu during the period 1985-90.
Malaquias er al. (2006) have found a different range of molluscan species in the
crustacean trawl (34 species) and fish trawl (24 species) operating in the same area in
Portugal. Twenty species were only caught by crustacean trawl, 10 species by fish trawl
and 14 species were common to both. In total there were 15 bivalves, 28 gastropods and
l polyplacophoran. They also observed that the crustacean trawl had impact on a
different range of molluscs species in winter/spring compared with the summer/autumn
period; where as the fish trawl seemed to impact a similar range of species all through out
the year. In the westem Mediterranean 92 species of mollusc (39 bivalve, 52 gastropod
and 1 scaphopod) have been found to be affected by trawling (Carbonell, 1997).
However, only few species are retained for commercial purposes.
The American continent (including South, Central and North America) contains
the principal gastropod fisheries of the world. They are concentrated in the Pacific
Southeast (Chile and Peru) and on the Pacific and Atlantic coasts of Central and North
America. The main fishery countries: Chile, Mexico, Peru and the USA, show overall
catches averaging over 5,000 mt annually throughout the past 20 years (with the
exception of larger catches in Chile from 1979-1988) (Leiva and Castilla, 2002). Multi
species abalone fishery of Baja California Peninsula and the highly diverse Peruvian
catches indicate that the gastropod beds are rich in species and the diversity is high.
Peruvian gastropod catches are characterized by high diversity of species, many of which
are reported by FAO (1998) as “non-identified species” (Leiva and castilla, 2002).
Another region where gastropod diversity has been visible is in Chile.
Gastropod catches in Chile include at least 20 different species, several of which
belong to the families Muricidae and Fisurellidae. Gastropod fisheries comprise 53% of
the total gastropod extraction in Chile and compose the group with the largest economic
value. The muricid gastropod Concholepas concholepas (“loco” or false abalone) has
historically been the gastropod with the highest levels of extraction and economic
124
importance in Chile (Hancock, 1969; Castilla and Becerra, 1975; Bustamante and
Castilla, 1987; Castilla, 1988, 1997b; Castilla er al., 1998). During the last two decades,
exportation of “loco” has generated revenues for Chile of over US$390 million
(SERNAPESCA, 1999). Other muricid species extracted commercially in Chile are (in
decreasing order of importance): Thais chocolata (caracol locate), Chorus giganteus
(caracol trumulco), T rophon geversianus (caracol Trophon), and Xanthochorus
cassidiformis (caracol rubio). These species are endemic to the southeast Pacific and the
Patagonian region of Chile and Argentina (Osorio er a1., 1979; Stuardo, 1979; Gallardo
and Gonzalez, 1994; Santana, 1997). The multispecies fishery of key-hole limpets,
which includes at least 10 different Fissurella species (Bretos, 1988; Oliva and Castilla,
1990, 1992), is also of importance. In 1998, approximately 3,000 mt of keyhole limpets
were extracted, representing 41% of the total gastropods fished in Chile that year
(SERNAPESCA, 1999). The rest of the gastropod extraction is composed of four species
of lesser importance: Tegula atra, Adelomelon ancilla, Odontocymbiola spp. and
Argobuccinum undatum. In the whelk beds off Kollam also highly diverse gastropod
fauna were obtained in the experimental trawling and these resources are fished by the
commercial trawlers also with the other nekton and landed as by—catch.
The utilization of the molluscs caught as a by-catch has been found to differ
considerably in different geographic region. In India most of the shelled molluscs are
brought to the shore where they are used commercially for shell trade (Appukuttan and
Philip, 1994) in contrast to certain other region where only selected species are retained
after the major share of the mollusc caught are discarded (Malaquias er al., 2006). In the
present study Bursa spinosa was the major mollusc (next to Babylonia spp) followed by
Tibia curta, which were landed as by-catch and it was observed that these were very
effectively used for shell trade. Appukuttan and Philip (1994) have also found that these
two species were dominant in by-catch contributing to 23.3 and 15.3% respectively and
have estimated the landing of Bursa spinosa as 78.9 t and that of T. curta as 51.8 t. All
other gastropods and bivalves are also used. These are accumulated and utilized later for
shell craft industry.
1 25
Carbonell (1997) has stated that of the 92 species of mollusc caught in westem
Mediterranean, only one was systematically retained for commercial purposes, namely
the gastropod Charonia lampas, while 6 (the bivalves Callista chione, Pecten jacobeus
and P; maximus and the gastropods Bolinus brandaris, Hexaplex trunculus and Galeodea
echinophora were sometimes sold. The other 85 species were always discarded.
Negative impacts on molluscan fauna have been brought to light recently (Lindeboon and
de Groot, 1998). Larger bivalves in the path of a beam trawl typically suffer mortality of
20% or more. As a result species like the bivalve Arctica islandica have almost
disappeared in heavily trawled areas (Rumohr and Krost, 1991; Craeymeersch er al.,
2000). Chemello et al. (2000) and Scotti and Chemello (2000) listed both Mediterranean
and world molluscs that are endangered as a result of fisheries exploited. In the current
study, the species which are listed as threatened or endangered were not observed in the
by-catch.
In addition to the species belonging to three major taxa discussed above several
species of reptiles, echinoderms, sea turtles, holothurians, seaweeds and sea grass are also
caught as by-catch (Lindeboon and de Groot, 1998; CMFRI, 2002; Shankar er al., 2004
and Bijukumar and Deepthi, 2006). In the current study also several species of
echinodenn, holothurians, sponges, jellyfish and seaweeds were obtained.
The co-occturing species in the whelk bed other than gastropods and polychaetes
were finfishes, shrimps, crabs and other resources. The coexistence of such a diverse
fauna belonging to different trophic levels is typical of benthic ecosystem. A rich and
diverse fauna comprised of different species of invertebrate phyla and finfishes were also
observed in the chank beds along southeast coast of India (Mahadevan and Nayar, 1974).
The ecology of chank beds assessed by Mahadevan and Nayar (I974) showed
predominantly Xancus—terebellid-echinoderm communities. Similar to the whelk
grounds of Kollam, the nature of bottom in Palk Bay zone was found to be essentially of
sand of fine texture superficially muddy inhabited by rich polychaete fauna and several
small shrimps. Almost similar community structure has been reported in the B. brandaris
population off Catalan coast, northwestern Mediterranean. The co-occurring species
126
were sole (Solea spp.), prawn (Penaeus kerathurus), mantis shrimp (Squilla mantis) and
cuttlefish (Sepia oflicinalis) (Martin er al., 1995). The natural population of B. undatum
in the Swedish waters co-existed with 26 other species of molluscs, crustaceans,
echinoderms and fishes (Valentinsson et al., 1999).
In an entirely different ecosystem like the coral reefs and sea grass beds,
gastropods with different feeding habits have been observed. In such areas, both
herbivorous gastropods like, T rochus, Turbo and carnivorous gastropods like Strombus,
Conus etc. have been observed (Mahadevan and Nayar, 1974; Appukuttan et al., 1989;
Narasimham, 2005).
The role of whelks in the ecosystem is predominantly that of scavengers. In the
laboratory of CMFRI, the brood stock maintained in the tanks were found to consume
meat of shrimps, squids, bivalves but never preyed on these when live feed were provided
(Personal observation). Buccinanops globulosum, a typical inhabitant of coastal waters
of San Matias Gulf, Argentina, has been found to be necrophagus, feeding mainly on
crabs and molluscs. This whelk togetherwith the crab Chasmagnathus granulata formed
the main scavengers of this ecosystem (Narvarte, 2006). In another instance, the egg
capsules of Nassarius reticulatus was found in the stomach of the fish Ctenolabrus
rupestris (Tallmark, 1980). Predation of large whelk has been found to be low. Whelks
like N. reticulatus are noctumal and remain buried during day time; this reduces
predation (Eriksson and Tallmark, 1974; Eriksson et al., I975). During the present study
the animals maintained in the lab were also found to bury in the substratum and move out
only for taking food. Moreover, they were not continuous feeders and were not very
active (personal observations).
Babylonia spirata and B. zeylanica were found to be gonochoristic and
reproductive system was similar to neogastropods like, Buccinum undatum and Nassarius
» reticulatus. These two species showed clear sexual dimorphism characterized by the
~ occurrence of a penis in males and a pipe like genital opening in the cephalic region of\I
the females for the entrance of penis and also for the release of eggs. A ventral pedalI|
_‘ .
1
l~
|
FI I27
gland is also located near the anterior end of the foot in the female which is known to
functions to shape and harden the egg capsule released from the capsule gland. These
dimorphic characters have been observed in B. spirata population in West Java
(Y ulianda, 2001) and in B. areolata in Phanthiet, Vietnam (Hua eta1., 2001). Apart from
these, Hua et al. (2001) also observed difference between shell of male and female B.
areolata, the shell of female being smoother than male. However, in the present study, in
both the species of Babylonia such morphological shell differentiations between genders
were not observed. One interesting feature in the muricid gastropod Chicoreus brunnius
is the occurrence of penis in female (Middelfart, 1992a). The size of the female penis
was smaller almost half that of male. Such modifications were not found in B. spirata
and B. zeylanica. The first indication of sexual dimorphism in B. spirara was observed in
whelks of 18-19 mm shell height, when a small knob like protuberance was obsewed
behind the right tentacle marking the development of a penis which gradually increased
in size with the growth of the snail. Yulianda (2001) has also observed the gradual
increase in size of penis with the growth of the whelk.
The gonad of male and female of B. spirata and B. zeylanica had almost the same
colour, ranging in shades of yellow to brown, these variation were related to different
stages of maturity. The spent gonad of B. spirata in the present study was found to be
dark brown, while the same species inhabiting the Parangipettai coastal waters along
Indian southeast coast was found to have a greenish brown colour (Kannapiran and
Patterson, 1996). In B. spirata in Indonesian waters, the testis was found to be yellow or
orange and ovary dark brown (Yulianda, 2001). Similarly in camivorous gastropods like,
Hemzfusus pugilinus, the spent gonad was white in both male and female, while in
females the initial maturing gonad was cream in colour, which changed to light brown
during the maturing stage and became dark when fully matured. In the male of the same
species, the initial maturing gonad was yellow, which changed to orange during the
maturing stage, and finally became brown in fully mature stage (Patterson and
Ayyakkannu, 1997). In the top shell Trochus niloricus occurring in Andaman and
Nicobar islands, the gonad colour of male and female was found to be different
(Amrithalingam, 1932). The male gonad was found to be white or cream, while female
128
gonad was green. Similar colouration such as, cream coloured male and green coloured
female gonad has been observed in the abalone Halioris varia occurring in Thailand
(Jayaraband and Paphavasit, 1996). In bivalve molluscs, especially in several species of
marine mussels (Mytilidae) and scallops (Pectinidae) variation in colour of male and
female gonad and intensification in pigment of female gonad with maturity has been
observed. However, in several other bivalves like oysters and clams the male and female
gonads have almost the same colour.
From the occurrence of higher percentage of spent females and the low GSI in
Sept-Oct, it can be inferred that the spawning had taken place during this period and
during the preceding month. Since samples could not be obtained during July-Aug due to
rough weather conditions this inference cannot be substantiated. The high GSI during
Nov-Dec indicated gonad development which resulted in spawning during J an-Feb and
this cycle was repeated during the succeeding period with a minor spawning peak in
April-May, indicating that B. spirata is a continuous breeder with multi-annual peaks.
The observations made by Sreejaya er al. (2004), which was done concurrently with the
present study support the inference that the B. spirata is a continuous breeder along west
coast of India. It was observed that, in the laboratory though spawnings were obtained
almost through out the year except during June-July, the intensity of spawning, as
evaluated by the number of egg capsules laid and the frequency of spawning varied in
different months. It is probable that in natural bed also such variations occur and the
different percentage of mature and spent whelks in the fishery samples throughout the
year is supportive to this. The studies on B. spirata population along the east coast have
indicated that it breeds during Feb-May as inferred from the GSI values (Kannapiran and
Patterson, l996), laboratory based studies on the breeding biology of B. spirata along the
east coast of lndia (Shanmugaraj and Ayyakkannu, 1997). Shanmugaraj and
Ayyakkannu (1997) have stated that the spawning season of B. spirata is from Jan-Aug
in the post monsoon months. Poomtong and Nhongmeesub (1996) have observed
spawning of B. areolata in the hatchery almost through out the year except during Nov
and Dec. ln these animals, highest spawning frequency was observed in March and July
with maximum number of egg capsules in April.
129
VVhelks have been found to have strong breeding behaviour, where the male and
female copulate and the sperm are deposited in the bursa copulatrix of female, to be
transferred to the seminal receptacle later, which will be retained for a long period until
oocytes pass through the albumin gland, where fertilization occurs (Martel and Larrive,
1986).
Most studies on breeding biology of whelks (Martel et al., 1986b; Kannapiran and
Patterson, 1996 and Yulianda and Danakusumah, 2000) have been based on histology of
gonad and gonad index. However, Martel er al. (1986a) have found that it is possible to
relate the timing of copulation and egg laying based on the presence or absence of sperms
in bursa and seminal receptacle in females. Their study was based on field observations
in the northem Gulf of St. Lawrence, Canada and concurrent laboratory observations. It
was observed that in the field, mating begin with the aggregation of whelks caused by
movement of male towards gravid females. Such attraction of males to female during the
copulation period has been reported for other neogastropods also (Magalhaes, 1948;
Pearce and Thorson, 1967; Edwards, 1968 and D’ Asaro, 1970) and the reason for such
behaviour has been attributed to pheromones released by gravid females.
In the present study, sperm were observed in bursa copulatrix and in the ingestion
gland almost through out the year. This also indicates that, after maturity there is no
prolonged rest period for the gonad, rather, soon after egg laying a new cycle of
development of ovary and testis begins followed by copulation and egg laying. Martel er
al, (1986) have found that the Sp6I'I‘I1S transferred to the seminal receptacle of female by
the male may be kept up to 8 weeks. The sperm stored by the female serve to fertilize the
oocytes as they pass through the pallial oviduct during egg laying. Thus the presence of
spermatozoa in the bursa indicates that the copulation has just happened, where as the
presence of spermatozoa in the seminal receptacle indicates that the female is capable of
laying egg.
130
In the Indian waters spawning period of Xancus pyrum has been found to be
between November and April in the southeast coast (Devaraj and Ravichandran, I988).
In the Andaman and Nicobar Islands Amruthalingam (1932) has stated that Trocus
niloticus spawns immediately after warm season (March-June), while Rao (1937) has
reported that this species may be a continuous breeder with perhaps an intense spell
during or immediately after the warm season. In the same ecosystem, Turbo marmoratus
breeds through out the year (Setna, 1933).
In King Solomon Island of Westem Australia, T. m'l0tz'cus spawns mainly during
July-Aug and Feb-April with minor spawning through out the year (Gimin and Lee,
1997). The spawning season of another important gastropod, the abalone H. varia in the
Gulf of Mannar and Palk Bay region has been found to be from Dec-Feb coinciding with
the end of northeast monsoon, when the temperature and salinity were very low. The
spawning season of Hemifusus pugilus is during post-monsoon and summer months
(Patterson and Ayyakkannu, 1997) and that of Pythia plicara along the south east coast is
during post-summer to early northeast pre-monsoon (Shanmugam, 1995).
The size at first maturity has been found to differ for male and female of the same
species of gastropods (Narasimham, 2005). In the present study males were found to
mature faster than females. In the B. spiraza population along the east coast, Karmapiran
and Patterson (1996) found males attain sexual maturity at 36 mm size while the female
attain maturity at 39 mm. The size at first maturity for B. spirata has been found to be
different in other Southeast Asian countries (Yulianda, 2001). In West Java, Yulianda
(2001) found B. spirata to mature at 20 mm size. Such variations in size at maturity in
same species at different geographic locations have also been observed. T. niloticus
which is basically a coral reef inhabiting gastropod has been found to attain maturity at 9
mm SD in female and 6-7 mm SD in males (Rao, 1937), while the same species in
Australian waters attain maturity at 5-9 mm for females and 5-7 mm for males (Hahn,
1989)
131
Similarly, in the Indian population of H. varia, Najmudeen and Victor (2003)
found males to attain sexual maturity at 20-22 mm and female at 22-24 mm. While the
same species along south central Vietnam coast attain maturity at 21.9 mm for male and
25.6 min for females (Minh, 2000). Variation in length at first maturity between male
and female gastropod in Indian waters has been observed for X. pymm (Devanesan and
Chacko, 1944), T. m'lotz'cus (Rao, 1937) and H. varia (Najmudeen and Victor, 2003). The
male chank attains sexual maturity when they are 57-60 mm MSD and females at larger
size. In all these species males became mature earlier than females. Kannapiran and
Patterson (1996) have related this to the comparatively higher growth rate and larger size
of females than males and also to high quality of feed consumed and resultant maximum
reproductive success.
The proportion of females in the commercial landing of both B. spirata and B.
zeylanica was high almost through out the year during present study. Similar dominance
in whelk population along the east coast of India has also been reported (Kannapiran and
Patterson, 1996; Patterson and Ayyakkamiu, 1997 and Hua et al., 2001). Apart from the
general sex ratio variation it was also observed that the ratio was significantly different in
most months and dominated by females in larger size groups in both the species.
Kannapiran and Patterson (1996) also found that the expected 1:1 ratio occurred in this
population only during 5 month period and have presumed that the predominance of
female may be due to the faster growth rate of females or the early death of rachiglossan
males. Similar gender based dominance has been reported in several species (Gibbs er
al., 1988; Martel er al., 1986b and Shim et al., 2000) and this has been attributed to the
bigger size females and retention of larger animals in the gear (Nan/arte, 2006).
The super family Buccinacea is probably the least specialized of rachiglossan
gastropods in terms of feeding mechanism (Kohn, l983). During the study the
percentage of actively fed snails were very less compared to poorely fed according to the
fullness of the stomach for both the species. However, it could be because of their
feeding habits. A number species of the family Buccinidae feed mainly on carrion
(Taylor, 1980) and according to Morton (1990) Babylonia lurosa is opportunistic feeder
132
and can survive long periods of starvation (>100 days). The study on diet of Nassarius
festivus by Morton and Chan (2003) indicated that the snail feeds largely upon organic
material in the form of carrion, unidentified tissue, polychaetes and crustaceans. The gut
content analysis of Buccinid, Bngina armillata revealed that the diet consistes of serpulid
and spirobid polycheates (Tan and Morton, 1998). When gut content of whelks analysed
in the present study, digested animal matter could be identified, polychaete setae or hard
parts of crustaceans were not observed. The completely digested condition could also be
due to the fact that the whelks remain alive for more than 8 hours after they are caught
and before frozen for analysis. During this long duration, the food consumed will be
completely digested. In the experimental trawl samples also the gut content was
completely unidentifiable digested matter, thereby supporting the views of Taylor (1980)
and Morton and Chan (2003) on the food of whelks.
Growth rate indicating the change in body mass and weight has been studied in
gastropods through sampling the population (Morton and Chan, 2004) and by direct
measurement in captivity (Yulianada and Dhanakusumah, 2000) or by mark (tag) ~
recapture method (Yamaguchi, 1977). Several factors are known to affect the growth and
size of gastropods ranging from position of occurrence in the intertidal zone (Vermeij,
1978), degree of wave exposure (Boulding and van Alstyne, 1993), presence within a
conspecific aggregation (Lafferty, 1993), diet (Bowling, 1994), sex of the individual
(Fotheringham, 1971; Sousa, 1983), trematode parasitism (Curtis, 1995) and depth
(Olabania and Thurston, 2003). The shape of the gastropod shell and its adaptive value
has been widely recognized and studied and it has become clear that gastropod shell has
to be consistent with a diversity of inter-related functions (Ekarante and Crisp, 1983).
Maximum shell length and growth of B. spirata observed in the present study is
similar to that observed along the Porto Novo waters along the southeast coast
(Shanmugaraj et al., 1994 and Shanmugaraj and Ayyakkannu, 1997) and differed from
the Pelabuhan Ratu bay, Indonesia (Yulianda and Dhanakusurnah, 2000). B. areolata
recorded in Thailand were about the same size as that of B. spirata but smaller than B.
zeylanica recorded in present study.
133
It has been observed that within the same species in populations in different
localities, variation in life span and growth can be observed as noted by Crichton (1942)
for Bullia vittata along Madras coast and along Porto Novo by Thilaga er al. (1987).
Crichton (1942) suggested that B. vittata was able to attain full size within a period of
less than 6 months, while Thilaga er al. (1987) have reported that this species attained
shell height of 17, 34.5, 42.5 and 50.2 mm during the first, second, third and fourth year
respectively in Porto Nova waters. Chicoreus ramosus attains 107.7 mm in the first year
in Indian waters (Stella er al., 1992), while in Thai waters it attains only 78.15 mm
(Nugranad er al., 1994).
In the present study, B. spirata and B. zeylanica showed positive allometric
relationship between shell height and shell width and between shell height and total
weight. Yulianda and Dhanakusumah (2000) found good correlation between total
weight and shell length and also found that gonad weight and meat weight improved in
the laboratory in the initial phase, when provided with ample feed. But the weightremained constant three weeks after acclimatization. The difference can be due to
variation in food availability, temperature and shore topography (Mc Killup er. al., 1993).
Morton and Chan (2004) found that food availability is a critical factor in growth of
gastropods. They found that Nassarius festivus attained larger shell height in Starfish
Bay compared to Tai Mong Tsai and Tai Mong Bay because of the high level of food
available in the form of carrion comprising fishery by-catch and damaged fauna due to
clam digging.
In the biometric studies on B. spirata and B. zeylanica, slightly different slopes
were obtained for different size classes, younger size class having higher values than the
larger classes. In N. fesrivus significant difference in increase in SH and growth of two
size classes was obtained. These studies indicate that smaller and larger size groups
invest different amounts of energy in growth, more in small individuals and less in large
ones. Small individuals allot energy to shell growth in order to achieve larger size, while
134
larger individuals allocate more energy to reproduction (Siddal er al., 1993 and Morton
and Chan, 2004).
Considerable variation in the length composition of male and female B. spirata
and B. zeylanica was observed in the population. It was noted that Lmax of male B.
spirata (51.3 mm) and was much lower than that of female (63 mm). In B. zeylanica, the
Lma, of male and female were not much different, but the proportion of males in the larger
size class was low. In ampullariid snail, Pomacea urceus (Burky, 1974) and P.
canaliculata (Estebenet and Gazzaniga, 1997) such differences in population of male and
female of larger size classes have been observed and this has been attributed to a sexually
dimorphic growth pattern. In Pomacea urceus (Lum Kong and Kenny, 1989), Marisa
cornuaietis ‘(Demian and Ibrahim, 1972) also larger size females have been observed.
Adult females of any given shell height were found to weigh more than males of
equivalent size. Such gender based deference in weight has been observed for several
marine gastropods and also in freshwater gastropods of the family Ampullariidae like, P.
canaliculata (Estebenet, 1998). The presence of mature animals in the samples almost
through out year and the increased gonad weight mainly by the albumin gland must have
lead to higher weight of female. However, in B. spirata and B. zeylanica, the maximum
percentage of gonad weight to total weight has been <l0%, but in some gastropods like
P. canaliculata the albumin gland can represent 68% of body weight.
Variation in allometric relation (SH vs SW) between male and female B. spirata
and B. zeylanica were observed in the present study. Strong sexual dimorphism in shell
height, opercular length, shell weight, total weight, tissue weight and percentage meat
yield was observed for B. undatum in Atlantic Nova Scotia (Kenchington and Glass,
1998) and from Tusket Shoal, Southwest Nova Scotia (Kenchington and Lundy, 1996).
Though such sexual dimorphism is marked in same characters, the differences in mean
values between sexes are small and it is unlikely that these characters can be used to
separate sexes in this species (Kenchington and Glass, 1998).
135
The growth coefficient, K value, was almost same for B. spirata (1.08) and B.
zeylanica (1.15) in the present study and the life span of these two whelks were estimated
a 2.8 and 2.6 years respectively. The K value estimated for other commercially important
gastropods like the chank is lower, 0.946 (Devaraj and Ravichandran, 1988) and 0.264
(Narasimham, 2005). The L00 based on the growth data from chank tagging studies
(Sambandamurthy and Chacko, 1969) was estimated as 119 mm in MSD and from this
the theoretical life span was estimated a 51 years and the observed life span was 31.5
years, for 113 mm MSD, the largest chank recorded (Devaraj and Ravichandran, 1988).
From the data collected by the mark-recapture of chank in Gulf of Mannar, Lipton and
Selvakku (2001) estimated size at age 1 to 5, 10 and 15 as 23.9, 42.3, 56.5, 67.5, 75.6,
96.6 and 102.3 mm MSD. However, the laboratory reared baby chanks grew faster,
attaining 3 1 .47mm MSD in 360 days (Lipton and Selvakku, 2000).
The growth of larger ornamental gastropods like, T. niloticus and T. marmoratus
is slow compared to B. spirara and B. zeylanica but with higher longevity. Rao (1937)
has stated that T. niloticus grows to 5 cm, 5-8 cm and 8-10 cm SD in 1 to 3 years and the
life span is 10+ years. Nash (1993) has reported that gastropod have even slower growth,
30 mm during first year, 60 mm after 2 years and about 80 min SD by third year in
various parts of the world. Hatchery reared T. niloticus seed of 2.2 months age had a
mean size of 2.1 mm (Heslinga and Hillman, 1981) and a juvenile top shell grew to 6.2
mm SD alter 12 months, indicating faster growth rate in the hatchery for smaller snails
than reported by field observations. Heslinga (1981) attributes this variation to
temperature, habitat and food.
The green turban shell, Turbo marmoratus, the biggest species under the genus
Turbo grows to a maximum size of 25 cm SD weighing more that 2 kg (Yamaguchi,
1993). Based on mark recapture studies it has been observed that snail of 57 mm shell
height grows to average length of 112.2 mm in l year and to 146.6 mm in 2 years
(Fa’anunu’ er al., 2001).
136
The K value of most gastropods is low, Cittarium pica, 0.19 to 0.28 (Schmidt et
al., 2002); Strombus gigas, 0.21 to 0.4 (Navarrete, 2002); Buccinum isaotakii, 0.117 to
0.132 (llano er al, 2004) and B. undatum, 0.0274 (Kenchington and Glass, 1998).
However, in small size gastropods like N. festivus the K value has been found to be high
(2 to 2.7). The maximum age of many gastropods have been assessed and found to be
high, Monodonta lineate (9+) (Williamson and Kendall, 1981); Shaskyus festivus and
landing, recreational limit and recreational and commercial gear regulation to improve
the fishery. In spite of these management tools the abalone populations in California
continued to decline, until total closure was decreed in 1997.
Based on the observations made on the by-catch of shrimp trawlers in the
Sakthikulangara-Neendakara harbour, an income generating programme is suggested.
The huge quantity of gastropod shells landed are at present utilized as raw materials for
shell trade industries which are based along the southeast coast. There is ample scope to
develop these shells as value-added products like key chain, curios, shell curtains,
ornaments etc. through cottage industries in the state itself. These can be initiated by the
Dept. of Fisheries and the local fishers, especially the low income group can be trained
on cleaning, polishing, cutting shells and even in product development. Nearly l0 units
can be set up in the district itself and can be marketed through linkages with Dept. of
Tourism; Dept. of small scale industries and these items can also be exported also. This
shell craft industry can be more active during the monsoon period when the fishery is
lean and employment opportunities are low.
144
Cfiapter 6
Summary
6. Summary
The two species of whelks, B. spirata and B. zeylanica were never found to co
exist. The hydrographic parameters like temperature, salinity, ammonia, nitrite and
nitrate of surface and bottom water were similar between the sites of the two whelk beds.
pH, dissolved oxygen, phosphate and total suspended solids of surface and bottom water
showed significant variations among zones. Total organic carbon of sediment was
analysed for all the stations and significant variations were observed between S; and S2
and N2 and S; Significant variation in sediment texture between B. spirata and B.
zeylanica beds was observed. The sediment texture in the B. spirata bed was silt-loam at
all stations, while in the B. zeylanica bed, it was sand-loam at S; (10-20 m) and sandy at
S; (20-30 m). In the north zone, Babylonia spirata was present at both the sites N; and
N2 and in the southern zone at S; at a low density and was absent in S; B. zeylanica was
observed only at site S2 (2 no/l0m2). The density of B. spirata varied among sites and
maximum density was observed at N2 (6 no/l0m2) and minimum at S1 (0.04 no/l0m2).
The density of B. zeylanica was low compared to the density of B. spirata at the same
depth in the north zones. Length composition of B. spirata population in the two zones
was similar, dominated by adult whelks. Females dominated the population in north zone,
while males dominated the population at S1_ B. zeylanica inhabited only the deeper
regions of south zone and the population was dominated by adult whelks and females out
numbered males. B. spirata abundance was high in areas with more silt and TOC, and
showed negative relationship with sand composition. B. zeylanica density increased with
sand and significant negative relationship observed with clay, silt and TOC.
The whelk beds benthic community of north zone comprised of six macrofaunal
invertebrate taxa constituting 53 species of annelids, 8 species of crustaceans, 5 species
of molluscs, sipunculids, nemertine and coelenterates and fish larvae, while along south
zone three invertebrate taxa with 33 species of annelids, 4 species of crustaceans and
sipunculids were identified. Annelids dominated (81.2%) the macro benthos in north
zone and S; (41.4%) of south zone, while sipunculids were the dominant fauna at S1
(72.1%). The results of ANOSIM indicated significant difference in species composition
145
of macro-fauna in the four sites. Among these, highest degree of difference was found
between S1 and S2 followed by N2 and S;
Other associated fauna in the beds of B. spirata and B. zeylanica were composed
of benthic fin fishes, crustaceans, molluscs, echinodenns and coelenterates. Multivariate
analysis on the abundance of benthic associated fauna showed significant difference
between N1 and N2 and S1 and S;;_ The univariate analysis on macro-benthos showed the
highest species diversity (6.95) and evermess (0.73) at N; and minimum at S1 (2.3 and 0.4
respectively). The dominance index was also found to be higher at N2. The nekton and
other associated fauna were more diverse and evenly distributed at N2 compared all other
sites.
B. spirata and B. zeylanica are gonochoristic with internal fertilization. Four
maturity stages have been identified depending on the GSI and texture and colour of the
gonad. B. spirata spawns through out the year with two peak-spawning periods viz,
September to December and February to March. Shell height at first maturity was
estimated as 32 mm and 36.5 mm for male and female B. spirata respectively. The sex
ratio studies showed that females dominated the population of whelk and a significant
predominance of females observed in January, February and May of 2001 and 2002. The
sex ratio in different size groups varied and the number of males decreased with increase
in size. The GSI of male and female B. spirata increased from stage I to III and
decreased in spent stage. The GSI of female B. spirata showed gradual increase in
September to November and decreased in January. Again an increase was observed in
February upto April coinciding with spawning activities. The monthly variation of GSI
in male was not as pronounced as it was in females and the peak was observed inOctober.
The shell height — total weight (SH-TWt) relation of B. spirata and B. zeylanica
showed a high positive correlation (R2 = 0.96). In B. spirata the sex wise SH-TWI
relation showed no significant variation of b-values. But in the case of B. zeylanica, the
b-values significantly varied for male and female. The SH-SW relationship, the b-value
146
of B. spirara and B. zeylanica showed the high positive correlation. When considered
separately for male and female, the b-values were slightly lower for males than that of
females and the values were significantly different forboth species. The rate of growth
in body width of females was faster than that of males. Shell height — opercular length
(SH-OL) relationship showed positive correlation for both species. When the relation of
male and female B. spirara was considered separately the b-values were significantly
higher for males and in B. zeylanica, the b—va1ue was significantly lower for males than
for females. The SH-TWt relationship showed a decrease with increase in size for both
male and female B. spirata and a reverse a phenomenon was observed in B. zeylanica.
The growth of whelk was studied by using ELEFAN I programme. The growth
parameters Loo and K were estimated as 68.7 mm and 1.08 for B. spirata, and 76 mm and
1.15 for B. zeylanica respectively. The longevity of B. spirata was calculated as 2.8
years using the K value as 1.08 yr'1 and of B. zeylanica as 2.6 years when the K value is
1.15 yr‘.
The annual landing of gastropods at Neendakara - Sakthikulangara was estimated
as 780.6 t, 879 t and 659.8 t during the period 2001 to 2003 with an average annual
landing of 773 t forming 1.2 to 2.4% of the total marine landing. The average annual
CPUE for gastropods was 14.1, 9.8 and 13 kg during 2001, 2002 and 2003 respectively.
The average estimated whelk landing composed of B. spirata and B. zeylanica for the
period 2001-2003 was 487 t contributing 62.5% of the total gastropod landed during this
period. There is a targeted fishing of whelk along the coast using modified trawl from
April to June every year. B. zeylanica formed more than 50% of the whelk landing and
dominated the fishery during April to June, while the catch was negligible during the
post-monsoon months. The average estimated CPUE for whelk was 8, 6.8 and 9.1 kg
during the period 2001, 2002 and 2003 respectively. During April-June 20-40 boats were
engaged in exclusive fishing of whelk with modified trawlers in which the CPUE ranged
from 250 to 500 kg with an average of 400 kg.
147
B. spirata of length range 20-60 mm was observed in the fishery during 2001
2002 and 30-46 mm size class supported (90%) the fishery. The annual mean length of
B. spirata showed an increase from 37.4 mm in 2001 to 40.1 mm in 2002. The amiual
mean shellheight of B. zeylanica in 2002 was 49.9 mm. L-50 of B. spirata was
estimated as 35.2 mm and of B zeylanica 41.7 mm.
Total mortality coefficient (Z), natural mortality coefficient (M) and fishing
mortality coefficient (F) of B. spirata were estimated as 6.05, 1.61 and 4.44 respectively.
The Z, M and F of B. zeylanica were 5.02, 1.65 and 3.37respectively.
The present exploitation rate of B. spirata (0.73) has exceeded the optimum
exploitation rate Ema,‘ (0.68). For B zeylanica, the present exploitation rate has almost
attained the optimum (0.71), where the Em, was 0.77. The estimated standing stock of B.
spirata along off Kollam during the period 2001 and 2002 was 216.2 t and the spawning
stock biomass was estimated as 92.87 t. The standing stock biomass of B. zeylanica was
estimated as 404 t and the spawning stock biomass as 267.7 t for the year 2002. From the
results it can be summarized that there is no overexploitation or threat on the population
of whelk in the study area at the present level of fishing. But increase in fishing effort
can lead to stock depletion.
148
References
Reference:
Adachi, N. and K. Wada, 1999. Distribution in relation to life history in the direct-developinggastropod Batillaria cumingi (Batillariidae) on two shores of contrasting substrata. J.Moll. Stud, 65: 275-287.
Alagarswami, K. and M. M. Meiyappan, 1989. Prospects and problems of management anddevelopment of the marine molluscsn resources (other than cephalopods) in India. Bull.Cent. Mar. Fish. Res. Inst, 44(1): 250-261.
Alverson, D. L., M. H. Freeberg, S. A. Murawski and J.G. Poe, 1994. A global assessment offisheries by-catch and discards. FAO Fish. Tech. Paper, (339): 233pp.
Amor, M.J., 1992. Ultrastructural study of the mucosa of the male gonoduct of Murex brandaris(Hexaplex brandaris) (Gastropoda, Prosobranchia). Invertebr. Reprod. Dev., 21: 149160.
Amor M. J. and M. Durfort, 1990a. Changes in nuclear structure during eupyrenespennatogenesis in Murex brandaris. Mol. Reprod. Dev., 25:. 348-356.
Amor, M. J. and M. Durfort, 1990b. Atypical spermatogenesis in Murex brandaris. M01. Reprod.Dev., 25: 357—363.
Amrithalingam, C., 1932. Breeding of Trochus and preservation of beds in Andamans. Curr. Sci,1(1): 34.
Annon, 2003. Squandering the seas: How shrimp trawling is threatening ecological integrity andfood security around the world. Report of the Environmental Justice Foundation,London, 45 pp.
Ansari, Z. A., R. A. Sreepada, A. Kanti and Gracias, 1994. Macrobenthic assemblage in the softsediment of Marmagao harbour, Goa (central west coast of India). Indian J. mar. Sci,23: 225-231.
Appeldoom, R. S., 1984. The effect of size on mortality of small juvenile conchs (Strombus gigasL. and S. costatus G.). J. shellfish. Res., 4: 37- 43.
Appeldoom, R. S., 1987. Assessment of mortality in an off shore population of queen conch,Strombus gigas L., in Southwest Puerto Rico. Fish. Bull, 85: 797- 804.
Appeldoom, R. S., 1988. Age determination, growth, mortality and age of first reproduction inadult queen conch, Strombus gigas L., off Puerto Rico. F ish. Res., 6: 363-378.
Appukuttan, K. K., 1979. Trochus and Turbo fishery in Andamans. Seafood Export Journal,ll(l):41-44. 'Appukuttan, K. K., 1996. Marine molluscs and their conservation. In: Marine Biodiversity
Conservation and Management (Eds. N.G. Menon and C.S.G.Pillai). ). CMFRI, Cochin:66-78.
Appukkuttan, K. K. and M. B. Philip, 1994. Gastropods- An emerging resource in the by- catch ofshrimp trawlers at Sakhikulangara- Neendakara area. Seafood Export Journal, 25 (21):5-17.
Appukuttan, K. K., N. Joseph, K. T. Thomas and T. P. Nayar, 1980. Chank fishing of Kerala withspecial reference to long line fishery. Mar. Fish. Infor. Serv. T & E Ser., (24): 10-14.
Appukutan, K. K., A. Chellam, K. Ramdoss, A. C. C. Victor and M. M. Meiyappan, 1989.Molluscan resources. Bull. Cent. Mar. Fish. Res. Inst. 43: 77-92.
149
Appukuttan, K. K. and K. Ramdoss, 2000. Edible and ornamental gastropod resources. In:Marine Fisheries Research and Management (Eds. Pillai, V.N and N.G. Menon).CMFR1, Cochin, 525-535.
Annonies, W. and D. Hartke, 1995. Floating of mud snail Hydrobia ulvae in tidal waters of theWadden Sea and its implications in distribution pattems. HelgolanderMeeresuntersuchungen, 49: 529-538.
Aschan, M., 1990. Changes in soft bottom macrofauna communities along environmentalgradients. Annls 2001. Fenn., 27:329-336.
Ayyakkannu, K., 1992. Fishery status of Cliicoreus ramosus along the southeastem coast ofIndia. Plmket mar. boil. Cent. Spec. Publ., 10: 35-38.
Ayyakkannu, K., 1994. Fishery status of Babylonia spirata at Port Novo Southeast coast of India.Phuket mar. boil. Cent. Spl. Publ, 13: 53-56.
Bachelet, G., X. deMontaud0uin, & J. C. Dauvin, 1996. The quantitative distribution of sub-tidalmacrozoobenthic assemblages in Arcachon Bay in relation to environmental factors: amultivariate analysis. Estuarine, Coastal and Shelf Science, 42:371-391.
Bader, R. G., 1954. The role of organic matter in determining the distribution of bivalves insediments. J. mar. Res, 13:31-47.
Baker, J ., S. Shepherd and K. Edyvane, 1996. The use of marine fishery reserves to managebenthic fisheries, with emphasis on the South Australian abalone fishery. Proc. Tech.Meeting, South Australian Aquat. Sci. Cent. West Beach, Adelaide, Australian Nat.Conserv. Agency, Canberra, p. 13.
Barash, A. and Z. Zenziper, 1980. Egg masses of mollusca from Mediterranean waters of Israeland notes on reproduction of the freshwater species Theodoxus jordani and Melanoidestuberculata. Veliger, 22: 299-317.
Bartolome, C., 1985. Contribution a l’étude du gasteropode Murex brandaris (Linnaeus, 1758)dans le Golfe du Lion. In: Diplome d'Etudes Approfondies, Université des Sciences etTechniques du Languedoc, 92 pp.
Bech, M., 1997. Hatchery culture of Trochus niloticus and T ectus pyramis (Gastropoda:Prosobranchia, Trochidae) in Phuket, Thailand, Phuket mar. boil. Cent. Spl. Publ, 17(1): 213-220.
Berg, C. J. and D. A. Olsen, 1989. Conservation and management of queen conch S. gigasfisheries in the Caribbean. In: Marine Invertebrate Fisheries: Their Assessment andManagement (Eds. J. F. Caddy). John ‘Wiley & Sons Inc. USA: 421-442.
Bergmann, J. R. and M.G. Graham, 1975. Salinity: A factor defining the habitat of the mudsnail, Nassarius obsoletus (Say.). Proc. Malac. Soc. London, 41(6): 521-525.
Bergman, M. J. N. and P. G. Moore, 2001a. Survival of decapod crustaceans discarded in theNephrops fishery of the Clyde Sea area, Scotland. ICES]. mar. Sci, 58: 163-171.
Bergman, M. J .N. and P. G. Moore, 2001b. Mortality of Asterias rubens and Ophiuraoplziura discarded in the Nephrops fishery of the Clyde Sea area, Scotland. Ibid,58: 531-552.
Berthou P., Poutiers J .M ., Goulletquer P., Dao J .C ., 2005. Shelled molluscs, in Fisheries andAquaculture, from Encyclopedia of Life Support Systems (EOLSS), Developed underthe Auspices of the UNESCO, Eolss Publishers, Oxford ,UK, [http://www.eo1ss.net].
150
Beverton, R. J. H. and S. J. Holt, 1966. Manual of methods for fish stock assessment Part-2.Tables of yield functions for fishery assessment. FAO F ish. Tech. Paper, 38(1): 67pp.
Bijukumar, A and G. R. Deepthi, 2006. Trawling and by-catch: Implications on marineecosystem. Curr. Sci., 90(7): 922-931.
Borges, T. C., L. Bentes, M. Cristo, M. E. Costa, K. Erzini, S. Olim and C. Pais, 2000. Analysisof fisheries discards from the south coast of Portugal (DISCALG). Final report toEuropean Commission Directorate General Fisheries Study project, No. 97/0087, 42pp.
Borges, T. C., K. Erzini, L. Bentes, M. E. Costa, J. M. S. Goncalves, P. G. Lino, C. Pais and J.Ribeiro, 2001. By-catch and discarding practices in five Algarve (Southem Portugal)métiers. J. App]. 1chthyo1., 17: 104-114.
Bouchet, P. and W. Bour, 1980. The Trochus fishery in New Caledonia. South. Pacific Commn.Fish. Newsi, (20): 9-12.
Boulding E. G. and T. K. Hay, 1993. Qunatitative genetics of shell form of an intertidal snail:constraints on short-term response to selection. Evolution, 47: 576-592.
Boulding, E. G and K. L. van Alstyne, 1993. Mechanisms of differential survival and growth oftwo species of Littorina on wave-exposed and on protected shores. J. Exp. mar. biol.Ec0l., 169: 139-166.
Bour, W., L. Loubersac, P. Raul, 1986. Thematic mapping of reefs by processing of simulatedSPOT satellite data: application to the T rochus niloticus biotope on Tetembia Reef (NewCaledonia). Mar. Ecol. Prog. Ser., 34: 2443-249.
Bowling, C., 1994. Habitat and size of the Florida crown conch (Melongena corona): why bigsnails hang out at bars. J. Exp. mar. miol. Ecol, 1'75: 181-195.
Branch, G.M., 1975. Mechanisms reducing intraspecific competition in Patella spp.- migration,differentiation and territorial behavior, J. Anim. Ecol, 44: 575-600.
Brey, T., 1999. Growth performance and mortality in aquatic macrobenthic invertebrates. Adv.mar. Bi01., 35: 153-223.
Bretos, M., 1988. Pesqueria de lapas en Chile. Media Ambiente 9: 7-12.
Brown, C., 1959. The structure and function of the digestive system of the mud snail, Nassariusobsoletus (Say.). Malacologia, 9(2): 447-500.
Bruce, D. G., 2006. The whelk dredge fishery of Delaware. J. Sheiifish. Res., 25(1): 1-13.
Burky, A., 1974. Growth and biomass production of an amphibious snail, Pomacea urceus(Muller), from the Venezuelan Savannah. Proc. Malacol. Soc. London, 41: 127-143.
Burnett, H. J ., 1981. Bermuda. In: Proc. Queen Conch Fish. Maricuit. Meeting (Ed.C. J. Berg Jr.)Wallace Groves Aquacult. Found, Discovery House, Freeport, Bahamas, 35-37.
Bustamante, R. H. and J. C. Castilla, 1987. The shellfishery in Chile: An analysis of 26 years oflanding (1960-1985). Biol. Pesq. (Chile), 16: 79-97.
Butler, P. A., 1985. Synoptic review of the literature on the Southern Oyster Drill Thaishaemastomafloridana. NOAA Tech. Report NMFS, 35: 1-9.
151
Caddy, J. F., 1989. Recent developments in research and management for wild stocks of bivalvesand gastropods. In: Marine Invertebrate Fisheries: Their Assessment and Management.(Ed. J. F. Caddy, J.F.) John Wiley & Sons Inc. USA: 665-700.
Carbonell, A., 1997. Discards of the Westem Mediterranean trawl fleets. Final Report, Comm.European Comm., Contract No. DGXIV-MED/94/027, 114 pp.
deCastellanos, Z. A., 1967. Catélogo de moluscos marinos bonaerenses. An. Com. Invest. Cient.,8 :1-365.
deCaste1lanos, Z. A., 1996. Los invertebrados. Tomo III. Primera Parte- Moluscos. Loscelomados (excluido Artropodos), Estudio Sigma SRL, 43-112.
Castilla, J. C., 1988. Una revision bibliogréfica (1980-1988) Sobre Concholepasconcholepas (Bruguiére 1789) (Gastropoda: Muri-cidae): problemas pesqueros yexperiencias de repoblacion. Biol. Pesq. (Chile), 17 I 9-19.
Castilla, J. C., 1995. The sustainability of natural renewable resources as viewed by an ecologistand exemplified by the fishery of the mollusk Concholepas concholepas in Chile. In:Defining and Measuring Sustainability (Eds. M. Munasinghe and W. Shearer). TheInternational Bank for Recon-struction and Development, The World Bank, WashingtonD.C., USA, 153-159.
Castilla, J. C.,1996. La futura red Chjlena de parques y reservas marinas y los conceptos deconservacion, preservacion y manejoen la legislacion nacional. Rev. Chil. Hits. Nat., 69:253-270.
Castilla, J. C., 1997a. The sustainable use of marine coastal resources in Chile: co-managementand the artisanal fishing community scale. In: Science for sustainable development inLatin America and the Caribbean. Third World Academy of Sciences, 6th generalconference and 9th general meeting. Rio de Janeiro, Brazil, 138-147.
Castilla, J. C., 1997b. Chilean resources of benthic invertebrates: fishery, collapses, stockrebuilding and the role of coastal management areas and National parks. Proc. SecondWorld Fish. C0ngr., CSIRO, Collingwood, Australia, 130-39135.
Castilla, J. C., 1999. Coastal marine communities: trends and perspectives fiom human-exclusionexperiments. Trends Ecol. Evol. 14, 280-283.
Castilla, J. C., 2000. Roles of experimental marine ecology in coastal management andconservation. J. Exp. mar. biol. Ecol, 250, 3-21.
Castilla, J. C. and R. Becena, 197 5. The shell fisheries in Chile: an analysis of the statistics1960-1973. In: Valle, J .C., (ed.), Intern. .511/‘mp. Coast. Upwelling, Coquimbo, Chile, 6190. '
Castilla, J . C., P. Manriquez, J. Alvarado, A. Rosson, C. Pino, C. Espoz, C., R. Soto, D. Oliva,and O. Defeo, 1998. Artisanal “Caletas” as units of production and co-managers ofbenthic invertebrates in Chile. Canadian Spl. Publ. Fish. Aquat. Sci. 125: 407-413.
Chaitanawisuti, N. and A. Krisanapuntu,1998. Growth and survival of hatchery reared juvenilespotted babylon, Babylonia areolata Link, 1807 (Neogastropoda: Buccinidae). J.Shellfish Res, 17: 85-88.
Chaitanawisuti, N. and A. Kritsanapuntu, 1999. Effect of different feeding regimes on growth,survival and feed conversion of the hatchery reared juveniles of the gastropod molluscspotted Babylon Babylonia areolata Link, 1807 (Neogastropoda: Buccinidae) in flowthrough culture systems. Aquacult. Res, 32: 689-692.
152
Chaitanawisuti, N., A. Kritsanapuntu, Kathimnai and Y. Natsukari, 2001. Growth trails forpolyculture of hatchcy reared juvenile spotted Babylon (Babylonia areolata) and seabass (Lates calcarifer) in a flow-through sea water system. Aquacult. Res., 32: 247-250.
Chaitanawisuti, N., A. Kritsanapuntu and Y Natsukari, 2002a. Economic analysis of a pilotcommercial production for spotted babylon, Babylonia areolata (Link 1807), ofmarketable sizes using a flow-through culture system in Thailand. Aquaculture Research33(15): 1265-1272.
Chaitanawisuti, N., A. Kntsanapuntu and Y Natsukari, 2002b. Effects of different types ofsubstrate on the growth and survival of juvenile spotted Babylon Babylonia areolataLink, 1807 reared in a flow through culture system. Asian Fisheries Science, 14: 279-284
Chaitanawisuti, N., S Kritsanapuntu and W. Saentaweesuki, 2004. Growout of hatchery rearedjuvenile spotted Babylon (Babylonia areolata) to marketable size at four stockingdensities in flow-through and recirculating seawater system. Aquaculture International,4 (1): 781-785.
Chandran, R., 1987. Hydrobiological studies in the gradient zone of the Vellar estuary IV,Benthic fauna. Mahasagar, Bull. Natn. Inst. Ocean0gr., 20 (1): 1-13.
Chang, H. C., 1983. Experiment on feed and food diet for sea snail (Babyloniaformosae). Bull.Taiwan Fish. Res. Inst, 35: 101-105.
Chantrapornsyl, S. and A. Nateewathana, 1992. Morphometric and meristic variations ofChicoreus ramosus L. in Thai waters. Phuket mar. boil. Cent. Spec. Pub1., 10: 100-108.
Chemello, R., G. Scotti and M. Milazzo, 2000. L’uso della malacofauna marina in conservazionedella natura. Bolletino Malacologico, 36: 49-60.
Chen, Y., C. H. Kc, S. Q. Zhou and F. X. Li, 2005. Effects of food availability on feeding andgrowth of cultivated juvenile Babyloniaformosae habei(A1tena and Gittenberger 1981).Aquacult. Res, 36: 94-99.
Chew, K .K., 1992. China’s Dalian/Liaodong Penisula marine aquaculture, Part II. AquacultureMagazine, 18(1): 70-75.
Chhapgar, B. F., 1957. On the marine crabs (Decapoda:Brachyura) of Bombay State. J. Bombaynat. Hist Soc., 54:399-439.
Chidabmbaram, L., 1997. A note on whelk (Babylonia spp.) fishery in Pondicherry. Mar. FishJnfor. Serv. T &E Ser., 147: p.15.
Chiu, Y. W. and L. L. Liu, 1994. Copulation and egg laying behaviours in the ivory shell,Babyloniaformosaeformosae (Neogastropoda: Buccinidae). Venus, 53: 49-55.
Chung, E., S. Kim and Y. Kim, 1993. Reproductive ecology of the purple snail, Rapana venosa(Gastropoda: Muricidae), with special reference to the reproductive cycle, deposition ofegg capsules, and hatching of larvae. Korean J. Malacoi, 9: 1-15.
Clarke, K. R. and R. M. Warwick, 1994. Changes in Marine Communities: An Approach toStatistical Analysis and Interpretation. National Environmental research Council, UK,144 pp.
Clucas, 1. A., 1997. Study of the options for utilization of by-catch and discards from marinecapture fisheries. FAO Fish. Circu-lar., (928): 59 pp.
153
CMFRI, 1983. Mariculture potential of Andaman and Nicobar Islands — An indicative survey.Bull. Cent. Mar. Fish. Res. Inst, 34: 108 pp.
CMFRI, 1989. Marine living resources of the union territory of Lakshadweep — An indicativesurvey with suggestions for development. Bull. Cent. Mar. Fish. Res. Inst, 43: 256 pp.
CMFRI, 2002. Annual Report 2001-2002, Central Marine Fisheries Research Institute, Cochin,160 pp.
Crichton, M. D., 1942. Some notes on the Madras Bullia. Proc. Malacol.Soc. London, (25): 143146.
Curtis, L. A., 1995. Growth, trematode parasitism and longevity of a long-lived marine gastropod(Ilyanassa obsoleta). J. mar. biol. Ass. (U.K.), 75:913-925.
Craeyrneersch, J. A., G. A., Piet, A. D. Rijnsdorp and J. Buijs, 2000. Distribuiton of macrofaunain relation to micro-distribution of trawling effort. In: Effects of fishing on non-targetspecies and habitats (Eds. M. J. Kaiser and S. J. dc Groot), Blackwell Science, Oxford,187-197.
Craig, G. Y. and N. S. Jones, 1966. Marine benthos, substrate and palaeo ecology.Palaeontology, 9: 30-38.
Dalla Via G. F. and U. Tappeiner, 1981. Morphological and functional correlates withdistribution of Murex trunculus L. and Murex brandaris L. (Mollusca, Gastropoda) inthe northern Adriatic. Bull. Zo0l., 48: 191-195.
D’ Asaro, C. N., 1970. Egg capsules of prosobranch mollusks from South Florida and theBahamas and notes on spawning in the laboratory. Bull. mar. Sci., 20: 414-440.
Dauer, D. M. and W.G. Conner, 1980. Effects of moderate sewage input on benthic polychaetepopulations. Estuarine, Coastal and Shelf Science, 10: 335-346.
Day, F., 1958. The Fishes of India being a natural history of the fishes known to inhabit the seasand fresh waters of India, Burma and Ceylon, Vol. I & II, 778 pp.
Day, J. H., 1967a. A Monograph on the Polychaeta of Southern Africa Part I--Errantm Trustees ofthe British Museum (Natural History), London, 1-468
Day, J. H, 1967b. A Monograph on the Polychaeata of Southem Africa Part ll--SedentanaTrustees of the British Museum (Natural History), London, 469-878
Debrot, A.O., 1990a. Temporal aspects of population dynamics and dispersal behaviour of theWest Indian Top shell, Cittariurn pica (Linnaeus), at selected sites in the Exuma Cays,Bahamas. Bull. mar. Sci, 47: 431-447.
Debrot, A.O., 1990b. Survival, growth, and fecundity of the West Indian Topshell, Cittarium pica(Linnaeus), in various rocky intertidal habitats of the Exuma Cays, Bahamas. TheVeliger, 33: 363-371.
Demian, E.S. and A.M. Ibrahim, 1972. Sexual dimorphism and sex ratio in the snail Marisacornuarietis (L). Bull. Zool. Soc. Egypt, 24: 52-63.
Devanesan, D.W and P.I. Chacko, 1944. On bionomics of the sacred chank, Xancus pyrum(Linne.). Proc. Nat. Inst. Sci. India, 10(1): 141-142.
Devaraj, M. and V. Ravichandran, 1988. Dynamics of Indian chank fisheries. Bull. Cen. Mar.Fish. Res. Inst, 42(1): 100-105.
154
Dorairaj, K. and V. Krishnamurthy, 1997. Cultivable tropical marine molluscs of Andaman andNicobar Islands. Phuket mar. boil. Cent. Spl. Publ, l7(l):165-169.
Driscoll, E. G. and D. E. Brandon, 1973. Mollusc-sediemnt relationships in northweatemBuzzards Bay, Massachusetts, U.S.A. Malacologia, 12(1): 13-46.
Dwiono, S. A. P., Pradina and P.C. Makatipu, 2001. Spawning and seed production of the greensnail (Turbo marmoratus L.) in Indonesia. SPC Trochus Information Bulletin, 7: 9-13.
Edwards, D.C., 1968. Reproducion in Olivella biplicata. Veliger, 10: 297-304.
Ekaratne, S. U. K. and D. J. Crisp, 1983. A geometric analysis of growth in gastropod shells, withparticular reference to turbinate forms. J. mar. biol. Ass. (U.K.), 63: 777-797.
Engle, V. D.,J. K. Summers and G. R. Gaston, 1994. A benthic index of environmental conditionof Gulf of Mexico estuaries. Estuaries, 2:372-384.
Eriksson, S. and B. Tallmark, 1974. The influence of environmental factors on the diurnal rhythmof the prosobranch gastropod Nassarius reticulatus (L.) from a non-tidal area. Zoon, 2:135-142.
Eriksson, S., S. Evans and B. Tallrnark, 1975. On the coexistence of scavengers on shallow,sandy bottoms in Gullmar Fjord (Sweden): Activity patterns and feeding ability. Ibid, 3:121-124.
Estebenet, A. L. and N. J. Cazzaniga, 1997. Sex related differential growth in Pomaceacanaliculata (Gastrpoda:Ampullan'idae). J. Moll. Stud., 63(4):292-297.
Estebenet, A. L., 1998. Allometric growth and insight on sexual dimorphism in Pomaceacanaliculata (Gastrpoda:Ampullariidae). Malacologia, 39(l-2):207-213.
Etter, R. J. and M. A. Rex, 1990. Population differentiation decreases with depth in deep-seagastropods. Deep-Sea Res., 37: 1251-1261.
Evans, P. L., M. J. Kaiser and R. N. Hughes, 1996. Behaviour and energetics of whelks,Buccinum undatum (L.), feeding on animals killed by beam trawling. J. Exp. mar.biol. Ecol, 197: 51-62.
Fa‘anunu’, U., S. Niumeitolu, M. Mateaki and K. Kikutani, 2001. Recent surveys of transplantedgreen snail (Turbo rnarmoratus) and trochus (Trochus niloticus) on Tongatapu, Tonga.SPC Trochus Information Bulletin, 7: 20-24.
FAO, 2004. Code of Conduct for Responsible Fisheries. Food and Agriculture Organisation,Rome, 4lpp.
Fauvel, P., 1953. T he fauna of India including Pakistan, Ceylon, Burma and Malaya. Annelida,Polychaeta. The Indian Press Ltd., 507 pp.
FDP, 2002. Testing a new whelk pot design. Project Summary, Fisheries DiversificationProgramme, 184:4 pp.
Feare, C. J. 1970. Aspects of the ecology of an exposed shore population of dogwhelks, Nucellalapillus (L). Oecologia, 5: 1-18.
155
Fischer, W. and G. Bianchi (Eds.), 1984. FAO species identification sheets for fishery purposes.Western Indian Ocean (Fishing Area 51). FAO, Rome, vols. I-VI, pag. var.
Fotheringham, N ., 1971. Life history patterns of the littoral gastropods Shaskyusfestivus (Hinds)and Ocenebra poulsoni Carpenter (Prosobranchia: Muricidae). Ecology, 52: 742-757.
Frank, P.W., 1965. Shell growth in a natural population of the turban snail, T egula funebralis.Growth, 29: 395-403.
Fretter, V., 1941. The Genital Ducts of Some British Stenoglossan Prosobranchs. J. mar. biol.Ass. (U. K.), 25: 173-211.
F retter, V., 1946. The genital ducts of Theodoxus, Lamellana and Trivia, and a discussion ontheir evolution in the prosobranchs. lbid, 27: 597-632.
Fretter, V. and A. Graham, 1962. British prosobranch molluscs: Their fimctional anatomy andecology. Ray Soc., London,755pp.
Gail, R., 1957. Trochus fishing. South Pacific Bull, p. 48.
Gallardo, C. S. and K. Gonzalez, 1994. Ovipostura y desarrollo intracapsular de Xantliochoruscassidiformis (Blainville, 1832) (Gastropoda: Muricidae) de la costa sur dc Chile.Gayana Zool. 58: 79-90.
Ganapathy, P. N. and A. V. Raman, 1970. Capitella capitata (Fabticus 1780) Polychaeta:(Capitellidae), an indicator of pollution in Vishakapatnam Harbour. Indian J. mar. Sci.,5(2): 251.
Gayanilo Jr, F.C., M. Soiiano and D. Pauly, 1988. A draft guide to the COMPLEAT ELEFAN.ICLARM Software Project , 2, 65 pp.
Gendron, L., 1992. Detennination of the size at sexual maturity of the waved whelk, Buccinumundatum Linnaeus, 1758, in the Gulf of St. Lawrence, as a basis for the establishment ofa minimum catchable size. J. Shellfish Res., 11(1): 1-7.
George, M. J ., C. Suseelan, and K. Balan, 1981. By-catch of shrimp fisheries in India. Mar. Fish.Inf Serv. T& E Ser., 28: 3-13.
Ghazi, H. K., 1962. Study of chank market in West Bengal. G.O.M.S. No. 3204, Food andAgricultural department, Govemment of Madras, 1-23.
Gibbs, P. E., P. L. Pascoe and G. R. Burt, 1988. Sex change in the female dog-whelk, Nucellalapillus, induced by tributyltin from antifouling paints. J. mar. biol. Ass. (U. K.), 68:715-731.
Gimenez, J ., T. Brey and A. Mackensen, 2004. Age, growth and mortality of the prosobranchZidona duflesnei (Donovan, 1823) in the Mar del Plata area, south-western AtlanticOcean. Marine Biology, 145: 707-712.
Gimin, R. and C. L. Lee, 1997. The reproductive cycle of Trochus niloticus in King Sound,Westem Australia. Proc. ACIAR, Canberra, (79): 52-59.
Glucksman, J . and R. Lindholn, 1982. A study of the commercial shell industry in Papua NewGuinea since World War Two with particular reference to village production of trochus( T rochus niloticus) and green snail (Turbo marmorarus). Sci. New Guinea, 9: 1-10.
Gokhale, S.V., 1960. Shell fisheries of Sauraslztra region, Gujarat State Department of Fisheries,Gujarat Govt. Publ., 34 pp.
156
Gordon, A., 1991. The bycatch from Indian shrimp tmwlers in the Bay of Bengal — Programmefor its improved utilization. BOBP Work. Paper, 68, 32 pp.
Gosner, K. L., 1971. Guide to Identification of Marine and Estuarine Invertebrates: CapeHatteras to the Bay of Fundy. John Wiley & Sons Inc. USA, 693 pp.
Graham, A., 1939. On the structure of the alimentary canal of the style bearing Prosobranchs.Proc. Zool. Soc. London, 109: 75-112.
Graham, A., 1941. The oesophagus of stenoglossan prosobranchs. Proc. Soc. Edinburgh, 61: 122.
Graham, A., 1949. The molluscan stomach. Trans. Roy. Soc. Edinburgh, 61: 737-778.
Gray, J. S., 1974. Animal-sediment relationships. Oceanogr. Mar. Biol. Annu. Rev., 12:223-261.
Greenstreet, S. P. R. and S. J. Hall, 1996. Fishing and the ground-fish assemblage structure in thenorth-westem North Sea: An analysis of long-term and spatial trends. Anim. EcoI., 65:577—598.
Grudemo, J. and T. Bohlin, 2000. Effects of sediment type and intra- and inter-specificcompletion on growth rate of the marine snail Hydrobia ulvae and Hydrobia ventrosa. J.Exp. mar. biol. Ecol, 253: 115-127.
Grudemo, J. and K. Johannesson, 1999. Size of mud snails, Hydrobia ulvae (Permant) and H.ventrosa (Montagu) in allopatry and sympatry: conclusions from field distribution andlaboratory growth experiments. J. Exp. mar. biol. Ecol, 239: 167-181.
Guo, X., S. E. Ford and F. Zhang, 1999. Molluscan aquaculture in China. J. Shellfish Res., 18(1):19-31.
Gurrin, S. and W. E. Carr, 1971. Chemoreception in Nassarius obsoletus: The role of specificstimulatory proteins. Science, 174: 293-295.
Hall, S. J ., 1994. Physical disturbance and marine benthic communities: life in unconsolidatedsediments. Ocean0gr.Mar. Biol. Annu. Rev., 32: 179-239.
Hall, S.J., 1999. The Effects of Fishing on Marine Ecosystems and Communities. Blackwell.UK, 274 pp.
Hall, S. J., D. Raffaelli and S. F. Thrush, 1992. Patchiness and disturbance in shallow waterbenthic assemblages. In: Aquatic Ecology, Scale, Pattern and Process (Eds. P. S.Guiller, A. G. Heldrew and D. G. Raffaelli). Blackwell Science, New York, 333-373.
Hahn, K. 0., 1989. Handbook of culture of Abalone and other Marine Gastropods. CRC Press,Boca Raton, FL, 348 pp.
Hancock, D. A., 1960. The ecology of molluscan enemies of the edible molluscs. Proc.Malacol. Soc. London, 34: 123-143.
Hancock, D. A., 1963. Marking experiments with the commercial whelk (Buccinum undatum).1CNAFSpl. Publ, 4: 176-187.
Hancock, D. A., 1967. Whelks. Laboratory leaflet (15), Ministry of Agriculture, Fisheries andFood, Burnham on Crouch Essex, U.K, 14 pp
Hancock, D.A., 1969. La pesqueria de mariscos en Chile. lnstitutode Fomento Pesquero,(45): 93PP
157
Harkantra, S. N. and A. H. Paiulekar, 1994. Soft sediment dwelling macroinvertebrates ofRajapur Bay (central west coast of India). Indian J. mar. Sci., 23: 31-34.
Harkantra, S. N., A. Nair, Z. A. Ansari and A. H. Parulekar, 1980. Benthos of the shelf regionalong the west coast of India. Indian J. mar. Sci., 9: 106-110.
Hardin, G., 1968. The tragedy of the commons. Science, 162: 1243—l248.
Harding, J.M. and R. Mann, 1999. Observations on the biology of the Veined Rapa whelk,Rapana venosa (Valenciennes, 1846) in the Chesapeake Bay. J. Shellfish Res, 18 (1):9-18.
Harrison, A. J ., I986. Gastropod fisheries of the Pacific with particular reference to Australianabalone. In: Jamieson, G.S. and Bourne, N.A. (eds), North Pacific Workshop on stockassessment and management of invertebrates. Canadian Spl. Pubi. Fish. Aquat. Sci, 92:14-22.
Hashimi, N. H., R. M. Kidwai and R. R. Nair, 1981. Comparative study of the topography andsediments of the westem and eastern continental shelves around Cape Comorin- IndianJ. mar. Sci., 10: 45-50.
Heslinga, G. A., 1981. Larval development, settlement and metamorphosis of the tropicalgastropod T rochus niloticus. Malacologia, 20: 349-357.
Heslinga, G. A. and A. Hillman, 1981. Hatchery culture of the commercial top snail T rochusniioticus in Palau, Caroline Islands. Aquaculi, 22: 35-43.
Heslinga, G. A., O. Orak and M. Ngiramengior, 1984. Coral reef sanctuaries for Trochus shells.Mar. Fish. Rev., 46(4): 73-80.
Himmelman, J. H. and J . R. Hamel, I993. Diet, behaviour and reproduction of the whelkBuccinum undatum in the northern Gulf of St. Lawrence, eastem Canada MarineBiology, 116: 423-430.125
Hobday, A. J . and M. J. Tegner, 2000. Status review of white abalone (Halotis sorenseni)throughout its range in Califomia and Mexico. NOAA Tech. Memor. NMFS- SWR-O35,90 pp.
Hobday, A. J., M. J . Tegner and P. L. Haaker, 2001. Overexploitation of a broadcast spawningmarine invertebrate: decline of the white abalone. Rev. Fish biol. F ish., 10, 493-514.
Hochachka, P. W. and G. N. Somero, 1984. Biochemical adaptation. Princeton University Press,Princeton, New Jersey, 537 pp.
Honma, K., 1988. Growth of the coral-reef gastropod T rochus niloticus L. Galaxea, 7: 1-12.
Hornell, J., 1914. The sacred chank of India. A monograph of the Indian conch (Turbinellapyrum). Madras Fish. BuIl., 7: 1-181.
Hornell, J ., 1915. The Indian varieties and races of the genus Turbinella. Mem. Indian Mus., 6:109-122.
Homell, J., 1916. An explanation of the cyclic character of the pearl fisheries of the Gulf ofMannar. Madras Fish. BuI1., 8: l 1-22.
Homell, J ., 1922. The common molluscs of south India. Madras Fish. BuIi., 14: 97-215.
158
Houston, R. S., 1971. Reproductive biology of Thais emarginata (Deshayes, 1839) and Thaiscanaliculata (Duclos, 1832). Veliger, 13: 348-357.
Hua P. N., N. T. X., Thu, M. D. Mirth, P. D. Hung and K. T. Yen, 2001. Spawning characteristicsof Babylonia areolata (Neogastropoda: Buccinida). Phuket mar. boil. Cen. Spl. Publ.,25(1):161-165.
Hunt, J. H., 1980. Status of queen conch (Strombus gigas) management in the Florida Keys,U.S.A. Proc. Annu. Gulf Caribb. Fish. Inst, 38: 94-103.
Hyland, J., E. Baptiste, J. Campbell, J. Kennedey, R. Kropp and S. Williams, 1991.Macroinfaunal communities of the Santa Maria Basin on the Califomia outer continentalshelf and slope. Mar. Ecol. Prog. Sen, 78: 147-161.
Ilano, A. S., A. Ito, K. Fujinaga and S. Nakao, 2004. Age detemiination of Buccinum isaotakii(Gastropoda: Buccinidae) from the growth striae on operculum and growth underlaboratory conditions. Aquacult, 242: 181-195
llona, S., M. Miller and D. Brewer, 2001. Sustainability of fishery bycatch: a process for assessinghighly diverse and numerous bycatch. Environmental Conservation, 28: 167-181
,1’Ismail, N. S., A. Z. Elkarmi and S. M. A1-Moghrabi, 2000. Population structure and shell
morphometrics of the corallivorous gastropod Drupella comus (Gastropoda:Prosobranchia) in the Gulf of Aqaba, Red Sea. Indian J. mar. Sci, 29: 165-170.
lversen, E. S., S. P. Bamierot and D. E. Jory, 1989. Evidence of survival value related to buryingbehavior in queen conch Strombus gigas, Fish. Bull. 88: 383-387.
Janson, K., 1982. Phenotypic differentiation in Littonina saxatilis Olivi (Mollusca, Prosobranchia)in a small area on the Swedish west coast. J. Moll. Stud., 48: 167-173.
Jayabaskaran, R., D. A. Ramesh and A. L. P. Pandian, 1996. Distribution and abundance ofmolluscan cryptofauna from Karaichalli island (Gulf of Mannar), Southeastern coast ofIndia. Phuket mar. boil. Cent. Spl. Publ., 16: 215-219.
J arayabhand, P. and Paphavasit, 1996. A review of the culture of tropical abalone with specialreference to Thailand. Aquacult, 140: 159-168.
Jenkins S. R. and A. R. Brand, 2001. The effect of dredge capture on the escape response of thegreat scallop, Pecten maximus (L.): implications for the survival of undersized discards.J. Exp. mar. boil. Ecol, 266: 33-50.
Jenner, C. E. and N. A. Chamberlain, 1955. Seasonal resorption and restoration of the copulatoryorgan in the mud snail Nassa obsolata. Biol. Bull, 10: 347.
Jones, A. R., C. S. Watson-Russel and A. Murray, 1986. Spatial patterns in the macrobenthiccommunities of the Hawkesbnry estuary, New South Wales. Aust. J. mar. Freshwat.Res, 37: 521-543.
Jones, R., 1981. The use of length composition data in fish stock assessments (with notes on VPAand cohort analysis). FA O Fz'sh.Circ., 734: 60 pp.
Jones, S., 1968. The molluscan fishery resources of India. Proc. Symp. Mollusca, Mar. Biol. Ass.India, 3: 906-918.
Jonklaas, R., 1970. Some observations from modem methods of harvesting Xancus pyrumLinnaeus. Symp. Mollttsca, Mar. Biol. Ass. India, 3: 919-924.
159
Kaiser, M. J. and K. Ramsay, 1997. Opportunistic feeding by dabs within areas of trawldisturbance: possible implications for increased survival. Mar. Ecol. Prog. Ser., 152:307-310.
Kaiser, M. J. and B. E. Spencer, 1994. Fish scavenging behavior in recently trawled areas. Mar.Ecol. Prog. Ser., 112: 41-49.
Kajikawa, A., 1978. On the artificial reproduction of the Japanese ivory shell, Babyloniajaponica (Reeve), use of irradiated sea water with ultraviolet ray (I). Spawning andHatching. Aquacult, 26: 130-134.
Kannapiran, E and J. K. Patterson Edward, 1996. Breeding biology of Babylon snail Babyloniaspirata (Linnaeus) (Mollusca: Neogastropoda: Buccinidae). Indian J. mar. Sci., 25: 368370.
Kasim, H. M., 1988. Commercial fish trawling over pearl and chank beds in the Gulf of Mannar —A new dimension to problems in shell fisheries. Bull. Cent. Mar. Fish. Res. Inst, 42(1):94-99.
Ke, C. H. and F. X. Li, 1991. Histology of gonad and reproductive cycle of Babylonia formosae.J. Oceanogr. T 9454/an Strait, 10: 213-220 (in Chinese).
Ke, C. H. and F. X. Li, 1992. Ultrastructural studies on spermatogenesis and sperm morphologyof Babylonia formosae (Sowerby) (Gastropoda). Acta Zool. Sinica, 38: 233-238 (inChinese).
Kc, C. H. and F. X. Li, 1993. A study on reproductive behaviour of Babylonia formosae(Gastropoda: Prosobranchia). Trans. Chinese Soc. Malacol, 4: 78-84 (in Chinese).
Ke, C. H., Y. Fu, H. Tang, S. Q. Zhou and F. X. Li, 1997. Studies on food, diet and dietaryprotein for ivory shell (Babyloniaformosae habei). Mar. Sci, 5: 5-7.
Kenchington, E. and A. Glass, 1998. Local adaptation and sexual dimorphism in the wavedwhelk (Buccinum undatum) in Atlantic Nova Scotia with Applications to FisheriesManagement. Canadian Tech. Rep. Fish. Aquat. Sci, 2237: 43pp.
Kenchington, E. and M. J. Lundy, 1996. A summary of a whelk (Buccinum undatum) test fisheryin the Tusket Island area of southwest Nova Scotia with a review of biologicalcharacteristics relevant to the development of this resource. DFO Atlantic Fish. Res.Document, 96/12: l9pp.
Kideys, A. E., R. D. M. Nash and R. G. Hartnoll, I993. Reproductive cycle and energeticcost of reproduction of the neogastropod Buccinum unclatum in the Irish Sea. J. mar.boil. Ass. (U. K.), 73:391-403.
Kideys, A. E., 1996. Determination of age and growth of Buccinum undatum L. (Gastropoda) offDouglas, Isle of Man. Helgolander Meeresunters, 50: 353-368.
King, M., 1995. Fisheries Biology, Assessment and Management. Fishing News Books: 341 pp.
Kinne, O., I972. Marine Ecology (Vol. 1, Part 3). Wiley-Interscience, London, 1291 pp.
Kohn, A. J ., 1961. Chemoreception in gastropod molluscs. Am. Zool., 1: 291-308.
Kohn, A.J. I983. Marine biogeography and evolution in the tropical Pacific: zoologicalperspectives. Bulletin of Marine Science, 33: 528-535.
Kohn, A. J. and J. W. Nybakken, 1975. Ecology of Conus on Eastern Indian Ocean fringingreefs: Diversity of species and resource utilization. Marine Biology, 29: 21 1-234.
I60
Koutsoubas, D. and E. V. Koukoura, 1990. The occurrence of Rapana venosa (Valenciemies,1846) (Gastropoda, Thaididae) in the Aegean Sea. Bull. Malac0l., 26: 201-204.
Kraeuter, J ., M. Castagna and R. Bisker, 1989. Growth rate estimates for Busycon carica(Gmelin, 1791) in Virgenia. J. Shellfish Res., 8: 219-225.
Krishnamurthy, V. and R. Soundararajan, 1999. Conservation of Trochus and Turbo in Andamanwaters. Phuket mar. boil. Cent. Spl. Publ., 19(1): 229-233.
Kn'tsanapuntu, S., N. Chaitanawisuti, W. Santhaweesuk and Y. Natsukari, 2005. Large scalegrowout of spotted Babylon, Babylonia areolata in eanhen ponds: Pilot monocultureoperation. Aquaculture Asia, 10(3): 39-43.
Krumbein, W. C. and F. J . Pettijolm, 1938, Manual of Sedimentary Petrology. Appleton, Century,and Crofts, 1nc., New York, 549 p.
Kurian, C. V., 1953. A preliminary survey of the bottom fauna and bottom deposits of theTravancore coast within the 15 fathom line. Proc. Nat. Inst. Sci. India, 19(6): 746-775.
Kurian, C. V., 1967. Studies of the benthos of the southwest coast of India. Bull. Nat. Inst. Sci.India, 38: 649-656.
Kurian, C.V., 1971. Distribution of benthos on the southwest coast of India. In: Fertility of thesea (Ed. J . D. Costlow Jr.). Gordon and Breach Scientific Publication, New York, 225239.
Kuiup, B. M., 200]. Experience from the seasonal closure of bottom trawling in Kerala (SouthIndia) on the exploited marine fisheries resources. Proc. First Intem.C0nf Fish.Aquacult. Environ. NW Indian Ocean, Sultan Qaboos University, Muscat, Sultanate ofOman, 98-106.
Kurup, B. M., P. Premlal, J.V. Thomas and V. Anand, 2003. Bottom trawl discards along Keralacoast : A case study. J. mar. boil. Ass. India, 45(1): 99-107.
Lafferty, K. D., 1993. Effects of parasitic castration on growth, reproduction and populationdynamics of the marine snail Cerithidae californica. Mar. Ecol. Prog. Ser., 96: 229-237.
Lancaster J. and C. L. J . Frid, 2002. The fate of discarded juvenile brown shrimps (Crangoncrangon) in the Solway Firth UK fishery. Fish. Res., 58: 95-107.
Lanteigne, M. and L. A. Davidson, 1992. Overview of the yield per trap and shell height atsexual maturity for waved whelk, Buccinum undatum, caught on the eastem coast ofNew Brunswick-1992. Canadian Tech. Rep. F ish. Aquat. Sci., 1896: 23pp.
Lasta, M., N. Ciocco, C. Bremec, and A. Roux, 1998. Moluscos bivalvos y gasteropodos. In: ElMar Argentina y sus recursos pesqueros. T omo 2: Los moluscos de interés pesquero (Ed.E. BoschiCultivos y estrategias reproductivas de bivalvos y equinoideos, 143-167.
Latama, G., 1997. Growth and survival of top shell larvae (T rochus niloticus) as a function oflight intensity. Phuket mar. boil. Cent. Sp]. Publ., 17(1): 221-223.
Lee, C .L., 1997. Design and operation of a land based closed recirculating hatchery system for thetop shell, Trochus niloticus, using treated bore water. Proc. ACIAR, Canberra, 79: 2732.
Lee, C. L. and M. Amos, 1997. Current status of top shell Trochus niloticus hatcheiies inAustralia, Indonesia and the Pacific-A review. Proc. ACIAR, Canberra, 79: 38-42.
161
Leiva, E. G and J. C. Castilla, 2002. A review of the world marine gastropod fishery: evolution ofcatches, management and the Chilean experience. Rev. Fish boil. F islr, 11: 283-300.
Levin, L. A. and J. D. Gage, 1998. Relationships between oxygen, organic matter and thediversity of bathyal macrofauna. Deep-Sea Res., 45: 129-163.
Lindeboon, H. J and S.J. deGroot, 1998. Effect of different types of fisheries on the North Seaand Irish Sea benthic ecosystems. NIOZ-Report, 1998-1/RIVO-DLO Report, C 003/98,Den Berg, T exel, The Netherlands: Netherland Institute of sea research, 404pp.
Lipton, A.P. and M. Selvakku, 2000. Breeding, rearing and sea ranching of chanks. In: MarineFisheries Research and Management (Eds. V. N. Pillai and N.G. Menon ). CentralMarine Fisheries Research Institute, Cochin: 765-774.
Lipton, A. P., and M. Selvakku, 2001. Tagging and recapture experiments in the Indian sacredchank, Turbinella pyrum along the Gulf of Mannar and Palk bay, India. Phuket mar.boil. Cent. Spl. Publ., 25(1): 51-55.
Long, B. G., I. R. Poiner and A. N. M. Harris, 1993. Method of estimating the standing stock ofTrochus niloticus incorporatinf Landsat satellite data, with application to the trochusresources of the Bourke Isles, Torres Strait, Australia. Marine Biology, 115: 587-593.
Longhurst, A. R. and D. Pauly, 1987. Ecology of tropical oceans. Academic Press, San Diego,California. 407 pp.
Lum Kong, A. and J. S. Kenny, 1989. The reproductive biology of the ampullariid snail Pomaceaurceus (Muller). J. Moll. Stud., 55: 53-66.
Macilvaine, J. C. and D. A. Ross, 1979. Sedimentary processes on the continental slope of NewEngland. J. Sedimentary Petrology, 49: 563-574.
Madhupratap, M., K. N. V. Nair, T. C. Gopalakrishnan, P. Haridas, K. K. C. Nair, P.Venug0pa1and M. Gauns, 2001. Arabian Sea oceanography and fisheries of the west coast of India.Curr. Sci, 81 (4), 355-361
Mahadevan, S. and K. N. Nayar 1974. Ecology of pearl oyster and chank beds. Bull. Cen. Mar.Fish. Inst, 25: 106-121.
Mahadevan, S. and K.N. Nayar, 1976. Underwater observations on the settlement of spat of pearloyster on the paars off Tuticorin. Indian J. Fish, 23 (l&2): 105-110.
Mahadevan, S., 1987. Oyster resources of India. Bull. Cen. Mar. Fish. Inst., 38: 14-16.
Mahadevan, S. and K. N. Nayar, 1966. Underwater ecological observations in the Gulf of mannaroff Tuticorin. VI. On the habitat, movements and breeding habits of the chank Xancuspyrum (Linnaeus). J. mar. boil. Ass. India, 8(1): 213-218.
Mahadevan, S. and K. N. Nayar, 1980. Valampuri (sinistral) chank fished off Tuticorin. Mar.Fish. Inf Serv. T& E. Ser., 26: 9.
Magalhaes, I-1., 1948. An ecological study of the snails of the genus Busycon at Beaufort, NorthCarolina. Ecol.Mon0gr., l8:377-409
Malaquias, M. A. E. and M. J. Sprung, 2005. Population biology of the cephalaspidean molluscHaminoea orbygniana in a temperate coastal lagoon (Ria Formosa, Portugal). Estuarine,Coastal and Shelf Science, 63: 177-185.
162
Malaquias, M. A. E., L. Bentes, K. Erzini and T.C. Borges, 2006. Molluscan diversity caught bytrawling fisheries: a case study in Southern Portugal. Fisheries Management andEcology, 13: 39-45.
Marcus, E. and E. Marcus, 1959. Studies on ‘Olividae’. B01. Fac. Filos Clien Univ. S. Paulo,232, Z0ol., 22: 99-188.
Marcus, E. and E. Marcus, 1962. Studies on Columbellidae. Bol. Fac. Filosciien Univ. S. Paulo,261, ZooI., 24: 335-402.
Martel, A., D. H. Larrivee and J. H. Himmelman, 1986a. Bahaviour and timing of copulation andegg-laying in the neogastropod Buccinum undatum L. J. Exp. mar. bioi. Ecol, 96:27-42.
Martel, A., D. H. Lanivee and J. H. Himmelman, 1986b. Reproductive cycle and seasonal feedingactivity of the neogastropod Buccinum undatum. Marine Biology. 92: 21 1-221.
Martell, K. A., V. Tumticliffe and I. R. Macdonald, 2002. Biological features of a buccinid whelk(Gastropoda: Neogastropoda) at the endeavour ventfeilds of Juan de Fuca Ridge,Northeastem Pacific. .1. Moll. Stud., 68: 45-53.
Martin, P. Sanchez and M. Ramon, 1995. Population structure and exploitation of Bulinusbrandaris (Molluscaz Gastropoda) off the Catalan coast (northwestem Mediterranean).Fish. Res., 23:3l9—33l.
McGowan, J. A., 1956. Current status of the trochus industry in Micronesia. Unpublished reportto the High Commissioner, US Trust Territory of the Pacific Islands, Saipan.
McGowan, J. A., 1958. The trochus fisherjv of the Trust Territory of the Pacific Islands.Unpublished report to the High Commissioner, US Trust Territory of the Pacific Islands,Saipan.
McKi1lup, S. C ., A. J. Butler and R.V. Mc Killup, 1993. The importance of sand flat morphologyto recruitment of the intertidal snail Nassarius pauperatus during ten consecutive yearsat three sites in South Australia. Marine Biology, 1151577-5 80.
Mc Quaid, C. D.,l982. The influence of dissection and predation on vertical size gradients inpopulations of the gastropod Oxystele variagata (Anton) on an exposed rocky shore.Oecologia, 53: 123-127.
Melake, K., 1993. Ecology of macrobenthos in the shallow coastal areas of Tewalit (Massawa),Ethiopia. J. mar. S)/'st., 4: 31-44.
Menon, N.G.,l996. Impact of bottom trawling on exploited resources. In: Marine biodiversity,conservation and management (Eds. N. G. Menon and C. S.G Pillai). CMFRI, Cochin,97-102. ‘
Menon, N. G. and N. G. K. Pillai, I996. The destruction of young fish and its impact on inshorefisheries In." Marine biodiversity", conservation and management (Eds. N. G. Menon andC. S.G Pillai). CMFR1, Cochin, 89-96.
Menon, P.M.G., 1976. Fisheries in the Andamans. Yojana, 20 (13): 63-68.
Middelfart, P., 1992a. Morphology and anatomy of Chicoreus branneus (Link, 1807) descriptionof shell and soft part. Phuket mar. boil. Cen. Sp}. Pubi, 11:54-60.
Middelfart, P., 1992b. Early life stages of the muricid gastropods Chicoreus ramosus, C.torrefactus and C. brtmneus from Phuket Island, Thailand. Phuket mar. bio. Cen. Spl.Publ., 10: 113-122.
163
Middelfart, P., 1996. Egg capsules ad early development of ten Muricid gastropods from Thaiwaters. Phuket mar. boil. Cen. Spl. Publ., 16: 103-130.
Minh, L. D., 2000. Reproductive biology of the abalone Haliotis varia Linne, 1758 in Cam RanhBay, South Central Vietnam. Phuket mar. boil. Cen. Spl. Publ., 21(1): 57-61.
Mohamed, K.S. and G.S. Rao, 1997. Seasonal growth, stock recruitment relationship andl predictive yield of the Indian squid Loligo duvauceli (Orbigny) exploited off Karnataka
coast. Indian J Fish., 44 (4): 319-329.
Moller, P., L. Pihl, and R. Rosenberg, 1985.Benthic faunal energy flow and biological interactionin some shallow marine soft bottom habitat. Mar. Ecol. Prog. Sen, 27: 109-121.
Morel, G. M. and S. F. Bossy, 2004. Assessment of the whelk (Buccinum undatum L.) populationaround the Island of Jersey, Channel Isles. Fish. Res, 68: 283-291.
Morris, A. W.- and J. P. Riley, 1963. The determination of nitrate in sea-water. Analytica Chim.Acta., 20: 272.
Morton, B., 1990. The physiology and feeding behaviour of two marine scavenging gastropods inHong Kong: the subtidal Babylonia lutosa (Lamarck) and the intertidal Nassariusfestivus(Powys). J. Moll. Stud., 56: 275-288.
Morton, B. and K. Chan, 2003. The natural diet and degree of hunger of Nassarius festivus(Gastropoda: Nassariidae) on three beaches in Hong Kong. J. Moll. Stud, 69: 392-395.
Morton,B. and K. Chan, 2004. The population dynamics of Nassarius festivus(Gastropoda:Nassariidae) on three environmentally different beaches in Hong Kong. J.Moll. Stud., 70:329-339.
Morton, B., K. Chan, and J. C. Britton, 1995. Hunger overcomes fear in Nassarius festivus, ascavenging gastropod on Hong Kong shores. J. Moll. Stud, 61: 55-63.
Moses, S. T., 1923. The anatomy of the chank T urbinella pyr-um. Madras Fish. Bull, 17: 105127.
Mukundan, C., 1968. Molluscs in Indian tradition and economy, Symposium on mollusca.Cochin, Jan. 12-16: xxix-xxxv.
Murphey, J. and J. Riley, 1962. A modified single solution method for the determination ofphosphate in natural waters. Analytica Chim. Acta, 27: 31-36.
Murugan, A. and K. Ayyakkannu, 1991. Ecology of Uppanar backwater, Cuddalore: 1. Physicochemical parameters. Mahasagar, Bull. Nam. Inst. Oceanogiz, 24(1): 31-38.
Murugan, A. and J. K. P. Edward, 2000. Factors threatening biodiversity of marine molluscs inTuticorin, Gulf of Mannar. Phuket mar. biol. Cen. Spl. Publ., 21(1): 159-162.
Najmudeen, T. M. and A. C. C. Victor, 2003. Annual reproductive cycle of the tropical abaloneHaliotis van'a Linnaeus in Mandapam, Gulf of Mannar. Book of Abstracts, First IndianPearl Congress Exposition, February 5-8, 2003. Cen. Mar. Fish. Res. Inst, Cochin,p.108. (Abstract No. 43: 88-90).
Nance, J. M. and E. Scott-Denton, 1996. Bycatch in the Gulf of Mexico Shrimp Fishery. In:Developing and Sustaining World Fisheries Resources: The State of Science andManagement (Eds. D. A. Hancock, D. C. Smith, A. Grant, J. P. Beumer). Proc.Second World Fish. Congr. CSIRO, Melboume, Australia, 98-102.
164
Narasimham, K. A., 2005. Molluscan fisheries of India. B.R. Publishing corporation, Delhi,India, 348pp.
Narvarte, M. A., 2006. Biology and fishery of the whelk Buccinanops globulosum (Kiener, 1834)in northem coastal waters of the San Matias Gulf (Patagonia, argentina). Fish. Res., 77:131-137.
Navairete D J A. 2002. Distribution and abundance of Strombus costatus (Gmelin, 1791) larvaeand adults at the biosphere reserve: Banco Chinchorro, Quintana Roo, Mexico. Journal ofShellfish Research, 21(1): 227-231.
Nash, W. J ., 1985. Aspects of the biology of Trochus niloticus and its fishery in the Great BarrierReef region. Queensland Department of Primary Industries and the Great Barrier ReefMarine Park Authority, T ownsville, Queensland, Australia (Unpublished/Report).
Nash, W. J ., 1993. Trochus In: Near Shore Marine Resources of the South Pacific (Eds. E. Rightand L. Hill). lnternat. Cen Ocean Dev., Canada; 453-495.
Nayar, K. N. and K. K. Appukuttan, 1983. Trochus and Turbo resources. Bull. Cen. Mar. Fish.Res. Inst, 34: 81-84.
Nayar, K. N. and S. Mahadevan, 1973. Chank resources of India. Proc. Symp. Liv. Res. SeasAround India, CMFRI, Cochin, 672-686.
Nayar, K. N. and S. Mahadevan, 1974. Chank fisheries and industrial uses of chanks. In:Commercial mollusks of India (Eds. R.V. Nair and K.S. Rao) Bull. Cen. Mar. Fish. Res.Inst. 25: 122-140.
Nielsen, C. 1975. Observations on Buccinum undatum L. attacking bivalves and on preyresponses, with a short review on attack methods of other prosobranchs. Ophelia, 13: 87108.
Nugranad, J ., 1992. Experiemntal rearing of Chocoreus ramosus larvae at Prachuap Khiri Khanhatchery. Phuket mar. boil. Cen. Spec. Publ., 10: 53-64.
Nugranad, J ., T. Poomtong and K. Promchinda, 1994. Mass culture of Chicoreus remosus (L,1758) (Gastropoda: Muiicidae). Phuket mar. boil. Cen. Spl. Publ., 13: 67-70.
Nugranad, J and K. Promchinda, 1995. Fecundity, size of egg capsules and hatched veligers ofChicoreus ramosus in captive broodstocks. Phuket mar. boil. Cent. Spec. Publ., 15: 6974.
Olabarria, C. and M. H.Thurston, 2004. Pattems of morphological variation of the deep seagastropod Troschelia berniciensis (King,1846) (Buccinidae) from the NortheastemAtlatic Ocean. J. Moll. Stud. 70:59-66. ‘
Oliva, D. and J . C. Castilla, 1990. La pesqueria artesanal de lapas del género Fissurella en doscaletas de Chile central. In: Perspectivas de la actividad pesquera en Chile (Ed. M. A.Barbieri). Escuela de Ciencias del Mar, Universidad Catélica de Valparaiso, 179-193.
Oliva, D. and J . C. Castilla, 1992. Guia para el reconocimiento y morfometria de diez especies delgénero Fissurella (Bruguiere, 1789) (Mollusca: Gastropoda) comunes en la pesquefia yconchales indigenas de Chile Central y Sur. Guyana Zo0l., 56: 77-108.
Olsen, D. A., 1985. Fishery resource assessment of the Turks and Caicos Islands. Final reporton FAO Project T CI/83/O02. FAO, Rome, 94pp.
Olsson, A. A., 1956. Studies on the genus Olivella. Proc. Acd. Natur. Sci. Philad, 108: 155-225.
165
Ompi, M., 1994. The occurrence and size distribution of Turbo spp. in three intertidal areas ofnorth Sulawesi, Indonesia. Phuket mar. boil. Cen. Spl. Publ., 13: 143-146.
Osorio, C., J. Atria and S. Mann, 1979. Moluscos marinos de importancia comercial en Chile.Biol. Pesq. (Chile) ll: 3-47.
Paine R. T., 1969. The Pisaster-Tegula interaction: prey patches, predator food preference, andintertidal community structure, Ecology, 50: 95 0-961.
Paiva, P. C., 1993. Trophic structure of a shelf polychaete taxocoenosis in southern Brazil. Cah.biol. mart, 35:39-55.
Parsons, T. R., M. Takahashi and B. Hargrave, 1979. Biological Oceanograpliic Processes (11Ed.). Pergamon, Oxford, 332 pp.
Parulekar, A. H., 1973. Quantitative distribution of benthic fauna on the imier shelf of centralwest coast of India. Indian J. mar. Sci., 2 (2): 113-1 15.
Pastorino G., 1993. The taxonomic status of Buccinanops d’Orbigny, 1841 (Gastropoda:Nassaridae), The Veliger, 36 (2): 160-165.
Patterson, E. J. K. and K. Ayyakkannu, 1992a. Economic importance of the gastropodFasciolaria trapezium an important seafood d resource occurring along the southeastcoast of India. Phuket mar. biol. Cen. Spl. Publ., 10: 17-19.
Patterson, E. J. K. and K. Ayyakkannu, 1992b. Ecology of Chicoreus ramosus with data onlandings on the southeast coast of India. Phuket mar. biol Cent. Spec. Publ., 10: 150154.
Patterson, J ., T. Shamnugaraj and K. Ayyakkannu, 1994. Salinity tolerance of Babylonia spirata(Neogastropoda: Buccinidae). Phuket mar. biol. Cen. Spl. Publ., 13: 185-187.
Patterson, J. K., C. Raghunathan and K. Ayya1d<armu. 1995. Food preference, consumption andfeeding behaviour of the scavenging gastropod Babylonia spirata (Neogastropoda:Buccinidae). Indian J. mar. Sci., 24: 104-106.
Patterson, E. J. K. and K. Ayyakkannu, 1997. Reproductive biology of Hemifusus pugilinus(Bom) (Gastropoda: Melongenidae). Phuket mar. boil. Cen. Spl. Publ., 17(1): 93-96.
Pauly, D., 1980. On the interrelationships between natural mortality, growth parameters andmean environmental temperature in 175 fish stocks. J. du Conseil, 39(3): 175-192.
Pauly, D., 1983. Length converted catch curves. A powerful tool for fisheries research in thetropics (Part I). Fishbyte, 1(2): 9-13.
Pauly, D. and M.L. Soriano, 1986. Some practical extensions to Beverton and Ho1t’s relativeyie1d—per-recruit model. In: Proc. First Asian Fisheries F0rum.(Eds. J .L. Maclean, L.B.Dizon and L.V. Hosillo). Asian Fisheries Society, Manila, Philippines, 491-496.
Pearce, J. B. and G. Thorson, 1967. The feeding and reproductive biology of the red whelk,Neptunea antique (L) (Gastropoda, Prosobranchia). Ophelia, 4: 277-314.
Peile, A. J., 1922. The radulae of some Mitridae. Proc. Malacol. Soc. London, 15: 39-49.
Peile, A. J ., 1936. Radula notes. Proc. Malacol. Soc. London, 22: 139-144.
Penchaszadeh P., 1971. Aspectos de la embriogénesis de algunos gasteropodos del géneroBuccinanops d Orbigny, 1841 (Gastropoda, Buccinidae, Prosobranchiata). Physics, 81:475-483.
166
Peres, J. M. and J. Picard, 1964. Noveau manuel de bionomie benthique de la MerMediterranee. Rec. Trav. Sta. mar. Endoume, 31: 51-137.
Persson, L. E. 1982. Macrozoobenthic associations of Hano Bigth, Southern Baltic. Sarsia, 67:93-106.
Philip, M. B. and K. K. Appukkuttan 1997. Heavy landings of whelks, Babylonia spp. in trawlcatches off Quilon, South West coast of India. Mar. Fish. Infor. Serv. T &.E Ser., 147: 1214.
Phillips, B. F 1969. The population ecology of the whelk Dicathais aegrota in westem Australia.Aust. J. Freshw. Res., 20: 225-265.
Pillai, P. K. M and P. Devadoss (1974). On the occurrence of sacred chank Xancus pyrum(Linnaeus) off Port Nova. Indian J. Fish., 21(1): 279-281.
Pillai, N. S., 1998. By-catch reduction devices in shrimp trawling. Fish. Chimes, 18: 45-47.
Pires-Vanin, A. M. S. 1993. A macrofauna béntica naplataforma continental ao largo de Ubatuba,S50 Paulo, Brasil. Publeao esp. Inst. 0cean0gr., 10: 137-158.
Ponce-Diaz, G., A. Vega-Velasquez, M. Ramade-Villanueva, G. Leon-Carvallo and R. FrancoSantiago, 1998. Socioeconomic characteristics of the abalone fishery along the westcoast of the Baja California peninsula, Mexico. J. Shellfish. Res, 17: 853—85 7.
Ponder, W. F., 1970. Some aspects of the morphology of four species of the neogastropod familyMarginellidae with a discussion on the evolution of the taxoglossan poison gland. J.Malacol. Soc. Australia, 2(1): 55-8].
Ponder, W. F., 1972. The morphology of some mitiiform gastropods with special reference totheir alimentary and reproductive systems, (Mollusca: Neogastropoda). Malacologia, l1(2): 295-342.
Ponder, W. F., 1973. The origin and evolution of the Neogastropoda. Malacologia, 12: 295-338.
Pota, K. A and M. I. Pattel, 1988. Exploitation and marketing of chanks from the Gulf of Kutch.Bull. Cent. Mar. Fish. Res. Inst., 42(2): 445-450.
Poomtong, T. and (J. Nhongmeesub, 1996. Spawning, larval and juvenile rearing of babylon snail(Babylonia areolata, L.) under laboratory conditions. Phuket mar. boil. Cen. Spl. Publ.,16: 137-142.
Poutie1s,J. M. 1998. Bivalves and gastropods. In. The living resources of the Western CentralPacific (Eds. K.E- Carpenter and V.H. Niem) Vol. 1., Food and Agricultural Organisationofthe UN, Rome, p. 689.
Prabhadevi, L. and K. Ayyakannu, 1989. Macrobenthos of the Buckingham canal backwaters ofColeroon estuary. J. mar. biol. Ass. India, 3l(l&2): 80-85.
Prakash, T. N., 2000. Sediment distribution and placer mineral enrichment in the inner shelf ofQuilon, SW coast of India. Indian J. mar. Sci, 29: 120-127.
Prince J. D., T. L. Sellers, W. B. Ford and S. R. Talbot, 1988. Recruitment, growth, mortality andpopulation structure in a Southem Australian population of Haliotis mba (Mollusca:Gastropoda). Marine Biology. 100: 75- 82.
167
Prince, J., C. Walters, R. Ruiz-Avila and P. Sluczanowski, 1998. Territorial user’s rights and theAustralian abalone (Haliotis sp.) fishery. Proc North Pacific Symp. Invert. Stock AssessManag., Can. Spl. Publ. Fish. Aquat. Sci., 125: 367-375.
Probert, P. K. 1984. Disturbance, sediment stability and trophic structure of sofi-bottomcommunities. J. mar. Res., 42: 893-921.
Purdy, E. G., 1964. Sediments as substrates. In: Approaches to paleoecology (Eds. J. Irnbrie &N. D.Newell). John Wiley &_ Sons, New York, 238-271.
Raghunathan, C., J. K. P. Edward and K. Ayyakkannu, 1994. Long term study on foodconsumption and growth rate of Babylonia spirata (Neogastropoda: Buccinidae). Phuketmar. boil. Cen. Spl. Publ, I3: 207-210.
Rajagopal, S., I982. Studies on intertidal mollusc Umbonium vestiarium (Archaeogastropoda:Trochidae). Ph. D. Thesis, Annamalai University, India, 173pp.
Ramdoss, K., 2003. Gastropods. In: Status of Exploited Marine F ishery Resources of Inalia (Eds.M. M. Joseph and A.A. Jayaprakash). CMFRI, Kochi, 203-227.
Ramesh, A. D., R. Jayabaskaran and A. L. P. Pandian, 1996. Gastropods and bivalves associatedwith reef building corals, Palk Bay, southeastern India. Phuket mar. boil. Cen. Spl.Publ, 16: 257-260.
Ramon, M., 1986. Estudio y descripcion de las puestas, d6S&lT0llO larvario y protoconcha dealgunos gasteropodos prosobranquios de la costa catalana. Tesis de Licenciatura,University of Barcelona 157 pp.
Randall, J . E. I964. Contributions to the biology of the queen conch, Strombus gigas. Bull. mar.Sci. Gulf Carrib., 14: 246-295.
Rao, G. S., 1998. Bycatch and discards of shrimp trawlers in Visakhapatnam. In: Symposium onadvances and priorities in fisheries technology (Eds. M. R. Raghunath and M. D.Varghese). CIFT (India), Cochin, 501pp.
Rao, H. S., 1936. Observations on the rate of growth and longevity of trochus niloticus in theAndaman Islands. Rec. Indian Mus., 38: 473-489.
Rao, H. S. 1937. On the habitat and habits of Trochus Niloticus Linn. In the Andaman Seas. Rec.Indian Mus. 39: 47-82.
Rao, H. S. 1939. Consolidated report on the shell fisheries in the Andamans during the years1930-35. Zool. Surv. India. Calcutta, 133pp.
Rao, K. S., I988. Ecological monitoring of trawling grounds. J. Indian Fish. Ass., 18: 239-244.
Rao, P. G., 1968. Some aspects of the placer deposits of south Kerala in relation to geomorphicevolution of the west coast of India. D.Sc. Thesis, Andhra University, India.
Rasmussen, E., 1973. Systematics and ecology of the Isefiord marine fauna (Denmark). Ophelia,ll: 1-507.
Rex, M. A., A. Bond, R. J. Etter, A. C. Rex and C. T. Stuafl, 2002. Geographic variation of shellgeometry in the abyssal snail Xyloskenea naticiformis (Jeffreys, 1883). Veliger, 45: 218223.
Rhoads, D. C. and D. K. Young, 1970. The influence of deposit-feeding organisms onsediment stability and community trophic structure..I. mar. Res., 28: 150-177.
168
Richardson T. D. and K. M. Brown, 1990. Wave exposure and prey size selection in an intertidalpredator. J. Exp. mar. Biol. Ecol., 142: 105-120
Rilov, G., Y. Benayahu and A. Gasith, 2001. Low abundance and skewed population structure ofthe whelk Stramonita haemastoma along the Israeli Mediterranean coast. Mar. Ecol.Prog. Ser., 218: 189-202.
Roberts, D. J. and R. N., Hughes, 1980. Growth and reproductive rates of Littorina rudis fromthree contrasted shores in North Wales, U.K. Marine Biology, 58: 47-54.
Rowe, G. T ., P. T. Polloni and R. L. Headrich, 1982. the deep-sea macrobenthos on thecontinental margin of the northwest Atlantic ocean. Deep-Sea Rest, 29: 257-278.
Rumohr, H. and P. Krost, 1991. Experimental evidence of damage to the benthos by bottomtrawling with special referene to Arctica islandica. Meeresforschung, 33: 342-345.
Sabu, S., T. R. Gibinkumar, P. Pravin and M.R. Boopendranath, 2005. Trawl for whelk(Babylonia spp.) fishing, off Quilon, Kerala, India. International Symposium onImproved Sustainability of Fish Production Systems and Appropriate Technologies forUtilization, Cochin, India (in press).
Sainsbury K. J ., 1982a. Population dynamics and fishery management of the paua, Haliotis iris. I.Population structure, growth, reproduction, and mortality. NZ J. mar. Freshw. Res., 16:147- 161.
Sainsbury K. J. 1982b. Population dynamics and fishery management of the paua, Haliotis iris. II.Dynamics and Management as examined using a size class population model. NZ J. mar.Freshw. Res., 16: 163-173.
Sambandamurthy, P. S. and P. I. Chacko, 1969. Preliminary observations on chank markingexperiments conducted at Tuticorin. Madras J. Fish. 5: 105-109.
Sanders, H.L., 1960. Benthic studies in Buzzards Bay. 111. The structure of the soft-bottomcommunity. Limnol. Oceanogrz, 5: 138-153.
Santana, M., 1997. Esrudios del desarrollo intracapsular de T rophon geversianus (Pallas, 1769)(Gastropoda: Muricidae) bajo condiciones naturales y de laboratorio. Tesis dclicenciatura. Universidad Austral de Chile, Valdivia, Chile, 52 pp.
Santarelli, L. and P.Gros, 1985. Age and growth of the whelk Buccinum undatum L. (gastropoda:prosobranchia) using stable isotopes of the shell and operculum striae. Oceanol. Acta, 8:221-229.
Santos, M. F. L. dos and A- M. S. Pires-Vanin, 1999. The Cumacea community of thesoutheastem Brazilian Continental Shelf: structure and dynamics. Sci. Mar., 63(1): 15-25.
Santos, M. F. L. dos and A. M. S. Pires-Vanin, 2004. Structure and dynamics of the macrobenthiccommunities of Ubatuba Bay, southeastern Brazilian coast. Brazilian J. Oceanogn,52(1): 59-73.
Saraladevi, K., K.V. Jayalakshmy and P. Venugopal, 1991. Comminities and coexistence ofbenthos in nonhem limb of Cochin backwaters. Indian J. mar. .S'ci., 20(4): 249-254.
Saraladevi, K., P. Sheba, T. Balasubramanian, P. Venugopal and V. N. Sankaranarayanan, 1999.Benthic fauna of southwest and southeast coasts of India. Proc. Fourth Indian Fish.Forum, 9-12.
169
Sasikumar, G., Prathibha Rohit, N. Ramachandran, D. Nagaraja and G. Sampathkumar, 2006.Emerging small scale trap fishery for whelk (Babyionia spirata) in Malpe, SouthernKarnataka. Mar. Fish. Infor. Serv T &E Ser., 188: 14-17.
Satyamurti, S. T., 1952. The mollusca of Krusadai Island. Bul. Madras Govt. Mus, 1(2): 264 pp.
Scarabino V., 1977. Moluscos el Golfo San Matias (Provincia de Rio Negro, RepfiblicaArgentina). lnventario y claves para su identificacion, Com. Soc. Malac. Uruguay, IV(31-32): 177-297.
Scheltema, R. S., 1956. The effect of substrate on the length of planktonic existence of Nassariusobsoletus. Biol. Bull, 111: 312.
Scheltema, R. S., 1964. Feeding habits and growth in the mud-snail Nassarius obsoletus.Chesapeake Sci., 5: 161-166.
Scheltema, R.S., 1965. The relationship of salinity to larval development in Nassarius obsoletus(Gastropoda). Biol. Bull. mar. biol. Lab., Woods Hole, 129: 340-354.
Schmidt, S., M. Wolff and J. A. Vargas, 2002. Population ecology and fishery of Cittarium pica(Gastropoda: Trochidae) on the Caribbean coast of Costa Rica. Rev. Biol. T rop., 50(3/4):1079-1090.
Scotti, G. and R. Chemello, 2000. I Molluschi marini meditenanei degni di protezione: statodelle conoscenze e forme di tutela. Bolletino Malacologico, 36: 61-70.
Selvarani, J., 2001. Whelk processing industry at Thirespuram-Tuticorin. Mar. Fish. lnfor. Serv.T&E Ser., 167: ll-12.
Seshappa, G., 1953. Observations on the physical and biological features of the inshore seabottom along the Malabar coast. Proc. Nat. Inst. Sci. India, 19(2): 257-279.
Setna, S.B., 1933. The Andaman shell fishery. J. Bombay nat. Hist. Soc., 26(1): 94-100.
Shanker, K., B. Pandav and B. C. Choudhury, 2004. An Assessment of olive ridley(Lepidochelys olivacea) nesting population in Orissa, India. Biol. Conserv., 115:149-160.
Shanmugam, A., 1995. Reproductive cycle of a salt marsh snail Pythia plicata. J. mar. biol. Ass.India, 37(1&2): 22-26.
Shamnugaraj, T. and K. Ayyakkannu, 1996. Spawning and larval development of Murex tribulusL. (Prosobranchia: Muricidae) under laboratory conditions. Phuket mar. boil. Cent. Spec.Publ., 16: 131-136.
Shanmugaraj, T., A. Murugan and K. Ayyakkannu, 1994. Laboratory spawning and larvaldevelopment of Babylonia spirata (L) (Neogastropoda:Buccinidae). Phuket mar. biol.Cen. Spl. PubI., 13: 95-97.
Shanmugaraj, T. and K. Ayyakkannu 1997. Culture of Babylonia spirata (L) (Neogastropoda:Buccinidae). Phuket mar. biol. Cen. Spl. Publ., 17(1): 225-228.
Shim W.J., S. H. Kahng, S. H. Hong, N. S. Kim, S. K. Kim and J. H. Shim, 2000. lmposex in therock shell, Thais clavigera, as evidence of organotin contamination in the marineenvironment of Korea. Mar. Environ. Res, 49: 43 5-451.
Siddal, R., A. W. Pike, and A. H. Mcvicar. 1993. Parasites of Buccinum undarum (Mollusca:Prosobranchia) as biological indicators of sewage-sludge dispersal. Journal of MarineBiology Assessment U.K., 73: 931-948.
170
Siddal, M. E., N. A. Stokes and E. M. Burreson 1995. Molecular phylogenic evidence that thephylum Haplosporidia has an alveolate ancestry. Mol. Biol. Evol, 12: 573-58 l.
Sims, N. 1985. The abundance, distribution and exploitation of Trochus niloticus L. in the CookIslands, Proc. F ifth. Int. Coral Reef Congr. Tahiti. 5: 539-544.
Sivasubramaniam, 1990. Biological aspects of shrimp trawl bycatch. Bay of Bengal News Issue,40: 8-l0.
Siraimeetan, P., K.S. Rao and K.M.S.A. Hamsa, 1988. Chanks caught by the research vesselCadalmin IV from trawling grounds in Gulf of Mannar. Bull. Cen. Mar. Fish. Res. Inst,42(1): 89-93.
Smith, B. D., 1987. Growth rate, distribution and abundance of the introduced topshellTrochus niloticus L. on Guam, Mariana islands-Bull. Mar. Sci., 41(2): 466-474.
Snedecor, G. W. and W. G. Cochran, 1967. Statistical methods. Iowa State UniversityPress, Ames,593 pp.
Soemodihardjo, R. D. S. and W. Kastoro, 1982. Shallow Water Marine Mollusc of North WestJava. LON-LIPI. Jakarta, 143pp.
Solorzano, L., 1969. Determination of ammonia in natural waters by the phenol-hypochloritemethod. Limnol. Oceanogiz, 14: 799-801.
Sousa, W. P., 1983. Host life history and the effect of parasitic castration on growth: a field studyof Cerithidea californica Haldeman (Gastropoda: Prosobranchia) and its trematodeparasites. J. Exp. mar. Biol. Ecol, 73: 273-396.
Spight, T. M., C. Birkland and A. Lyons, 1974. Life histories of large and small murexes(Prosobranchia: Muricidae). Marine Biology, 24: 229-242.
Spight, T. M., 1977. Latitude, habitat, and hatching type for muricacean gastropods. Nautilus,91: 67—7 l.
Sreejaya, R., Anjana Mohan, P. Laxrnilatha and K. K. Appukkuttna, 2004. Larval developmentand seed production of the ‘whelk’ Babylonia spirata (L. 1758) (Neogastropoda:Buccinidae). J. mar. biol. Ass. India, 46(1): 64-72.
Sreenivasan, P.V., 1985. Clam fishery resources of the Vellar estuary. In: Harvest and post harvest technology of fish (Eds. K. Ravindran). Society of Fisheries TechnologistsAssociation. Cochin, 57-62.
Sreenivasan, P. V., 1988. Chank Fishery of Port Novo coast. Bull. Cen. Mar. Fish. Res. Inst,42(1): 84-88.
Srinath, M., S. Kuriakose and K. G. Mini, 2005. Methodology for the estimation of marine fishlandings in India. CMFRI Spl. Publ., 86:57pp.
Sriraman, K., S. Ajmalkhan and K. Ramamoorthi, 1988. Age and growth in Telescopiumtelescopium L. Bull. Cent. Mar. Fish. Res. Inst, 42 (1): 126-129.
Stella, C., T. Rajakumar and K. Ayyakkannu, 1992. Analysis of size class distributions ofChicoreus ramosus collected from the Gulf of Mannar area of southeast coast of India.Phuket mar. biol. Cen. Spl. Pub1., 112 91-93.
Stoner A.W. and J. M. Waite, 1990. Distribution and behavior of queen conch, Strombus gigas,relative to seagrass standing crop, Fish. Bull. 88: 573-585.
171
Stoner A.W., M. Ray-Culp and S. O’Connell, 1998. Settlement and recruitment of queen conch,Strombus gigas, in seagrass meadows: associations with habitat and micropredators.Fish. Bull, 96: 885-899.
Stuardo, J., 1979. Sobre la clasificacion, distribucion y variacion de Concholepas concholepas(Bruguiere, 1789): un estudio de taxonomia beta. Biol. Pesq. (Chile) 12: 5-38.
Sukumaran, K. K., Telang, K. Y. and Thippeswamy, O., 1982. Trawl fishery of south Kanarawith special reference to prawns and bycatches. Mar. Fish. Infor. Ser.T &E Ser., 44: 8—14.
Sunilkumar, K. and A. Antony, 1994. Impact of enviromnental parameters on polychaetousannelids in the mangrove swamps of Cochin, southwest coast of India. Indian J. mar.Sci, 23(3): 137-142.
Takada Y., 1996. Vertical migration during the life history of the intertidal gastropod Monodontalabio on a boulder shore, Mar. Ecol. Prog. Ser., 130: 1 17—123.
Tallmark, B., 1980. Population dynamics of Nassarius reticulatus (Gastropoda, Prosobranchia) inGullmar Fjord, Sweden. Mar. Ecol. Prog. Ser., 3: 51-62.
Tan, K. S. and B. Morton, 1998. The ecology of Engina armillata (Gastropoda: Buccinidae) inthe Cape d’Agui1ar Marine Reserve, Hong Kong, with particular reference to itspreferred prey (Polychaeta: Serpulidae). J. Zool. Lond., 244: 391-403.
Taylor, J .D. 1978. The diet of Buccinum undatum and Neptunea antiqua (Gastropoda:Buccinidae). J. Conchol., 29: 309-318.
Taylor, J .D., 1980 Diets and habitats of shallow water predatory gastropods around Tolo Chanel,Hong Kong and Southem China. Proceedings of first Intemational Workshop on theMalacofauna of Hong Kong, Hong Kong, Hong Kong Univ. Press, Hong Kong, 63-180.
Tegner, M. J., 1989. The California abalone fishery: production, ecological interactions, andprospects for the future. In: Marine Invertebrate Fisheries: Their Assessment andManagement (Ed. C. F. Caddy). John Wiley and Sons, N.Y., 401-420.
Thilaga, R.D., 1985. Studies on Bullia vittata (Linnaeus) (Molluscaz Gastropoda: Nassariidae)from Porto Novo waters. M. Phil. Thesis, Armamalai University, India.
Thilaga, R. D., R. Jayabal and M. Kalyani, 1987. Age, growth and length-weight relationshipstudies in the sandy beach whelk, Bullia vittata (L) (Mo11usca;Nassaridae). Mahasagar,20:191-194.
Thomas, M. L. H., and J. H. Himmelman, 1988. Influence of predation on shell morphology ofBuccinum undatum L. on Atlantic coast of Canada. J. Exp. mar. Biol. Ec0I., 115: 221236.
Thomas, S., J,K, Kizhakudan and B.V. Makadia 1998. A note on the chank fishery in the Gulf ofKutch. Mar. Fish. Infor. Serv. T&E Ser., 157: 20-21.
Thomas, J. V., P. Premlal, C. Sreedevi, and B. M. Kurup, 2004. Immediate effect of bottomtrawling on the physico-chemical parameters in the inshore waters (Cochin—Munambam)of Kerala. Indian J. Fish, 51: 277—286
Thorson, G., 1966. Some factors influencing the recruitment and establishment of marine benthiccommunities. Neth. J. mar. Res, 3: 241-267.
172
Traithong, T., J. Nugranad and K. Prumjinda, 1997. Maturity of the second generation ofhatchery cultured muricid snail (Chicoreus ramosus L. 1758). Phuket mar. boil. Cen.Spl. Publ., 17(1): 97-99.
Tsi, C.Y., S. T. Ma, J. K. Liu and F. S. Zhang, I983. A guide to the fauna of China. Mollusca,Vol. 2. Scientific Press, Peking, 150 pp.
Vale, P. K. and M. A. Rex, 1988. Repaired shell damage in deep-sea prosobranch gastropodsfrom the western North Atlantic. Malacologia, 28: 65-79.
Valentinsson, D., F. Sjodin, P. R. Jonsson, P. Nilsson and C. Wheatley, 1999. Appraisal of thepotential for a future fishery on whelks (Buccinum undatum) in Swedish waters: CPUEand biological aspects. Fish. Res., 42: 215-227
Valentinsson, D., 2002. Reproductive cycle and maternal effects on offspring size and number inthe neogastropod Buccinum undatum (L). Marine Biology. 140: 1139-1 147.
Varshney, P.K., K. Govindan, U.D. Gaikwad and B.N. Desai, 1988. Macrobenthos off Versova(Bombay), west coast of India in relation to enviromnental conditions. Indian J. mar.Sci.,l7: 222-227.
Vermeij, G.J. 1978. Biogeography and adaptatiompatterns of marine life. Harvard UniversityPress, 352 pp.
Veerayya, M. and P.S.N. Murry, 1974. Studies on th sediments of Vembanad Lake, Kerala state,Part III - Distribution and interpretation of bottom sediments. Indian J. mar. Sci., 3(1):16-27.
Viana, M.T. 2002. Abalone aquaculture, an overview. World Aquacult, 34-39.
Vijayakurnar, R., Z. A. Ansari and A. H. Parulekar, 1991. Benthic fauna of Kakinada Bay andbackwaters east coast of India. Indian J. mar. Sci., 20: 195-199.
Vivekanandan, E., 2003. Marine fisheries and fish biodiversity in India. In: Natural AquaticEcosystems of India. Thematic Biodiversity Strategy and Action Plan (Eds. E.Venkataraman). The National Biodiversity Strategy Action Plan, India, ZoologicalSurvey ofIndia,l7l-185.
Wakeel, E. L. and J. P. Riley, 1957. The determination of organic carbon in marine muds. J. Con.Int. Explor. Mer., 22, l80—l83.
Wassenberg, T. L. and B. J Hill, 1989. The effect of trawling and subsequent handling of thesurvival rate of the by-catch of the prawn trawlers in Morton Bay, Australia. Fzsh.Res.,7: 99-110.
Wassenberg, T. L. and B.J Hill, 1993. Selection of the appropriate duration of experiments tomeasure the survival of animals discarded from trawlers. Fish. Res., 17: 343-352.
Webber, I-l. H., 1977. Gastropoda: Prosobranchia. In: Reproduction of marine invertebrates,Molluscs: gastropods and cephaiopods, (Eds. A.C. Giese and J.S. Pearse). AcademicPress, New York, l-77.
Wefer, G. and J. S. Killingly, I980. Growth histories of strombid snails from Bermuda recordedin their O-18 and C-l3 profiles. Marine Biology, 60: 129-135.
Weinberg, J. R., 1984. Interactions between functional groups in soft-substrata: do speciesdifferences matter‘? .I. Exp. mar. Biol. Ecol, 80:11-28.


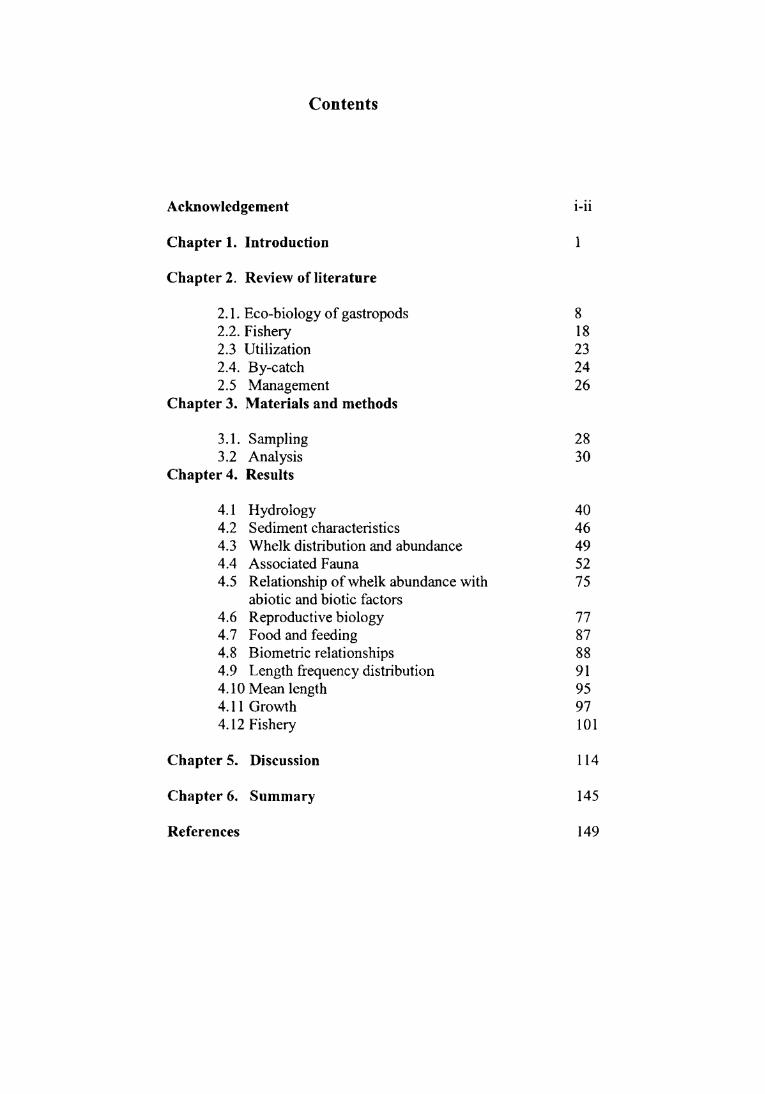


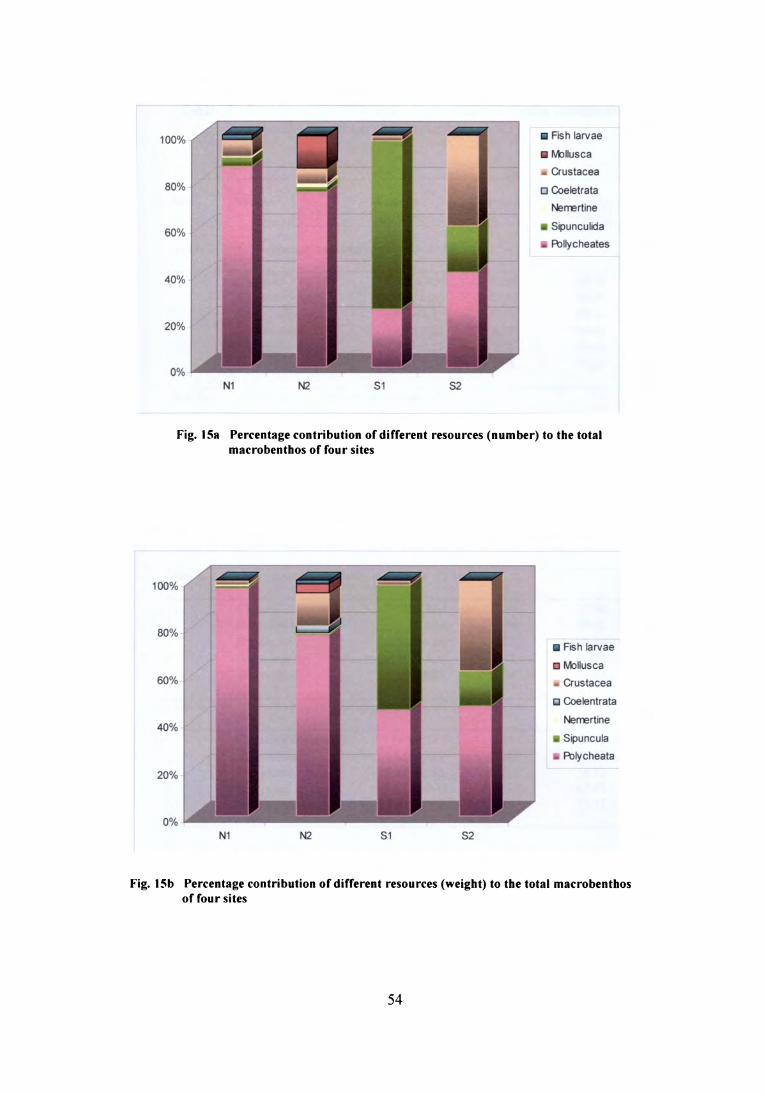


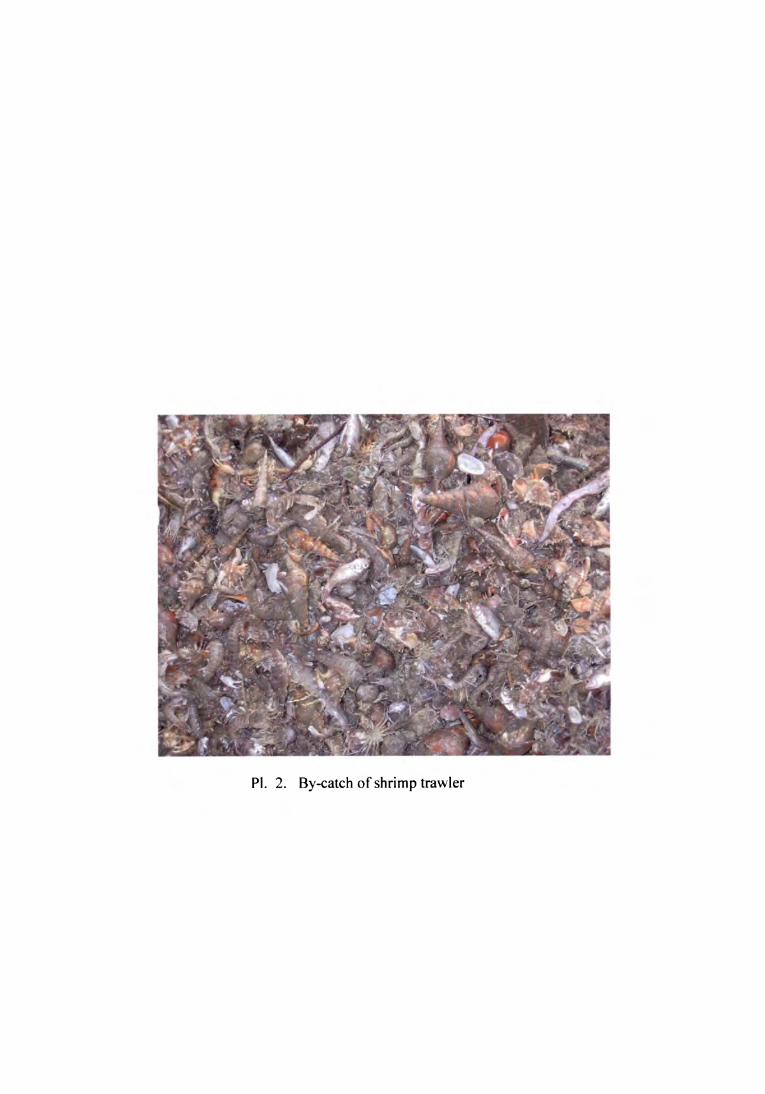


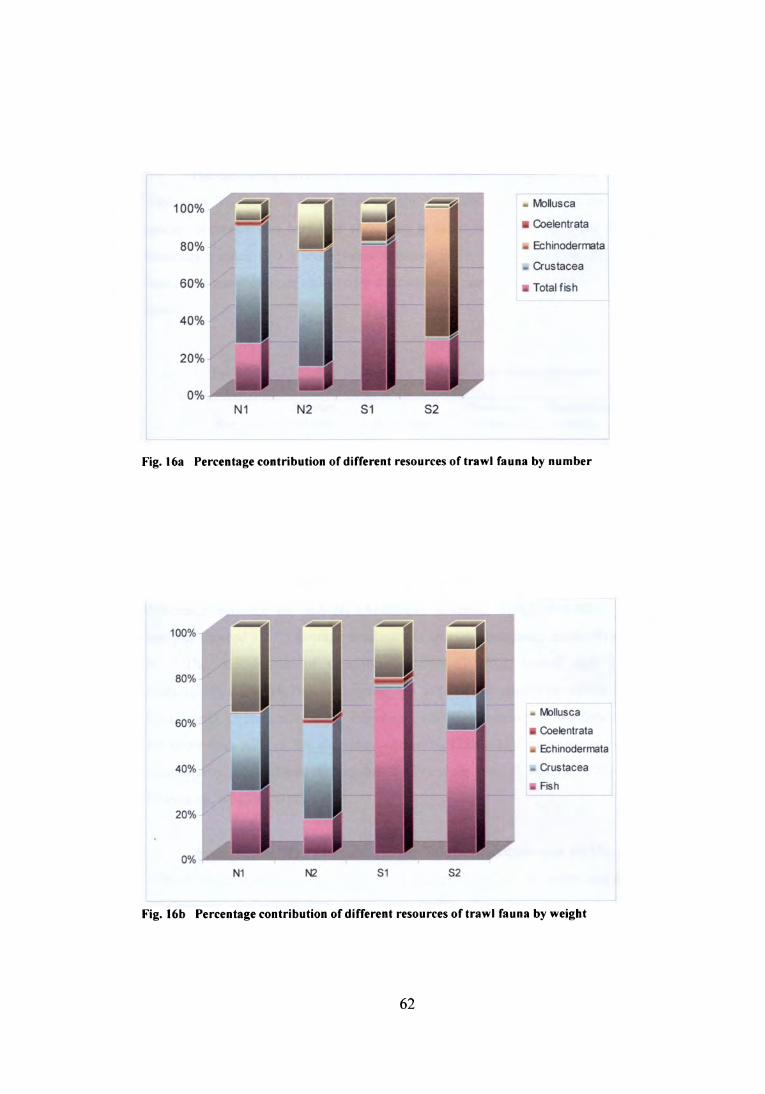


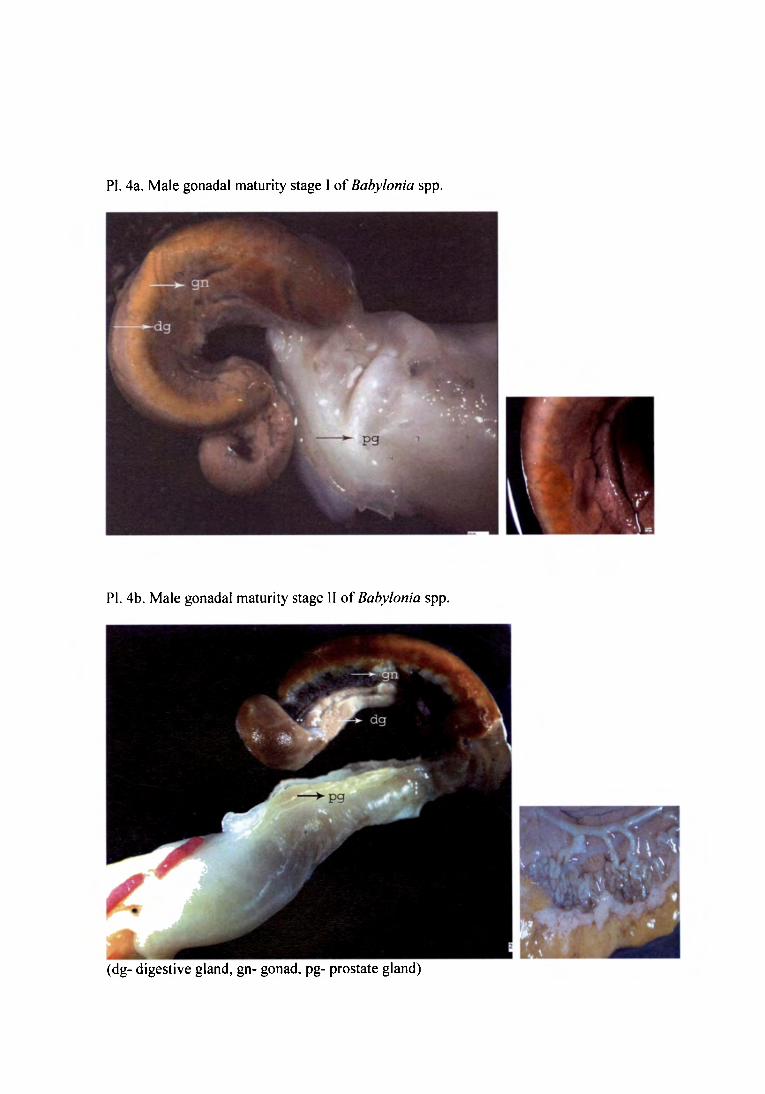


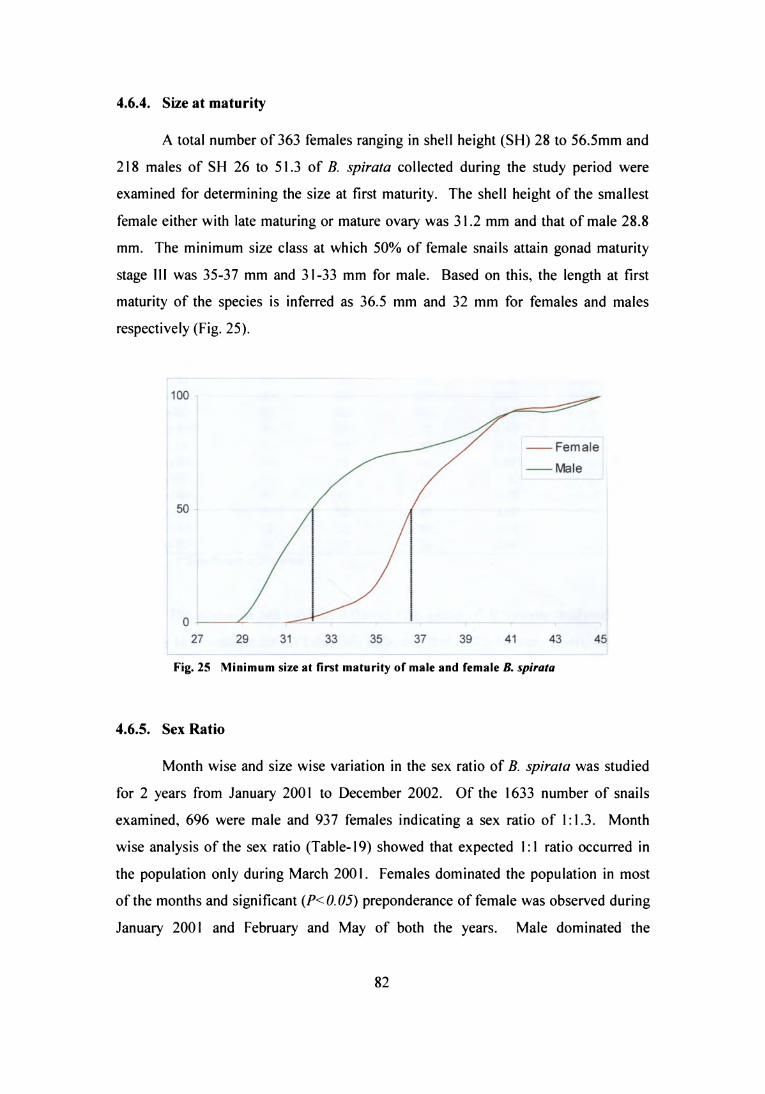


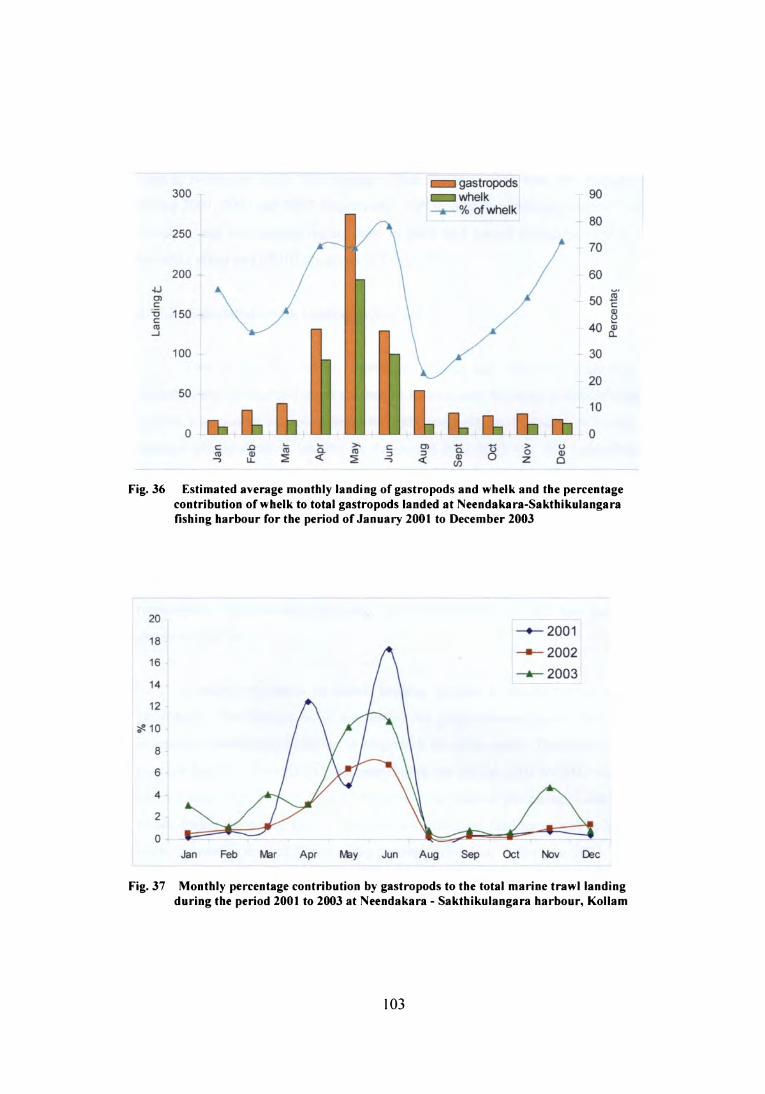


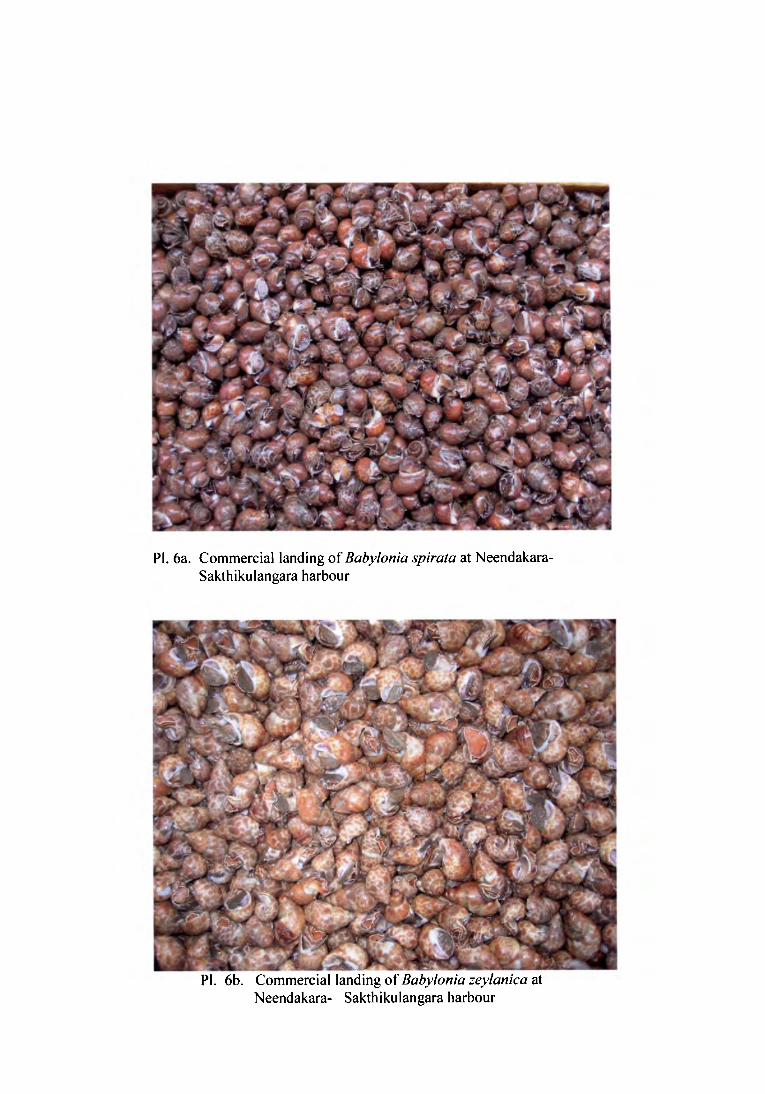


![The Religion of Babylonia and Assyria · The Religion of Babylonia and Assyria by Theophilus G. Pinches February, 2000 [Etext #2069] The Project Gutenberg Etext The Religion of Babylonia](https://static.documents.pub/doc/80x56/5f6e5b34eacf7332d0023a2a/the-religion-of-babylonia-and-assyria-the-religion-of-babylonia-and-assyria-by-theophilus.jpg)


