Navy Guidance for Conducting Ecological Risk Assessments Ecorisk Fundamentals Page 1 of 30 Fundamentals of Ecology and Ecotoxicology This section of the guidance provides an overview of the basic concepts of ecology and ecotoxicology, the technical areas that provide the basis for ecological risk assessments. The intent is not to train RPMs to become ecological risk assessors, ecologists, or ecotoxicologists, but rather to provide sufficient background on these topics to facilitate an understanding of terms and concepts that technical specialists (both contractors and regulators) may use when providing consultation on an ERA. 1.0 Ecology Ecology is the study of how organisms interact with the other living organisms and the non-living components (e.g., sunlight, soil, water, air) in their surrounding environment. The term “ecology” is derived from two Greek words, oikos (“house”), and logos (“study of”, or “governing rules”), literally, “the rules of the house.” The “rules” refer to the relationships and interconnections between organisms and their environment. The term environment refers to all the external conditions and factors, both living and non-living, that affect an organism. Ecological risk assessments are used to identify the ecological components that are most at risk from contaminants at a site and to quantify the magnitude of risk from those contaminants. In order to make these determinations, the relationships among organisms and between organisms and their physical environment must be understood. It is important to understand not only the physiological characteristics of individual organisms, but also their food habits, behavioral patterns, and habitat requirements. These factors all have important effects on the exposure of individual organisms to contaminants and the associated risk of this exposure. The risk to higher level ecological components such as communities or ecosystems (see below) will be affected by the effects of contaminants on individual organisms within those components as well as attributes specific to the surrounding environment. In addition to understanding the potential effects of contaminants on individual species, an ecological risk assessor must be cognizant of the important ecological relationships applicable to the site. Because each species at a site is in some way dependent upon other species and upon abiotic components of the environment, indirect effects of contamination are possible as well. Thus, while a contaminant may not be directly toxic to one species, by affecting species upon which it depends for food or that may feed upon it, the ecology of a site (and, perhaps, surrounding areas) may be at risk. Similarly, contaminants that affect processes such as decomposition or nutrient availability can drastically alter ecological relationships as well.
Transcript
Navy Guidance for Conducting Ecological Risk Assessments Ecorisk FundamentalsPage 1 of 30
Fundamentals of Ecology and EcotoxicologyThis section of the guidance provides an overview of the basic concepts of ecology andecotoxicology, the technical areas that provide the basis for ecological risk assessments.The intent is not to train RPMs to become ecological risk assessors, ecologists, orecotoxicologists, but rather to provide sufficient background on these topics to facilitatean understanding of terms and concepts that technical specialists (both contractors andregulators) may use when providing consultation on an ERA.
1.0 Ecology
Ecology is the study of how organisms interact with the other living organisms and thenon-living components (e.g., sunlight, soil, water, air) in their surrounding environment.The term “ecology” is derived from two Greek words, oikos (“house”), and logos (“studyof”, or “governing rules”), literally, “the rules of the house.” The “rules” refer to therelationships and interconnections between organisms and their environment. The termenvironment refers to all the external conditions and factors, both living and non-living,that affect an organism.
Ecological risk assessments are used to identify the ecological components that are mostat risk from contaminants at a site and to quantify the magnitude of risk from thosecontaminants. In order to make these determinations, the relationships among organismsand between organisms and their physical environment must be understood. It isimportant to understand not only the physiological characteristics of individualorganisms, but also their food habits, behavioral patterns, and habitat requirements.These factors all have important effects on the exposure of individual organisms tocontaminants and the associated risk of this exposure. The risk to higher level ecologicalcomponents such as communities or ecosystems (see below) will be affected by theeffects of contaminants on individual organisms within those components as well asattributes specific to the surrounding environment.
In addition to understanding the potential effects of contaminants on individual species,an ecological risk assessor must be cognizant of the important ecological relationshipsapplicable to the site. Because each species at a site is in some way dependent upon otherspecies and upon abiotic components of the environment, indirect effects ofcontamination are possible as well. Thus, while a contaminant may not be directly toxicto one species, by affecting species upon which it depends for food or that may feed uponit, the ecology of a site (and, perhaps, surrounding areas) may be at risk. Similarly,contaminants that affect processes such as decomposition or nutrient availability candrastically alter ecological relationships as well.
Navy Guidance for Conducting Ecological Risk Assessments Ecorisk FundamentalsPage 2 of 30
1.1 Ecological Levels of Organization
Ecological risk assessments are usually concerned with effects at four different levels ofecological organization or complexity. These levels of organization, arranged from thesimplest to most complex, are individual organisms, populations of organisms,communities and ecosystems. Each of these organizational levels has characteristicmeasures of extent, function, structure, and change associated with it. Ecological riskassessments are intended to estimate the risk that stressors (e.g., chemical contamination)will affect these ecological characteristics.
1.1.1 SpeciesDifferent types of organisms have specific (and often unique) requirements such astemperature, moisture conditions, chemical constituents, and diet. Collectively, a groupof individual organisms that are potentially capable of interbreeding under naturalconditions are referred to as a species and each species is typically reproductivelyisolated from other species. Organisms of the same species can have different physical orbehavioral characteristics. As an example, consider the species Homo sapiens (humans).Humans exhibit considerable variety in skin, hair, and eye color, size, and othercharacteristics. This same type of variety also occurs in plant and animal species.
Ecologists often have technical backgrounds aligned with particular taxonomic groupsunder the broad subdivisions of plant ecology or animal ecology. Different types oforganisms can differ considerably in their ecological characteristics and in how they areaffected by exposure to contaminants. For example, the exposure to PCBs and thepotential effects of PCBs in sediments on birds can be strongly influenced by thebehavior and food habits of individual species. Other types of organisms, such asburrowing invertebrates, will have different exposure pathways and associated risks.
1.1.2 PopulationsA group of individuals of the same species that occupy a particular area over a giveninterval of time are referred to as a population. Note that a population does notnecessarily include all the individual members of a species and there can be multiplepopulations for each species. For example, a particular fish species may have severalpopulations that occur in different areas of the oceans, with little or no exchange ofindividuals between the various populations. The size and extent of populations is oftendescribed in terms of density (i.e., the number of individuals per unit area). Populationstructure is the relative number of individuals in a particular age class (i.e., a readilyidentifiable stage within the life cycle of an organism) such as eggs, juveniles, and adults,or some other descriptive category (e.g., male or female). The size, extent, and structureof populations are affected by birth and death rates, changes in environmental conditions,competition with individuals of other species, and movement of individuals into and outof the area, all of which may be affected by exposure to a contaminant or some otherenvironmental stressor.
Examples of populations include:
Navy Guidance for Conducting Ecological Risk Assessments Ecorisk FundamentalsPage 3 of 30
• all of the largemouth bass living in a pond• all of the meadowlarks living in a particular region• all of the white oaks in a particular forest• all of the cougars in the Santa Ana Mountains of Southern California
Population size refers to the number of individuals in a given population. A maximumpopulation size can be reached for a limited area and time frame, given specific andlimited amounts of food, shelter, living space, and other resources. The maximumpopulation size that can be sustained in a given area is termed the carrying capacity. Thecarrying capacity can vary seasonally, monthly, or even daily according to changes inenvironmental conditions (Odum, 1971).
1.1.3 CommunitiesPopulations of various species living in the same area, representing a multitude ofinteractions and dependencies, are referred to as a community. The interactions betweenpopulations and the abiotic elements of the environment determine the geographicaldistribution and structure (e.g., numbers, types, and mix of species present) ofcommunities. Although the species within a community are, to some extent, replaceableby other species over space and time, their functions within the community are relativelyfixed in that they modify the physical aspects of an area, supply food to other organisms,die, and decompose. Communities can change over long periods of time in a processknown as ecological succession. During succession, some species are displaced throughtime by other species as new environmental conditions develop. For example, when ameadow undergoes succession that ultimately results in a forest, annual plants arereplaced gradually by perennials, shrubs, and trees. Each plant type modifies theenvironment in ways that tend to favor the succeeding type.
1.1.4 EcosystemsThe community and the abiotic (i.e., non-living) elements of a particular area function asa unit called the ecosystem. This is typically the highest organizational level of interestto ecologists and is often of interest in ecological risk assessments (ERA), depending onthe extent of environmental contamination in a geographic area. Each level oforganization is important to consider when scoping the ERA. It is important to keep inmind that evaluations of ecosystems within an ERA will be the most difficult and costlyevaluations you are likely to encounter. Typically, effects on ecosystems are inferred onthe basis of evaluations of populations and communities.
Ecosystems are typically classified by ecologists as aquatic or terrestrial ecosystems.Examples of terrestrial ecosystems in North America include arctic tundra, deciduousforests, hot deserts, cold deserts, coniferous forests, sand dunes, short-grass prairie,mountain meadows, and bottomland hardwood forests. Lakes, ponds, bogs, streams, andrivers are examples of freshwater ecosystems. Marine ecosystems include estuaries,intertidal zones, coral reefs, open ocean and deep ocean valleys and trenches.Experienced ecologists can often infer what types of organisms and environmentalconditions are likely to be present at a site by knowing what type of ecosystem is being
Navy Guidance for Conducting Ecological Risk Assessments Ecorisk FundamentalsPage 4 of 30
considered and the geographic location. Understanding the abiotic and bioticcomponents of ecosystems and ecosystem processes is the basis for defining the types ofexposures that can occur at contaminated sites. Abiotic factors can include amount ofsunlight, average temperature, temperature range, average precipitation and seasonaldistribution, and type of soil or sediment. Examples of chemical factors that influence thefunctioning of ecosystems include soil nutrients, toxic substances, salinity, and dissolvedoxygen.
Ecosystem type varies with location based on climatic, topographical, geological,chemical, and biotic factors. Ecosystems also vary in size. For example, a small pondand associated marsh vegetation around the pond periphery can be a distinct ecosystemwhile other types of aquatic environments such as a large lake, stream, or river are eachconsidered functioning ecosystems. Boundaries between ecosystems are often notobvious and adjoining ecosystems include some shared plant and animal species. A lakeand a deciduous forest may share such wildlife as frogs, salamanders, and insect-eatingbirds. The transition areas between land and water ecosystems are typically wetlandsclassified as freshwater and saltwater marshes, wet meadows, bogs, and swamps.
1.2 Habitat and Niche
An understanding of a species’ habitat is essential in determining its spatial distributionwithin an ecosystem. Habitat refers to the place or type of place where an organism mostcommonly occurs. The habitat provides factors necessary for survival of individuals andpopulations. Examples of important habitat features for animals include cover (i.e.,protection from weather extremes and predators), nesting and birthing sites, feeding sites,and denning/hibernation sites. Important habitats from an ecological risk perspectivemay be habitats that are chemically contaminated and have restricted areal extent orrepresent important seasonal use areas by large game animals such as white-tailed deer,mule deer, and wild turkeys.
Examples of habitats of limited extent within an ecosystem may include: a springwoodland pond used by amphibians for reproduction; a wooded hillside with rockoutcrops used as den sites and cover by copperheads or timber rattlesnakes; and shrub-covered areas on south- facing wooded slopes used by deer as winter bed down areas. Insome cases, ecologists consider a particular habitat type to be especially importantbecause it is present in limited amounts within a given area or region. Limited habitattypes will vary from one site to another and some areas may not have any habitats thatare regionally unique or important. Plant habitat is often defined on the basis oftopography and soil conditions. For example, a silver maple stand is common infloodplains of rivers where standing water occurs during at least part of the year.Saguaro cactus, on the other hand, is found on dry rocky slopes and sandy soils within theSonoran Desert of Arizona, Baja California, and Sonora, Mexico.
An understanding of animal distribution within an ecosystem is based, in part, onfamiliarity with the structural diversity of vegetation required for all aspects of a speciessurvival and how vegetation is distributed across a landscape. Knowing the amount of
Navy Guidance for Conducting Ecological Risk Assessments Ecorisk FundamentalsPage 5 of 30
fragmented and isolated habitat compared to continuous habitat of a given type in an areais important to the wildlife manager attempting to understand the suitability of an area tosustain viable species population levels, and to resource managers attempting to protectrare or unique biotic communities or habitats of special interest to a State or localcommunity. This understanding is equally important to an ecological risk assessmentattempting to determine species of concern and the habitats most likely to be affected bycontaminants or site remediation actions. Habitat fragmentation can result in reduction inthe total amount of a particular habitat type in an area, and in smaller more isolatedpatches of habitat that cannot sustain viable species populations. The degree offragmentation can also influence the movement of wildlife between patches.
The concept of ecological niche is useful in explaining how seemingly similar speciescan coexist in the same biotic community. Ecological niche is the particular combinationof biotic and abiotic factors required by a species to live in any one location.Niche issometimes thought of as the “role” an organisms fills in the ecosystem. Abiotic factorsmay include temperature, moisture, soil, pH, or salinity. Biotic factors may include anorganisms’s food requirements and the type of habitat with which it is typicallyassociated (e.g., forest, grassland, etc.). The term niche has been used by ecologists torefer to habitat, food, reproductive requirements, and physical and chemical factorsrelated to a species survival.
1.3 Energy and Nutrient Flow Through Ecosystems
In order to understand what an ecological risk assessment should evaluate, it is importantto understand the way that energy and materials moves through an ecosystem. This isimportant because it forms the basis for understanding how ecosystems are balanced,how contaminants will move through an ecosystem, and how ecosystems may be affectedby human activities or contaminants.
In terms of energy flow through ecosystems, organisms can be either producers orconsumers. Producers convert energy from the environment into the chemical energystored in carbon bonds, such as those found in the sugar glucose. Plants are the mostobvious examples of producers. Plants use energy from sunlight to convert carbondioxide and water into glucose (or other sugars) through the process known asphotosynthesis. Algae and cyanobacteria (known as blue-green algae) are alsophotosynthetic producers, like plants.
Consumers cannot generate energy-containing sugars as plants can. Instead, they use ametabolic process called respiration to derive energy from carbon-carbon bonds. Whenrespiration occurs, carbon-carbon bonds are broken and the carbon is combined withoxygen to form carbon dioxide. This process releases the energy, which is either used bythe organism (to move its muscles, digest food, excrete wastes, think, etc.) or the energyis lost as heat.
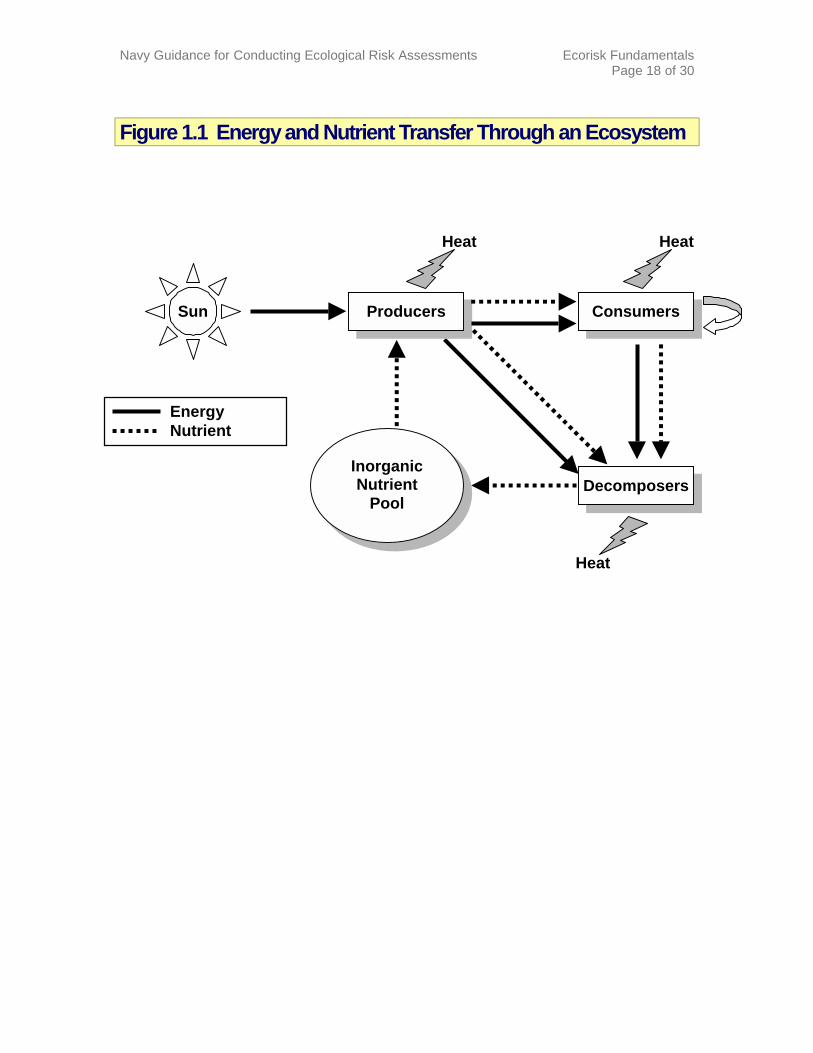
Figure 1.1 shows how energy flows through an ecosystem. Energy "flows" through anecosystem in the form of carbon-carbon chemical bonds and the solid arrows in Figure
Navy Guidance for Conducting Ecological Risk Assessments Ecorisk FundamentalsPage 6 of 30
1.1 represent the movement of this energy between trophic levels. Note that all the energyis initially derived from the sun, and that the ultimate fate of all the energy in ecosystemsis to be lost as heat. Energy does not recycle.
The flow of inorganic nutrients through the components of the ecosystem is also shownin Figure 1.1. These nutrients are referred to as “inorganic” because they do not containcarbon-carbon chemical bonds. Examples of inorganic nutrients include the phosphorousin teeth, bones, and cellular membranes; the nitrogen in amino acids (the building blocksof protein); and the iron in blood. The movement of inorganic nutrients is represented bythe dashed arrows in Figure 1.1. Producers obtain inorganic nutrients from the inorganicnutrient pool, which is usually the soil or water surrounding the plants or algae.Inorganic nutrients are passed from organism to organism as one organism is consumedby another. Ultimately, all organisms die and become detritus, which serves as the foodsource for decomposers. At this stage, the last of the energy is extracted (and lost as heat)and the inorganic nutrients are returned to the soil or water to be taken up again. Theinorganic nutrients are recycled, the energy is not.
1.4 Trophic Levels and Food Webs
The life histories of the biotic components and the patterns of energy and matter flowthrough ecosystems provide background information that is necessary to analyze thepossible exposure and extent of contaminant effects within an ecosystem. Typically, riskassessors will base the evaluation of the potential for contaminants to move through anecosystem on knowledge about trophic levels and food webs for that ecosystem and willevaluate effects at several different trophic levels.
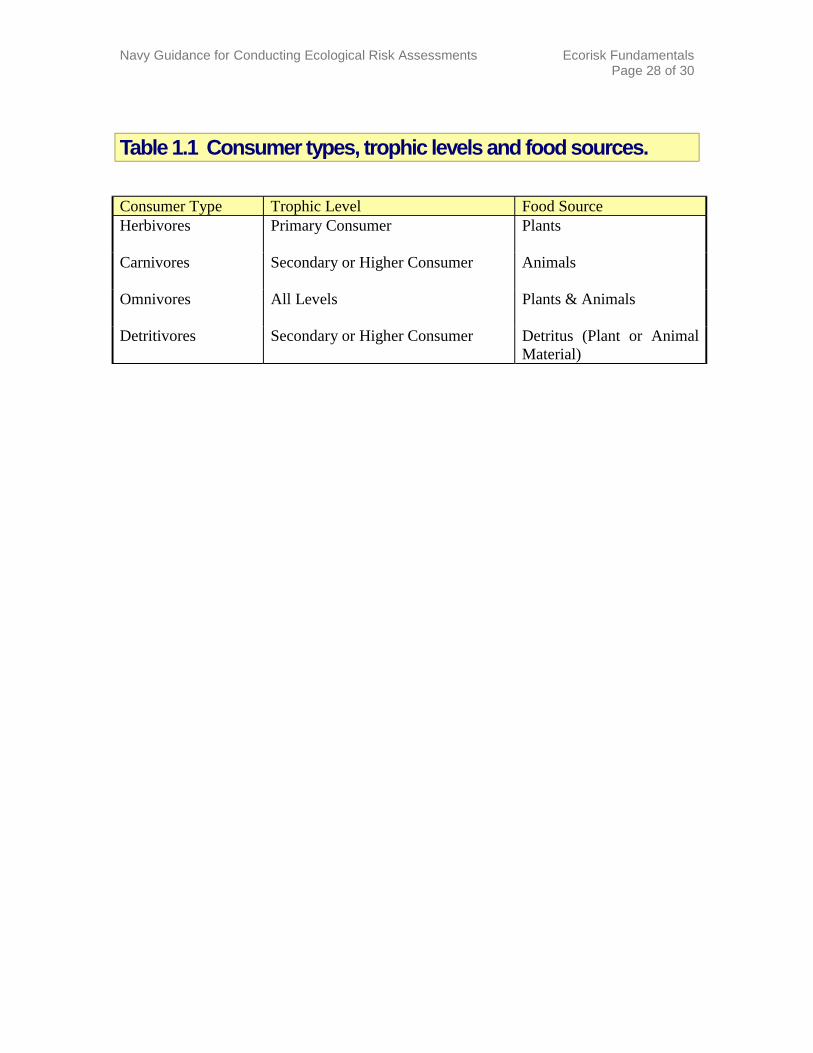
The term trophic level refers to an organism’s position in a food chain. Plants are at thebase of the food chain and are known as producers. Organisms that eat other organismsare referred to as consumers. Ecologists typically distinguish between four types ofconsumers, based upon what is being eaten by the consumer (Table 1.1). Organisms thateat plants are called herbivores or primary consumers. Organisms that eat other animalsare referred to as carnivores. The trophic level designation for a carnivore is determinedby the trophic level of the animal it eats. An animal that eats a primary consumer is asecondary consumer, an animal that eats a secondary consumer is a tertiary consumer,and so on. It is important to note that many animals do not specialize in their diets.Omnivores (such as humans) eat both animals and plants. In addition, except for somespecialists, most carnivores don't limit their diet to organisms of only one trophic level.Frogs, for instance, don't discriminate between herbivorous and carnivorous insects intheir diet. If it's the right size, and moving at the right distance, chances are the frog willeat it.
In order to visualize and track the feeding relationships between various organisms,ecologists use food chains and food webs. A food chain describes the transfer of matterand energy from one organism to another organism as one individual eats another or diesand decomposes. Food chains are normally arranged according to trophic levels. An
Navy Guidance for Conducting Ecological Risk Assessments Ecorisk FundamentalsPage 7 of 30
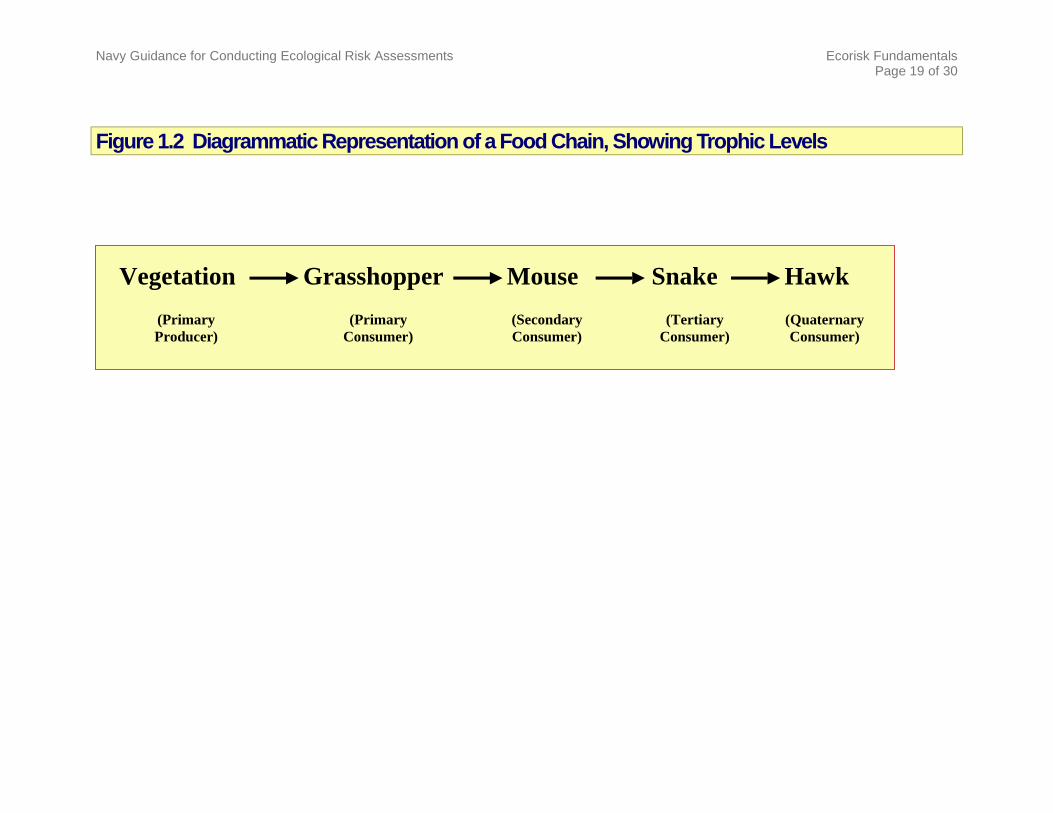
example of a food chain that might be typical for a field ecosystem is shown in Figure1.2.
In reality, feeding relationships in an ecosystem are more complicated than can bedepicted by a simple food chain. While some organisms do specialize in their diets (e.g.,anteaters feed exclusively on termites or ants), many organisms do not. For example,hawks don't limit their diets to snakes, snakes eat things other than mice, mice eat grassas well as grasshoppers, and so on. A more realistic representation of feedingrelationships in an ecosystem is a food web. An example of a food web for an aquaticecosystem is shown in Figure 1.3. This figure also identifies trophic levels for the typesof organisms indicated, although many of the organisms could be identified as belongingto more than one trophic level. Although decomposers, such as fungi or bacteria, are notshown in Figure 1.3, they could be included in the food web as well.
Note that, Figure 1.3 identifies only general types of organisms for many of the feedingsteps (e.g., fish-eating fish). In reality, there are many species that could fall into aparticular feeding group. For example, largemouth bass, walleye, or striped bass, are allfish-eating fish. Groups of species with similar feeding modes (or other environmentalrequirements) are referred to as guilds. Identification of food webs and guilds isimportant to when designing an ecological risk assessment, because there may actually bea number of potential species that can be used to evaluate the movement and effects ofcontaminants through particular trophic levels. The selection of the species to beevaluated by a particular ecological risk assessment will depend upon a number ofconsiderations, including availability of information, how representative the species is ofthe guild or trophic level being evaluated, sensitivity to contaminants, and field samplingdifficulties.
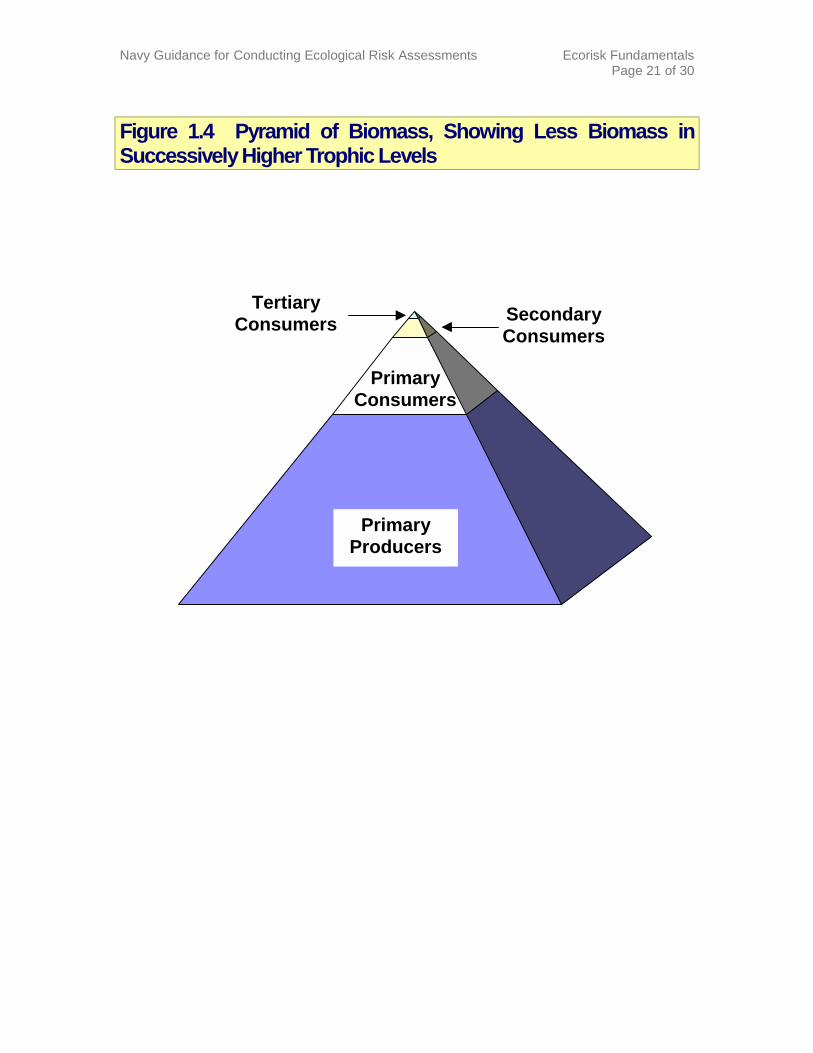
An important aspect of the transfer of organic matter and energy from one trophic level tothe next is the loss of energy during each transfer. This loss is due to the inability ofconsumers to fully assimilate the food they eat, and to the dissipation of energy as heatduring the chemical breakdown of food that occurs following ingestion. Consequently,only about 10% of the energy at one trophic level is assimilated into the next highertrophic level. This results in a smaller biomass (total amount of biological material) ateach successive trophic level (Figure 1.4) and explains why there are fewer predatorsthan prey in ecological systems. This also means that a consumer must ingest a largebiomass of food from lower trophic levels in order to acquire sufficient energy tomaintain itself. From an ecological risk assessment perspective, this means thatconsumers will often be exposed to higher doses of contaminants that can accumulate inbiological tissues than organisms in lower trophic levels.
1.5 Biogeochemical Cycling
While energy does not cycle through an ecosystem, inorganic nutrients do. The inorganicnutrients cycle through more than the organisms, however. They also enter into theatmosphere, the oceans, the soil, and even rocks. Since these chemicals cycle throughboth the biological and the geological world, the overall cycles are called biogeochemical
Navy Guidance for Conducting Ecological Risk Assessments Ecorisk FundamentalsPage 8 of 30
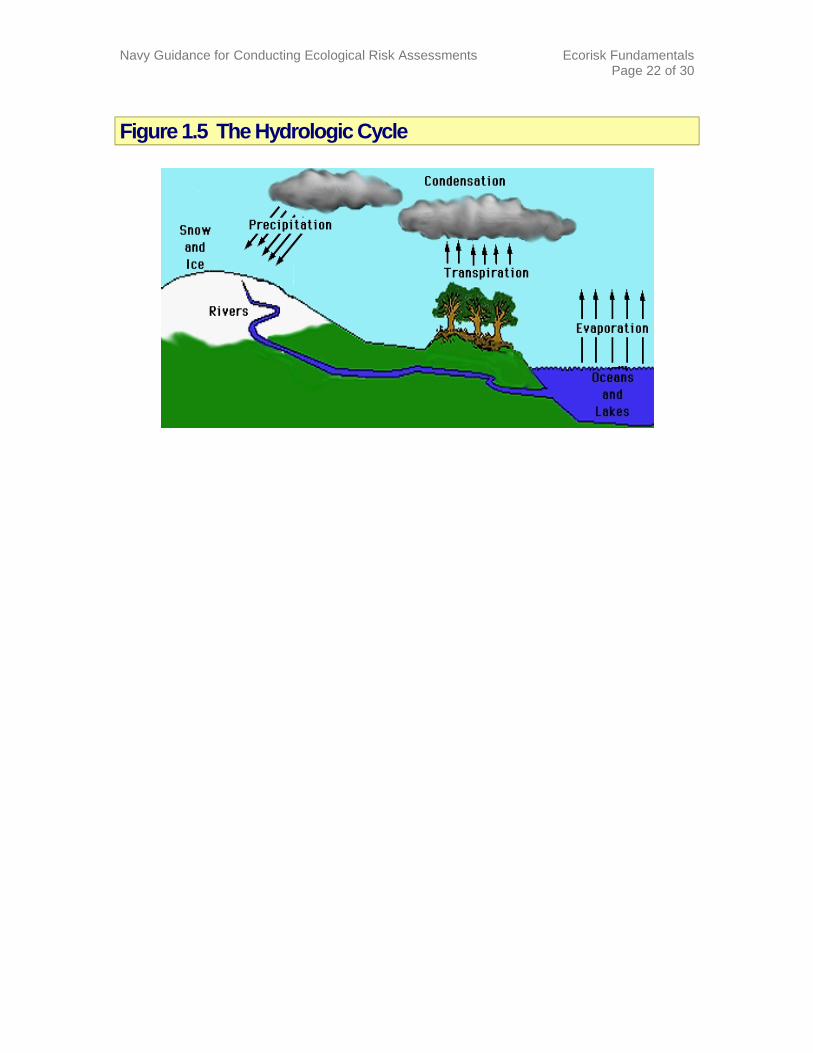
cycles. Biogeochemical cycles are essential to continued ecosystem functioning.Nutrients required for normal plant and animal growth are used over and over as theymove through the various trophic levels and the physical environment. Whenenvironmental contaminants interfere with plant uptake of nutrients and overall planthealth, cycling of nutrients through the ecosystem is also affected. Examples ofbiogeochemical cycles include the hydrologic (water), carbon, and nitrogen cycles.
Figure 1.5 is a simplistic diagram of the water cycle, and illustrates precipitation, storageof water in surface water and groundwater, the evaporation of water into the atmosphere,and the transpiration of water from biota. The hydrologic cycle involves the cycling ofwater through the environment. The hydrologic cycle begins with solar radiation causingevaporation from the oceans, freshwater bodies, and soils followed by cloud formation.Precipitation over the oceans represents a very short hydrologic cycle. Atmosphericcirculation also moves clouds over land, resulting in a more complex pathway for waterin the cycle.
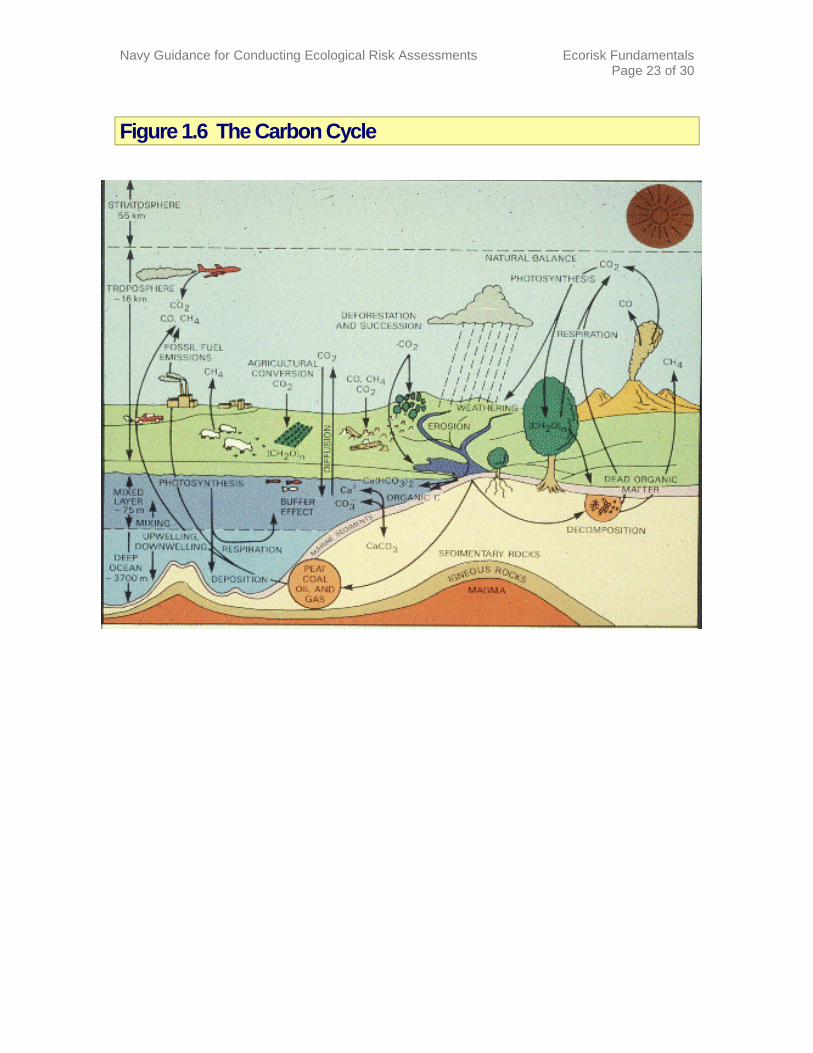
Figure 1.6 provides a simple diagram of the carbon cycle. The recycling of carbonbetween the abiotic and biotic elements of an ecosystem is linked to the flow of energythrough photosynthesis and respiration. Carbon is the basic building block ofcarbohydrates, fats, proteins, DNA, RNA, and other organic compounds needed for life.Most land plants get their carbon by absorbing carbon dioxide gas, which makes up about0.04% of the atmosphere, through pores in leaves. Phytoplankton (microscopic plantsthat live in aquatic ecosystems) get their carbon from carbon dioxide that is dissolved inwater.
Plants carry out photosynthesis, incorporating the carbon in carbon dioxide into complexorganic compounds such as glucose. Cellular respiration in animals, fungi, bacteria, andother organisms, converts the carbon of complex organic compounds back into carbondioxide for reuse by plants. Other aspects of the carbon cycle involve carbon that is tiedup for long periods of time in fossil fuels, as calcium carbonate in sediments, and ascarbon dioxide dissolved in the waters of the earth. Burning of carbon-containing fossilfuels and wood and volcanic eruptions are major contributors of carbon dioxide to theatmosphere.
A diagram showing both natural and human activities that influence the nitrogen cycle isshown in Figure 1.7. The nitrogen cycle involves the conversion of gaseous nitrogen inthe atmosphere through a process known as nitrification and the conversion of useablenitrogen compounds in the soil back to gaseous nitrogen that is released to theatmosphere through a process called denitrification. Nitrogen is necessary for plantgrowth and is a key element in the formation of amino acids, the building blocks ofproteins. Soil microorganisms and some blue-green algae are the only groups oforganisms able to fix or change atmospheric nitrogen into a form that is available forplant use. Bacteria of the genus Rhizobium are able to infect plant roots, and actsymbiotically with plants to fix nitrogen. Agricultural crops known to support nitrogen-fixing bacteria include legumes such as clover, alfalfa, and soybeans.
Navy Guidance for Conducting Ecological Risk Assessments Ecorisk FundamentalsPage 9 of 30
As an ecological risk manager it is important to understand how various pathways inbiogeochemical cycles may be affected by human activities at your site. The followingquestions illustrate the types of ecological issues that might be considered in addition tobiotic resources when conducting an ecological risk assessment and considering possibleremediation options:
• Do contaminant levels at the site affect bacteria responsible for nitrification anddenitrification?
• Would pump-and-treat remediation measures for cleaning up groundwatercontamination interfere with water levels of ponds, lakes, and marshes that aretypically recharged by local groundwater?
1.6 Indicator and Keystone Species
Ecosystem health is often measured by the presence, absence, or abundance of anindicator species in a particular habitat type. An indicator species is a species that hassuch a narrow range of ecological tolerance that their presence or absence is a goodindication of environmental conditions. Their presence does not provide an indication ofecosystem health but a rough indication that the basic ecosystem components necessaryto support the species in question are present. Examples of indicator species include thenorthern spotted owl in old-growth forests of the Pacific Northwest and certain types ofinsect larvae in aquatic sediments.
Some species are known to have a disproportionately large role in determining the overallcommunity structure within an ecosystem. These species are called keystone species.Removal, addition, or changes in local populations of keystone species can havesignificant impacts on the functioning of ecosystem processes, predatory relationships,and overall long-term stability. In many ecosystems keystone species cannot be easilydefined because the basic knowledge of species requirements is so poorly understood.The role of keystone species is not clearly understood until removal of the species, eitherartificially or by natural means, has occurred. Consequently, the use of keystone speciesas monitors of environmental health has limited use in most ecosystems. A classicexample of a keystone species is the sea otter (Enhydra lutris). The sea otter, preys onsea urchins in large numbers. When sea otter populations were removed by trappers andfishermen sea urchin populations increased dramatically, which led, in turn, toovergrazing of algae and kelp. Entire kelp beds were consumed, which caused declinesin important commercial fish species that were dependent on the kelp beds. When seaotters were reintroduced, the kelp beds recovered. Obviously an adverse effect fromcontaminant exposure on a sea otter population could have significant consequences onan entire ecosystem. Another example of a keystone species is the starfish (Pisasterochraceus), which preys on intertidal invertebrates of rocky habitats along the NorthAmerican Pacific coast. Experiments where starfish were removed demonstrated theircontrolling influence on mussels, barnacles, snails and other invertebrates.
Navy Guidance for Conducting Ecological Risk Assessments Ecorisk FundamentalsPage 10 of 30
Other types of keystone species are important as habitat modifiers. The beaver is anexample of a species that can affect the dominant vegetation to such an extent that theentire ecosystem is changed. Beavers remove trees in stream and pond habitats, whichcan change the surface water and light conditions present in aquatic environments.Flooding can occur in relatively dry areas adjacent to water bodies that changes the mixand abundance of plant species in an area.
1.7 Ecological Stressors
An ecological stressor is any action or material that imposes changes on an ecologicalsystem. In order to understand the causes of observed effects at a contaminated site, thetypes of factors present as stressors need to be defined. Stressors become ecologicallysignificant when they alter population, community, or ecosystem characteristics andfunction. For example, stressors might affect population size by reducing matingsuccess, reducing egg production, reducing survival of offspring, or reducing survival ofreproductive adults. Stressors can also affect population size by changing resistance todisease or parasites or by altering movement of organisms into or out of an area.
At contaminated sites the concern is primarily with chemical factors, although stress fromphysical and biological forces may also come into play, especially when evaluatingremedial alternatives. Stressors can be broadly classified as physical, biological, orchemical.
1.7.1 Physical StressorsPhysical stressors are actions that directly remove or alter habitat. Examples includetilling soil, filling wetlands, or dredging a channel or harbor. Ecosystems are dynamicand possess a certain degree of resilience to recover from disturbances. In fact, naturaldisturbance is a normal part of ecosystem functioning. Generally, larger and morefrequent physical stressors result in more excessive and longer-lasting effects. However,the addition of excessive physical stressors from human activities can sometimes exceedthe ability of the ecosystem to rebound. The time required for an area to recover from aphysical stressor once it is discontinued will often depend upon the type of ecosysteminvolved
Aquatic ecosystems are often affected by physical stressors. Erosion from roadconstruction or agricultural activities can create siltation (i.e., sediment buildup) instreams or lakes receiving runoff. Siltation can cause changes to habitat features such aswater depth, rooted emergent and submergent rooted plant distribution in a freshwater orsaltwater marsh, and loss of refuge or foraging areas for fish fry. Siltation can also resultin filling of the interstitial spaces in gravel or cobble materials on the bottoms of waterbodies. This can make these areas unsuitable for egg-laying by fishes, can suffocate eggsalready present, and reduce or eliminate benthic invertebrates. Water bodies exposed torunoff from soils that are high in clay content can experience increased turbidity for daysor weeks after a major rainfall event that, in turn, changes light intensity through thewater column. Reduced light penetration can affect a fish’s ability to find food and canlower the rate of photosynthesis by aquatic plants.
Navy Guidance for Conducting Ecological Risk Assessments Ecorisk FundamentalsPage 11 of 30
In addition to disturbing or destroying the immediate habitat(s), activities such as roadconstruction, logging, dredging wetlands, and agriculture can whittle away piecemeal atlarger, relatively intact areas. This results in habitat fragmentation. Some species cannotsurvive if the patch of habitat available to them falls below a certain size, while otherspecies prefer the edges where habitat types change. Thus, habitat fragmentation canresult in dramatic changes in community structure by altering the types of species that usefragmented areas. Habitat patches can become so fragmented that they act as islands thatisolate populations of species that are unable to traverse inhospitable areas of habitat tointerbreed with individuals in other fragments.
Risk assessors should be aware of physical impacts that have occurred at sites, as thismay alter the types of evaluations that are conducted. For example, previous activitiesthat removed topsoil from a site will lead to changes in the plant composition and theassociated wildlife. It would be inappropriate to conclude that differences between areference site and the contaminated area are due to contamination alone, unless the effectof the physical alteration of the environment is taken into account. The ecological effectsof physical stressors should also be considered when evaluating the effects of remedialalternatives for a site. Removal of soil or trees, filling or dredging of wetlands, and theerosion or siltation impacts of cleanup operations can all have substantial ecologicaleffects that, in some cases, may pose a greater ecological risk than the continued presenceof contaminants.
1.7.2 Biological StressorsBiological stressors are living organisms (including microorganisms), accidentally orpurposely introduced into an area or ecosystem that they would not normally inhabit, thatcause adverse impacts to existing species. For example, there has been much attentionand concern in the Great Lakes and in San Francisco Bay to the introduction of non-native organisms via ballast water of ships. Humans have a long history of introducingspecies to new locations. Unlike physical or chemical stressors, biological stressors canreproduce, adapt to the new area over time, and spread, often over a large geographicarea.
In some situations, introduced species spread through a geographic area rapidly after theirintroduction, competing with native species for space, food, nesting sites, etc, andsometimes altering the physical elements of existing habitat. Rapid population growth ofintroduced animals, in the absence of natural predators, can lead to habitat destruction fornative species. Accidental releases of the gypsy moth in Massachusetts and the Europeanspruce sawfly in Canada have led to destruction or damage to large areas of forests in theNortheastern United States and Canada. Species of nearly all taxonomic groups havebeen introduced into new locations around the world. A few notable examples in NorthAmerica include bacteria used for biological control, Japanese beetles, house sparrow,European starling, Norway rat, Japanese honeysuckle, common ragweed, saltcedar, andpurple loosestrife. The purple loosestrife, introduced from Europe, is quickly spreadingthroughout the U.S. and impacting wetlands. It poses a threat to waterfowl habitat by
Navy Guidance for Conducting Ecological Risk Assessments Ecorisk FundamentalsPage 12 of 30
forming dense stands of plants and crowding out native marsh plants and by impedingnormal surface water flow in wetlands.
Knowing the existing biological stressors at a contaminated site and in the vicinity of thesite will help risk assessors distinguish the types of impacts related to the chemicals inquestion compared to effects from introduced species. Information on biologicalstressors in the area also may provide insight to the stability of species populations or theentire ecosystem that would help to direct potential options or methods for the ecologicalrisk assessment process, including mitigative measures (e.g., planting vegetation tocontrol erosion) for remedial actions.
1.7.3 Chemical StressorsChemical stressors include hazardous waste, industrial chemical, pesticides, andfertilizers. Ecological risk assessments are most commonly used for examining chemicalstressors under programs such as CERCLA, RCRA, and the CWA. The effects ofchemical stressors can be categorized as occurring at the organism, population,community, or ecosystem levels. Examples of the types of effects at each of theseorganizational levels includes:
• Population level – changes in birth rates and mortality rates, increased dispersal,local extinction, and
• Community or ecosystem level - changes in community structure and functionalcomponents, habitat destruction.
The effects of contaminants on ecological systems can be influenced by a variety ofenvironmental factors. These factors can alter the outcome of contamination bychemically changing the contaminant to make it more or less toxic, affecting thebioavailability (see Section 2.1) of the contaminant, and by affecting the tolerance thatorganisms have for a contaminant. Examples of factors that can affect toxicity includetemperature, pH, salinity, water hardness, and soil characteristics. Temperature affectsthe chemical activity of contaminants and the physiological processes of organisms, thusaffecting toxicity. The pH within the soil, surface water, or groundwater can affect theform, reactivity, solubility, and toxicity of some contaminants. The tolerance oforganisms to salinity can also be affected by the presence of certain contaminants.Hardness refers to the amount of calcium, magnesium and ferric carbonate in water.Hardness can affect the toxicity of some contaminants, especially many heavy metals.This is why state and Federal water quality criteria and standards are sometimesdependent on hardness, pH, or salinity.
In terrestrial ecosystems, soil characteristics such as clay content and amount of organicmatter commonly affects toxicity and bioavailability. In addition, the nature of the soilcan affect the mobility of the contaminant to other areas or media.
Navy Guidance for Conducting Ecological Risk Assessments Ecorisk FundamentalsPage 13 of 30
Effects on individual organisms from exposure to chemical contaminants can range fromrapid death through sublethal effects to no observable. In the case of threatened andendangered species, the loss of a few individuals is more likely to be significant becausethe species is already at critically low levels. Effects become ecologically significantwhen they affect the survival, productivity, or function of enough individuals so that thepopulation size reaches critically low levels, population structure is altered, or thefunction of a population is impaired. Contaminant effects may also be ecologicallysignificant if the rates of specific ecological processes, such as decomposition,photosynthesis, or nutrient uptake, are significantly altered.
Population structure can be altered if stressors differentially affect different subgroups inthe population (e.g., females affected more than males, young affected more than adults,larval survival reduced)
Community and ecosystem effects occur as a result of changes in the ability ofpopulations to interact. Effects can be reflected as changes in species diversity, thenumber of trophic levels, or reductions in functions such as production of biomass byplants, or disruption of biogeochemical cycles.
2.0 Ecotoxicology and Ecological Risk Assessment
Ecotoxicology is the study of toxic effects of chemicals on non-human organisms withinan ecosystem at the individual, population, or community level (Suter 1993). In order toqualitatively and/or quantitatively evaluate risks posed by contaminants to ecologicalresources, ecological risk assessments rely heavily upon the field of ecotoxicology.Ecological evaluations of risks from contaminants can also be beneficial in identifyingexposure pathways for human populations. Thus, it is important for risk managers to befamiliar with basic terminology and concepts from the field of ecotoxicology.
2.1 Bioavailability and Exposure
Ecological exposure to chemical stressors occurs when a chemical reaches an organismand is in a form that is bioavailable. In order to be bioavailable, a chemical must reach alocation on or in an organism where it can cause an effect. The degree of bioavailabilitycan be measured through various studies, depending upon the type of contaminant underconsideration. The lower the bioavailability, the lower the risk that will be posed by thecontaminant. In the absence of bioavailability, there is no exposure and the contaminantwill essentially pose no risk to an organism. Keep in mind however, that the degree ofbioavailability differs among species and can change under different environmentalconditions.
Navy Guidance for Conducting Ecological Risk Assessments Ecorisk FundamentalsPage 14 of 30
2.2 Bioconcentration, Bioaccumulation and Biomagnification
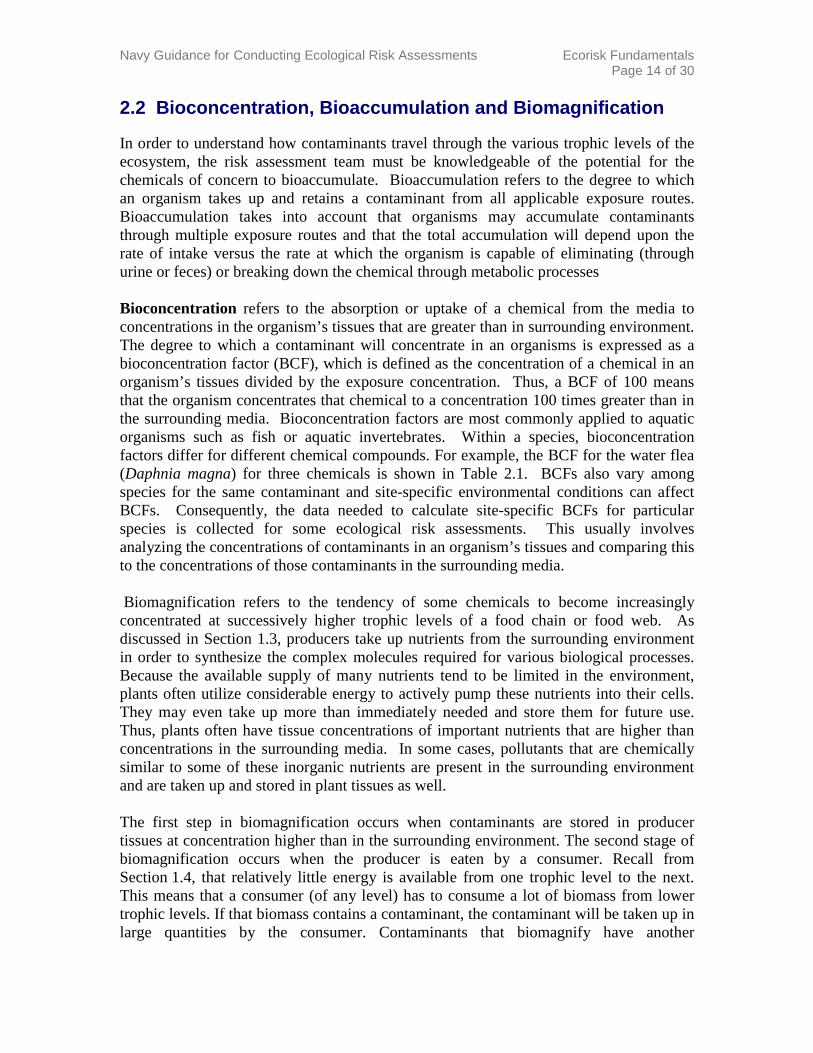
In order to understand how contaminants travel through the various trophic levels of theecosystem, the risk assessment team must be knowledgeable of the potential for thechemicals of concern to bioaccumulate. Bioaccumulation refers to the degree to whichan organism takes up and retains a contaminant from all applicable exposure routes.Bioaccumulation takes into account that organisms may accumulate contaminantsthrough multiple exposure routes and that the total accumulation will depend upon therate of intake versus the rate at which the organism is capable of eliminating (throughurine or feces) or breaking down the chemical through metabolic processes
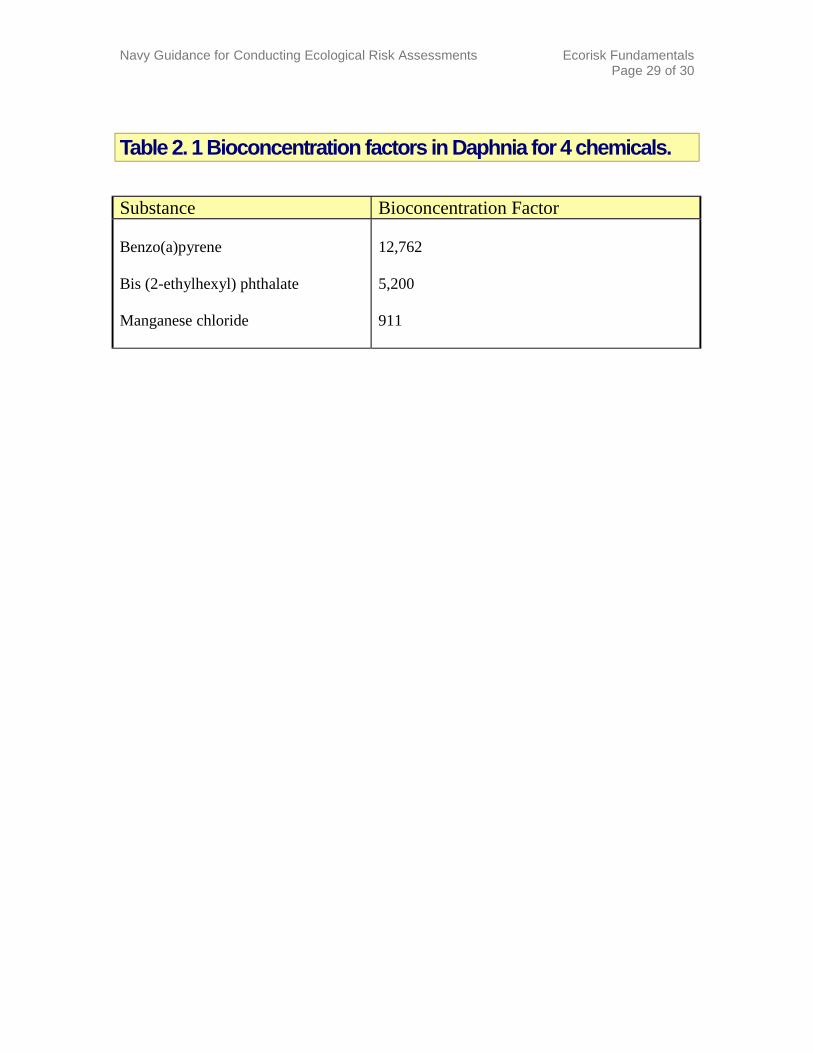
Bioconcentration refers to the absorption or uptake of a chemical from the media toconcentrations in the organism’s tissues that are greater than in surrounding environment.The degree to which a contaminant will concentrate in an organisms is expressed as abioconcentration factor (BCF), which is defined as the concentration of a chemical in anorganism’s tissues divided by the exposure concentration. Thus, a BCF of 100 meansthat the organism concentrates that chemical to a concentration 100 times greater than inthe surrounding media. Bioconcentration factors are most commonly applied to aquaticorganisms such as fish or aquatic invertebrates. Within a species, bioconcentrationfactors differ for different chemical compounds. For example, the BCF for the water flea(Daphnia magna) for three chemicals is shown in Table 2.1. BCFs also vary amongspecies for the same contaminant and site-specific environmental conditions can affectBCFs. Consequently, the data needed to calculate site-specific BCFs for particularspecies is collected for some ecological risk assessments. This usually involvesanalyzing the concentrations of contaminants in an organism’s tissues and comparing thisto the concentrations of those contaminants in the surrounding media.
Biomagnification refers to the tendency of some chemicals to become increasinglyconcentrated at successively higher trophic levels of a food chain or food web. Asdiscussed in Section 1.3, producers take up nutrients from the surrounding environmentin order to synthesize the complex molecules required for various biological processes.Because the available supply of many nutrients tend to be limited in the environment,plants often utilize considerable energy to actively pump these nutrients into their cells.They may even take up more than immediately needed and store them for future use.Thus, plants often have tissue concentrations of important nutrients that are higher thanconcentrations in the surrounding media. In some cases, pollutants that are chemicallysimilar to some of these inorganic nutrients are present in the surrounding environmentand are taken up and stored in plant tissues as well.
The first step in biomagnification occurs when contaminants are stored in producertissues at concentration higher than in the surrounding environment. The second stage ofbiomagnification occurs when the producer is eaten by a consumer. Recall fromSection 1.4, that relatively little energy is available from one trophic level to the next.This means that a consumer (of any level) has to consume a lot of biomass from lowertrophic levels. If that biomass contains a contaminant, the contaminant will be taken up inlarge quantities by the consumer. Contaminants that biomagnify have another
Navy Guidance for Conducting Ecological Risk Assessments Ecorisk FundamentalsPage 15 of 30
characteristic. Not only are they taken up by the producers, but they are absorbed andstored in the bodies of the consumers. This often occurs with contaminants that aresoluble in fat, such as DDT or PCB's. These materials are digested from the producerand move into the fat of the consumer. If the consumer is eaten by another consumer, itsfat is digested and the contaminant is then stored in the tissues of the new consumer. Inthis way, the contaminant builds up in the fatty tissues of the consumers and theconcentration of the contaminant in the tissues of consumers becomes higher with eachtrophic level. Water-soluble pollutants usually cannot biomagnify in this way becausethey would dissolve in the bodily fluids of the consumer. Since every organism loseswater to the environment, as the water is lost the pollutant would leave as well.
A classic case of biomagnification is that of DDT. During the years that it was used inthe U.S., the pesticide DDT caused thinning of eggshells in many birds-of-prey, includinghawks and eagles. DDT was present at low concentrations in water due to runoff fromagricultural fields. However, DDT is very persistent (long-lived) and accumulates in fats.This resulted in biomagnification in the food chain, beginning with aquatic plants andinvertebrates, then moving through fish, and finally to fish-eating birds. The lower dosesin lower trophic levels resulted in no observable adverse effects. However, the highdoses accumulated by fish-eating birds caused thinning of eggshells and reducedreproductive success, resulting in drastic declines in populations of these speciesnationwide.
2.3 Toxicity Testing/Endpoints
Toxicity testing is normally carried out under laboratory conditions to measure effects ontarget organisms exposed to a chemical in various concentrations during a specified time.It is not always possible or appropriate to conduct toxicity tests on species that actuallyoccur at the site. A representative species is typically used as a surrogate for laboratorytesting, especially in cases where an endangered species is the species of concern, whereno data are available, or proven testing techniques are not known for the species ofconcern.
On the basis of the types of exposures to chemicals expected to occur at the contaminatedsite, field laboratory tests may be necessary to determine acute or chronic effects. In casesof acute toxicity exposures may lead to death or extensive impairment of physiologicalfunctions and behavior of individual organisms relatively soon (i.e., hours or days) afterexposure to contaminants. Chronic toxicity occurs when organisms are exposed to lowlevels of contaminants over an extended time period (i.e., weeks, months, years).
In addition to considering whether the exposure is chronic or acute, the effects ofcontaminants can be broadly segregated into lethal and sublethal effects. Lethal effects,as the term implies, refers to direct mortality of exposed individuals. Sublethal refers toadverse effects other than death for exposed individuals. Examples of sublethal effectsthat may result from chemical exposure include reproductive impairment, reduced ratesof growth or photosynthesis, behavioral changes, and increased susceptibility to diseaseor other environmental stresses (e.g., temperature changes). From an ecological
Navy Guidance for Conducting Ecological Risk Assessments Ecorisk FundamentalsPage 16 of 30
standpoint, many sublethal effects may be as relevant as direct lethality from acontaminant. For example, if a contaminant significantly reduces photosynthesis, thechange in plant production may lead to a reduction in organisms in all other trophiclevels. Similarly, a contaminant exposure that results in reproductive failure for a givenspecies will likely have drastic population-level effects within a single generation. Thus,an ERA will ultimately need to consider the ecological significance of any toxic effects.
2.4 Dose-Response Relationships
When evaluating possible effects from exposure to chemical contaminants one mustcarefully evaluate doses likely to be received by individuals throughout their lifetime orat critical periods within their life cycle. Based on toxicity test results one can estimatedose-response relationships for the species being evaluated. It is important to rememberthat concentration and dose are not synonymous. Concentration refers to the amount ofcontaminant in a given amount of media (e.g., a surface water concentration for leadcould be 10µg/l). Dose refers to the amount of contaminant that an organism is exposedto, usually in amount of contaminant per unit body weight of the organism (e.g., a dose oflead to a bird might be expressed as 5 mg lead/kg body weight). Sometimes, dose isexpressed as a dose per unit time (e.g., 5 mg lead/kg body weight/day).
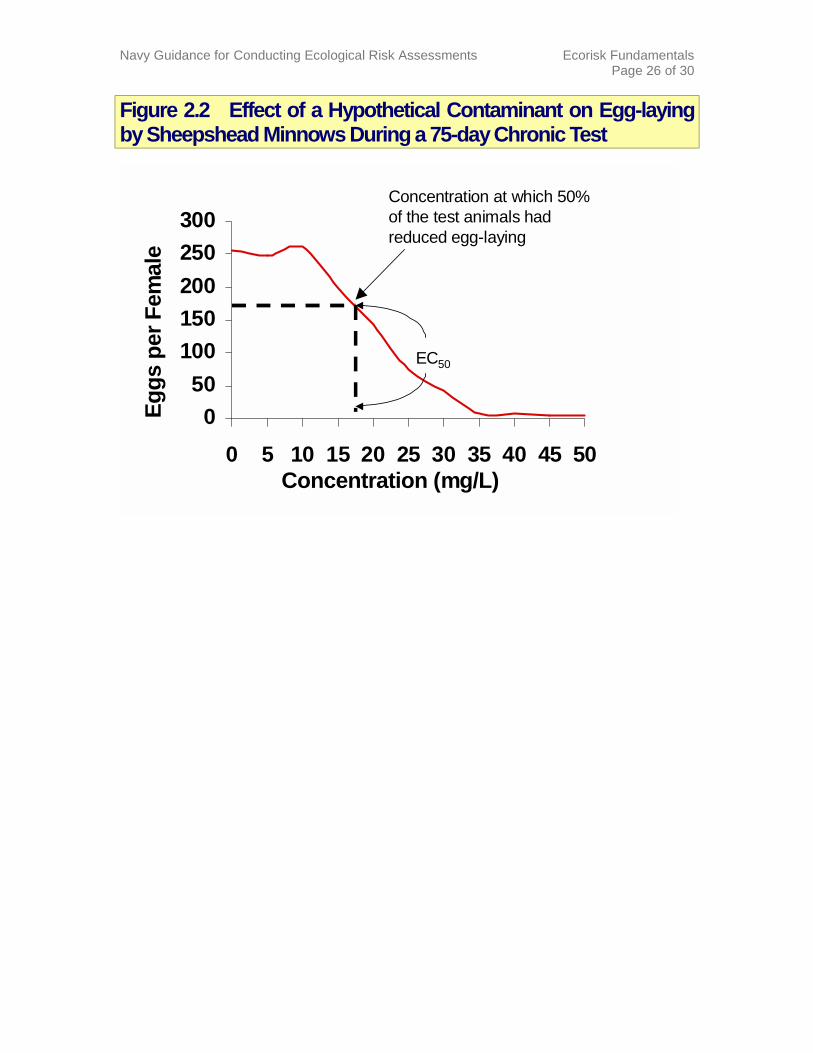
Depending upon whether a particular toxicity test is designed to evaluate the effects ofmedia concentration or the dose received by an organism, two statistics are commonlyused to describe the degree of lethality: the median lethal concentration (LC50) or medianlethal dose (LD50). These statistics refer to the concentration or dose that kills 50 percentof the exposed test organisms. Similarly, sublethal effects can be statistically describedas the median effect concentration (EC50) or median effect dose (ED50). These metricsidentify the concentration or dose at which 50% of an exposed population is affected.When comparing the toxicity of contaminants using these statistics, lower values indicategreater toxicity. Figure 2.1 and Figure 2.2 show hypothetical dose responses forsheepshead minnows exposed to contaminants at different concentrations under differentexposure durations.
Researchers conducting toxicity tests may also identify chemical concentration (NOAEC)or dose (NOAEL) levels below which there are no adverse effects on the test organisms.The lowest level at which an adverse effect is observed is referred to as the lowestobserved adverse effect concentration (LOAEC) or level (LOAEL for doses). Together,a NOAEL and a LOAEL (or NOAEC and LOAEC) describe a range for which effects areunknown. The assumption is that effects begin to occur somewhere within this range.Figure 2.3 depicts a hypothetical NOAEC and LOAEC observed during toxicity testingof sheepshead minnows exposed to different concentrations of a contaminant. Dependingon how large the range between the NOAEC and LOAEC is, it may be desireable toconduct additional toxicity tests for an ERA. For example, the uncertainty range for acontaminant with a NOAEC of 10 ppm and a LOAEC of 200 ppm may be unacceptableto the risk assessment team and thus require additional exposure tests to more narrowlyidentify where effects begin to occur.
Navy Guidance for Conducting Ecological Risk Assessments Ecorisk FundamentalsPage 17 of 30
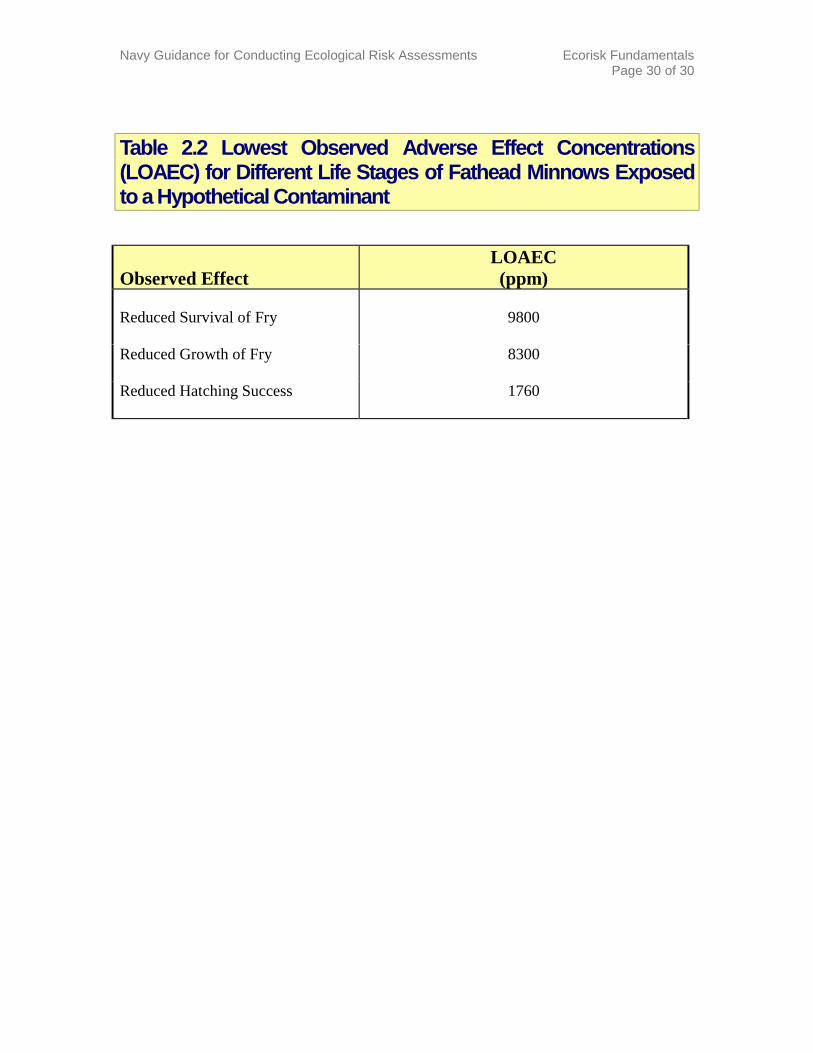
Susceptibility to chemical contaminants may differ among various life stages of anorganism. Table 2.2 shows the variation in LOAECs for different life stages of fatheadminnows exposed to a hypothetical contaminant.
3.0 References
Odum, E. P., 1971. Fundamentals of Ecology, W. B. Saunders Company, Philadelphia,PA, 574 p.
Suter, G.W., 1993. Ecological Risk Assessment, Lewis Publishers, Boca Raton, 538 p.
Wagner, R. H., 1971. Environment and Man, W. W. Norton and Company, Inc., NewYork, 491p.
Navy Guidance for Conducting Ecological Risk Assessments Ecorisk FundamentalsPage 18 of 30
Figure 1.1 Energy and Nutrient Transfer Through an Ecosystem
Producers Consumers
DecomposersInorganicNutrient
Pool
Sun
Heat Heat
Heat
EnergyNutrient
Navy Guidance for Conducting Ecological Risk Assessments Ecorisk FundamentalsPage 19 of 30
Figure 1.2 Diagrammatic Representation of a Food Chain, Showing Trophic Levels
Vegetation
(PrimaryProducer)
Grasshopper
(PrimaryConsumer)
Mouse
(SecondaryConsumer)
Snake
(TertiaryConsumer)
Hawk
(QuaternaryConsumer)
Navy Guidance for Conducting Ecological Risk Assessments Ecorisk FundamentalsPage 20 of 30
Figure 1.3 Example of an Aquatic Food Web
PrimaryProducers
TertiaryConsumers
SecondaryConsumers
PrimaryConsumers
Phytoplankton(Green Algae)
GrazingZooplankton
Snails
Filter-FeedingHerbivorous
Fish
PredatoryZooplankton
Plankton-FeedingFish
SubmergedAquatic
VegetationAttached
Algae
ScrapingHerbivorou
sFi h
HerbivorousMacroinvertebrates
Fish-EatingFish Invertebrate-
Feeding Fish PredatoryMacronvertebrate
Water Snake
GreatBlue
Raccoo
Osprey
Top-LevelPredators
TrophicLevel
Note that organisms above the primary consumer trophic level often occupy a number of trophic levels. For example,turtles act as primary consumers when they feed on vegetation, secondary consumers when they feed on herbivorousinvertebrates and fish, and tertiary consumers when they feed on predatory fish.
Navy Guidance for Conducting Ecological Risk Assessments Ecorisk FundamentalsPage 21 of 30
Figure 1.4 Pyramid of Biomass, Showing Less Biomass inSuccessively Higher Trophic Levels
PrimaryProducers
PrimaryConsumers
SecondaryConsumers
TertiaryConsumers
Navy Guidance for Conducting Ecological Risk Assessments Ecorisk FundamentalsPage 22 of 30
Figure 1.5 The Hydrologic Cycle
20
Navy Guidance for Conducting Ecological Risk Assessments Ecorisk FundamentalsPage 23 of 30
Figure 1.6 The Carbon Cycle
21
Navy Guidance for Conducting Ecological Risk Assessments Ecorisk FundamentalsPage 24 of 30
Figure 1.7 The Nitrogen Cycle
Navy Guidance for Conducting Ecological Risk Assessments Ecorisk FundamentalsPage 25 of 30
Figure 2.1 Toxicity of a Hypothetical Contaminant to theSheepshead Minnow in a 48-hour Acute Test
0
20
40
60
80
100
0 50 100 150 200 250
LC50
% M
orta
lity
Concentration (mg/L)
Navy Guidance for Conducting Ecological Risk Assessments Ecorisk FundamentalsPage 26 of 30
Figure 2.2 Effect of a Hypothetical Contaminant on Egg-layingby Sheepshead Minnows During a 75-day Chronic Test
0
50
100
150
200
250
300
0 5 10 15 20 25 30 35 40 45 50
EC50
Concentration at which 50% of the test animals had reduced egg-laying
Egg
s pe
r Fe
mal
e
Concentration (mg/L)
Navy Guidance for Conducting Ecological Risk Assessments Ecorisk FundamentalsPage 27 of 30
Figure 2.3 Egg-Laying by the Sheepshead Minnow WhenExposed to a Hypothetical Contaminant During a 75-DayExposure, Showing the No Observed Adverse EffectConcentration (NOAEC) and the Lowest Observed AdverseEffect Concentration (LOAEC)
050
100150200250300
0 5 10 15 20 25 30 35 40 45 50
LOAEC
NOAEC
Egg
s pe
r Fe
mal
e
Concentration (mg/L)
Navy Guidance for Conducting Ecological Risk Assessments Ecorisk FundamentalsPage 28 of 30
Table 1.1 Consumer types, trophic levels and food sources.
Consumer Type Trophic Level Food SourceHerbivores Primary Consumer Plants
Carnivores Secondary or Higher Consumer Animals
Omnivores All Levels Plants & Animals
Detritivores Secondary or Higher Consumer Detritus (Plant or AnimalMaterial)
Navy Guidance for Conducting Ecological Risk Assessments Ecorisk FundamentalsPage 29 of 30
Table 2. 1 Bioconcentration factors in Daphnia for 4 chemicals.
Substance Bioconcentration Factor
Benzo(a)pyrene 12,762
Bis (2-ethylhexyl) phthalate 5,200
Manganese chloride 911
Navy Guidance for Conducting Ecological Risk Assessments Ecorisk FundamentalsPage 30 of 30
Table 2.2 Lowest Observed Adverse Effect Concentrations(LOAEC) for Different Life Stages of Fathead Minnows Exposedto a Hypothetical Contaminant