15
agriculture, forestry & fisheries Department: Agriculture, Forestry and Fisheries REPUBLIC OF SOUTH AFRICA 2010/11 2010/11

agriculture,forestry & fisheriesDepartment: Agriculture, Forestry and FisheriesREPUBLIC OF SOUTH AFRICA
2010/112010/11

DEPARTMENT OF AGRICULTURE, FORESTRY AND FISHERIES
Economic Review
of the
South African
Agriculture
2010/11

2011
Compiled by
Directorate: Statistics and Economic Analysis Private Bag X246 PRETORIA 0001
Published in the Republic of South Africa by
Department of Agriculture, Forestry and Fisheries
Obtainable from
Resource Centre Directorate: Communication Services Private Bag X144 PRETORIA 0001
ISBN 978-1-86871-342-4
This publication or any part thereof may be reproduced without prior permission, provided that the Directorate Statistics and Economic Analysis, Department of Agriculture, Forestry and Fisheries, is acknowledged as the source.

iii
CONTENTS
Foreword ............................................................................................................................................... v
Economic review of South African agriculture for the year ended 30 June 2011 .................................. 1
Summary ............................................................................................................................................... 1
Volume of agricultural production .......................................................................................................... 1
Producer prices of agricultural products ................................................................................................ 2
Gross value of agricultural production ................................................................................................... 2
Farming income ..................................................................................................................................... 3
Expenditure on intermediate goods and services.................................................................................. 4
Prices of farming requisites ................................................................................................................... 4
Domestic terms of trade in agriculture (2005 = 1) ................................................................................. 6
Contribution of agriculture to value added at basic prices ..................................................................... 6
Capital assets and investment in agriculture ......................................................................................... 6
Farming debt ......................................................................................................................................... 7
Cash fl ow of farmers.............................................................................................................................. 7
Consumption expenditure on food......................................................................................................... 8
Consumer prices ................................................................................................................................... 8
Imports and exports of agricultural products ......................................................................................... 9

v
FOREWORD
Despite its relatively small share of the total GDP, primary agriculture is an important sector in the South African economy. Agriculture remains a signifi cant provider of employment, especially in the rural areas, and a major earner of foreign exchange.
The value of agricultural production in South Africa was R138 904 million in 2010, while its contribution to the GDP was approximately R60 billion. The primary agricultural sector has grown by an average of approximately 11,8% per annum since 1970, while the total economy grew by 14,9% per annum over the same period, resulting in a drop in agriculture’s share of the GDP from 7,1% in 1970 to 2,5% in 2010.
Agriculture’s prominent, indirect role in the economy is a function of backward and forward linkages to other sectors. Purchases of goods such as fertilisers, chemicals and implements form backward linkages with the manufacturing sector, while forward linkages are established through the supply of raw materials to the manufacturing industry. About 70% of agricultural output is used as intermediate products in the sector. Agriculture is therefore a crucial sector and an important engine of growth for the rest of the economy.
This publication, which appears every six months, offers easy-to-fi nd information to give some idea of the macroeconomic position of agriculture. The focus areas are the calculation of agriculture’s contribution to the national economy and the determination of trends with regard to the most important agricultural eco-nomic indicators.
Whether you are involved directly or only have an interest in agriculture, you will fi nd this publication useful and informative. We welcome your observations on its content and format. If you have comments or ques-tions, please contact the Director: Statistics and Economic Analysis.
tel 012 319 8454
fax 012 319 8031
email [email protected].
Ms Ellen Matsei
Director: Statistics and Economic Analysis
PRETORIA
September 2011

1Department of Agriculture, Forestry and Fisheries
ECONOMIC REVIEW OF THE SOUTH AFRICAN AGRICULTURE FOR THE YEAR ENDED30 JUNE 2011
Summary
Gross farming income from all agricultural products for the year ended 30 June 2011 is estimated at R131 699 million, which is 0,4% lower than for the previous corresponding period.
Gross farming income from fi eld crops decreased by 12,0% and amounted to R27 610 million. The income from horticultural products rose by 0,7%, from R35 261 million to R35 490 million. Income from animal products amounted to R68 599 million, which showed an increase of 4,7%.
Prices received by farmers for agricultural products and prices paid by farmers for farming requisites in-creased on average by 4,3% and 13,2% respectively, resulting in the terms of trade weakening from 0,93 to 0,86 during the period under review.
The weighted average price of fi eld crops increased by 6,7%. This resulted from increases in the prices of winter grain, oilseeds, cotton, sugar cane, tobacco and summer grain, by 38,3%, 25,6%, 18,2%, 14,8%, 3,2% and 2,3% respectively, while prices of hay and dry beans declined by 18,6% and 14,1% respectively.
The prices of horticultural products increased on average by 3,1%, mainly because of an increase of 13,3% in the price of fruit. Prices of vegetables declined by 7,2%, while prices of viticultural products remained unchanged.
Prices of animal products increased by 3,6%. The average prices of pastoral products, slaughtered animal and poultry rose by 23,6%, 11,1% and 0,8% respectively, while those of dairy products dropped by 6,5%.
The prices paid for farming requisites, including machinery and implements, material for fi xed improve-ments as well as intermediate goods and services, increased by 13,3%, compared to 6,7% the previous year. Prices for fertilisers and fuel increased by 22,5% and 5,7% respectively.
Net farming income decreased by 18,3% to R33 161 million for the 12 months up to 30 June 2011.
Volume of agricultural production
The estimated volume of agricultural production in 2010/11 was more or less the same as in 2009/10.
The volume of fi eld-crop production refl ected a 4,5% decrease as a result of a decline in the production of summer grains. Maize production decreased by 2,0 million tons or 15,0% from the previous season, fol-lowed by wheat with 530 000 tons or 27,0%. Sugar cane, on the other hand, showed an increase of 3,3%.
Horticultural production increased slightly by 0,2%, mainly because of increases in the production of veg-etables and citrus fruit. The production of potatoes increased by 134 834 tons or 6,8% and that of onions by 71 214 tons or 14,6%. Citrus fruit, specifi cally grapefruit and lemons, increased by 31 744 tons or 5,9%.
Animal production also increased slightly by 1,8% as a result of increases of 3,6% (24 698 tons) in cattle and calves slaughtered and 3,3% (47 000 tons) in poultry slaughtered. However, sheep and goats slaugh-tered showed a decrease in production of 16,7% or 20 293 tons.
Volume index of agricultural production2006/07–2010/11 (July to June)
708090
100110120130140
2006/07 2007/08 2008/09 2009/10 2010/11Year
2005
= 1
00
Field crops Horticulture Aimal production

2 Economic Review of the South African Agriculture 2010/11
Producer prices of agricultural products
Producer prices of agricultural products decreased on average by 4,3% from 2009/10 to 2010/11.
The weighted average price of fi eld crops increased by 6,7%. The prices of winter grain, oilseeds, cotton, sugar cane, tobacco and summer grain increased by 38,3%, 25,6%, 18,2%, 14,8%, 3,2% and 2,3% respec-tively, while prices for hay and dry beans decreased by 18,6% and 14,1% respectively.
Producer prices of horticultural products rose by 3,1% from 2009/10. Prices of vegetables decreased by 7,2%, while prices of fruit increased by 13,3%. Prices for viticulture remained unchanged.
Prices of animal products increased by 3,6%. The average prices of pastoral products, slaughtered stock and poultry increased by 23,6%, 11,1% and 0,8% respectively, while the prices of dairy products decreased by 6,5%.
Producer price indices2006/07–2010/11 (July to June)
90110130150170190210230
2006/07 2007/08 2008/09 2009/10 2010/11Year
2005
= 1
00
Field crops Horticulture Animal products
Gross value of agricultural production2006/07–2010/11 (July to June)
010 00020 00030 00040 00050 00060 00070 00080 000
2006/07 2007/08 2008/09 2009/10 2010/11Year
R'm
illio
n
Field crops Horticulture Animal production
Gross value of agricultural production
The total gross value of agricultural production (total production during the production season valued at the average basic prices received by producers) for 2010/11 is estimated at R138 904 million, compared to R129 883 million the previous year—an increase of 6,9%. This increase can be attributed mainly to an increase in the value of fi eld crops.
The gross value of animal products, horticultural products and fi eld crops contributed 49,4%, 25,5% and 25,1%, respectively, to the total gross value of agricultural production. The poultry meat industry made the largest contribution with 18,0%, followed by cattle and calves slaughtered with 11,4% and maize with 10,9%.

3Department of Agriculture, Forestry and Fisheries
Gross farm sector income (GFI)2006/07–2010/11 (July to June)
010 00020 00030 00040 00050 00060 00070 00080 000
2006/07 2007/08 2008/09 2009/10 2010/11Year
R'm
illio
n
Field crops Horticulture Animal production
Farming income
The gross income of producers (the value of sales and production for other uses, plus the value of changes in inventories) for the year ended 30 June 2011 amounted to R131 699 million, compared with R132 199 million the previous year, a decrease of 0,4%. The decrease in income can be ascribed mainly to a combi-nation of small increases in prices that farmers received for their products, and lower than expected produc-tion and slow deliveries of maize in particular.
The gross income from fi eld crops decreased by 12,0% to R27 610 million for the year ended 30 June 2011. Income from maize at R11 360 million was R4 814 million or 29,8% less than in the previous 12 months. In-come from sugar cane at R4 578 million was R530 million or 10,4% lower than that of the previous 12 months. Income from groundnuts decreased by 51,9% to R361 million. However, income from sunfl ower seed and soya beans showed substantial increases of 91,9% to R3 102 million and 57,0% to R2 238 million respectively.
The gross income from horticultural products increased by only 0,7% to R35 490 million, from R35 261 million in 2009/10. Income from citrus and deciduous fruit increased by 8,9% and 2,1% and amounted to R6 529 million and R8 932 million respectively. Income from viticulture increased by 0,7% to R3 654 million. Income from subtropical fruit, however, declined by 6,8% to R1 953 million. Income from vegetable produc-tion also decreased, by 0,4% to R12 690 million.
The gross income from animal products was 4,7% higher than in 2009/10 and amounted to R68 599 million, compared to R65 550 million for the previous year. Producers earned R15 775 million from slaughtered cattle and calves, as against the previous R14 185 million—an increase of 11,2%. Income from slaughtered sheep increased by 5,5% to R3 707 million. Income from poultry meat production rose by 5,7% to R25 031 million. However, income from egg production, at R6 676 million, was 2,2% lower than in the previous year. Producers earned R9 103 million from milk production, which is 4,4% less than in the previous year. Income from ostrich products also decreased, by 25,2% to R363 million.
Gross income from major products2010/11 compared to 2009/10 (July to June)
0 3 000 6 000 9 000 12 000 15 000 18 000 21 000 24 000
Sugar cane (-10,4%)
Milk (-4,4%)
Vegetables (-0,4%)
Fruit (+3,4%)
Maize (-29,8%)
Red meat (+9,5%)
Poultry meat (+5,6%)
R'million2009/10 2010/11

4 Economic Review of the South African Agriculture 2010/11
Expenditure on intermediate goods and services
Intermediate expenditure refers to the value of goods and services that were purchased for consumption as inputs during the production process.
Expenditure on intermediate goods and services during 2010/11 is estimated at R79 416 million, which represents a rise of 10,4% from R71 955 million in 2009/10. Large increases occurred in expenditure on dips and sprays (20,5%), packing material (20,2%), farm services (18,5%) and seed and plants (18,0%).
Net farm sector income (NFI)2006/07–2010/11 (July to June)
0
10 000
20 000
30 000
40 000
50 000
2006/07 2007/08 2008/09 2009/10 2010/11Year
R'm
illio
n
15
20
25
30
35
40
Perc
enta
ge
NFI (left axis) NFI as % of GFI (right axis)
The net farm income (after the deduction of all production expenditure, excluding expenditure on fi xed assets and capital goods) amounted to R33 161 million for the 12 months that ended on 30 June 2011, which is 18,3% lower than in the previous 12 months. The decline in net farming income is the result of the decrease of 0,4% in gross farming income and an increase of 10,4% in expenditure on intermediate production inputs and services. Payments for salaries and wages, which represented 12,1% of the total farming costs, amounted to R12 443 million. Interest paid by farmers to banks and other fi nanciers during the 12 months up to 30 June 2011 is estimated at R5 001 million, or 4,9% of the total farming cost.
Expenditure on farm feeds remained the biggest expenditure item, accounting for 22,5% of total expendi-ture, followed by 14,4% for fuel, 12,9% for farm services and 10,6% for maintenance and repairs of ma-chinery and implements.
Prices of farming requisites
Prices of farming requisites rose by 13,3% in 2010/11, compared to an increase of 6,7% the previous year.
Expenditure on intermediate goods and services2006/07–2010/11 (July to June)
4 000
8 000
12 000
16 000
20 000
2006/07 2007/08 2008/09 2009/10 2010/11Year
R'm
illio
n
Farm feeds Fuel Farm services
5Department of Agriculture, Forestry and Fisheries
Price indices of farming requisites2006/07–2010/11 (July to June)
80100120140160180200220
2006/07 2007/08 2008/09 2009/10 2010/11Year
2005
= 1
00
Machinery and implements Fixed improvements
Intermediate goods and services
Price indices of machinery and implements2006/07–2010/11 (July to June)
90
110
130
150
170
190
2006/07 2007/08 2008/09 2009/10 2010/11Year
2005
= 1
00
Tractors Implements Trucks
Price indices of certain intermediate goods2006/07–2010/11 (June to July)
90120150180210240270300
2006/07 2007/08 2008/09 2009/10 2010/11Year
2005
= 1
00
Farm feeds Fertilisers Fuel
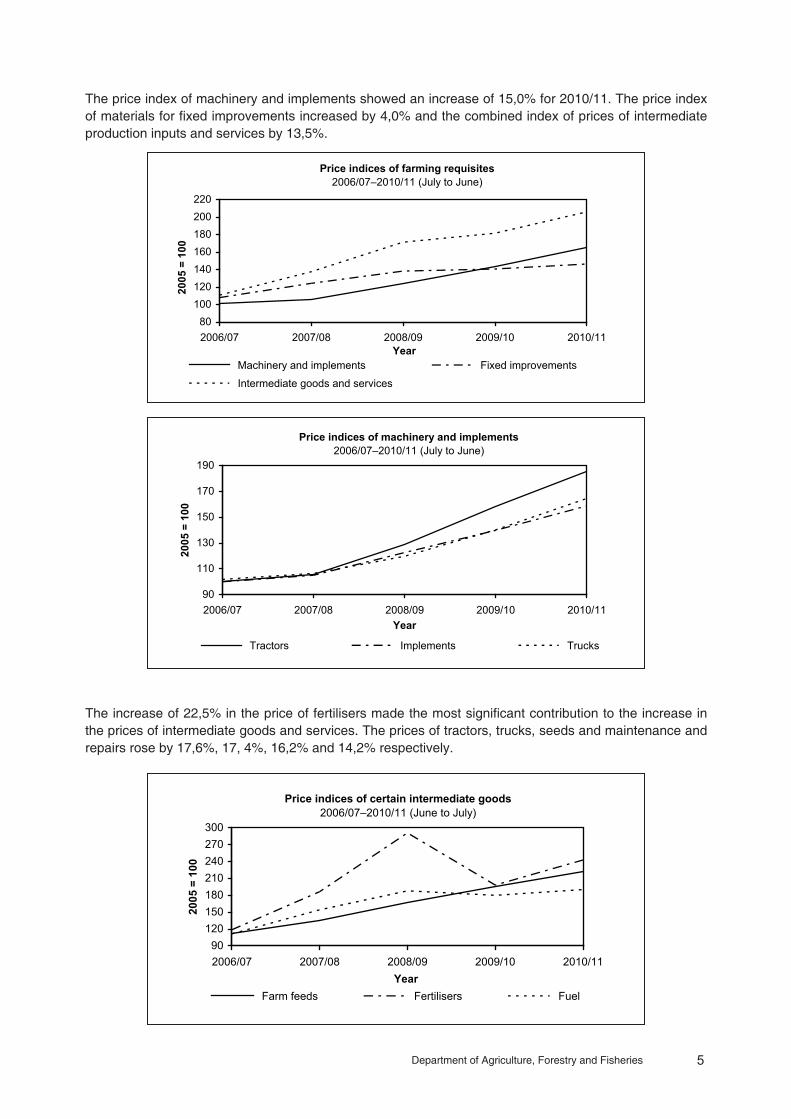
The price index of machinery and implements showed an increase of 15,0% for 2010/11. The price index of materials for fi xed improvements increased by 4,0% and the combined index of prices of intermediate production inputs and services by 13,5%.
The increase of 22,5% in the price of fertilisers made the most signifi cant contribution to the increase in the prices of intermediate goods and services. The prices of tractors, trucks, seeds and maintenance and repairs rose by 17,6%, 17, 4%, 16,2% and 14,2% respectively.

6 Economic Review of the South African Agriculture 2010/11
Domestic terms of trade in agriculture (2005 = 1)
The terms of trade indicate the extent to which producer prices received by farmers kept pace with the prices paid for farming requisites.
The terms of trade in agriculture weakened by 7,9%, from 0,93 in 2009/10 to 0,86 in 2010/11.
The terms of trade for fi eld crops decreased by 5,6%, from 1,08 in 2009/10 to 1,02 in 2010/11. In the case of the horticultural industry, the terms of trade decreased by 8,9%, from 0,90 to 0,82. The terms of trade for the animal production industry dropped by 9,1%, from 0,88 to 0,80.
Terms of trade in agriculture2006/07–2010/11 (July to June)
0,70
0,90
1,10
1,30
1,50
1,70
2006/07 2007/08 2008/09 2009/10 2010/'11Year
2005
= 1
Field crops Horticulture Animal production
Contribution of agriculture to value added at basic prices
Value added is the value of total output less the value of intermediate consumption during the pro-duction period.
The contribution of agriculture to value added for the year ended 31 December 2010 is estimated at R59 543 million. This represents 2,5% of the total value added to the economy.
Year
Total value added
R’million
Contribution of agriculture
to value added
R’million
Contribution of agriculture
as % of total value added
%
2005
2006
2007
2008
2009
2010*
1 401 067
1 572 319
1 792 056
2 044 267
2 176 597
2 405 383
30 213
37 475
45 152
53 500
53 040
59 543
2,2
2,4
2,5
2,6
2,4
2,5
*Note: Figures are for agriculture, forestry and fi sheries.
Capital assets and investment in agriculture
The value of capital assets in agriculture as at 30 June 2011 is estimated at R234 132 million, as against R220 908 million at the end of June 2010—an increase of 6,0%. Land and fi xed improvements constituted R138 088 million, machinery and implements R42 783 million and livestock R53 261 million of the total value of capital assets. The gross investment in respect of fi xed improvements for the year ended 30 June

7Department of Agriculture, Forestry and Fisheries
Investment in agriculture2006/07–2010/11 (July to June)
- 1 000
1 000
3 000
5 000
7 000
9 000
2006/07 2007/08 2008/09 2009/10 '2010/11Year
R'm
illio
n
Fixed improvements Machinery and implements Change in livestock inventory
Agricultural debt2006/07–2010/11 (July to June)
20 000
30 000
40 000
50 000
60 000
70 000
80 000
2006/07 2007/08 2008/09 2009/10 2010/11Year
R'm
illio
n
20
23
26
29
32
35Pe
rcen
tage
Debt (left axis) Debt as % of assets (right axis)
2011 increased by 0,9% to R4 009 million. In the case of machinery, implements and vehicles, investment increased by 5,5% and amounted to R6 858 million. The livestock inventory rose by R468,0 million from the previous year.
Farming debt
The total farming debt as at the end of June 2011 is estimated at R78 463 million (R65 392 million), an increase of 20,0%.
Cash fl ow of farmers
The cash fl ow of farmers amounted to R33 536 million for the year ended 30 June 2011, compared to the previous R41 921 million, a decrease of 20,0%. This was the result of a drop in the gross income of produc-ers.

8 Economic Review of the South African Agriculture 2010/11
Private consumption expenditure on major food items 2006/07–2010/11 (July to June)
0
25 000
50 000
75 000
100 000
125 000
2006/07 2007/08 2008/09 2009/10 2010/11Year
R'm
illio
n
Meat Bread and grains Vegetables and fruit Milk, milk products and eggs
Consumption expenditure on food
The consumption expenditure on food for the year ended 30 June 2011 increased by 2,7% and amounted to R353 105 million, as against the R343 892 million of the previous year. Expenditure on meat increased by 6,5% to R118 799 million, on sugar by 7,7% to R5 616 million, on fruit and vegetables (including pota-toes) by 7,0% to R51 811 million, on oils and fats by 9,6% to R7 942 million and on milk, milk products and eggs by 0,2% to R38 612 million. Expenditure on bread and grain products decreased by 4,0% to R88 658 million.
Meat represented 34% of the expenditure on the food component; bread and grains 25%; fruit and veg-etables (including potatoes) 15%; milk, milk products and eggs 11% and sugar and oils and fats 2% each.
Consumer prices
The consumer price index (with base year 2005 = 100) of all items increased by 3,8%, from 137,5 to 142,8, during the year ended 30 June 2011, as the CPI of food increased by 3,2%, from 151,4 to 156,2; and that of nonfood items increased by 2,0%, from 127,3 to 129,8. Meat prices rose by 4,8%, from an index fi gure of 147,9 to 155,1, while the prices of grain products decreased by 2,2%, from 163,4 to 167,0. The consumer price index of vegetables increased by 2,9%, from 154,9 to 159,4, and that of fruit increased by 3,3%, from 141,4 to 146,1. In the case of dairy products and eggs, prices dropped by 0,9 %, from an index of 158,2 to 156,8, while an increase of 5,9% was recorded for sugar and related products, from 143,5 to 151,9.
Cash flow of farmers 2006/07–2010/11 (July to June)
10 000
20 000
30 000
40 000
50 000
2006/07 2007/08 2008/09 2009/10 2010/11Year
R'm
illio
n
20
24
28
32
36
40
Perc
enta
ge
Cash flow (left axis) Cash flow as % of GFI (right axis)

9Department of Agriculture, Forestry and Fisheries
Imports and exports of agricultural products2006/07–2010/11 (July to June)
0
10 000
20 000
30 000
40 000
50 000
60 000
2006/07 2007/08 2008/09 2009/10 2010/11Year
R'm
illio
n
Imports Exports
Imports and exports of agricultural products
The estimated value of imports for 2010/11 came to R38 815 million, an increase of 14,3% compared to R33 946 million for 2009/10. The value of exports increased by 6,9%, from R44 469 million in 2009/10 to R47 561 million in 2010/11.
According to the 2010/11 export values, citrus fruit (R6 976 million), wine (R5 385 million), maize (R4 054 million), grapes (R3 530 million) and apples, pears and quinces (R3 223 million) were the most important agricultural export products. Wheat and meslin (R3 188 million), rice (R2 986 million), oil cake (R2 966 mil-lion), palm oil (R2 705 million) and undenatured ethyl alcohol (R2 449 million) accounted for the highest imports in terms of value.
During 2010/11, the Netherlands, the United Kingdom, Zimbabwe, Mozambique and Germany were the fi ve largest trading partners of South Africa in terms of export destinations for agricultural products, with export values of R5 295 million, R4 358 million, R3 465 million, R2 429 million and R1 816 million respec-tively. About 20,3% of the total value of agricultural exports for the period July 2010 to June 2011 went to the Netherlands and the United Kingdom.
The fi ve largest trading partners for South Africa’s imported agricultural products during 2010/11 were Ar-gentina, Thailand, the United States, Brazil and the United Kingdom, with import values of R5 760 million, R2 767 million, R2 652 million, R2 545 million and R2 343 million respectively.

NOTES
........................................................................................................................................................................
........................................................................................................................................................................
........................................................................................................................................................................
........................................................................................................................................................................
........................................................................................................................................................................
........................................................................................................................................................................
........................................................................................................................................................................
........................................................................................................................................................................
........................................................................................................................................................................
........................................................................................................................................................................
........................................................................................................................................................................
........................................................................................................................................................................
........................................................................................................................................................................
........................................................................................................................................................................
........................................................................................................................................................................
........................................................................................................................................................................
........................................................................................................................................................................
........................................................................................................................................................................
........................................................................................................................................................................
........................................................................................................................................................................
........................................................................................................................................................................
........................................................................................................................................................................
........................................................................................................................................................................
........................................................................................................................................................................
........................................................................................................................................................................


![Department of Economics - University of Bologna · Department of Economics ... and Schone Am Econ Rev 1997; Engers and Stern, Int Econ Rev 2002]; ... Need-based access .5725 .3127*](https://static.documents.pub/doc/80x56/5b68494a7f8b9a6f778c9022/department-of-economics-university-of-bologna-department-of-economics-.jpg)


