75
1 Economic Development Infrastructure, Change, and Alabama Economic Vitality Joe A. Sumners, Ph.D. Executive Director

1
Economic Development Infrastructure, Change, and Alabama Economic Vitality
Joe A. Sumners, Ph.D. Executive Director

Economic development is found at the intersection of the public and private sectors. Involves government efforts to facilitate increased
private sector growth and investment.
Depends on effective government investment and decision-making (education, infrastructure, incentives, and agency support).
2

3
Why should we care about economic development?
Higher levels of economic activity can lead to: additional tax revenues increased property values greater retail sales higher personal and household incomes increased business profits increased likelihood that young people can find
good jobs locally and remain in the community better schools, health care, amenities, etc.

Business & Industry Recruitment
4

5
Competitive Site SelectionScreening Process
Site Decision
Candidate Locations
Define Search Region
Cost Modeling / Incentives
Regional Screening based on Project Criteria
RFP & Proposal Screening
Risk Analysis
Site Visits / Comparative Assessment
Source: McCallum Sweeney Consulting.
The Site Selection Process

6
Business Site Selection(Elimination)
Clients/consultants seek to eliminate sites & buildings based on project requirements
Ultimately, projects locate based upon an optimum, risk adverse, business decision!
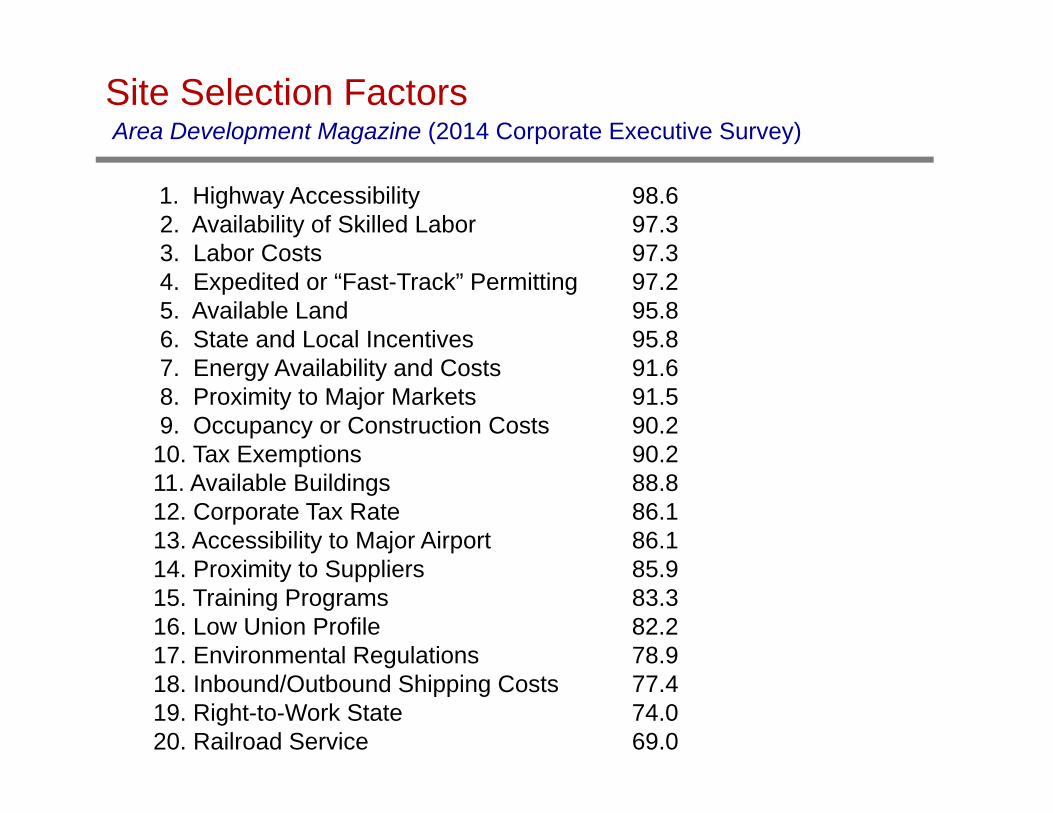
1. Highway Accessibility 98.62. Availability of Skilled Labor 97.33. Labor Costs 97.34. Expedited or “Fast-Track” Permitting 97.25. Available Land 95.86. State and Local Incentives 95.87. Energy Availability and Costs 91.68. Proximity to Major Markets 91.59. Occupancy or Construction Costs 90.210. Tax Exemptions 90.211. Available Buildings 88.812. Corporate Tax Rate 86.113. Accessibility to Major Airport 86.114. Proximity to Suppliers 85.915. Training Programs 83.316. Low Union Profile 82.217. Environmental Regulations 78.918. Inbound/Outbound Shipping Costs 77.419. Right-to-Work State 74.020. Railroad Service 69.0
Site Selection Factors Area Development Magazine (2014 Corporate Executive Survey)
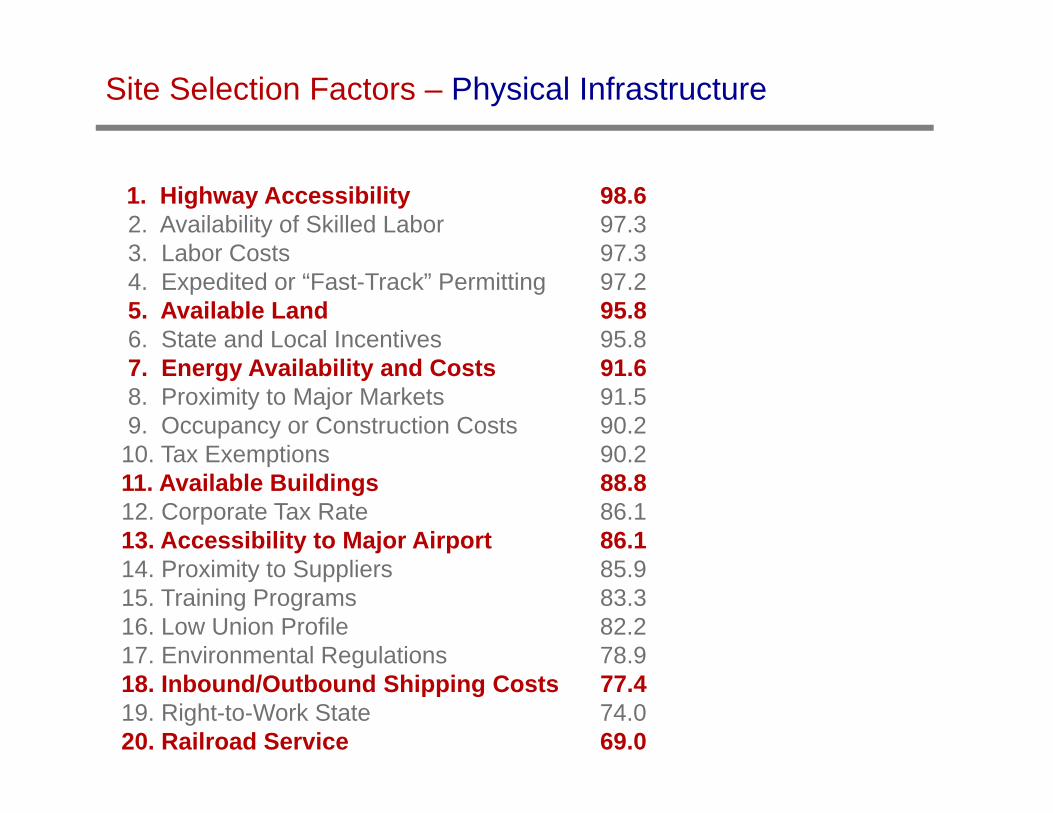
1. Highway Accessibility 98.62. Availability of Skilled Labor 97.33. Labor Costs 97.34. Expedited or “Fast-Track” Permitting 97.25. Available Land 95.86. State and Local Incentives 95.87. Energy Availability and Costs 91.68. Proximity to Major Markets 91.59. Occupancy or Construction Costs 90.210. Tax Exemptions 90.211. Available Buildings 88.812. Corporate Tax Rate 86.113. Accessibility to Major Airport 86.114. Proximity to Suppliers 85.915. Training Programs 83.316. Low Union Profile 82.217. Environmental Regulations 78.918. Inbound/Outbound Shipping Costs 77.419. Right-to-Work State 74.020. Railroad Service 69.0
Site Selection Factors – Physical Infrastructure
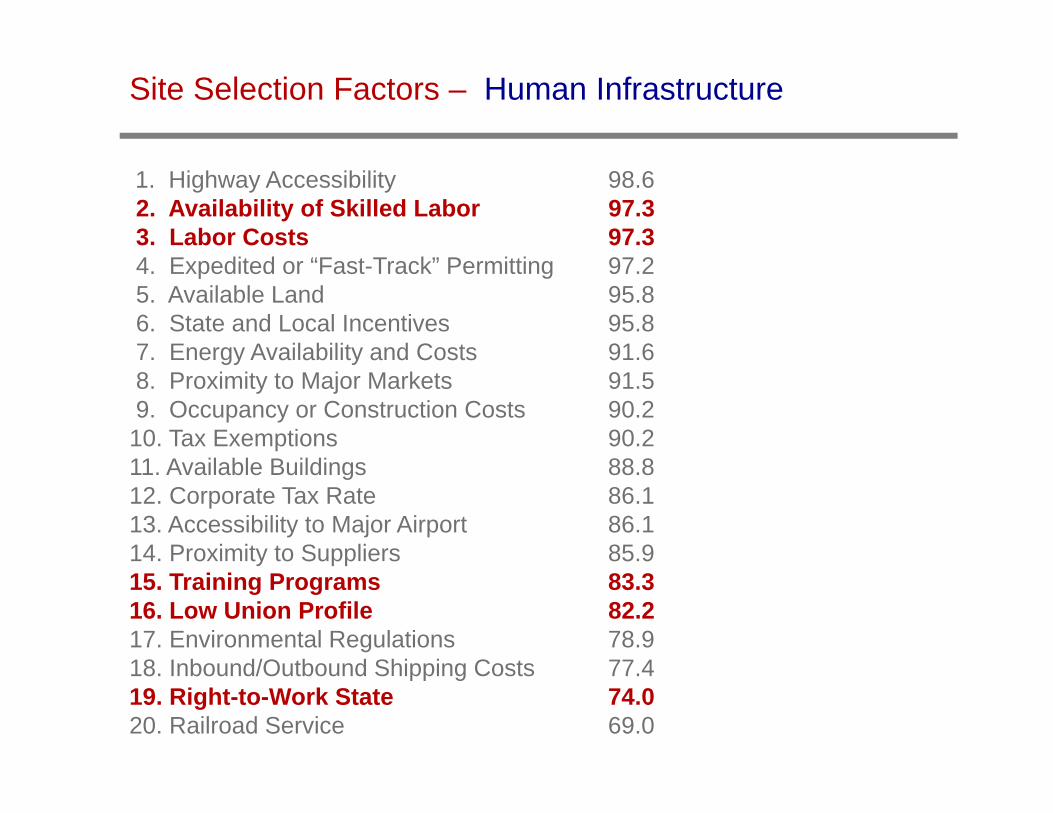
1. Highway Accessibility 98.62. Availability of Skilled Labor 97.33. Labor Costs 97.34. Expedited or “Fast-Track” Permitting 97.25. Available Land 95.86. State and Local Incentives 95.87. Energy Availability and Costs 91.68. Proximity to Major Markets 91.59. Occupancy or Construction Costs 90.210. Tax Exemptions 90.211. Available Buildings 88.812. Corporate Tax Rate 86.113. Accessibility to Major Airport 86.114. Proximity to Suppliers 85.915. Training Programs 83.316. Low Union Profile 82.217. Environmental Regulations 78.918. Inbound/Outbound Shipping Costs 77.419. Right-to-Work State 74.020. Railroad Service 69.0
Site Selection Factors – Human Infrastructure

1. Highway Accessibility 98.62. Availability of Skilled Labor 97.33. Labor Costs 97.34. Expedited or “Fast-Track” Permitting 97.25. Available Land 95.86. State and Local Incentives 95.87. Energy Availability and Costs 91.68. Proximity to Major Markets 91.59. Occupancy or Construction Costs 90.210. Tax Exemptions 90.211. Available Buildings 88.812. Corporate Tax Rate 86.113. Accessibility to Major Airport 86.114. Proximity to Suppliers 85.915. Training Programs 83.316. Low Union Profile 82.217. Environmental Regulations 78.918. Inbound/Outbound Shipping Costs 77.419. Right-to-Work State 74.020. Railroad Service 69.0
Site Selection Factors – Incentives and Finance

Core Economic Development Activities
Business recruitment and attraction Business retention & expansion Entrepreneurship & small business
development Commercial & retail development Tourism & retiree attraction Community development
11

Building a strong community infrastructure
12

Economic Development
Strategies
Industrial Recruitment
Existing Business
Entrepreneurship
Retail & Commercial
Tourism
Physical InfrastructureHuman InfrastructureCivic Infrastructure
13
Community Development

14
Alabama Rural RoundtableJune 16, 2006, Auburn University
“Priorities for Strengthening the Future of Rural Alabama”
1. Leadership & Citizen Participation (civic infrastructure)
2. Workforce Development & Education (human infrastructure)
3. Infrastructure & Communications Technology (physical infrastructure)

PhysicalInfrastructure
15

physical infrastructure
“Product” – developed (or developable) buildings and sites.
Roads, water, gas, electricity, sewers,and telecommunications are necessary for economic growth.
Broadband – has become a core infrastructure for the New Economy.
16

HumanInfrastructure
17

Workforce Development The number one issue in economic development
today is the quality of a community’s workforce. Companies will choose not to expand or locate in a
community if they do not feel they can find the workers they need.
Strengthening the workforce development system through the business community, public school systems, and community colleges must be a top priority for local economic development.
18
CivicInfrastructure
Citizen EngagementCollaborative Leadership
19

20
- Margaret Mead
“Never doubt that a small group of thoughtful, committed citizens can change the world. Indeed, it is the only thing that ever has.”

21
Public Space
Communities need an active civic life with public space for citizen engagement and multiple opportunities for citizen involvement: Town meetings Deliberative forums Roundtable discussions Concerts and festivals Community improvement projects
22
“What stands out in the high-achieving community is not so much the characteristics of the leaders as their number . . . The high-achieving community had ten times more people providing leadership than communities of comparable size. . . And its leaders function, not as gatekeepers, but as door-openers, bent on widening participation.”
- Dr. David Mathews, president of the Kettering Foundation
Connecting Stakeholders
Prosperous communities recognize the value of local and regional cooperation and collaboration.
County and city governments, chambers of commerce, schools, civic organizations, and private sector groups WORK TOGETHER!
Public-private partnerships and collaborations, communication, cooperation, and planning are essential. 23

Economic Development Leadership, structure, and planning
24

Structured and professional economic development program ensures that:
Decisions are based on current, relevant information
Action plans are developed and implemented
Information is shared with external and local audiences
Local sites are marketed and sold Actors in the local economic development
system are working together25
Diverse Strategies
There is no “one size fits all”approach to economic development.
The key is to match particular strategies with the assets of the community.
The economic development plan should address a wide variety of strategies, such as business retention and expansion, tourism, commercial and retail development, technology parks, agribusiness, retiree attraction, and entrepreneurial support.
26
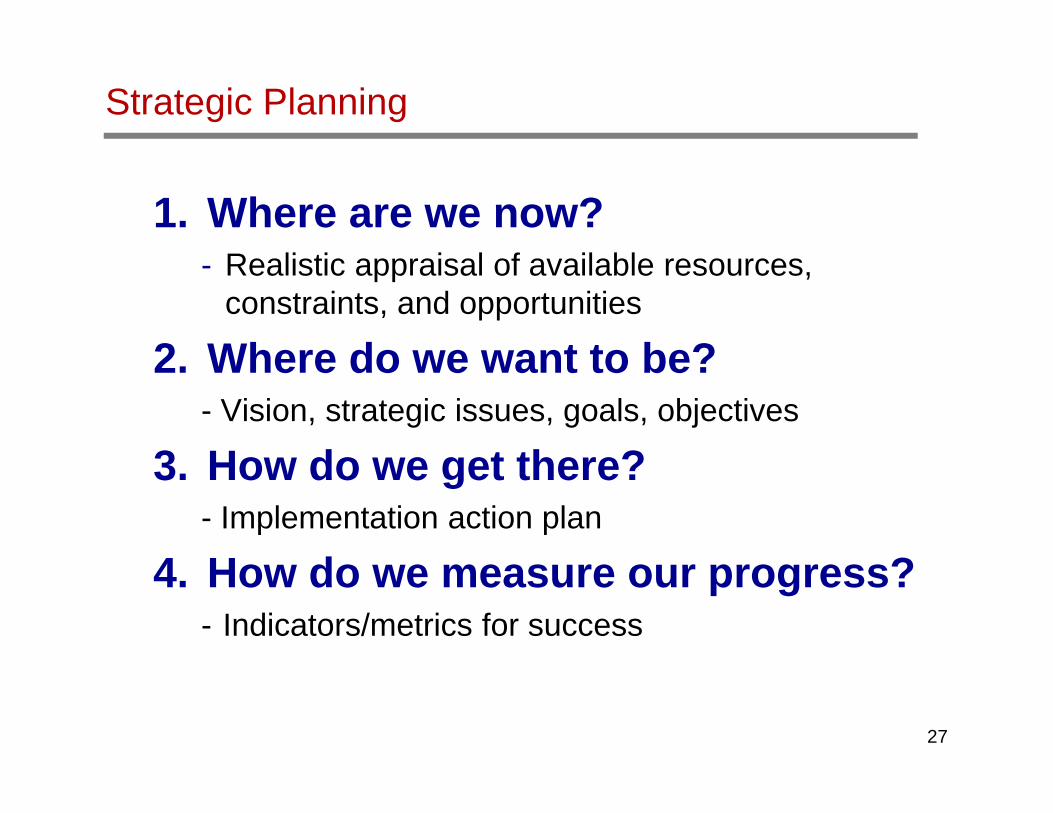
Strategic Planning
1. Where are we now?- Realistic appraisal of available resources,
constraints, and opportunities
2. Where do we want to be?- Vision, strategic issues, goals, objectives
3. How do we get there?- Implementation action plan
4. How do we measure our progress?- Indicators/metrics for success
27

28
Strategic Planning: Benefits
1. The Product A plan for the community’s economic future
(identify priorities and targets). Basis for strategic management.
2. The Process. Provides wealth of knowledge, expertise, and
perspective. More united and cohesive community
(commitment to common vision of the future).

GEDI Community Assessment Tool
29
GEDI - Assessing Current Condition
Unless otherwise indicated, check any statement that describes the current condition in yourcommunity.
1. PHYSICAL INFRASTRUCTURE
The community has an up-to-date comprehensive plan that includes policies and strategies for land use, transportation,and community facilities.
The community has specific plans for zoning, development regulation, and design/appearance review that are activelyenforced.
Local infrastructure (roads, utilities, etc.) is adequate to support selected business targets.
The community has adequate water and sewer capacity to meet residential and commercial needs.
The community's network of highways, roads, and streets is adequate.
The community has adequate transportation/shipping services, including rail, trucking, air, etc.
The community has access to high-speed Internet.
The community has at least one quality industrial site that is suitable for desired business targets, served byinfrastructure and free of easements and/or encumbrances.
Public property and buildings are well maintained.
Attractive gateways are present and maintained at city entrances.
The community supports downtown enhancements and preservation of historic buildings.
Traffic controls and street lighting are adequate.
The community is served by a local or regional airport.
The community has access to public transportation.
2. HUMAN INFRASTRUCTURE
School Outcomes
All schools in the community consistently achieve "academically clear" status.
Student standardized test scores (math, reading) are at or above the state average.
All schools/school systems are Southern Association of Colleges and Schools (SACS) accredited.
High school drop-out rates are low.
The labor force is sufficient to support significant economic growth.
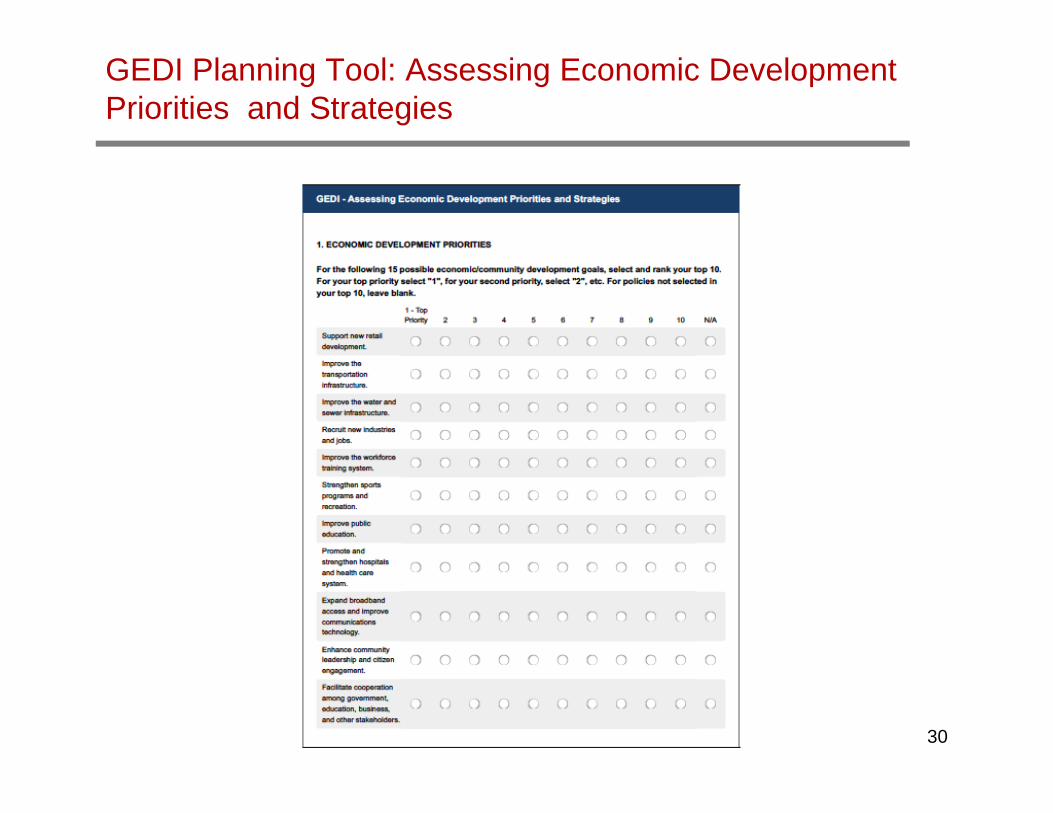
GEDI Planning Tool: Assessing Economic Development Priorities and Strategies
30

Economic Development: Essentials
Know:1. Why economic development matters
2. What economic development can and cannot do
3. ED is more than industrial recruitment
Develop:1. A strong community infrastructure
Physical
Human
Civic
2. Professional leadership, structure, and planning
31

Mega Trends that Impact our Economy and Workforce
32
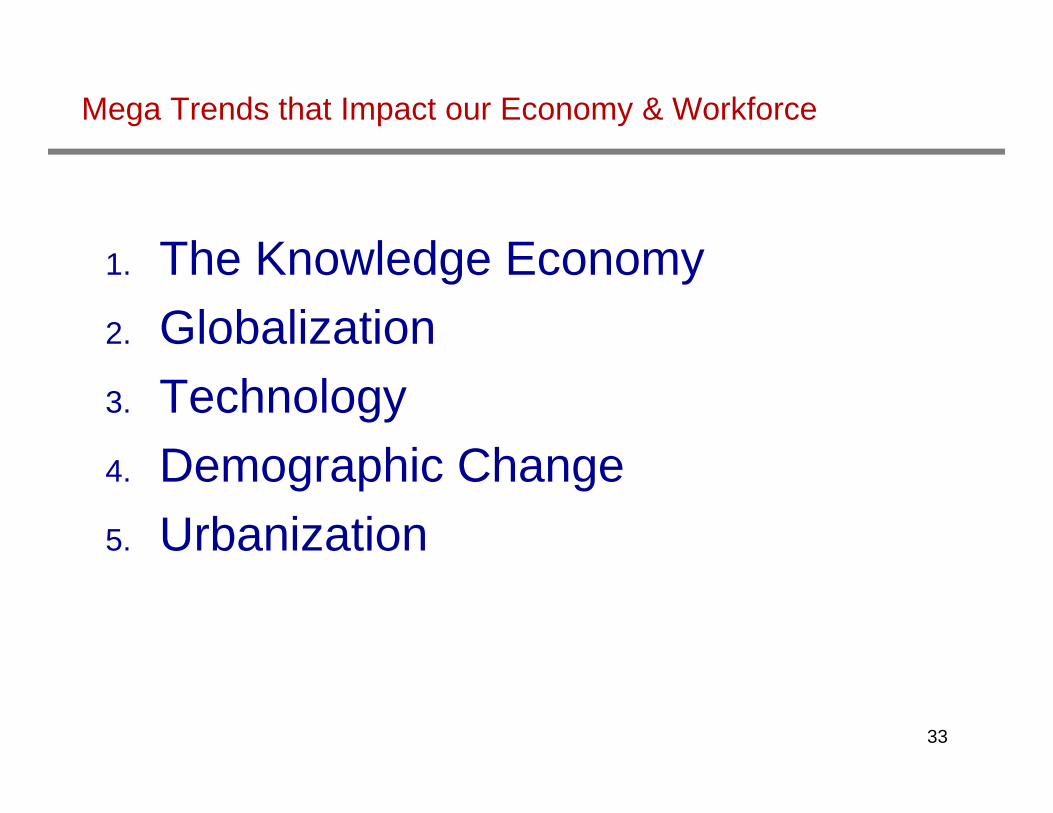
Mega Trends that Impact our Economy & Workforce
1. The Knowledge Economy2. Globalization3. Technology4. Demographic Change5. Urbanization
33

Knowledge Economy
34

35
Evolution of Economy
1st Wave: Agriculture Economy
2nd Wave: Manufacturing Economy
3rd Wave: Information-based Economy
1980
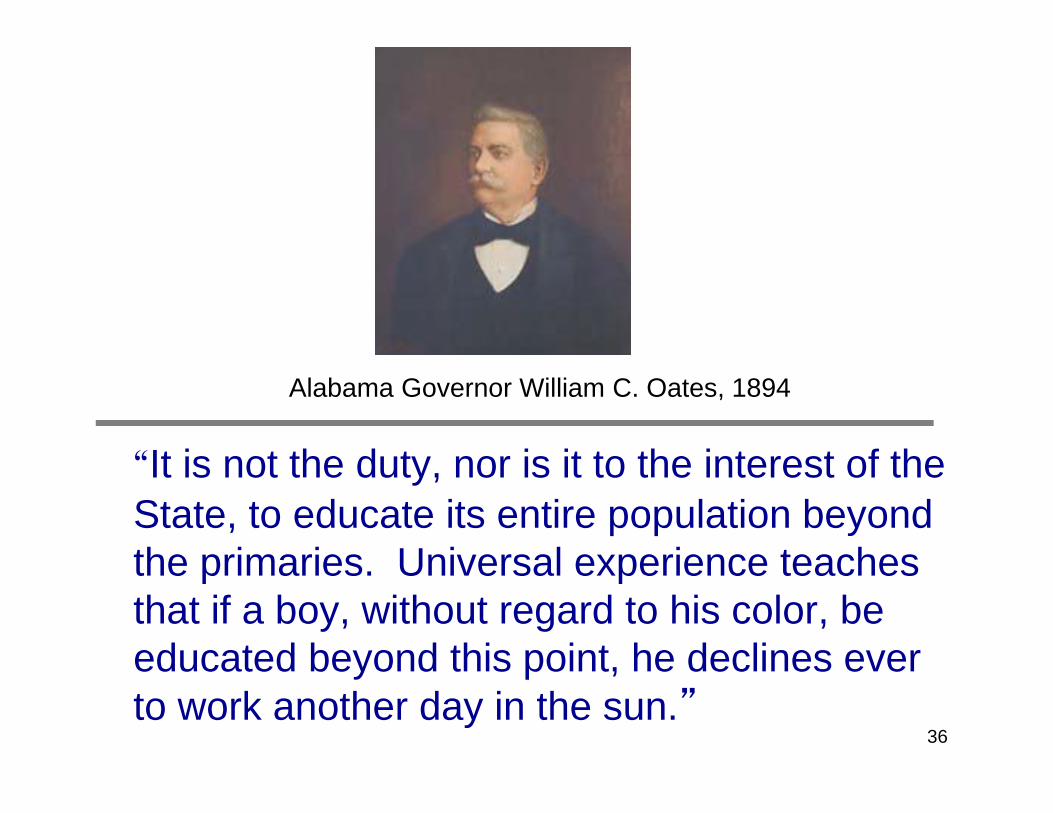
36
Alabama Governor William C. Oates, 1894
“It is not the duty, nor is it to the interest of the State, to educate its entire population beyond the primaries. Universal experience teaches that if a boy, without regard to his color, be educated beyond this point, he declines ever to work another day in the sun.”

Alabama per pupil expenditures on education as a percentage of the national average:
1890 28%1900 17%1910 33%1920 39%1930 43%1940 37%2008 81%2013 82%
37

38
THIRD WAVE: THE “NEW” ECONOMY
Throughout the 20th Century, Alabama’s economic development strategy was built on low taxes and unskilled, low-cost labor.
But by the late 20th Century, the U.S. began to export low wage, polluting industries; there was a new focus on advanced technology.
Companies looking for unorganized labor, low taxes, and a favorable business climate discovered the Dominican Republic, Mexico, Korea, the Philippines, China, and India.
Alabama was poorly positioned to compete when the question became not “what does labor cost,” but “what does labor know.”

39
Goodbye Old Economy Jobs
Projected fastest declining occupations by 2018: (Alabama Department of Industrial Relations)
Sewing machine operators Textile machine setters, operators & tenders File clerks Order clerks Computer operators Mail clerks & mail machine operators
40
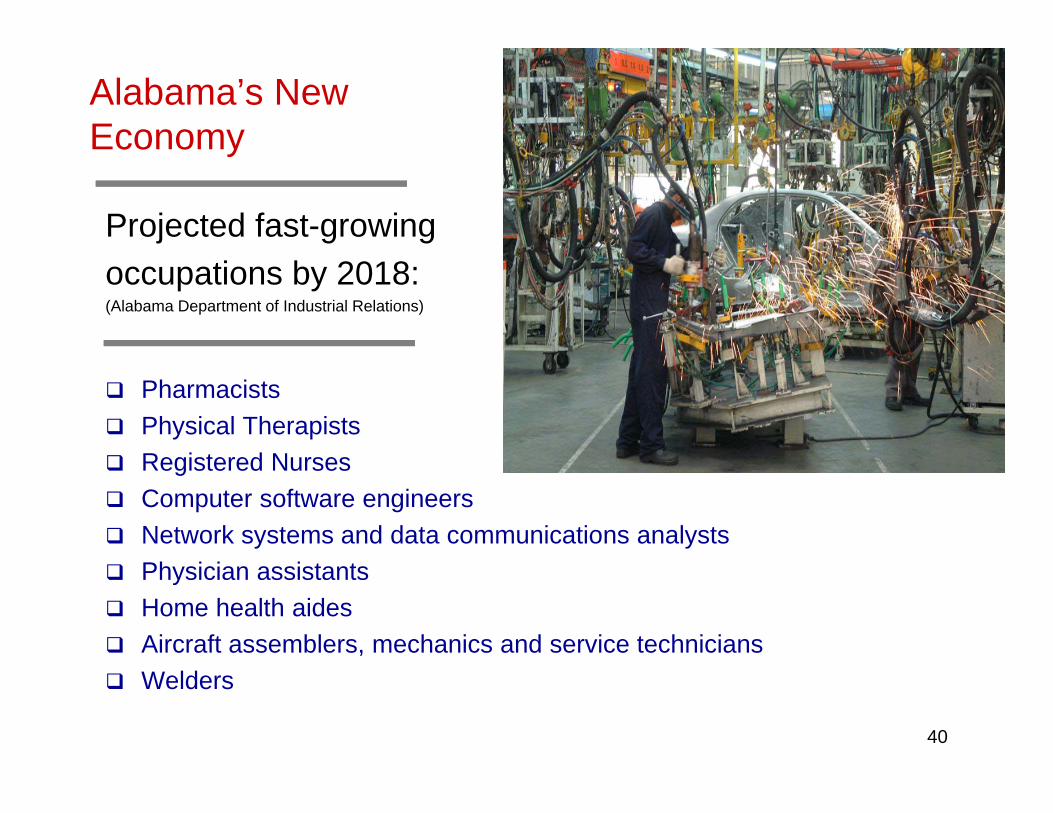
Alabama’s New Economy
Projected fast-growing occupations by 2018: (Alabama Department of Industrial Relations)
Pharmacists Physical Therapists Registered Nurses Computer software engineers Network systems and data communications analysts Physician assistants Home health aides Aircraft assemblers, mechanics and service technicians Welders

Growing Need for a Skilled Workforce
Professional Skilled Unskilled1950 20% 20% 60%1990 20% 45% 35%2000 20% 65% 15%
41
Source: U.S Bureau of Labor Statistics

Globalization
42

Thomas Friedman, The Lexus and the Olive Tree, 1999
Globalization is the “integration of markets, nation-states and technologies to a degree never witnessed before—in a way that is enabling individuals, corporations and nation-states to reach around the world farther, faster, deeper, and cheaper than ever before.”
43

Foxconn (the Chinese factory where most iPhones are made): Employs 230,000 workers Average wage for production workers is
$17 per day Employees work 6 days a week and 12
hours a day
Globalization

Technology
45

46
Globalization and Technology
“National recovery won’t bring jobs back to the rural South. Production has moved to other countries with lower wages, or plants have substituted technologically advanced machines for people. Tens of thousands of jobs are not coming back.”“The State of the South 2002: Shadows in the Sunbelt Revisited” (MDC, Inc.)
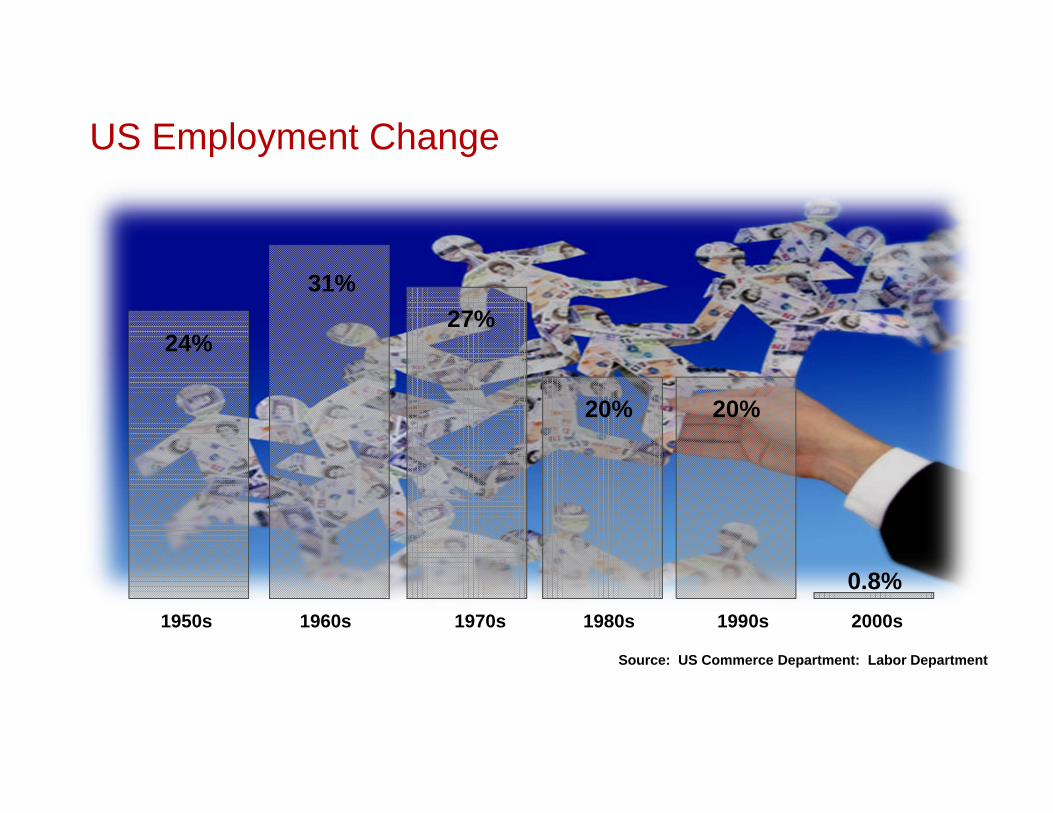
1950s 1960s 1970s 1980s 1990s 2000s
24%
31%27%
20% 20%
0.8%
Source: US Commerce Department: Labor Department
US Employment Change
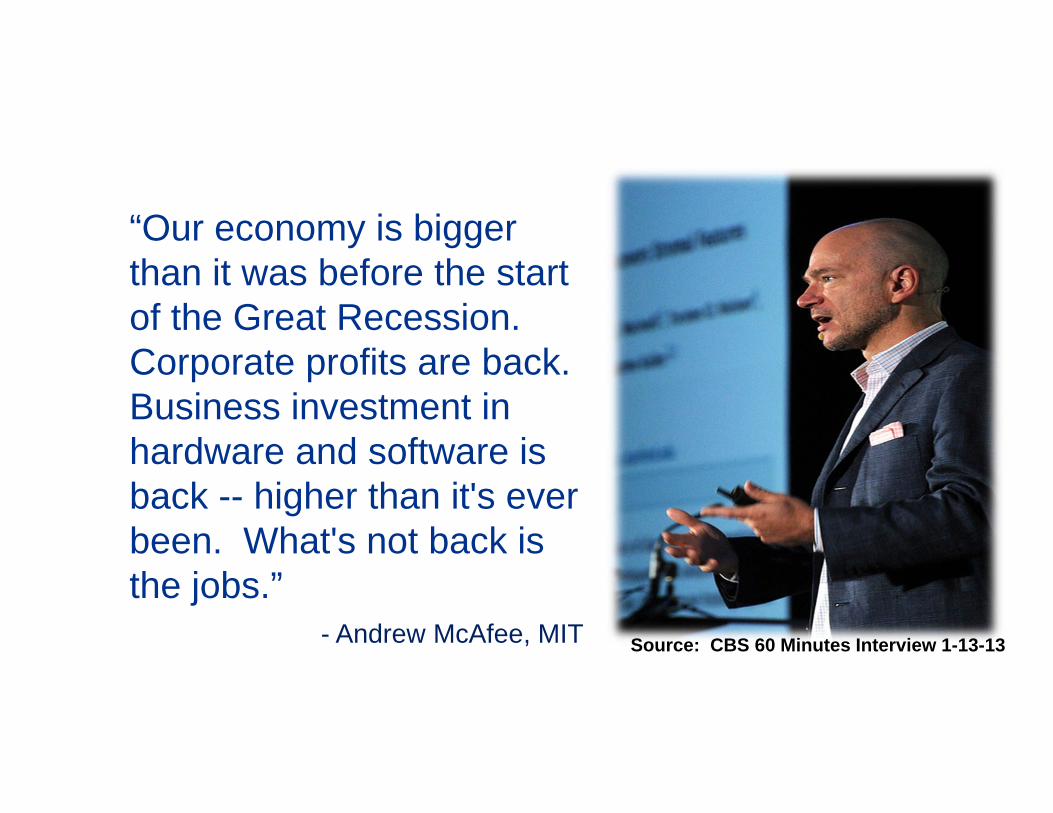
“Our economy is bigger than it was before the start of the Great Recession. Corporate profits are back. Business investment in hardware and software is back -- higher than it's ever been. What's not back is the jobs.”
- Andrew McAfee, MIT Source: CBS 60 Minutes Interview 1-13-13
Technology
The percentage of Americans with jobs is at a 20-year low. Just a few years ago if you traveled by air you would have interacted with a human ticket agent. Today, those jobs are being replaced by robotic kiosks. Bank tellers have given way to ATMs, sales clerks are surrendering to e-commerce and switchboard operators and secretaries to voice recognition technology.
Source: CBS 60 Minutes 1-13-13 49

Technology
The U.S. has led the world in its ability to apply new methods and techniques to solve fundamental problems.
With a population of 300 million, the U.S. has cleaner air and water now than 40 years ago (when the population was 200 million).
Between 1960 and 1999, manufacturing's share of American total employment roughly halved (to about 15%). Yet in those same 40 years manufacturing’s physical output nearly tripled.
Today manufacturing accounts for about 9% of total U.S. employment.
50

DemographicChange
51

The U.S. Population is Getting OLDER
The proportion of the population that is currently over 65 years old (13%) is expected to reach 20% by 2050.
As Baby Boomers move into retirement, the workforce faces huge losses, both in terms of numbers and talent.
Dependency ratio issue: dependents
workers52

The Coming Worker Shortage
“The problem – actually there are four of them – is simple. We Baby Boomers didn’t have enough kids, our birth rate isn’t high enough, we’re living longer, and our educational system is dropping half our kids in the academic dirt. As 78 million of us retire, there won’t be enough qualified workers behind us to fill the jobs and grow the economy that’s necessary to support all of us new dependents.”
53

Annual Rates of Labor Force Growth: 1950-2025
1950-60 1960-70 1970-80 1980-90 1990-00 2000-15 2015-25
1.1% 1.7% 2.6% 1.6% 1.2% 1.0% 0.2%
54
1970-80 Baby boomers reach
working age
More women and minorities join the workforce
2015-25 Baby boomers retire
They are replaced by amuch smaller generation
Critical labor shortages
Source: U.S. Bureau of Labor Statistics

The World’s Population is getting older
Over the next 40 years, the rest of the developed world will get really old. A third or more of their populations will be over 65.
By 2050, 31% of China’s population will be older than 60; more than 41% of Japanese will be that old.
The US fertility rate is 50% higher than that of Russia, Germany and Japan and well above all of Europe, China, Singapore, and South Korea.
55

U.S Workers versus the World
Between 2000 and 2050, the U.S. 15-64 age group is expected to grow 42%.
The number of young and working age people is expected to decline in other developed nations. China - 10% decline Europe - 25% decline South Korea - 30% decline Japan - 40% decline
56

The U.S. population is becoming more diverse
Over 1 million legal immigrants enter the U.S. each year.
In 2000, the U.S. was home to 12.5 million skilled immigrants – equal to the combined total for Germany, France, the United Kingdom, Australia, Canada, and Japan.
Between 1990 and 2005, immigrants started one out of four venture-backed public companies.
In 2007, 15 of the Fortune 100 CEOs had roots in foreign countries.
“In 2010, foreign students received more than 50% of all Ph.D.’s awarded in every subject in the U.S. In the sciences, that figure is closer to 75%.” (Fareed Zakaria, The Post-American World, Release 2.0, Norton, 2011).
57

Peter Drucker, The Next Society, 2001
“America’s experience of immigration should give it a lead on the developed world for several decades to come. . . But it is not the numbers alone that will give America an advantage. Even more important, the country is culturally attuned to immigration, and long ago learned to integrate immigrants into its society and economy.”
58
59

The Changing Face of America - 1960-2060 (Source;:The Next America, Paul Taylor)
85 83 80 7669 64 60 55 51 47 43
10 1112
1212
1213
1313
1313
4 5 69
1316 19
22 2528 31
1 1 2 4 5 5 6 6 7 8 8
0%
10%
20%
30%
40%
50%
60%
70%
80%
90%
100%
1960 1970 1980 1990 2000 2010 2020 2030 2040 2050 2060
AsianHispanicBlackWhite

Urbanization

Half of the US Population Lives in these 146 counties
SOURCE: BUSINESS INSIDER 2013 WALTER HICKEY AND JOE WEISENTHAL
63

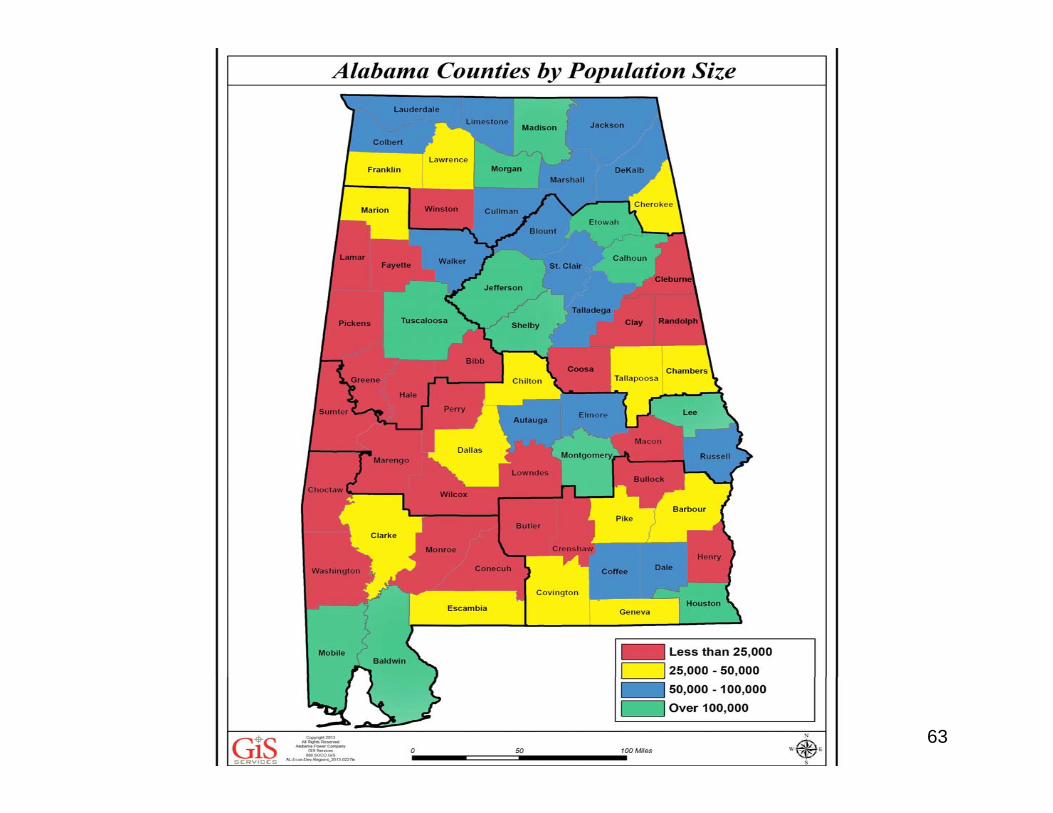
64
Economic Vitality Index (2014)Ranking Alabama Counties(population change, educational attainment, income, and employment)
1. Shelby (metro)2. Madison (metro)3. Baldwin (metro)4. Elmore (large)5. St. Clair (large)6. Autauga (large)7. Lee (metro)8. Limestone (large)9. Coffee (large)10. Tuscaloosa (metro)11. Houston (metro)12. Jefferson (metro)13. Morgan (metro)14. Dale (large)15. Lauderdale (large)
16. Blount (large)17. Colbert (large)18. Mobile (metro)19. Cullman (large) 20. Cherokee (medium)21. Chilton (medium)22. Montgomery (metro)23. Pike (medium)24. Russell (large)25. Marshall (large)26. Henry (small)27. Etowah (metro)28. Crenshaw (small)29. Lawrence (medium)30. Covington (medium)
31. Jackson (large)32. Calhoun (metro)33. Bibb (small)34. Franklin (medium)35. Talladega (large)36. Washington (small)37. Tallapoosa (medium)38. Cleburne (small)39. Walker (large)40. Geneva (medium)41. DeKalb (large)42. Marengo (small)43. Escambia (medium)44. Fayette (small)45. Randolph (small)46. Marion (medium)

65
Alabama County Economic Vitality Index 2014(population change, educational attainment, income, and employment)
47. Macon (small)48. Lamar (small)49. Butler (small)50. Coosa (small)51. Chambers (medium)52. Clarke (medium)53. Pickens (small)54. Winston (small)55. Choctaw (small)56. Barbour (medium)57. Sumter (small)
58. Clay (small)59. Bullock (small)60. Lowndes (small)61. Hale (small)62. Dallas (medium)63. Monroe (small)64. Greene (small)65. Conecuh (small)66. Perry (small)67. Wilcox (small)

County Economic Vitality: Population Change
2000-2013 2010-2013
Alabama 8.7% 1.1%
Metro 16.2% 2.2%
Large 12.2% 1.75
Medium -0.2% -0.8%
Small -7.5% -2.9%
66

Population Change
Between 2000 and 2013, 18 counties had greater growth than state average (8.7%)
Shelby - 42.5% Baldwin - 39.3% Limestone - 35.3% St. Clair - 33.3% Lee - 31.1%
1 (of 12) metro county lost population: Jefferson (-0.4)
20 (of 25) small counties lost population Lowndes (-20.6%) Macon (-18.3%) Choctaw (-15.7%) Perry (-15.5%)
Between 2010 and 2013, 41 counties lost population (23 of 25 small counties) 67
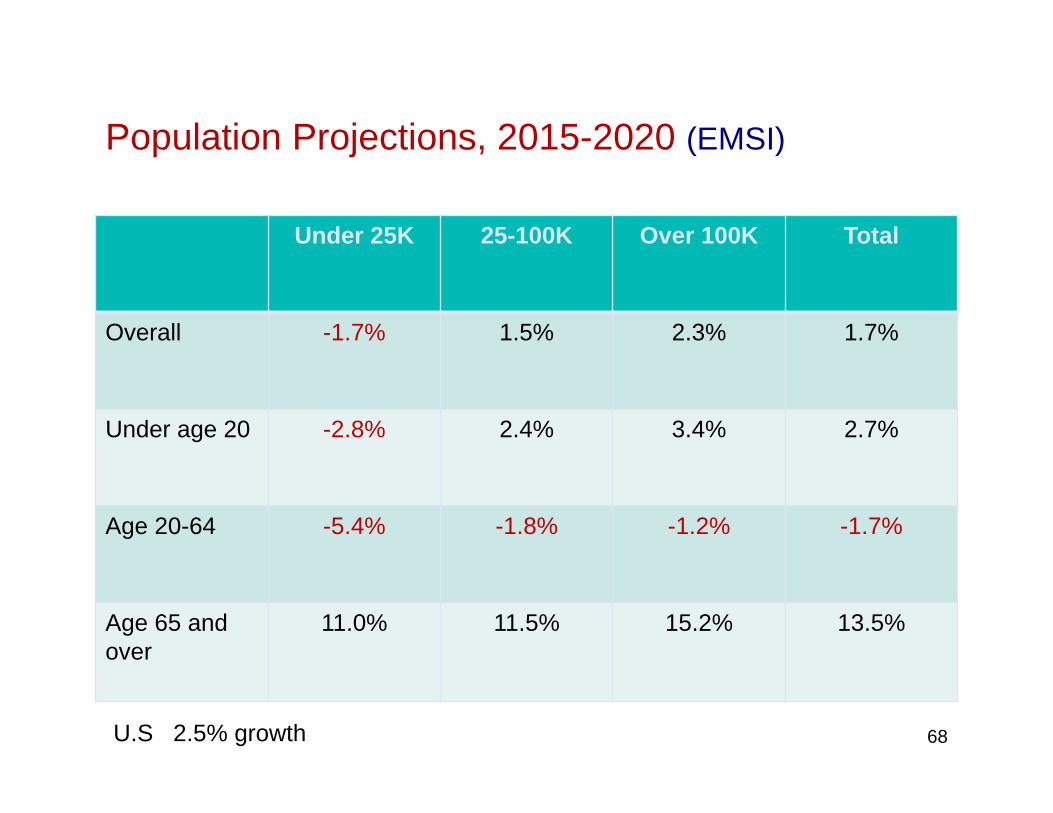
Population Projections, 2015-2020 (EMSI)
Under 25K 25-100K Over 100K Total
Overall -1.7% 1.5% 2.3% 1.7%
Under age 20 -2.8% 2.4% 3.4% 2.7%
Age 20-64 -5.4% -1.8% -1.2% -1.7%
Age 65 and over
11.0% 11.5% 15.2% 13.5%
68U.S 2.5% growth

69

1. Need fewer people to be productive (more capital-intensive, less labor-intensive)
2. Fewer low-skilled jobs (outsourced)
3. Talent bar is much higher Need for higher skilled, educated workers Critical need for improved K-12 education and workforce training system
4. Intense competition for talent (local, state, global)
5. Huge challenge for rural communities70
Mega Trends (Knowledge Economy, Globalization, Technology, DemographicChange, Urbanization): Implications

71
Implications for communities
Information, ideas, and technology are the driving forces in today’s economy.
Strategies: Leadership Strategic planning Effective government policy &
management Excellent K-12 school Access to community college
and workforce training Modern technology and
telecommunications infrastructure
Superior quality of life; amenities

72
Government Managers have an important role in economic development (broadly defined)
Successful economic development depends upon strong public sector decision-making, engagement, investment and management, along with effective community development.
“Product development” is much more important for economic development than “marketing and sales” (industrial recruitment).
Professional public managers make important contributions to quality of place; you help produce a good “product” to sell.
73
“Every morning in Africa, a gazelle wakes up. It knows it must run faster than the fastest lion or it will be killed. Every morning a lion wakes up. It knows it must outrun the slowest gazelle or it will starve to death. It doesn’t matter whether you are a lion or a gazelle. When the sun comes up, you better start running.”
- African proverb(Friedman, The World is Flat, 2005)

Theodore Roosevelt
“Do what you can, with what you have,
where you are.”
74

Joe A. Sumners, Ph.D.Executive Director
214 Extension HallAuburn University, AL 36849


