Page 1
Economic feasibility analysis of a solar energy and solid oxide fuelcell-based cogeneration system in Malaysia
R. K. Akikur1,4 • R. Saidur2 • K. R. Ullah1 • S. A. Hajimolana3 •
H. W. Ping1 • M. A. Hussain3
Received: 11 July 2015 / Accepted: 5 October 2015
� Springer-Verlag Berlin Heidelberg 2015
Abstract The current study presents a concept of a
cogeneration system integrated with solar energy and solid
oxide fuel cell technology to supply electrical and thermal
energy in Malaysia. To appraise the performance, the
system is analysed with two case studies considering three
modes of operation. For the case-1, typical per day average
electricity and hot water demand for a single family have
been considered to be 10.3 kWh and 235 l, respectively.
For the case 2, electricity and hot water demand are con-
sidered for the 100 family members. Energy cost, payback
period, future economic feasibility and the environmental
impact of the system are analysed for both cases using an
analytical approach. The overall system along with indi-
vidual component efficiency has been evaluated, and the
maximum efficiency of the overall system is found to be
48.64 % at the fuel cell operation mode. In the present
study, the proposed system shows 42.4 % cost effective-
ness at higher load. Energy costs for case-1 and case-2 have
been found to be approximately $0.158 and $0.091 kWh-1,
respectively, at present. Energy costs are expected to be
$0.112 and $0.045 kWh-1 for the case-1 and case-2,
respectively, considering future (i.e. for the year 2020)
component cost.
Keywords Cogeneration � Solid oxide fuel cell � Solarenergy � Economic analysis � Efficiency � Malaysia
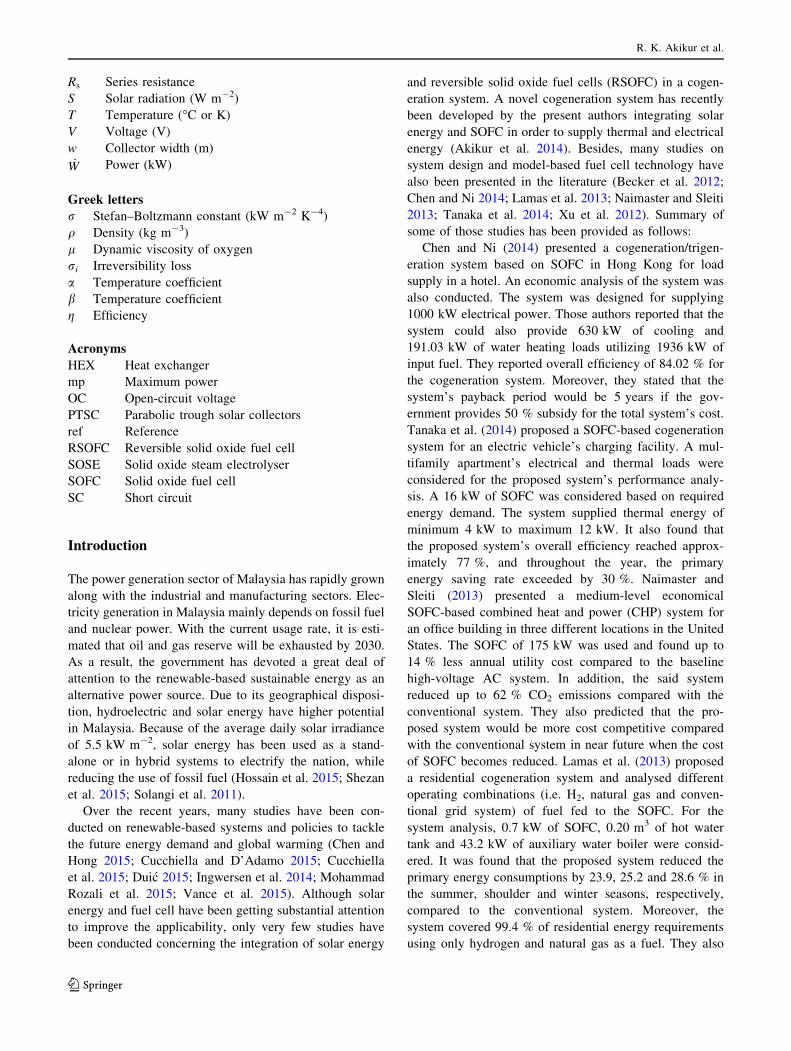
List of symbols
a Anode
Ac Area of the receiver cover (m2)
Ar Area of the receiver (m2)
Bg Flow permeability
c Cathode
Cp Specific heat (kJ kg-1 K-1)
da Anode thickness (lm)
dc Cathode thickness (lm)
D Diameter (m)
Deff Effective diffusion coefficient
E0 Standard potential
F Faraday’s constant (C mol)
h Specific enthalpy (kJ kg-1)
hc,ca Convection heat coefficient (kW m-2 K-1)
hr,ca Radiation heat coefficient (kW m-2 K-1
I Current (A)
J Current density (A m-2)
Jo,i Exchange current density (A m-2)
L Electrolyte thickness (lm)
Lc Collector’s length (m)
Nus Nusselt number_N Flow rate (kg s-1)
P Pressure (bar)
P0 Partial pressure (bar)
Q Heat rate (kW)
R Universal gas constant (J mol-1 K-1)
& R. Saidur
[email protected] ; [email protected]
1 UM Power Energy Dedicated Advanced Centre
(UMPEDAC), Level 4, Wisma R&D UM, University of
Malaya, 59990 Kuala Lumpur, Malaysia
2 Centre of Research Excellence in Renewable Energy (CoRE-
RE), King Fahd University of Petroleum and Minerals
(KFUPM), Dhahran 31261, Saudi Arabia
3 Department of Chemical Engineering, Faculty of
Engineering, University of Malaya, 50603 Kuala Lumpur,
Malaysia
4 Solar Energy Technologies, School of Computing,
Engineering and Mathematics, Western Sydney University,
Penrith South, NSW 2751, Australia
123
Clean Techn Environ Policy
DOI 10.1007/s10098-015-1050-6
Page 2
Rs Series resistance
S Solar radiation (W m-2)
T Temperature (�C or K)
V Voltage (V)
w Collector width (m)_W Power (kW)
Greek letters
r Stefan–Boltzmann constant (kW m-2 K-4)
q Density (kg m-3)
l Dynamic viscosity of oxygen
ri Irreversibility loss
a Temperature coefficient
b Temperature coefficient
g Efficiency
Acronyms
HEX Heat exchanger
mp Maximum power
OC Open-circuit voltage
PTSC Parabolic trough solar collectors
ref Reference
RSOFC Reversible solid oxide fuel cell
SOSE Solid oxide steam electrolyser
SOFC Solid oxide fuel cell
SC Short circuit
Introduction
The power generation sector of Malaysia has rapidly grown
along with the industrial and manufacturing sectors. Elec-
tricity generation in Malaysia mainly depends on fossil fuel
and nuclear power. With the current usage rate, it is esti-
mated that oil and gas reserve will be exhausted by 2030.
As a result, the government has devoted a great deal of
attention to the renewable-based sustainable energy as an
alternative power source. Due to its geographical disposi-
tion, hydroelectric and solar energy have higher potential
in Malaysia. Because of the average daily solar irradiance
of 5.5 kW m-2, solar energy has been used as a stand-
alone or in hybrid systems to electrify the nation, while
reducing the use of fossil fuel (Hossain et al. 2015; Shezan
et al. 2015; Solangi et al. 2011).
Over the recent years, many studies have been con-
ducted on renewable-based systems and policies to tackle
the future energy demand and global warming (Chen and
Hong 2015; Cucchiella and D’Adamo 2015; Cucchiella
et al. 2015; Duic 2015; Ingwersen et al. 2014; Mohammad
Rozali et al. 2015; Vance et al. 2015). Although solar
energy and fuel cell have been getting substantial attention
to improve the applicability, only very few studies have
been conducted concerning the integration of solar energy
and reversible solid oxide fuel cells (RSOFC) in a cogen-
eration system. A novel cogeneration system has recently
been developed by the present authors integrating solar
energy and SOFC in order to supply thermal and electrical
energy (Akikur et al. 2014). Besides, many studies on
system design and model-based fuel cell technology have
also been presented in the literature (Becker et al. 2012;
Chen and Ni 2014; Lamas et al. 2013; Naimaster and Sleiti
2013; Tanaka et al. 2014; Xu et al. 2012). Summary of
some of those studies has been provided as follows:
Chen and Ni (2014) presented a cogeneration/trigen-
eration system based on SOFC in Hong Kong for load
supply in a hotel. An economic analysis of the system was
also conducted. The system was designed for supplying
1000 kW electrical power. Those authors reported that the
system could also provide 630 kW of cooling and
191.03 kW of water heating loads utilizing 1936 kW of
input fuel. They reported overall efficiency of 84.02 % for
the cogeneration system. Moreover, they stated that the
system’s payback period would be 5 years if the gov-
ernment provides 50 % subsidy for the total system’s cost.
Tanaka et al. (2014) proposed a SOFC-based cogeneration
system for an electric vehicle’s charging facility. A mul-
tifamily apartment’s electrical and thermal loads were
considered for the proposed system’s performance analy-
sis. A 16 kW of SOFC was considered based on required
energy demand. The system supplied thermal energy of
minimum 4 kW to maximum 12 kW. It also found that
the proposed system’s overall efficiency reached approx-
imately 77 %, and throughout the year, the primary
energy saving rate exceeded by 30 %. Naimaster and
Sleiti (2013) presented a medium-level economical
SOFC-based combined heat and power (CHP) system for
an office building in three different locations in the United
States. The SOFC of 175 kW was used and found up to
14 % less annual utility cost compared to the baseline
high-voltage AC system. In addition, the said system
reduced up to 62 % CO2 emissions compared with the
conventional system. They also predicted that the pro-
posed system would be more cost competitive compared
with the conventional system in near future when the cost
of SOFC becomes reduced. Lamas et al. (2013) proposed
a residential cogeneration system and analysed different
operating combinations (i.e. H2, natural gas and conven-
tional grid system) of fuel fed to the SOFC. For the
system analysis, 0.7 kW of SOFC, 0.20 m3 of hot water
tank and 43.2 kW of auxiliary water boiler were consid-
ered. It was found that the proposed system reduced the
primary energy consumptions by 23.9, 25.2 and 28.6 % in
the summer, shoulder and winter seasons, respectively,
compared to the conventional system. Moreover, the
system covered 99.4 % of residential energy requirements
using only hydrogen and natural gas as a fuel. They also
R. K. Akikur et al.
123
Page 3
revealed that if the hydrogen could be produced from
renewable sources, about 42.3 % of primary energy
reduction would be possible compared to the natural gas-
fuelled SOFC system. Becker et al. (2012) carried out a
study on 1 MW of SOFC in a polygeneration system for
combined production of heat, power and hydrogen. The
SOFC was used for the cogeneration system, and then
hydrogen was separated for further application using a gas
stream. The overall efficiency of the system was 85.2 %,
where the electrical efficiency of the SOFC was 48.8 %.
Xu et al. (2012) developed a conceptual design and a
mathematical of a natural gas-fuelled cogeneration sys-
tem. The SOFC was designed for generating 1 kW of
energy, and it was found that the system can supply
1.005 kW of electrical power and 0.521 kW of thermal
energy with the electrical and combined efficiencies of
52.1 and 79.2 %, respectively.
Moreover, the United States and the members of the
European Union have started applying fuel cell-based
system successfully for residential applications. In Asia,
over the last decade, Japan has installed many residential
fuel cell systems (Mahlia and Chan 2011). However, new
renewable-based system analysis in a specific geographical
condition is needed while considering solar energy and
SOFC system to make it practically more feasible.
A cogeneration system was presented by the present
authors in previous study (Akikur et al. 2014), where it was
focused on the system modelling and development. Costs
of renewable energy system and SOFC vary geographically
due to climatic conditions and local electricity tariff.
Consequently, it is essential to carry out a study in terms of
economic as well as environmental impact analysis of the
system under a particular weather condition. In addition, an
uncertainty analysis of the system to increase the stability
of the system was carried out. However, the hybrid SOFC
and solar PV-based cogeneration system has not been
implemented in Malaysia and many other parts of the
world to produce the thermal and electrical energy. Hence,
the focuses of this article are to present the performance
analysis of a cogeneration system considering the solar
radiation data and typical household energy demands in
Malaysia. An economic as well as environmental feasi-
bility study to illustrate the auspiciousness of solar energy
and SOFC coupling in a cogeneration system was also
carried out.
Methodology
Conceptual design considerations and survey data
The average solar radiation data for Kuala Lumpur in 2009
are presented in Table 1. The maximum average radiation
was found in April, May and June, and the lowest was in
November and December.
The residential electrical energy consumption depends
on the number of family members or house dimensions.
The average expenditure per month for a small family or a
small house is considered approximately $19.88 (1
USD = 3.27 MYR), for a medium house $33.64 and for a
bungalow $107 (Mahlia and Chan 2011). The case study of
the proposed cogeneration system has been carried out
considering a typical house with six occupants and 100
similar family members in Malaysia. On average, about
4387 kWh of electrical energy is needed per year for a
family, and the family has to pay $367 per year according
to the electricity tariff of the Malaysian government
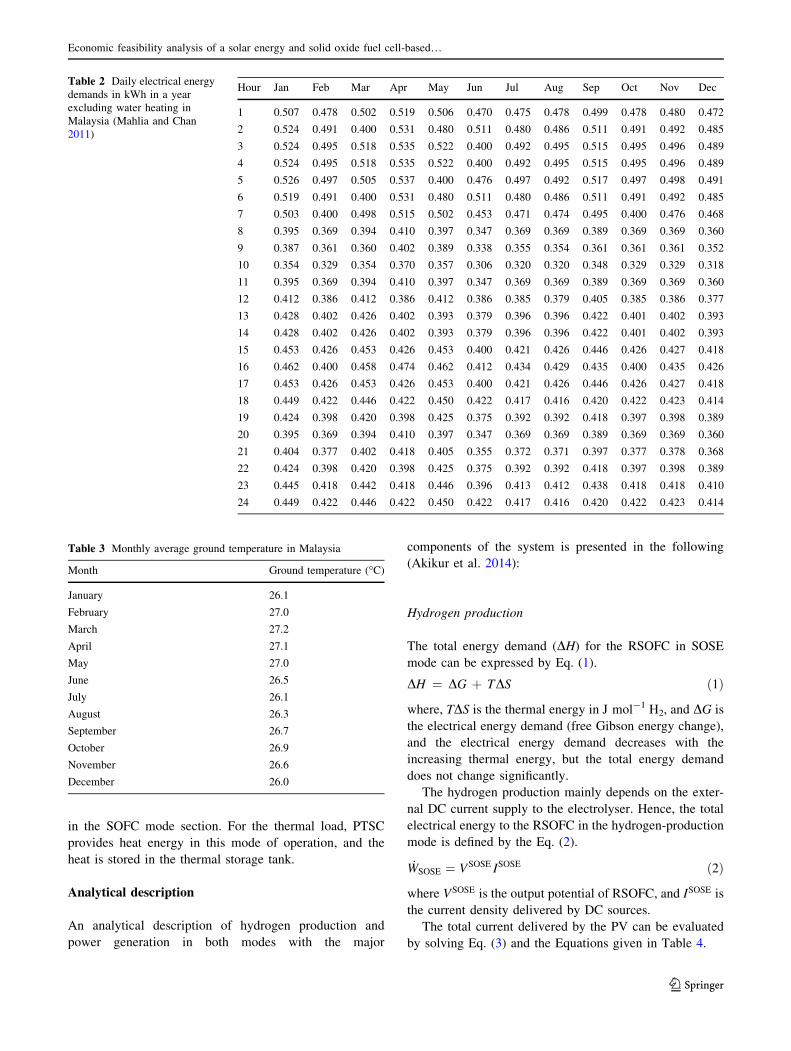
(Mahlia and Chan 2011). The hourly average electrical
energy demand is illustrated in Table 2, where the survey
data were taken from the literature (Mahlia and Chan
2011). On the other hand, the average hot water demand for
the same size family is considered 20,520 l month-1
(20.52 m3). The hot water temperature depends on the
weather, air, water receiver and ground temperature. The
ground temperature and the average hourly hot water
consumed for a typical household in Malaysia are pre-
sented in Table 3 and Fig. 1, respectively.
Cogeneration system model
The main energy sources of the proposed cogeneration
system comprised a parabolic trough solar collector
(PTSC), solar photovoltaic (PV) and reversible SOFC
(RSOFC) as shown in Fig. 2. The energy input of the solar
energy-based cogeneration system varies with the time and
weather. As a consequence, for a continuous operation of a
solar-based system, another auxiliary system is required. In
this study, the hydrogen is produced and stored using solar
energy for steam electrolysis during the day time to ensure
a continuous power supply at night. The operating modes
of the system considering H2 storage, RSOFC and hybrid
solar energy are described next.
System description
The system can be operated in three modes. (1) The solar–
solid oxide fuel cell (SOFC) mode or solar–SOFC mode,
which is for lower solar radiation time when the solar PV
and SOFC are used for electrical and thermal load supply;
(2) The solar–solid oxide steam electrolyser (SOSE) mode
or solar–SOSE mode, which is for higher solar radiation
time when PV is used for power supply to the electrical
load and to the steam electrolyser to generate hydrogen
(H2); and (3) The SOFC mode, which is for the power and
heat generation mode of RSOFC using the storage H2 at
night. Figure 3 shows the operational diagram of the
Economic feasibility analysis of a solar energy and solid oxide fuel cell-based…
123
Page 4
cogeneration system, which is validated by the Ref. (Aki-
kur et al. 2014) and the system is described below
according to the operation mode.
Solar–SOSE mode
Water is supplied from the storage tank to the PTSC, where
the water absorbs heat energy provided by the PTSC and
then steam is heated by the heat exchanger-1 (HEX-1)
before being fed into the RSOFC. If the steam is heated to
700 �C or above, then it enters the cathode of the RSOFC,
or it passes through the preheater-1. In this mode, the
RSOFC works for steam electrolysis. The solar PV pro-
vides the required electricity to electrolyse the steam and
produce hydrogen and oxygen. The solar PV also provides
the electricity for electrical load in this mode. The pro-
duced H2 with unreacted steam and O2 pass through the
HEX-1 and release heat for the steam. Finally, heat ener-
gies (60–100 �C) are extracted from the H2 and H2O for the
heat load when it passes through HEX-3, which then finally
enter the hydrogen and water tanks, respectively.
SOFC mode
A SOFC system provides electricity for the load using the
storage hydrogen as a fuel during night and until sunrise.
Hydrogen from the tank is preheated by the preheater-2
initially, which then flows towards the anode of the SOFC.
Heat energy is provided by the SOFC to heat up the input
H2 at operating temperature. Air is provided to the cathode
through the preheater to raise the temperature. The pro-
duced electricity reaches the load, and steam passes
through the HEX-2 and releases the heat which is absorbed
by the input H2.
Solar–SOFC mode
This mode is operated after the sunrise, from early hours of
the day through a few hours before the sunset. The solar
energy collected by the PV modules is used for the load
supply, and the collectors are used for thermal energy
storage. An additional power for the load is delivered by
the SOFC. The operation of the SOFC has been described
Table 1 Hourly average solar radiation data in W m-2 of Malaysia for the year in 2009
Hour Jan Feb Mar Apr May Jun Jul Aug Sep Oct Nov Dec
1 0.0 0.0 0.0 0.0 0.0 0.0 0.0 0.0 0.0 0.0 0.0 0.0
2 0.0 0.0 0.0 0.0 0.0 0.0 0.0 0.0 0.0 0.0 0.0 0.0
3 0.0 0.0 0.0 0.0 0.0 0.0 0.0 0.0 0.0 0.0 0.0 0.0
4 0.0 0.0 0.0 0.0 0.0 0.0 0.0 0.0 0.0 0.0 0.0 0.0
5 0.0 0.0 0.0 0.0 0.0 0.0 0.0 0.0 0.0 0.0 0.0 0.0
6 0.0 0.0 0.0 0.0 0.0 0.0 0.0 0.0 0.0 0.1 0.0 0.0
7 10.5 11.5 22.8 37.0 32.4 31.7 17.9 26.6 34.0 42.9 42.2 27.0
8 124.3 121.4 166.0 213.1 178.8 159.9 113.4 166.1 178.5 170.8 199.4 157.2
9 315.1 292.3 348.0 431.4 379.2 334.8 277.2 339.3 335.6 343.8 361.2 353.5
10 516.2 452.8 528.7 597.2 546.5 469.3 432.0 467.7 496.6 546.0 517.4 513.9
11 654.7 652.4 614.0 681.8 657.7 593.5 562.6 583.3 573.0 664.1 564.4 609.7
12 745.8 740.8 655.1 716.6 702.7 698.3 634.1 637.7 666.0 713.1 550.5 637.4
13 695.3 677.1 647.6 646.4 685.5 711.4 653.6 662.9 676.8 704.4 518.1 605.8
14 633.8 571.1 613.1 572.0 665.1 673.7 670.6 627.2 644.0 647.5 431.9 456.8
15 452.6 510.4 439.7 472.1 585.0 537.0 555.1 590.7 536.9 522.8 365.5 389.6
16 346.4 381.9 322.2 370.6 436.3 422.7 439.7 416.1 385.1 337.9 213.1 285.1
17 245.0 239.8 231.7 236.9 266.5 250.7 254.9 243.6 219.3 184.9 102.6 153.6
18 81.6 80.8 91.6 77.9 84.1 74.7 89.4 82.2 60.3 47.4 24.9 39.9
19 2.8 3.2 3.5 1.9 1.3 2.0 4.0 3.4 0.3 0.0 0.0 0.0
20 0.0 0.0 0.0 0.0 0.0 0.0 0.0 0.0 0.0 0.0 0.0 0.0
21 0.0 0.0 0.0 0.0 0.0 0.0 0.0 0.0 0.0 0.0 0.0 0.0
22 0.0 0.0 0.0 0.0 0.0 0.0 0.0 0.0 0.0 0.0 0.0 0.0
23 0.0 0.0 0.0 0.0 0.0 0.0 0.0 0.0 0.0 0.0 0.0 0.0
24 0.0 0.0 0.0 0.0 0.0 0.0 0.0 0.0 0.0 0.0 0.0 0.0
Monthly total 4824.01 4735.42 4684.05 5054.91 5221.24 4959.81 4704.75 4846.86 4806.11 4925.63 3891.02 4229.39
R. K. Akikur et al.
123
Page 5
in the SOFC mode section. For the thermal load, PTSC
provides heat energy in this mode of operation, and the
heat is stored in the thermal storage tank.
Analytical description
An analytical description of hydrogen production and
power generation in both modes with the major
components of the system is presented in the following
(Akikur et al. 2014):
Hydrogen production
The total energy demand (DH) for the RSOFC in SOSE
mode can be expressed by Eq. (1).
DH ¼ DG þ TDS ð1Þ
where, TDS is the thermal energy in J mol-1 H2, and DG is
the electrical energy demand (free Gibson energy change),
and the electrical energy demand decreases with the
increasing thermal energy, but the total energy demand
does not change significantly.
The hydrogen production mainly depends on the exter-
nal DC current supply to the electrolyser. Hence, the total
electrical energy to the RSOFC in the hydrogen-production
mode is defined by the Eq. (2).
_WSOSE ¼ VSOSE ISOSE ð2Þ
where VSOSE is the output potential of RSOFC, and ISOSE is
the current density delivered by DC sources.
The total current delivered by the PV can be evaluated
by solving Eq. (3) and the Equations given in Table 4.
Table 2 Daily electrical energy
demands in kWh in a year
excluding water heating in
Malaysia (Mahlia and Chan
2011)
Hour Jan Feb Mar Apr May Jun Jul Aug Sep Oct Nov Dec
1 0.507 0.478 0.502 0.519 0.506 0.470 0.475 0.478 0.499 0.478 0.480 0.472
2 0.524 0.491 0.400 0.531 0.480 0.511 0.480 0.486 0.511 0.491 0.492 0.485
3 0.524 0.495 0.518 0.535 0.522 0.400 0.492 0.495 0.515 0.495 0.496 0.489
4 0.524 0.495 0.518 0.535 0.522 0.400 0.492 0.495 0.515 0.495 0.496 0.489
5 0.526 0.497 0.505 0.537 0.400 0.476 0.497 0.492 0.517 0.497 0.498 0.491
6 0.519 0.491 0.400 0.531 0.480 0.511 0.480 0.486 0.511 0.491 0.492 0.485
7 0.503 0.400 0.498 0.515 0.502 0.453 0.471 0.474 0.495 0.400 0.476 0.468
8 0.395 0.369 0.394 0.410 0.397 0.347 0.369 0.369 0.389 0.369 0.369 0.360
9 0.387 0.361 0.360 0.402 0.389 0.338 0.355 0.354 0.361 0.361 0.361 0.352
10 0.354 0.329 0.354 0.370 0.357 0.306 0.320 0.320 0.348 0.329 0.329 0.318
11 0.395 0.369 0.394 0.410 0.397 0.347 0.369 0.369 0.389 0.369 0.369 0.360
12 0.412 0.386 0.412 0.386 0.412 0.386 0.385 0.379 0.405 0.385 0.386 0.377
13 0.428 0.402 0.426 0.402 0.393 0.379 0.396 0.396 0.422 0.401 0.402 0.393
14 0.428 0.402 0.426 0.402 0.393 0.379 0.396 0.396 0.422 0.401 0.402 0.393
15 0.453 0.426 0.453 0.426 0.453 0.400 0.421 0.426 0.446 0.426 0.427 0.418
16 0.462 0.400 0.458 0.474 0.462 0.412 0.434 0.429 0.435 0.400 0.435 0.426
17 0.453 0.426 0.453 0.426 0.453 0.400 0.421 0.426 0.446 0.426 0.427 0.418
18 0.449 0.422 0.446 0.422 0.450 0.422 0.417 0.416 0.420 0.422 0.423 0.414
19 0.424 0.398 0.420 0.398 0.425 0.375 0.392 0.392 0.418 0.397 0.398 0.389
20 0.395 0.369 0.394 0.410 0.397 0.347 0.369 0.369 0.389 0.369 0.369 0.360
21 0.404 0.377 0.402 0.418 0.405 0.355 0.372 0.371 0.397 0.377 0.378 0.368
22 0.424 0.398 0.420 0.398 0.425 0.375 0.392 0.392 0.418 0.397 0.398 0.389
23 0.445 0.418 0.442 0.418 0.446 0.396 0.413 0.412 0.438 0.418 0.418 0.410
24 0.449 0.422 0.446 0.422 0.450 0.422 0.417 0.416 0.420 0.422 0.423 0.414
Table 3 Monthly average ground temperature in Malaysia
Month Ground temperature (�C)
January 26.1
February 27.0
March 27.2
April 27.1
May 27.0
June 26.5
July 26.1
August 26.3
September 26.7
October 26.9
November 26.6
December 26.0
Economic feasibility analysis of a solar energy and solid oxide fuel cell-based…
123
Page 6
I ¼ ISC 1� C1 expV � DV
C2VOC
� �� 1
� �� �þ DI ð3Þ
In the hydrogen production mode, the output potential
VSOSE is the summation of the Nernst potential (E) and the
over potentials (given in Table 4) (Ni et al. 2007a).
VSOSE ¼ E þ gSOSEconc; i þ gohmic þ gact;i; i ¼ a; c ð4Þ
The outlet flow of H2 and O2 depend on the cell current
density (J) and can be calculated by Eq. (5).
_NH2;out ¼J
2F¼ _NH2O;utilized ð5Þ
_NO2;out ¼J
4Fð6Þ
The inlet water steam flow at the RSOFC is a known
parameter. Therefore, the outlet flow rate of H2O can be
determined using Eq. (7).
_NH2O;out ¼ _NH2O;in �J
2Fð7Þ
The heat energy supplied to the electrolyser for the H2O
steam electrolysis depends on the heat generation by the
irreversibility losses (Ni et al. 2007a). The over potentials
of SOSE responsible for direct generation of the heat can
be obtained using Eq. (8).
ri ¼ 2F gSOSEconc;i þ gohmic þ gact;i�
ð8Þ
when, ri � TDS, the external heat is not needed for the
water splitting reaction, thus Qheat;SOSE ¼ 0.
If, ri � TDS, the external heat is needed and the heat
input can be determined using Eq. (9).
Qheat;SOSE ¼ TDS � ri½ � _NH2O;utilized ð9Þ
The required heat input for the steam electrolysis is
stabilized at constant temperature by the heater. Since
steam from the PTSC varies with the solar radiation, the
heat exchanger-1 and the heaters are used to heat up the
steam at desired temperature.
The amount of heat energy provided by the PTSC is
determined by solving the Eq. (10) with the help of the
Equations given in Table 4.
_Qu ¼ Aap FR Sr;ar � Ar
Aap
� �UL Tr;i � T0
� �� �ð10Þ
Hydrogen storage The conventional tank under a pres-
sure of 30 bar can be a cost-effective way to store the
produced hydrogen. Electrolysers can produce pressure
without any additional hydrogen compressor. Hence, the
hydrogen produced at 30 bar from the solid oxide elec-
trolyser can be stored in a conventional hydrogen tank
(Kalinci et al. 2015; Zoulias and Lymberopoulos 2007).
Power generation
The output power in power generation mode can be
expressed using Eq. (11)
_WSOFC ¼ VSOFCISOFC ð11Þ
where ISOFC is the produced current which is related to the
amount of utilized hydrogen can be expressed by Eq. (12)
0
5
10
15
20
25
1 2 3 4 5 6 7 8 9 10 11 12 13 14 15 16 17 18 19 20 21 22 23 24
Ave
rage
hou
rly
use,
Litr
e Time
Fig. 1 Average hourly hot
water usage in a typical
household in Malaysia
Fig. 2 General concept of the proposed cogeneration system
R. K. Akikur et al.
123
Page 7
ISOFC ¼ AJSOFC ¼ Að2 _NH2;utilizedFÞ ð12Þ
where, A (m2) is the cell’s active area.
The fuel utilization ratio can be calculated by using
Eq. (13) (Colpan 2009)
Uf ¼_NH2;utilized
_NH2;inlet
ð13Þ
where, the oxygen utilization is the half of hydrogen uti-
lization _NO2;utilized ¼ _NH2;utilized
� �2
The output voltage of a fuel cell depends on the polar-
ization losses and can be expressed using Eq. (14) (Ni et al.
2006, 2007b)
VSOFC ¼ E � gSOFCconc;i � gohmic � gact;i ð14Þ
where, the Nernst potential, Ohmic, activation and the
concentration overpotentials can be determined using
Equations given in Table 4.
From the Steady Flow Energy Equation, energy balance
Equation can be expressed by Eqs. (15) or (16). (Gardner
1997)
QinþWin¼QoutþWoutþDH ð15Þ
or
Qout � Qin ¼ DG � DHf c�DHref ð16Þ
where, DG and DHfc are the Gibbs energy and enthalpy of
fuel cell reaction, respectively (Gardner 1997).
The total heat output and the heat gain are reduced by
heat losses from the external preheater, fuel cell stack and
losses up to the heat exchanger. The usable heat output and
heat gain are then further reduced by the effectiveness of
the heat exchanger. Net usable heat gain from a complete
fuel cell system at SOFC mode can be evaluated by sub-
tracting the heat output from heat exchanger and the
external preheating heat input using Eq. (17)
Qusable;net ¼ Qfc;net þ QH2cr � Qloss
� �ehcx � Qep ð17Þ
where, Qfc;net, QH2cr and Qep are the net heat gain within fuel
cell stack, heat from combustion of recirculated hydrogen
and external preheating heat input, respectively. ehcx is the
heat exchanger effectiveness, Qloss is the heat loss by the
surrounding. If the system is well isolated then, Qloss ¼ 0.
The net heat gain within fuel cell stack can be expressed
by Eq. (18).
Qfc;net ¼ Qfcr þ Qrvl � Qarr ð18Þ
where, Qfcr, Qrvl and Qarr are the heat generated from fuel
cell reaction, the heat recovery from voltage loss and the
heat absorbed by reforming reaction, respectively. For the
hydrogen fuel as an input, no reformation is needed, thus
for this study Qarr ¼ 0.
System cost analysis
Energy cost
The economic analysis of the whole system has been car-
ried out to focus on the estimation of the unit cost ($/kWh)
of the produced energy. The annual total cost can be
Fig. 3 Operational diagram of
a solar- and SOFC-based
cogeneration system (Akikur
et al. 2014)
Economic feasibility analysis of a solar energy and solid oxide fuel cell-based…
123
Page 8
calculated by the sum of investment cost as well as the
operation and maintenance cost (Ca&m) using Eq. (19)
(Akikur et al. 2014).
Cat ¼ Cai þ Co&om ð19Þ
The annual investment cost, Cai can be calculated from
the total purchasing cost, Cpc disregarding the individual
component replacement cost during its lifespan, n using
Eq. (20).
Table 4 Equations used to evaluate the parameters and analyse the proposed cogeneration system
Current delivered by the PV
Constant 1 C1 ¼ 1� Imp
ISC
� exp � Vmp
C2VOC
�
Constant 2C2 ¼
Vmp=VOC�1
ln 1�Imp=ISCð ÞChange of current DI ¼ a S
Sref
� DT þ S
Sref� 1
� ISC
Change of voltage DV ¼ �bDT � RSDI
Output voltage of SOSE
Nernst potential
E ¼ E0 þ RT2F
lnP0H2
P0O2
� 1=2
P0H2O
264
375
Ohmic overpotential gohmic ¼ JL/
Activation overpotential gact;i ¼ RTFsinh�1 J
2Jo;i
�
Concentration overpotential
gSOSEconc;a ¼ RT4F
ln
ffiffiffiffiffiffiffiffiffiffiffiffiffiffiffiffiffiffiffiffiffiffiffiffiffiffiffiffiffiffiffiffiffiffiffiffiffiffiffiP0O2
� 2
þ JRTlda=2FBgð Þr
P0O2
0BB@
1CCA
gSOSEconc;c ¼ RT2F
ln1þJRTdc=2FD
effH2O
P0H2
1�JRTdc=2FDeffH2O
P0H2O
� �
Heat energy of PTSC output
Aperture area Aap ¼ w � Dc;o
� �Lc
Heat removal factor FR ¼ _mrCpr
ArUL1� exp � ArULF1
_mrCpr
� �
Receiver’s absorbed radiation Sr;ar ¼ S grOverall heat loss coefficient between the ambient and the receiver
UL ¼ Ar
hc;caþhr;cað ÞAc
þ 1hr;cr
� ��1
Concentration overpotential of fuel cell operation mode
Concentration overpotential
gSOFCconc;a ¼ � RT2F
ln1� RT=2Fð Þ Jda=Deff
H2P0H2
�
1þ RT=2Fð Þ Jda=DeffH2
P0H2O
� 24
35
gSOFCconc;c ¼ � RT4F
lnp0=dO2ð Þ� p0=dO2ð Þ�P0
O2
� exp RT=4Fð Þ JdO2 dc
.Deff
O2p0
� h iP0O2
24
35
Overall and individual efficienciesof the system’s components
Efficiency of SOSE gSOSE ¼ LHVH2_NH2 ;out
_WSOSEþQheat;SOSEþQheat;H2O
Efficiency of PTSC gPTSC ¼ FR g0 � ULTi�Ta
GBC
� h i
Efficiency of PV gPVmax ¼ Pm
S�Ac
Overall efficiency of solar–SOSE mode gsolarþSOSEsys ¼ WPV
out;loadþ _NH2 ;outLHVH2
WPVinput
þPPTSCinput
þQheat;SOSE
Electrical efficiency of SOFC gSOFCel ¼ WSOFC;net
_NH2 ;inletLHVH2
Thermal efficiency of SOFC gSOFCheat ¼ Qusable;net
H2;consumptionLHVH2
Combined overall efficiency gSOFCOverall ¼ gSOFCel þ gSOFCheat
Overall efficiency of solar–SOFC mode gsolarþSOFCsys ¼ WPV
out;loadþWSOFC
elþWSOFC
heatþQwater
heat
WPVinput
þPPTSCinput
þ _NH2 ;inletLHVH2
R. K. Akikur et al.
123
Page 9
Cai ¼ Cpc CRF ð20Þ
where, capital recovery factor (CRF) can be determined
using Eq. (21).
CRF ¼ i 1þ ið Þn
1þ ið Þn�1ð21Þ
where, i is the annual interest rate (%).
The unit cost of energy, Cu ($/kWh) can be calculated
using Eq. (22).
Cu ¼Cat
Eec
ð22Þ
where, Eec is the annual net usable electrical energy pro-
duction from the system which is the sum of electrical
energy provided by the PV and the fuel cell.
Payback period
The viability of any system can be evaluated by analysing
the payback period method. This is a period of time that
taken to be equal or cross the total investment cost of the
system by saving the annual energy cost of the conven-
tional system. The payback period can be determined by
the Eq. (23).
PB ¼ Total investment cost
Annual total cost savingð23Þ
In this study, the total investment cost includes the
capital, replacement and operating and maintenance costs,
respectively.
Efficiency calculation
The efficiency of the system can be calculated by solving
the Equations presented in Table 4. The efficiency of the
individual components can also be determined by using
those equations according to the operation mode.
Result and discussion
The cogeneration system has been designed based on the
Malaysian weather conditions as shown in Fig. 4. It has to
be noted that the fuel cell provides the energy demands of
13 h (i.e. first 7 h and last 6 h in a day). The solar PV can
provide the load demand during 9 a.m. to 5 p.m. without
any energy shortage. Solar PV works with fuel cell in
parallel for the remaining hours of the day when the solar–
PV cannot meet the total energy demand alone. The hourly
average solar radiation data as well as the load demand has
been considered to determine the system parameters and
analyse the performance. The analytical approach has been
used to determine the optimal system parameters like solar
PV, collector, fuel cell size etc. and found the right com-
bination of parameters that can provide the demand without
energy shortage at low cost.
Case studies
Two case studies have been conducted considering two
different load demands in this section. The values of sys-
tem parameters have been determined using the data given
in Table 5 and solving the equations in Sect. 2. Analysis
was carried out with the basic assumptions given as follows
(Akikur et al. 2014):
(1) Mass flow of the input fuel gas and all the reacting
products of fuel cell are stable.
(2) Incoming fuel and air have uniformly been dis-
tributed to each individual cell in the stack at SOFC
mode.
(3) The air supplied to the cathode is composed of
21 % oxygen and 79 % nitrogen.
(4) Temperatures of both the anode outlet gas and
cathode outlet gas are equal to the operating
temperature of the cell stack at both SOSE and
SOFC mode of operations. The current and voltage
of every cell unit are the same.
(5) Pressure at the anode and the cathode of the SOFC
is considered constant and equal.
(6) Radiation heat transfer between gas channels and
solid structure is negligible.
(7) Contact resistances are negligible.
(8) Pressure change at SOFC is negligible.
(9) Liquid H2O is fed to the PTSC in a reference
environment condition, i.e. 298.15 K and 1 atm.
(10) Heat losses inside the pipe are negligible.
Fig. 4 Yearly average solar radiation in Malaysia and the operation
mode of the system
Economic feasibility analysis of a solar energy and solid oxide fuel cell-based…
123
Page 10
The system for a single family: case 1
The cogeneration system has been designed to meet the
energy needs of a single family. The optimal system has
been designed considering the average hourly electrical
and hot water demand for a family, given in Table 2 and
Fig. 1 respectively. The typical per day average electricity
and hot water demands are 10.3 kWh and 235 l approxi-
mately (Mahlia and Chan 2011).
The calculated optimal values for the system component
to meet the energy requirements are shown in Table 6. The
fuel cells stack of 1.3 kW with current density (J) and
active area (A) of a single cell of 1200 A m-2 and 0.01 m2
have been considered for providing the energy demand and
hydrogen production. The maximum energy demand is
considered to be 0.537 kW per hour. If the operating
voltage of fuel cell stack is considered 24 V, total 33 cells
are required in series and two cells are in parallel to meet
the power demand. The operating voltage of a single cell is
0.73 volt at 850 �C which is calculated using Eq. (14). At
constant pressure of 1 bar with 80 % fuel utilization, the
hydrogen and oxygen requirements for the system are
calculated using Eqs. (12) and (13).
H2 fuel is preheated before entering the fuel cell stack
through the HEX-2. The produced steam from the chemical
reaction and unused H2 passes through the HEX-2. It has to
be noted that the input fuel absorbs the heat and raises the
temperature. Then approximately 23.4 l of hot water per
day at desired temperature can be harnessed by HEX-3
when 5 9 10-3 kg s-1 water at room temperature passes
through the HEX. For the operation, the sufficient area of a
HEX is found about 0.1 m2 which is calculated by NTU
method given in Akikur et al. (2014). A DC/AC inverter of
0.6 kW is considered for the electric load supply from the
fuel cell. On the other hand, a DC/DC converter of 1 kW
with MPPT facility is considered for interfacing between
PV and electrolyser at H2 production mode.
To produce sufficient amount of H2 as to ensure the H2
requirement during SOFC mode of operation, the optimal
solar PV system has been designed in Solar–SOSE mode.
According to weather conditions, the solar–PV of 2 kW
can provide the energy requirements in the day time and
the energy needed for sufficient hydrogen production. The
monthly average power generation of PV and the power
demand from PV in order to meet the electrical load and
the hydrogen production rate are presented in Table 7. To
ensure the power generation at night, 154.89 kg of
hydrogen is required in a year, whereas the designed sys-
tem can produce approximately 164.39 kg of hydrogen. It
also has to be noted that in November and December
hydrogen production rates are lower than the requirements.
However, excessive production in other months can tackle
the shortage in other months. The maximum hydrogen
production has found to be 15.77 kg in the month of May.
Hence, 20 kg of hydrogen storage tank would be enough
for the designed system. The PV can generate
3342.31 kWh of power in a year, where 1603.94 kWh for
electric load demand and rest of 1901.72 kWh used for
hydrogen production. However, there are still some power
shortages from the solar PV in some months at the early
day and the afternoon for insufficient solar radiation.
During the hydrogen production period, the PTSC pro-
vides the initial heat energy. For that operation, a collector
of 3-m length (Lc) and 1.5-m (w) width is considered for
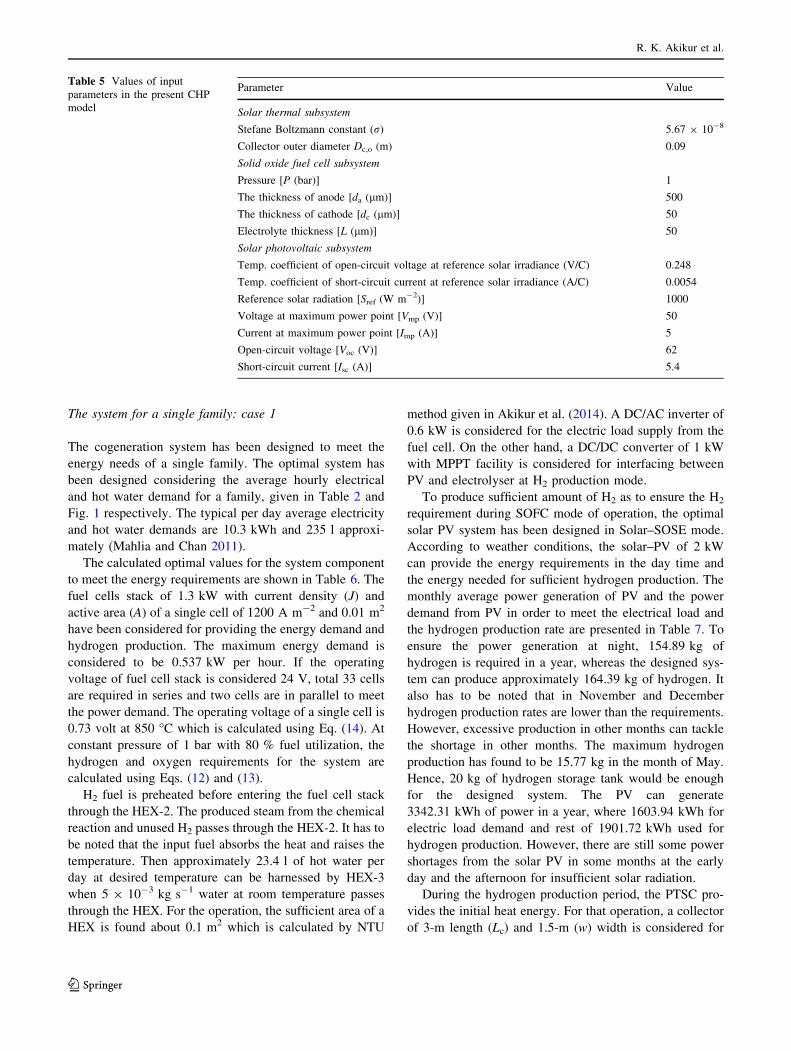
Table 5 Values of input
parameters in the present CHP
model
Parameter Value
Solar thermal subsystem
Stefane Boltzmann constant (r) 5.67 9 10-8
Collector outer diameter Dc,o (m) 0.09
Solid oxide fuel cell subsystem
Pressure [P (bar)] 1
The thickness of anode [da (lm)] 500
The thickness of cathode [dc (lm)] 50
Electrolyte thickness [L (lm)] 50
Solar photovoltaic subsystem
Temp. coefficient of open-circuit voltage at reference solar irradiance (V/C) 0.248
Temp. coefficient of short-circuit current at reference solar irradiance (A/C) 0.0054
Reference solar radiation [Sref (W m-2)] 1000
Voltage at maximum power point [Vmp (V)] 50
Current at maximum power point [Imp (A)] 5
Open-circuit voltage [Voc (V)] 62
Short-circuit current [Isc (A)] 5.4
R. K. Akikur et al.
123
Page 11
calculating the total area and the water steam temperature
using the Eq. (10). The area has been found to be 4.23 m2
for the case-1. Then the temperature of steam rises in HEX-
1 during the steady-state operation, and then steam flows
into the electrolyser. Moreover, the required area of the
HEX is determined considering the overall heat-transfer
coefficient of 0.05 kW m-2 K-1, and it is found that
0.5 m2 HEX would be appropriate for the operation. A
furnace is considered as a preheater to maintain the oper-
ating temperature of electrolyser. In this study, it operates
only at start-up period; otherwise, the steam reaches the
required temperature when it passes through the HEX-1. In
this mode of operation, approximately 32.4 l of hot water
per day can be drawn from the heater HEX-3 by passing
water at the flow rate of 0.001 kg s-1 at normal tempera-
ture (25 �C) through the HEX.
In solar–SOFC mode of operation, the power from
SOFC depends on the power delivered by the PV.
According to Malaysian weather conditions, the system
needs to operate few hours in solar–SOFC mode to meet
the demand because the solar radiation is not sufficient to
fulfil the demand. Moreover, from September to December,
the system needs to operate in this mode for three hours.
The power management between solar–PV and SOFC in a
year is shown in Fig. 5.
A total of 60 l of hot water at the temperatures in the
range of 55–60 �C per day can be collected from the HEX-
3 whereas the total requirement is 235 l day-1. Hence, to
meet the thermal load requirements, an additional solar
collector can be added. From the calculation, it is found
that 1.41 m2 (1-m length and 1.5-m width) collector can
provide 198 l day-1 hot water at the temperature range of
47–68 �C at the water flow rate of 0.0045 kg s-1 through
the collector.
The system for 100 single families: case 2
In this section, the cogeneration system has been analysed
considering load demand for 100 single families in a dis-
tribution system as presented in Table 2 and Fig. 1.
According to the demand and weather conditions, optimal
values of the cogeneration systems parameters are deter-
mined and illustrated in Table 8 similar to case-1. The
values of solar–PV and fuel cell have been chosen to meet
the total energy demand. The other components such as
heat exchanger, inverter and converter have also been
designed accordingly. The daily average energy demand is
10.3 MWh with the maximum per hour load 53.7 kW.
A SOFC of 130 kW is considered with the current density
and the active area of a single cell being 1200 A m-2 and
0.01 m2, respectively. If the individual cell operates at
0.73 V, totally 33 cells are required in series and approx-
imately 209 cells in parallel intended to operate at 24 V to
provide 60 kW electrical load.
Table 6 The system components value to meet the energy demands for case-1
Components PV Solar collector Fuel cell stack HEX 1 HEX 2 HEX 3 DC/AC inverter DC/DC converter
Specifications 2 kW 4.23 m2 1.3 kW 0.5 m2 0.1 m2 0.01 m2 0.6 kW 1 kW
Table 7 Monthly total value of different parameters to meet the demand for Case-1
Month Total power
from PV (kWh)
Power remain for
H2 production (kWh)
H2 production
(kg)
H2 needed for
SOFC (kg)
Jan 289.33 161.43 14.72 13.88
Feb 265.40 153.83 13.23 12.04
Mar 279.73 150.32 12.93 13.03
Apr 292.34 165.69 14.25 13.06
May 312.80 183.32 15.77 13.22
Jun 286.94 174.19 14.98 11.80
Jul 281.31 162.14 13.94 12.88
Aug 289.66 167.72 14.42 12.73
Sep 277.61 155.90 13.41 13.05
Oct 293.83 176.30 15.16 12.98
Nov 221.91 112.70 9.69 13.12
Dec 251.36 138.17 11.88 13.11
Total 3342.21 1901.72 164.39 154.89
Economic feasibility analysis of a solar energy and solid oxide fuel cell-based…
123
Page 12
The solar collectors with the aperture area of 68.2 m2,
with the length and width being 20 and 3.5 m, respectively,
have been considered to provide the thermal energy for the
water during solar radiation time. The solar–PV of 200 kW
is considered for H2 production and electric load supply.
Monthly power provided for the H2 production after ful-
filling the electrical load demand, the H2 production at
solar radiation period and the H2 requirement at off-sun
period are calculated and shown in Table 9. The size of
DC/DC converter is taken according to the maximum
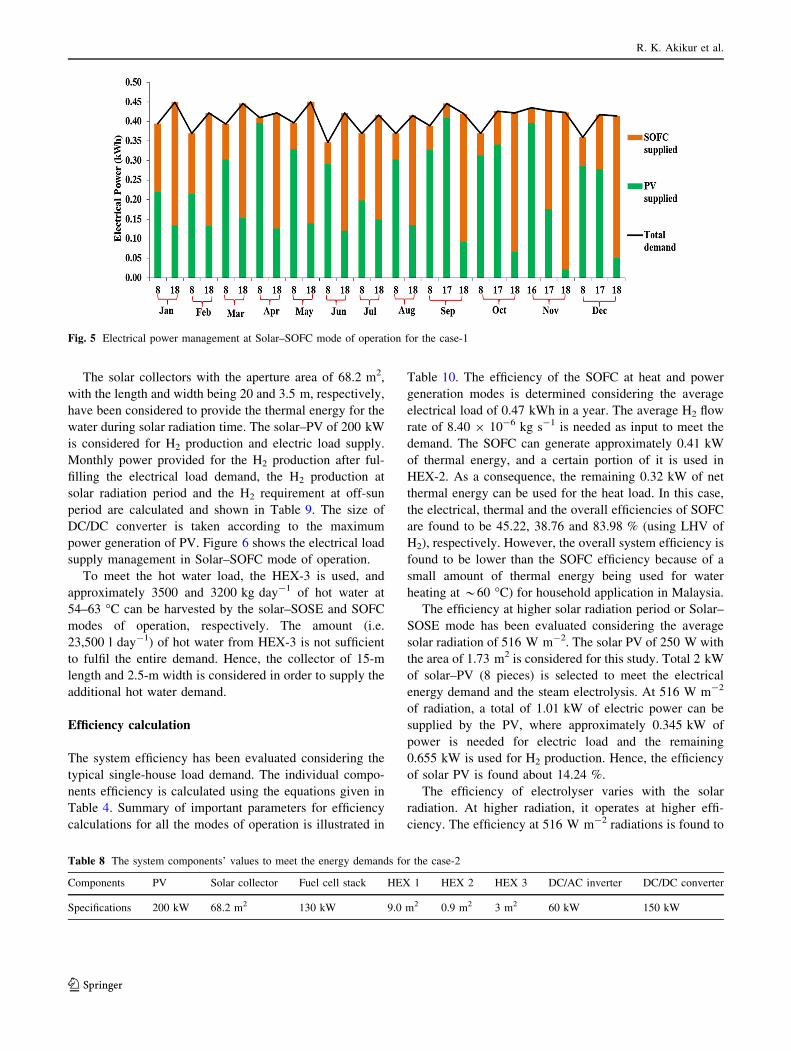
power generation of PV. Figure 6 shows the electrical load
supply management in Solar–SOFC mode of operation.
To meet the hot water load, the HEX-3 is used, and
approximately 3500 and 3200 kg day-1 of hot water at
54–63 �C can be harvested by the solar–SOSE and SOFC
modes of operation, respectively. The amount (i.e.
23,500 l day-1) of hot water from HEX-3 is not sufficient
to fulfil the entire demand. Hence, the collector of 15-m
length and 2.5-m width is considered in order to supply the
additional hot water demand.
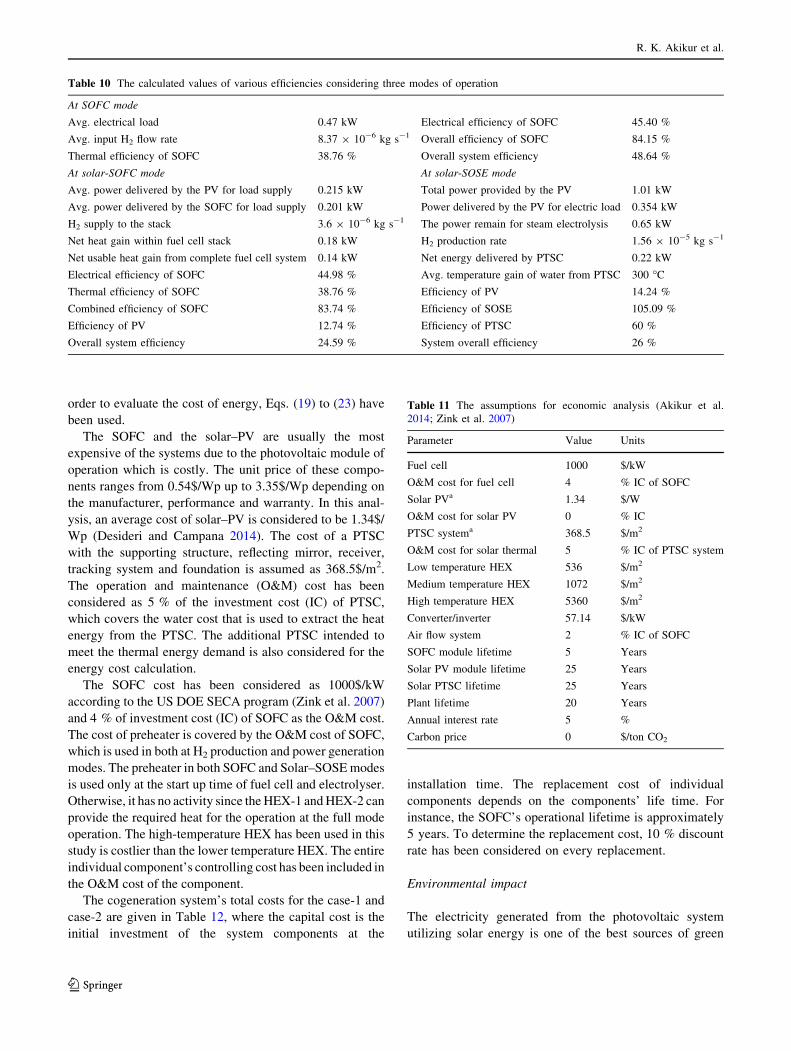
Efficiency calculation
The system efficiency has been evaluated considering the
typical single-house load demand. The individual compo-
nents efficiency is calculated using the equations given in
Table 4. Summary of important parameters for efficiency
calculations for all the modes of operation is illustrated in
Table 10. The efficiency of the SOFC at heat and power
generation modes is determined considering the average
electrical load of 0.47 kWh in a year. The average H2 flow
rate of 8.40 9 10-6 kg s-1 is needed as input to meet the
demand. The SOFC can generate approximately 0.41 kW
of thermal energy, and a certain portion of it is used in
HEX-2. As a consequence, the remaining 0.32 kW of net
thermal energy can be used for the heat load. In this case,
the electrical, thermal and the overall efficiencies of SOFC
are found to be 45.22, 38.76 and 83.98 % (using LHV of
H2), respectively. However, the overall system efficiency is
found to be lower than the SOFC efficiency because of a
small amount of thermal energy being used for water
heating at *60 �C) for household application in Malaysia.
The efficiency at higher solar radiation period or Solar–
SOSE mode has been evaluated considering the average
solar radiation of 516 W m-2. The solar PV of 250 W with
the area of 1.73 m2 is considered for this study. Total 2 kW
of solar–PV (8 pieces) is selected to meet the electrical
energy demand and the steam electrolysis. At 516 W m-2
of radiation, a total of 1.01 kW of electric power can be
supplied by the PV, where approximately 0.345 kW of
power is needed for electric load and the remaining
0.655 kW is used for H2 production. Hence, the efficiency
of solar PV is found about 14.24 %.
The efficiency of electrolyser varies with the solar
radiation. At higher radiation, it operates at higher effi-
ciency. The efficiency at 516 W m-2 radiations is found to
Fig. 5 Electrical power management at Solar–SOFC mode of operation for the case-1
Table 8 The system components’ values to meet the energy demands for the case-2
Components PV Solar collector Fuel cell stack HEX 1 HEX 2 HEX 3 DC/AC inverter DC/DC converter
Specifications 200 kW 68.2 m2 130 kW 9.0 m2 0.9 m2 3 m2 60 kW 150 kW
R. K. Akikur et al.
123
Page 13
be more than 100 % which varies with the solar radiation.
The electrical power from solar PV of 0.65 kW is used for
steam electrolysis. The heat energy of steam is 0.22 kW
provided by the PTSC, and the heat energy provided by
HEX-2 which is approximately 0.96 kW [calculated using
Eq. (8, 9)] is considered as input to calculate the efficiency
of the SOSE. When the H2 production rate is
1.56 9 10-5 kg s-1 at 516 W m-2 with the LHV of
249.2 kJ mol-1, the efficiency of SOSE reached up to
105.09 %. Furthermore, the overall system efficiency at
solar–SOSE mode is calculated, where the input powers of
PV and PTSC are determined by multiplying the total
surface area and the solar radiation on it (516 W m-2), and
it is found to be approximately 26 %.
At Solar–SOFC mode of operation, energy demand is
provided by the PV and SOFC. The PV acts as a primary
energy source at this time, and the remaining energy
requirement is provided by SOFC. According to the
Malaysian weather conditions, the average solar radiation
in a year in solar–SOFC mode is 122.5 W m-2, when the
average powers supplied by PV and SOFC are 0.215 and
0.201 kW, respectively, to meet the electric energy
demand. The efficiency of solar PV and the electrical
efficiency of SOFC are found to be 12.74 and 44.98 %,
respectively. The electrical efficiency of SOFC is slightly
lower than that of the SOFC mode because of the capacity
factor of SOFC. At full-load operation, the SOFC shows
higher efficiency. The overall system efficiency in this
mode of operation is found to be 24.56 %.
Economic and environmental impact analysis
An economic analysis has been conducted in this study
considering the parametric values given in Table 11. In
Table 9 Monthly total parameter values to meet the demands for the case-2
Month Power from PV
(MWh)
Power remain for
H2 production (MWh)
H2 production
(kg)
H2 needed for SOFC
(kg)
Jan 28.93 16.14 1472.45 1388.08
Feb 26.54 15.38 1322.93 1204.04
Mar 27.97 15.03 1292.70 1302.51
Apr 29.23 16.57 1424.92 1306.33
May 31.28 18.33 1576.54 1321.57
Jun 28.69 17.42 1498.05 1179.99
Jul 28.13 16.21 1394.36 1288.46
Aug 28.97 16.77 1442.40 1272.63
Sep 27.76 15.59 1340.73 1305.06
Oct 29.38 17.63 1516.21 1297.73
Nov 22.19 11.27 969.24 1312.29
Dec 25.14 13.82 1188.30 1310.64
Total 334.22 190.17 16,438.82 15,489.34
Fig. 6 Electrical power management at Solar–SOFC mode of operation for the case-2
Economic feasibility analysis of a solar energy and solid oxide fuel cell-based…
123
Page 14
order to evaluate the cost of energy, Eqs. (19) to (23) have
been used.
The SOFC and the solar–PV are usually the most
expensive of the systems due to the photovoltaic module of
operation which is costly. The unit price of these compo-
nents ranges from 0.54$/Wp up to 3.35$/Wp depending on
the manufacturer, performance and warranty. In this anal-
ysis, an average cost of solar–PV is considered to be 1.34$/
Wp (Desideri and Campana 2014). The cost of a PTSC
with the supporting structure, reflecting mirror, receiver,
tracking system and foundation is assumed as 368.5$/m2.
The operation and maintenance (O&M) cost has been
considered as 5 % of the investment cost (IC) of PTSC,
which covers the water cost that is used to extract the heat
energy from the PTSC. The additional PTSC intended to
meet the thermal energy demand is also considered for the
energy cost calculation.
The SOFC cost has been considered as 1000$/kW
according to the US DOE SECA program (Zink et al. 2007)
and 4 % of investment cost (IC) of SOFC as the O&M cost.
The cost of preheater is covered by the O&M cost of SOFC,
which is used in both at H2 production and power generation
modes. The preheater in both SOFC and Solar–SOSEmodes
is used only at the start up time of fuel cell and electrolyser.
Otherwise, it has no activity since theHEX-1 andHEX-2 can
provide the required heat for the operation at the full mode
operation. The high-temperature HEX has been used in this
study is costlier than the lower temperature HEX. The entire
individual component’s controlling cost has been included in
the O&M cost of the component.
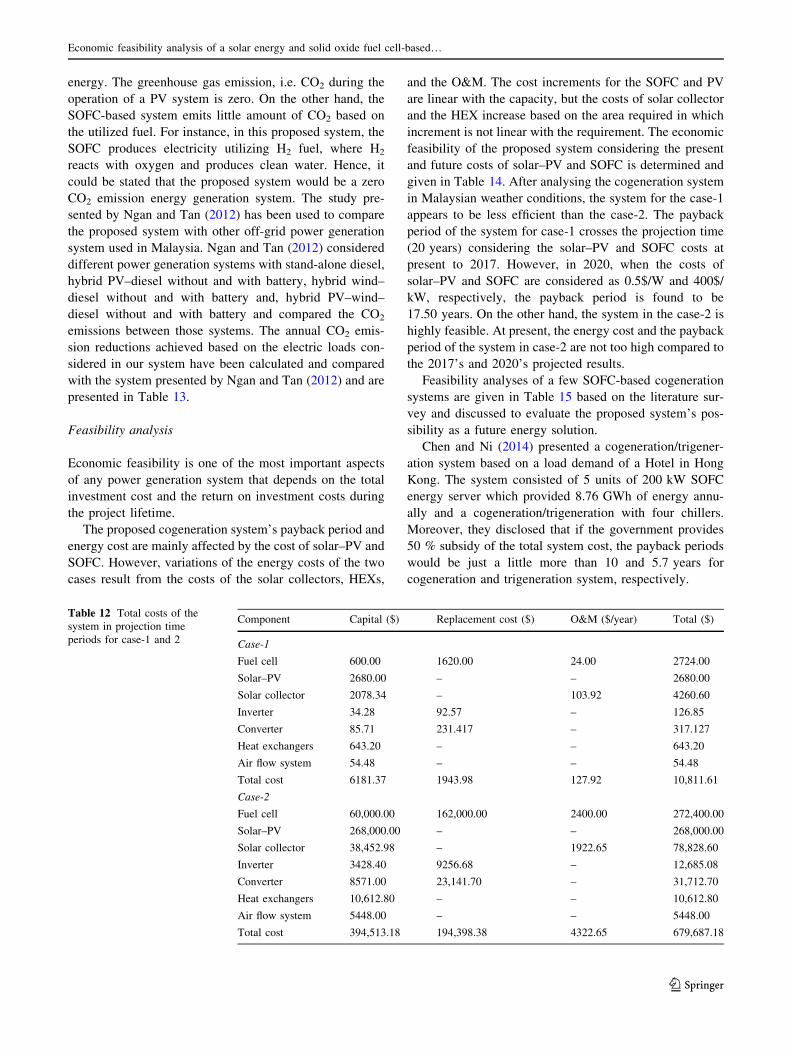
The cogeneration system’s total costs for the case-1 and
case-2 are given in Table 12, where the capital cost is the
initial investment of the system components at the
installation time. The replacement cost of individual
components depends on the components’ life time. For
instance, the SOFC’s operational lifetime is approximately
5 years. To determine the replacement cost, 10 % discount
rate has been considered on every replacement.
Environmental impact
The electricity generated from the photovoltaic system
utilizing solar energy is one of the best sources of green
Table 10 The calculated values of various efficiencies considering three modes of operation
At SOFC mode
Avg. electrical load 0.47 kW Electrical efficiency of SOFC 45.40 %
Avg. input H2 flow rate 8.37 9 10-6 kg s-1 Overall efficiency of SOFC 84.15 %
Thermal efficiency of SOFC 38.76 % Overall system efficiency 48.64 %
At solar-SOFC mode At solar-SOSE mode
Avg. power delivered by the PV for load supply 0.215 kW Total power provided by the PV 1.01 kW
Avg. power delivered by the SOFC for load supply 0.201 kW Power delivered by the PV for electric load 0.354 kW
H2 supply to the stack 3.6 9 10-6 kg s-1 The power remain for steam electrolysis 0.65 kW
Net heat gain within fuel cell stack 0.18 kW H2 production rate 1.56 9 10-5 kg s-1
Net usable heat gain from complete fuel cell system 0.14 kW Net energy delivered by PTSC 0.22 kW
Electrical efficiency of SOFC 44.98 % Avg. temperature gain of water from PTSC 300 �CThermal efficiency of SOFC 38.76 % Efficiency of PV 14.24 %
Combined efficiency of SOFC 83.74 % Efficiency of SOSE 105.09 %
Efficiency of PV 12.74 % Efficiency of PTSC 60 %
Overall system efficiency 24.59 % System overall efficiency 26 %
Table 11 The assumptions for economic analysis (Akikur et al.
2014; Zink et al. 2007)
Parameter Value Units
Fuel cell 1000 $/kW
O&M cost for fuel cell 4 % IC of SOFC
Solar PVa 1.34 $/W
O&M cost for solar PV 0 % IC
PTSC systema 368.5 $/m2
O&M cost for solar thermal 5 % IC of PTSC system
Low temperature HEX 536 $/m2
Medium temperature HEX 1072 $/m2
High temperature HEX 5360 $/m2
Converter/inverter 57.14 $/kW
Air flow system 2 % IC of SOFC
SOFC module lifetime 5 Years
Solar PV module lifetime 25 Years
Solar PTSC lifetime 25 Years
Plant lifetime 20 Years
Annual interest rate 5 %
Carbon price 0 $/ton CO2
R. K. Akikur et al.
123
Page 15
energy. The greenhouse gas emission, i.e. CO2 during the
operation of a PV system is zero. On the other hand, the
SOFC-based system emits little amount of CO2 based on
the utilized fuel. For instance, in this proposed system, the
SOFC produces electricity utilizing H2 fuel, where H2
reacts with oxygen and produces clean water. Hence, it
could be stated that the proposed system would be a zero
CO2 emission energy generation system. The study pre-
sented by Ngan and Tan (2012) has been used to compare
the proposed system with other off-grid power generation
system used in Malaysia. Ngan and Tan (2012) considered
different power generation systems with stand-alone diesel,
hybrid PV–diesel without and with battery, hybrid wind–
diesel without and with battery and, hybrid PV–wind–
diesel without and with battery and compared the CO2
emissions between those systems. The annual CO2 emis-
sion reductions achieved based on the electric loads con-
sidered in our system have been calculated and compared
with the system presented by Ngan and Tan (2012) and are
presented in Table 13.
Feasibility analysis
Economic feasibility is one of the most important aspects
of any power generation system that depends on the total
investment cost and the return on investment costs during
the project lifetime.
The proposed cogeneration system’s payback period and
energy cost are mainly affected by the cost of solar–PV and
SOFC. However, variations of the energy costs of the two
cases result from the costs of the solar collectors, HEXs,
and the O&M. The cost increments for the SOFC and PV
are linear with the capacity, but the costs of solar collector
and the HEX increase based on the area required in which
increment is not linear with the requirement. The economic
feasibility of the proposed system considering the present
and future costs of solar–PV and SOFC is determined and
given in Table 14. After analysing the cogeneration system
in Malaysian weather conditions, the system for the case-1
appears to be less efficient than the case-2. The payback
period of the system for case-1 crosses the projection time
(20 years) considering the solar–PV and SOFC costs at
present to 2017. However, in 2020, when the costs of
solar–PV and SOFC are considered as 0.5$/W and 400$/
kW, respectively, the payback period is found to be
17.50 years. On the other hand, the system in the case-2 is
highly feasible. At present, the energy cost and the payback
period of the system in case-2 are not too high compared to
the 2017’s and 2020’s projected results.
Feasibility analyses of a few SOFC-based cogeneration
systems are given in Table 15 based on the literature sur-
vey and discussed to evaluate the proposed system’s pos-
sibility as a future energy solution.
Chen and Ni (2014) presented a cogeneration/trigener-
ation system based on a load demand of a Hotel in Hong
Kong. The system consisted of 5 units of 200 kW SOFC
energy server which provided 8.76 GWh of energy annu-
ally and a cogeneration/trigeneration with four chillers.
Moreover, they disclosed that if the government provides
50 % subsidy of the total system cost, the payback periods
would be just a little more than 10 and 5.7 years for
cogeneration and trigeneration system, respectively.
Table 12 Total costs of the
system in projection time
periods for case-1 and 2
Component Capital ($) Replacement cost ($) O&M ($/year) Total ($)
Case-1
Fuel cell 600.00 1620.00 24.00 2724.00
Solar–PV 2680.00 – – 2680.00
Solar collector 2078.34 – 103.92 4260.60
Inverter 34.28 92.57 – 126.85
Converter 85.71 231.417 – 317.127
Heat exchangers 643.20 – – 643.20
Air flow system 54.48 – – 54.48
Total cost 6181.37 1943.98 127.92 10,811.61
Case-2
Fuel cell 60,000.00 162,000.00 2400.00 272,400.00
Solar–PV 268,000.00 – – 268,000.00
Solar collector 38,452.98 – 1922.65 78,828.60
Inverter 3428.40 9256.68 – 12,685.08
Converter 8571.00 23,141.70 – 31,712.70
Heat exchangers 10,612.80 – – 10,612.80
Air flow system 5448.00 – – 5448.00
Total cost 394,513.18 194,398.38 4322.65 679,687.18
Economic feasibility analysis of a solar energy and solid oxide fuel cell-based…
123
Page 16
Vialetto and Rokni (2015) studied a SOFC and heat
pump-based cogeneration systems focusing on electrical
and heat load demands of a resort located in a northern
European climate (Denmark). The system was simulated
considering different operating strategies to unveil the
lucrative solution for the selected location. Two strategies
were considered: continuous operation (CO), where the
electricity generation of the system is constant for a certain
period, and the other one is an equivalent electrical load
following (ELF), where the electricity production is equal
to the demand. The simulation results illustrated that the
CO strategy needs 1 kW of SOFC and the ELF strategy
needs 2 kW of SOFC where the payback periods for the
CO and ELF strategy are 16 and 15 years, respectively.
Mahlia and Chan (2011) presented a cogeneration sys-
tem using a SOFC in Malaysia for electrical load of
10.3 kW day-1 and thermal load of 1.85 kW day-1,
respectively. The study reported the proposed system’s
payback period over the projected life (20 years) of the
system for lower load applications.
Al-Qattan et al. (2014) presented a cogeneration system
to provide cooling for 805 residential villas, four schools,
two community shopping centres and four houses of wor-
ship in Kuwait. A SOFC of 18 MW generated electrical
power to operate chillers, and the exhaust energy and heat
from the SOFC were used to run gas turbines and
absorption chillers. The system was designed to meet the
cooling demand of the district, and to feed extra electrical
power to the grid during periods of lower demand. From
the analysis, they revealed that the energy cost of the SOFC
system is $0.0192 kWh-1 for 96 MW cooling load
demand.
Uncertainty of power generation and supply
The system operation depends on the availability of solar
radiation which fluctuates over time. Although the H2 fuel
is lucrative for the large-energy storage system, this storage
system would not be able to maintain the system stability.
To maintain the stability and reliable load supply, an
auxiliary power supply is needed, and the battery storage is
a good candidate for this purpose. The operation strategy
would be modified for stable operation as follows:
• The battery storage could be used instead of SOFC in
solar–SOFC mode which is able to save more H2 and
that would be used when solar radiation is unavailable
for a day.
• In high impulsive day of solar radiation, the load supply
would be considered from SOFC. With regard to H2
fuel, if we consider battery as a backup supply in solar–
SOFC mode; approximately 20 kg of H2 is saved in a
year for the case-1 which is sufficient to cover the load
for few days. The capacity of 0.8 kWh of battery with
50 % maximum depth of discharge (DODmax) is
sufficient to supply the load at solar–SOFC mode.
A flow chart of the system operation is essential to
understand the operation as well as the system stability
which is illustrated in Fig. 7. A battery storage system is
included in the proposed system where it is charged when
the solar radiation is below 500 W m-2 and the solar
radiation fluctuates highly. Otherwise, the solar radiation is
utilized for the hydrogen generation. Although the
Table 14 Economic feasibility study of the proposed system
Present 2017 2020
Case-1
PV ($/W) 1.34 0.7 0.5
SOFC ($/kW) 1000 700 400
Energy cost ($/kWh) 0.158 0.126 0.112
Payback (years) 30.63 24.64 21.15
Case-2
PV ($/W) 1.34 0.7 0.5
SOFC ($/kW) 1000 700 400
Energy cost ($/kWh) 0.091 0.059 0.045
Payback (years) 19.26 13.27 9.77
Table 13 CO2 emission reduction achieved in the present study compared to the system presented in Ref (Ngan and Tan 2012)
Energy generation system Ngan and Tan et al. CO2 emission reduction by the proposed system
Case-1 Case-2
kg year-1 kg kWh-1 kg year-1 kg year-1
Stand-alone diesel system 351,844.0 1.134 102,339.0 1.0 9 107
Hybrid PV/diesel system without battery storage 323,696.5–302,585.8 1.043–0.975 94,151.9 9.4 9 106
Hybrid PV/diesel system with battery storage 246,290.8 0.794 88,011.6 8.8 9 106
Hybrid wind/diesel system without battery 350,788.5–344,455.3 1.131–1.110 71,637.3 7.2 9 106
Hybrid wind/diesel system with battery 344,807.1–309,622.7 1.112–0.998 102,032.0 1.0 9 1007
Hybrid PV/wind/diesel system without battery 323,696.5–299,067.4 1.043–0.964 100,189.9 1.0 9 107
Hybrid PV/wind/diesel system with battery 230,457.8 0.743 100,292.2 1.0 9 107
R. K. Akikur et al.
123
Page 17
involvement of battery storage uplifts the energy cost, it
ensures the stability of the system operation. The energy
cost for the case-1 has been recalculated considering the
battery storage system, and it has increased from $0.158 to
$0.160 kWh-1 where the battery related expenses has been
adopted from ref. (Shezan et al. 2015)
Conclusion
The study on solar energy and fuel cell (SOFC)-based
cogeneration system indicates that it can be considered one of
the promising energy systems in the residential sector,
especially for higher energy demand. The findings of the case
studies of the system can be concluded as follows: The
combined heat and power efficiencies for SOFC, solar–
SOSE, and solar–SOFC modes are found to be 84.15, 26 and
24.59 %, respectively. Only electrical efficiency for those
modes of operation are found to be 45.40, 14.24 and 24.59 %,
respectively. The system is found to be 42.4 %more feasible
for the case-2 than case-1 with respect to present energy cost.
The costs of energy for the case-1 and case-2 are estimated to
be $0.158 and $0.091 kWh-1, respectively. Payback periods
are calculated as 30.63 and 19.26 years, respectively. In
future (2020), the system is expected to be 59.8 % more
feasible in cogeneration application for higher load demand
Table 15 Feasibility analysis of the present work with the SOFC-based system presented in the literature
Author (year) System Annual load demand (GWh) Payback period (years) Energy cost ($/kWh)
Chen and Ni (2014) Cogeneration/trigeneration 8.76 10/5.7 –
Vialetto and Rokni (2015) Cogeneration – 16 (CO)
15 (ELF)
–
Mahlia and Chan (2011) Cogeneration 3.76 (electrical)
0.68 (thermal)
[20 –
Al-Qattan et al. (2014) Cogeneration 35.04 (cooling) – 0.0192
Present work (2015) Cogeneration 3.76 (electrical)
0.68 (thermal)
[20 0.158
Present work (2015) Cogeneration 376 (electrical)
68 (thermal)
19.26 0.091
Solar radiation?
Yes
No
SOFC work as Hydrogen
production mode
SOFC work as power
generation mode
T of steamIf T 700°C
No
Preheater Yes
PTSC
eLoad
H2 Flow from Storage tank
T of H2
If T 700°C
Preheater
No
Yes
No
Yes
Heat Load
Start
P=Ppv-Pload
PV If Ppv Pload
H2O Flow from Storage tank
Battery
Fig. 7 Operational flow
chart of the proposed
cogeneration system
considering auxiliary load
supply
Economic feasibility analysis of a solar energy and solid oxide fuel cell-based…
123
Page 18
than for lower load.While the costs of solar PV andSOFC are
$500 and $400 kW-1, respectively, the energy cost and
payback periods for the Case-1 are expected to be
$0.112 kWh-1 and 21.15 years, respectively. The proposed
cogeneration system is further analysed considering the
backup power system to increase the load supply reliability.
RSOFC is still in development phase along with its longer
starting period. Therefore, a backup supply is crucial to avoid
the powermismanagement. The energy cost for the case-1 has
been found to be $0.160 kWh-1 approximately considering
the battery storage system.
From the system analysis, following issues need to be
addressed in future to make solar energy and fuel cell-
based cogeneration system lucrative and practically
feasible:
• The system is analysed under Malaysian weather
conditions in this study, but larger study is required
considering different weather locations. Since the size
of solar PV or collector is directly related to the solar
radiation, energy cost may vary with the location.
• The cost of solar energy as well as SOFC-based power
generation is still higher compared to the fossil fuel-
based system. Hence, incentive in the form of subsidy
from the government is needed.
Acknowledgments The authors would like to gratefully acknowl-
edge the financial support from the University of Malaya under the
High Impact Research MoE Grant UM.C/625/1/HIR/MoE/ENG/22
from the Ministry of Education Malaysia to consummate this
research. The authors also cordially acknowledge the grants UMRG
RP006G-13ICT and ERGS 53-02-03-1100.
References
Akikur RK, Saidur R, Ping HW, Ullah KR (2014) Performance
analysis of a co-generation system using solar energy and SOFC
technology. Energy Convers Manag 79:415–430. doi:10.1016/j.
enconman.2013.12.036
Al-Qattan A, ElSherbini A, Al-Ajmi K (2014) Solid oxide fuel cell
application in district cooling. J Power Sources 257:21–26
Becker WL, Braun RJ, Penev M, Melaina M (2012) Design and
technoeconomic performance analysis of a 1 MW solid oxide
fuel cell polygeneration system for combined production of heat,
hydrogen, and power. J Power Sources 200:34–44
Chen W, Hong X (2015) Design of effective subsidy policy to
develop green buildings: from the perspective of policy benefit.
Clean Technol Environ Policy 17:1029–1038. doi:10.1007/
s10098-014-0859-8
Chen JMP, Ni M (2014) Economic analysis of a solid oxide fuel cell
cogeneration/trigeneration system for hotels in Hong Kong.
Energy Build 75:160–169
Colpan CO (2009) Thermal modeling of solid oxide fuel cell based
biomass gasification systems. (Doctoral dissertation, Carleton
University Ottawa)
Cucchiella F, D’Adamo I (2015) Residential photovoltaic plant:
environmental and economical implications from renewable
support policies. Clean Technol Environ Policy. doi:10.1007/
s10098-015-0913-1
Cucchiella F, D’Adamo I, Gastaldi M (2015) Financial analysis for
investment and policy decisions in the renewable energy sector.
Clean Technol Environ Policy 17:887–904. doi:10.1007/s10098-
014-0839-z
Desideri U, Campana PE (2014) Analysis and comparison between a
concentrating solar and a photovoltaic power plant. Appl Energy
113:422–433
Duic N (2015) Is the success of clean energy guaranteed? Clean
Technol Environ Policy. doi:10.1007/s10098-015-0969-y
Gardner F (1997)Thermodynamic processes in solid oxide and other fuel
cells. Proc Inst Mech Eng Part A J Power Energy 211:367–380
Hossain F, Hasanuzzaman M, Rahim NA, Ping HW (2015) Impact of
renewable energy on rural electrification in Malaysia: a review.
Clean Technol Environ Policy 17:859–871. doi:10.1007/s10098-
014-0861-1
Ingwersen W, Garmestani A, Gonzalez M, Templeton J (2014) A
systems perspective on responses to climate change. Clean Technol
Environ Policy 16:719–730. doi:10.1007/s10098-012-0577-z
Kalinci Y, Hepbasli A, Dincer I (2015) Techno-economic analysis of
a stand-alone hybrid renewable energy system with hydrogen
production and storage options. Int J Hydrogen Energy
40:7652–7664. doi:10.1016/j.ijhydene.2014.10.147
Lamas J, Shimizu H, Matsumura E, Senda J (2013) Fuel consumption
analysis of a residential cogeneration system using a solid oxide
fuel cell with regulation of heat to power ratio. Int J Hydrogen
Energy 38:16338–16343
Mahlia TMI, Chan PL (2011) Life cycle cost analysis of fuel cell
based cogeneration system for residential application in
Malaysia. Renew Sustain Energy Rev 15:416–426
Mohammad Rozali N, Wan Alwi S, Manan Z, Klemes J, Hassan M
(2015) A process integration approach for design of hybrid
power systems with energy storage. Clean Technol Environ
Policy. doi:10.1007/s10098-015-0934-9
Naimaster E, Sleiti A (2013) Potential of SOFC CHP systems for
energy-efficient commercial buildings. Energy Build 61:153–160
Ngan MS, Tan CW (2012) Assessment of economic viability for PV/
wind/diesel hybrid energy system in southern Peninsular
Malaysia. Renew Sustain Energy Rev 16:634–647
Ni M, Leung MK, Leung DY (2006) A modeling study on
concentration overpotentials of a reversible solid oxide fuel
cell. J Power Sources 163:460–466
Ni M, Leung MK, Leung DY (2007a) Energy and exergy analysis of
hydrogen production by solid oxide steam electrolyzer plant. Int
J Hydrogen Energy 32:4648–4660
Ni M, Leung MK, Leung DY (2007b) Parametric study of solid oxide
fuel cell performance. Energy Convers Manag 48:1525–1535
Shezan SA, Saidur R, Ullah KR, Hossain A, Chong WT, Julai S
(2015) Feasibility analysis of a hybrid off-grid wind–DG-battery
energy system for the eco-tourism remote areas. Clean Technol
Environ Policy. doi:10.1007/s10098-015-0983-0
Solangi KH, Islam MR, Saidur R, Rahim NA, Fayaz H (2011) A
review on global solar energy policy. Renew Sustain Energy Rev
15:2149–2163
Tanaka T, Kamiko H, Bando T, Zaffirah A, Kakimoto N, Inui Y,
Maeda T (2014) Energetic analysis of SOFC co-generation
system integrated with EV charging station installed in multi-
family apartment. Int J Hydrogen Energy 39(10):5097–5104.
doi:10.1016/j.ijhydene.2014.01.073
Vance L, Eason T, Cabezas H (2015) Energy sustainability:
consumption, efficiency, and environmental impact. Clean
Technol Environ Policy. doi:10.1007/s10098-015-0932-y
Vialetto G, Rokni M (2015) Innovative household systems based on
solid oxide fuel cells for a northern European climate. Renew-
able Energy 78:146–156
R. K. Akikur et al.
123
Page 19
Xu H, Dang Z, Bai B-F (2012) Analysis of a 1 kW residential
combined heating and power system based on solid oxide fuel
cell. Appl Thermal Eng 50(1):1101–1110. doi:10.1016/j.applther
maleng.2012.07.004
Zink F, Lu Y, Schaefer L (2007) A solid oxide fuel cell system for
buildings. Energy Convers Manag 48:809–818
Zoulias EI, Lymberopoulos N (2007) Techno-economic analysis of
the integration of hydrogen energy technologies in renewable
energy-based stand-alone power systems. Renewable Energy
32:680–696. doi:10.1016/j.renene.2006.02.005
Economic feasibility analysis of a solar energy and solid oxide fuel cell-based…
123