+ All Categories
Home > Documents > ECONOMIC GROWTH AND THE BALANCE OF TRADE

ECONOMIC GROWTH AND THE BALANCE OF TRADE

Date post: 22-Mar-2022
Category:
Upload: others
View: 1 times
Download: 0 times
Share this document with a friend
29
Otemon Economic Studies, 3 (1970 ) ECONOMIC GROWTH AND THE BALANCE OF TRADE YOSHIHIRO T6YAMA I Introduction The first of the most outstanding features in the postwar Japanese econ- omy is, perhaps, its high growth. In the postwar world economy, economic development in defeated nations such as Japan, Germany, and Italy has been quicker than that in victorious countries such as the u. S. A., Britain, l| . and France. For some time after the war, West Germany's economic recon- struction and development was the focus of the world's attention and was called a “miracle reconstruction". But, since then, German economic growth has become stable, while Japan's has been accelerated more. Therefore, Ja- pan's high economic growth attracts the world's attention now. For example, The Economist of London published "special issues on Japan" one after another" )and watched her high economic growth with sur- prise. Following “Consider Japan" in 1962 and."Year of the Open Door- The Economist Reconsiders Japan ―■" in 1964, “The Risen Sun" in 1967 compared Japan's highly growing economy in recent" years to the “risen sun". In America, too√Time issued “a special on Japan" recently and said the 21st century would be the Japanese one. ^)Following this, JNews耀eeゐ’s spe- cial on Japan likened the Japanese economy t0 . the “rising sun" and warned that she had become a strong competitor for America.' In reality, the Japanese economy had.pulled breathlessly out of the *Associate Professor of Economic Policy, Otemon Gakuin University. 1)The Economist, September l and 8, 1962, November 28, 1964, May 27 and June 3, 1967, etc. . 2 )Herman Kahn says, "It would not be surprising if tlie 21st century turned out to be the Japanese century," in 'Toward the Japanese Century' in Time, March 2, 1970, p. 22. 3 )'Japan Salesman to the World' in Newsweek, March 9, 1970, p. 24 ff. There is an e χpression, 'Tell America to wake up and watch the Rising Sun.' In comparing the Japanese economy to the sun, the British magazine says the 'Risen,Sun,' while the American the 'Rising Sun.' This difference is interesting, for it is supposed to reflect the difference in both countries' economic status to the Japanese economy (1
Transcript

Otemon Economic Studies, 3 (1970 )

ECONOMIC GROWTH AND THE

BALANCE OF TRADE

YOSHIHIRO T6YAMA *

I Introduction

The first of the most outstanding features in the postwar Japanese econ-

omy is, perhaps, its high growth. In the postwar world economy, economic

development in defeated nations such as Japan, Germany, and Italy has

been quicker than that in victorious countries such as the u. S. A., Britain,l|          .

and France. For some time after the war, West Germany's economic recon-

struction and development was the focus of the world's attention and was

called a “miracle reconstruction". But, since then, German economic growth

has become stable, while Japan's has been accelerated more.  Therefore, Ja-

pan's high economic growth attracts the world's attention now.

For example, The Economist of London published "special issues on

Japan" one after another")and watched her high economic growth with sur-

prise. Following “Consider Japan" in 1962 and."Year of the Open Door-

The Economist Reconsiders Japan ―■" in 1964, “The Risen Sun" in 1967

compared Japan's highly growing economy in recent" years to the “risen sun".

In America, too√Time issued “a special on Japan" recently and said the

21st century would be the Japanese one. )̂Following this, JNews耀eeゐ’s spe-

cial on Japan likened the Japanese economy t0 . the “rising sun" and warned

that she had become a strong competitor for America.' )

In reality, the Japanese economy had.pulled breathlessly out of the

*Associate Professor of Economic Policy, Otemon Gakuin University.

1)The Economist, September l and 8, 1962, November 28, 1964, May 27 and June 3, 1967,

etc.  ,                          .

2)Herman Kahn says, "It would not be surprising if tlie 21st century turned out to be the

Japanese century," in 'Toward the Japanese Century' in Time, March 2, 1970, p. 22.

3)'Japan Salesman to the World' in Newsweek, March 9, 1970, p. 24 ff. There is an eχpression,

'Tell America to wake up and watch the Rising Sun.' In comparing the Japanese economy to

the sun, the British magazine says the 'Risen,Sun,' while the American the 'Rising Sun.' This

difference is interesting, for it is supposed to reflect the difference in both countries' economic

status to the Japanese economy ・

(1 )

66                YOSHIHIRO tOyama

rubble of 1945 to make one of the most e χciting and e χtraordinary sudden

forward leaps in the entire economic history of the world. It has raised  弛

international position steadily with its high growth power. In GNP, Japan

ranked 7th in the capitalist world in 1950, 6th in 1955, and 5th in 1960.

After that, she surpassed Britain in 1966, France in 1967, and West Ger-

many in 1968, to become second only to the U.S. in the free world, with

a GNP of 1167 billion (the U.S. total: $932 billion ). In this connection,

Japan's∧economic growth rate in real terms averaged 10.0 % over the past

two decades (from 1951 to 1969, the whole postwar period e χcept several

years which were supported by the special factors of reconstruction just after

the war ). Chronologically, the average in the 195O's べ1951-60 )was 8, 5%,

the estimated actual results in the 196O's (1961-70 )are ぐ11.4 %, and the

prospected value in the next 5 years (1971-75 )12.4 %." )So it is natural

that we should say the high growth power becomes fi χed in the Japanese

economy as the basis and tends to accelerate more and more 。

But the process of growth in the past was never even and there were

several breaks. When business becomes brisk and domestic economic activity

expands, imports of raw materials and fuel increase, while eχports of manu-

facturing goods decrease because of the increase in domestic demand, so the

balance of payments grows worse. The Japanese economy depends much on

foreign trade, but its gold and foreign exchange reserves are poor. So it be-

comes a major problem for it to cope with an e χternal deficit, and economic

growth is restricted by the “ceiling of the balance of payments". Then the

growth rate lessens and the high growth is broken temporarily. But the

accumulation of productive ヶcapacity in the process of the high growth con-

tributes to export e χpansion and import.decline in the process of the low

growth, and a favorable turn in the balance of payments by that enables the

business to become brisk again. Thus, the high growth starts again and the

accumulation of productive capacity makes rapid progress. In this way, the

Japanese economy has accumulated productive capacity every time it passes

through the process of business cycles, and the ceiling of the balance of

payments has been raised gradually. Such was the process of economic

1)By this accelerated high growth, Japanese national income per capita, still 19th in the free

world in 1968, is estimated to outstrip probably Britain and. West Germany to be 6th in

1975, to reach present America's level in 1980, and to be surely 2nd next to America in 1985

(By the middle term estimation and the long term prospect of the Japan Economic Research

Center. See the Nippon Keizai, September 2 and December 8, 1968 ).

(2 )

ECONOMIC GROWTH AND THE BALANCE OF TRADE      67

growth in postwar Japan. 1)

This requires that the analysis of the dynamic growth process in the

Japanese economy must be done in connection with the balance of payments.

In this article, the main attention is focused on this point and it is attempt-

ed to observe postwar Japan's economic growth in connection with the bal-

ance of payments and, above all, with the balance of trade. ^)Firstly, the

process of postwar Japan's economic growth is discussed in relation to the bal-

ance of payments changes ; secondly, the relationship between economic

growth and the balance of trade is e χamined, and the change in contents of

this relationship in recent times is noted ; and thirdly and lastly, problem

points in the future are referred to.

II Economic Growth and the Balance of Payments in Postwar Japan

Table l shows the high economic growth and its acceleration of the

postwar Japanese economy and Fig. 1 is its graph. Before the investigation

into the details of the economic growth, it is desirable to give some prelimi-

nary explanations of the table 。

Firstly, there are two kinds of years, fiscal and calendar, in Japanese

statistics. A Japanese fiscal year begins in April and ends in the ne χt

March. In 1951, the method of national income statistics by the Economic

Planning Agency was revised, and after that national income statistics have

been issued both in fiscal and calender years. Before that, in postwar

times, there was only one kind of statistics, in the fiscal year. But for

foreign readers, the calendar year is more understandable than the fiscal

which differs among nations, so the calendar year is used here 。

Secondly, the period' discussed here is after the 195O's. This is partly

because there are no statistics available based on the calendar year before・

1950 and partly because it is thought right to begin in this period when the

Japanese economy was restored to a normal stage after a transition stage of

confusion and reconstruction just after the war 。

Thirdly, the growth rate in question is not nominal but real. In post-

1)This forms a striking contrast to the British one. See Section V of this article for their

comparison・

2)Johnson's 'basic analytica equation' theorized the relationship between economic growth and the

balance of trade. See H. G. Johnson, International Trade and Economic Growth, London,

s1958, Chap. IV.

(3 )

68 YOSHIHIRO TOYAMA

Table l GNP in current and constant (1960 )dollars, and percentage

ratio to previous year, 1951 -1970

\                  (Billions of dollars)

ドAt current prices At constant prices in calendar year of 1960

ValuePercentage ratioto previous year

ValuePercentage ratioto previous year

1951

1952

1953

1954

1955

1956

1957

1958

1959

1960

1961

1962

1963

1964

1965

1966

1967

1968

1969("

1970(2)

14.58

16.81

19.35

21.65

23.68

26.41

30.75

31.50

35.54

42.52

51.66

・  57.95

65.63

77.17

84.73

97.59

115. 45

137.04

173.75

201. 22

115. ■},%

115.1

111.9

109.4

U1.5

116.4

102.4

112.8

119.6

121.5

112.2

113.3

117.6

iO9. 8

115. 2

118.3

118.7

118.5

115.8

19.31

21.38

22.92

24.40

26.69

28.91

32.24

33.41

36.84 づ

42.51

49.12

52.73

56.78

64.93

67.33

74.59

84.81

97.02

109.83

122. 02

110.1%

107.2

106.5

109.4

108.3

111.5

103.7

110.3

115.4

115.5

107.3

107.7

114.4

103.7

110.8

113.7

114.4

し  113.2

111.1

Note ■. (1)Estimate in fixal year.

(2 )Prospect in fiscal year.

Both were decided by the Cabinet Council on February 14, 1970.

Source : Economic Planning Agency, Annual Report on National Income Statistics.

The Nippon Keizai, February 14, 1970.

Fig. 1 Changes in real growth rate of GNP

1

55 5

Note See notes of Table l for 1969 and 1970.

war Japan, a rise in prices has been substantial, so the real one must be

taken to examine the ratio to the previous year. The real values in Table

('4 )

ECONOMIC GROWTH AND THE BALANCE OF TRADE

Fig. 2 Changes in postwar balance of payments (IMF base )

Note : Only 1946 is from September 1945 to December 1946.

Only 1970 is prospect in fiscal year by government. Others are

actual results in calendar year.

Source : Ministry of Finance, Monthly Bulletin of Statistics.

(5 )

69

一 一 一

70 YOSHIHIRO TOYAMA

1 are at constant prices in the :1960 calendar year.

Table 2 Changes in imports, e χports, and the trade balance

(IMF base, millions of dollars. A deficits)χ          I livir uaae, iiiimuua u ± u りiiai bj “UC 大八●ILSノ    ;

S・                                   ,

二 Exports Imports Trade balance

1951

1952

1953

1954

1955

1956

1957

1958

1959

1960

1961

1962

1963

1964

1965

1966

1967

1968

1969

1970山

1,354

1,289

■.1,258

1,611

2,006

2,482

2,854

2,870

3,408

3,978

4,149

・ 4, 861

5,391

6,702

8,333

9,638

10, 228

12, 751

15,720

18,800

1,645

1,701

2,050

2,041

2,061

2,613

3,256

2,500

3,047

3,711

4,707

4,459

5,557

6,328

6,432

7,366

9,070

10, 222

11,970

14,800

△ ・292

△ 413

△  792

△  429

△ 54

△  131

△  402

370

361

268

△  559

402

△  166

375‘

1,901

2,272

1,158

2,529

3,750

4,000

Note :

Source

(1) Prospect in fiscal year by government, February 14, 1970.

Ministry of Finance.

The ヤBank of Japan.  ’,

Fig. 2 shows changes in the balance of payments in postwar Japan

according・ to items. It has the calendar year, IMF base, and a billion dollars

as a imit. Table 2 shows changes h imports and e χports.

As found in these tables and figures, the postwar Japanese economy

has finished five trade cycles and is now in the upswing phase of the sixth.

In this period, the balance of payments has passed five cycles, too, and is now

on the rising curve of the siχth. Changes in both cycles have a close relation-

ship. To observe the process of postwar Japan's economic development in

relati)n to changes in the balance of payments, it is convenient to divide

the period by these cycles. There are various methods in detecting trade

(6 )

C' ‾

ECONOMIC GROWTH AND THE BALANCE OF TRADE 71

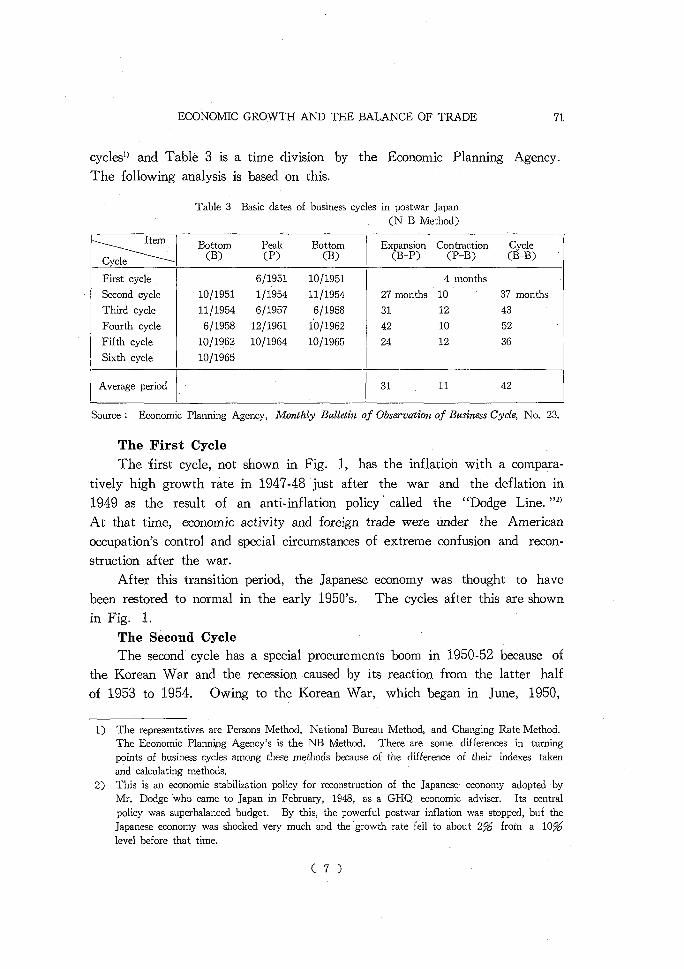
cycles" and Table 3 is a time division by the Economic Planning Agency.

The following analysis is based on this.

Table 3 Basic dates of business cycles in postwar Japan

(N B Method)

言ニ 、Bottom   Peak   Bottom(B )   (P )    (B )

Eχpansion Contraction  Cycle(B-P )  (P-B )  (B-B )

First cycle

Second cycle

Third cycle

Fourth cycle

Fifth cycle

Siχth cycle

6/1951 10/1951

10/1951  1/1954  11/1954

11/1954 6/1957  6/1958

6/1958 12/1961 10/1962

10/1962 10/1964  10/1965

10/1965

4 months

27 months 10     37 months

31     12     43

42     10     52     ヽ

24     12     36

Average period 31     n     42

Source : Economic Planning Agency, Monthly Bulletin of Observation of Business Cycle, No. 23.

The First Cycle

The first cycle, not shown in Fig. 1, has the inflation with a compara-

tively high growth rate in 1947-48 just after the war and the deflation in

1949 as 万the result of an anti-inflation policy ’ called the “Dodge Line. "^)

At that time, economic activity and foreign trade were under the American

occupation's control and special circumstances of e χtreme confusion and recon-

struction after the war.

After this transition period, the Japanese economy was thought to have

been restored to normal in the early 195O's. The cycles after this are shown

m Fig. 1.

The Second Cycle             ヽ

The second cycle has a special procurements boom in 1950-52 because of

the Korean War and the recession caused by its reaction from the latter half

of 1953 to 1954. Owing to the Korean War, which began in June, 1950,

1)The representatives are Persons Method, National Bureau Method, and Changing Rate Method.

The Economic Planning Agency's is the NB Method. There are some differences in turning

points of business cycles among these methods because of the difference of their inde χes taken

and calculating methods.

2)This is an economic stabilization policy for reconstruction of the Japanese ・ economy adopted by

Mr. Dodge who came to Japan in February, 1948, as a GHQ economic adviser. Its central

policy was superbalanced budget. By this, the powerful postwar inflation was stopped, but the

Japanese economy was shocked very much and the growth rate fell to about 2 % from a 10 %

level before that time.

(7 )

72 YOSHIHIRO TOYAMA

the Japanese economy recovered from the blow of the recession caused by the

“Dodge Line", getting back immediately to a remarkable increase in produc-

tion. The war changed the previous situation completely. Much of the

munition for the war was procured in Japan and this formed an American

demand for Japanese commodities (the so-called "special procurements").

Moreover, the advanced nations, an χious about the spread of the war, e χ-

panded their armaments, so their imports increased rapidly and the world

business activity became brisk. An increase in Japan's exports caused by

this special procurements and the world boom encouraged the e χpansion of

production, and the foreign currency inflow through the e χports enabled mass

imports of the raw materials and fuel required for the production expansion.

Thus, the rate of growth rose again in the early 195O's and the high

growth rate of over 10 %continued in 1950, 1951, and 1952.

But Japan's imports increased rapidly due to this remarkable growth,・

while the cease-fire in July, 1953, and the following quieting down of the

expansion fever of armaments resulted in the decline in overseas demands for

Japanese goods. Thus, Japan's eχports decreased rapidly. The result was a

large deficit in the balance of payments in 1953, the first drastic one in the

postwar period. The Japanese government met this difficulty with a tight

money policy starting in October, 1953 and the curtailed budget of 1954

called “a trillion budget", and tided over the crisis by drawing out foreign

cvirrency from IMF, a member of which she had become in 1953.

These measures took effect comparatively scxDn with the help of the

improvement in world business which began in the autumn of 1954. Japan's

economic growth rate fell in 1953 and:1954, and imports were stagnant in

1954 and 1955, but 6 χports increased steadily. Making this improvement

in the balance of payments a footing, the Japanese economy entered upon a

new stage of the high growth in the Showa 3O's. "

The Third Cycle

The third cycle has the boom in 1955-56 named “Zinmu Boom" and

the recession caused by its reaction from the latter half of 1957 to the first

half of 1958. The decade starting in 1955 is called the Showa 3O's in Japan.

From this time on, the Japanese economy is said to have entered into a

high growth period, and this economic development differs very much from

the old one.           ダ

1)Showa 30 is 1955.

(8 )

ECONOMIC GROWTH AND THE BALANCE OF TRADE        73

In 1955-56, America was in a 'boom never experienced before'. Under

this favorable influence, the world industrial production e χpanded smoothly

and kept high prosperity. So, in the eχternal phase, Japan's exports expand-

ed well, while her imports increased at a steady pace. Japan's foreign e χ-

change holdings increased to 1.5 billion dollars. In the internal phase, her

economic activity became brisk and e χceeded the prewar level in her overall

production and consumption with the help of this favorable condition in the

balance of payments. Moreover, it should be noted as a characteristic of

this period that equipment investment increased rapidly. It increased only

by 5.2 %per year on the average in the decade just after the war (1946-

55), but by 16.4 %in the next decade (1956-65 )and in the private sector

alone, by 18.5 % in the same period. This investment boom e χpanded

productive capacity on the one hand, and brought about the demand increase

on the other hand. ")Thus, there developed the so-called “Jinmu Boom". )̂

But this boom lasted only thirty -one months. The rapid increase in

equipment investment and the e χpansion )f production increased rapidly im-

ports of capital goods and raw materials. For this reason, the balance of

payments turned to red in 1957. Foreign currency reserves decreased drasti-

cally to a 0.5 billion dollar level at the end of that year. Thus, as a

countermeasure against the crisis in the balance of payments, the government

took the third tight money policy in the postwar period in March, 1957.

Then, this difficulty was overcome with business control and import cuts.

But the improvement in the balance of trade in this tightening period was

attained by import decline, 108 %and e χport increase, -8% (eχport decline,

8%). The latter worked as an obstacle to the improvement. The growth

rate fell drastically in 1958 due to the severe deflation policy. World

business was depressed, too, in the same year, so Japan's recession grew

worse.

The Fourth Cycle

The fourth cycle has the boom named とIwato Boom ” which covered the

period from the latter half of 1958 to 1961 and the recession caused by its

reaction in 1962. In 1958, Japan's exports increased little due to the world

recession but her imports decreased drastically for the tight money, and the

1)This is what Domar calls the “dual character of investment," that is, the effect of creating

productive capacity and the effect of creating effective demand.

2)This means the largest boom since the Zinmu era, which is the founding age of Japan.

(9 )

74 YOSHIHIRO TOYAMA

balance of trade showed the first substantial surplus in the postwar time

(Before 1957, it had shown a considerable deficit every year e χcept 1950

when it barely kept the balance ). Moreover, owing to the favorable turn

in world business in 1959, Japan's exports increased remarkably and her

economy reached immediately the high growth of a 10 % leveトagain.

Thus, there developed a boom on a large scale and in the long period of 42

months from the latter half of 1958 to 1961. This boom was named “Iwato

Boom" for it e χceeded the “Zimmu Boom. ”")It is a characteristic of this

boom that prices were comperatively stable in spite of the high growth.

It was also called a “volume boom. "

In the phase of the balance of payments, imports increased as a result

of the high growth. But import increase proceeded with caution because of

the eχperience of failure from an optimistic' view in the last boom period

and an overseas voice which asked f )r liberalization of trade. A surplus was

maintained in the overall balance as well as in the trade balance, and this

contributed to the accumulation of gold and foreign currency. This raised

the ceiling of the balance of payments and enabled the renewal and e χten-

sion of the boom. Meanwhile, the so-called “preventive tight money pol-

icy" was taken in 1959. This is said to be different from the traditional

business adjustment policy to cope with a deficit in the balance of payments.

But it is a preventive measure against the balance of payments crisis in

itself, so is of the same quality as other tight money policies in essence.

But in 1961, at the close of “Iwato Boom", imports increased rapidly

as a result of the long boom, while eχports showed only a little へincrease

because of the world recession and vigorous domestic demand. The trade

balance showed a large deficit and the overall balance recorded the largest

deficit in the postwar time. So the goverment took the tight money policy,

as usual, in July, 1961. The rate of increase in industrial production

against the corresponding month of the previous タyear was 21 %in the month

immediately before this tightening but was only o % in the month immediately

after removing it. At the same time, the import decrease accounted for

n% of the improvement in the balance of trade in this tightening period

and the e χport increase for 29 %. As a result, the growth rate fell in 1962,

while the balance of payments showed a substantial improvement.

The Fifth Cycle

1)The Iwato era is the mythological age before the Zinmu

(10 )

ECONOMIC GROWTH AND THE BALANCE OF TRADE       75

The fifth cycle has a boom in :1963-64 for over 24 months and the

recession in 1965. As this boom was called a “prosperity without an im-

pression of a boom", it was not so sensational as the previous two and there

was no common name for it。

Because of a comparatively small falling in the growth rate in 1962 and

the eχpansion of economy in :1963, imports increased again and the trade

balance showed a deficit in 1963. To cope with this difficulty, the tight

money policy was taken in March, 1964. Industrial production in the

month just before this tightening showed a 19 % increase against the corre-

sponding month of the previous year, but that in the month just after this

tightening period showed only a 9 %increase against the corresponding month

of the previous year. The contribution of the import decline and e χport

expansion to the improvement in the trade balance in this tightening period

was 76 %and 24 %,respectively 。

The year 1964 was a peculiar year. The trade balance improved al-

though the growth rate rose. It is said that that year had 'a boom in its

macro phase but a recession in its micro'. The overall inde χ of business

cycle")showed already a decline after the peak in December, 1963, but the

economic e χpansion as a whole was active and the growth rate was high.

At the same time, however, the trade balance took a favorable turn follow-

ing ah improvement in world business, and, especially, the better condition

of Japan's exports to America.

I  The effect of this tight money policy in 1964 appeared in the next

year. The growth rate fell sharply and the trade balance showed a substan-

tial surplus. But the recession, the most serious in the postwar period,

never recovered even after the tightening was removed. Thus, the govern-

merit gave up the balanced budget policy that they had adopted since the

"Dodge Line" and decided to take a business promotion policy by issuing a

national debt.            ,

I  The Sixth Cycle

The si χth cycle has had a boom since 1966 and it is now in its rising

phase. This boom began in October, 1965, and now (March, 1970 )is

in its 53rd month. It is the longest in the entire Japanese economic his-

1)This is made of such individual indexes as industrial production index, ■producers' shipments

index, producers' inventory inde χ, average amounts of issued bank note per month, loans and

discounts of all banks, and wholesale price index.

(11 )

76 YOSHIHIRO TOYAMA

tory. It is named "Izanagi Boom"" ’because it e χceeds the last "Iwato

Boom".   ・.                 ノ

In this rising phase, the balance of payments took a bad turn in 1967

due to the high growth in 1966-67 and the slowing of the world economic

growth, especially the stagnation of Japan's exports to America. Japan's gold

and foreign e χchange reserves dropped below 2 billion dollars at the end of

1967 (But the trade balance did not go into the red and showed a substantial

black as before, though the amount was reduced ). So the tight money

policy was taken as usual in September, 1967. But industrial production in

the month just before this tightening increased by 21 %against the corre-

sponding month of the previous year, and in the month just after this tight-

ening period by 17 %against the corresponding month of the previous year.

The falling was slight compared with the one in the tightening before last

(19 %down in 1961 )and that in last time (10 %down in 1964 ). It took

three -months in 1957 from the beginning of tightening to the turning point

of business, five months in 1961, and seven months,in 1964, but it didn't

reach a turning point even after eleven months in 1967. Moreover, the

improvement in the trade balance in this tightening period was attained 90 %

by import decline and 71 %by e χport increase. The contribution of e χport

increase to the improvement e χceeded that of import decline for the first

time. This forms an interesting contrast to the change in the tightening of

1957, 1961, and 1963, in which the latter exceeded the former.

Characteristic of this tightening are the weakened effects of the tight

money policy and the change in the process of improving 由e trade<balance.

The former is based on the folloing :(1 )enterprises have come to depend

less on banks; in other words, their self-financing capacity has eχpanded, (2)

the weight of demand items on which the tight money policy has an imme-

diate effect (equipment investment and inventory investment )has been lowered,

while the ones on which the policy has a less effect (private consumption,

private dwellings investment, and exports )has been raised ・The latter is the

change in the type of the improvement in the trade balance from the former

type by import decline to the new one by e χport increase. In this way, a

new course of development was opened - the trade balance has been im-

proved under the tight money policy, while the high growth has lasted

without a break.

1)The Izanagi era is before the Iwato.

(12 )

ECONOMIC GROWTH AND THE BALANCE OF TRADE       77

After the removal of the tight money policy, a new type of development

was formed, which had never been eχperienced in Japan―"the high growth

under the surplus in the balance of payments". In fact, the high growth

of 14.4%`and the balance of trade (the balance of payments)surplus of 1.1

billion dollars coexisted in 1968. Such a tendency was found in 1969, too,

and there is a good outlook that this wilトbe kept in the future.

Ill Relationship Between the Growth Rate and the Trade 、Balance

The fluctuations in business cycles or in economic growth in postwar Japan

have a close relationship with the ones in the balance of payments. So, this

will be further e χamined in this section. Firstly, by drawing a common

pattern from the si χ cycles in the last section, it will be made clear what

economic policy had been taken in common. Secondly, the relationship

between the growth rate and the balance of payments under that policy

will be e χamined. Thirdly and lastly, the change in that relationship in

recent times will be discussed.

I Economic Policy Which Gives Priority to International Equilib-

rium (over Domestic One )          ’・

The Japanese economy has 十finished five business cycles since the war,

and a common pattern can be seen in them. To sum up the description in

the last section, they are all, without exception, the repetition of such a

process as follows : business upswing ―deficit in the りbalance of payments-

taking of the tight money policy-business downswing ―improvement in the

balance of payments-removal of the tight money policy-business upswing

again. Namely, the upper and lower limits in `the fluctuations in Japan's

economic growth were ニbounded by the balance of payments, and turning

points in this frame are all based on a favorable or unfavorable turn in the

balance of payments. A deficit in the balance of payments was a characteristic

which showed “over heating" in business and a surplus showed room for an

economic e χpansion. The “ceiling of the balance of payments" was always

the main reason for tightening business and the largest factor in restricting

the economic growth.

These circumstances will be clarified in Fig. 3, which graphs changes

in the real growth rate and the trade balance together. This can be inter-

preted as showing the relationship between the growth rate and the balance

(13 )

78 YOSHIHIRO TOYAMA

of payments. The reasons are the following : (1)changes in the trade bal-

ance best reflect changes in the overall balance, and (2 )on the contrary,

other items' of balance (services, long-term capital, and short-term capital )

don't reflect the overalトbalance, because their trends are conspicuous and

their cyclicaトf!uctuations don't come to the surface (See Fig. 2).

・ Fig. 3 Changes in real growth rate of GNP, and increases and

decreases to previous year in trade balance%20 15 10 5

一 一55 56 57 58 59 60 61 62 63 64 65 66 67 68 69 70

There are falls in the growth rate in 1954, 1958, 1962 and 1965 in

Fig. 3.  These respectively ∇occurred, following the years 1953 。1957,

1961, and 1963, when the trade balance showed a large deficit. When

the balance of payments (the trade balance )took a serious turn as a result

of.the high growth, the tight money policy was taken to cope with it.

This policy proved effective after the “time lag of a year" and led to a fall

in the growth rate. As mentioned already, in the case of the trade balance

deficit in 1963, the tight 'money policy was taken in 1964, so its effect

appeared in ±965. ≒As for the trade balance deficit in 1967, the improve-

merit was realized without a fall in the growth rate in spite of the tight

money policy. This is different from previous occasions. This will be re-

ferred to later.   ・・             ……

< To summarize the above-mentioned from the point of economic policy,

operations of business adjustment policy in Japan have mainly aimed at cop-

ing with the<balance of payments deficits. Japan depends much on foreign

trade due to her poor domestic resources and is easily attacked by difficulties

over the balance of payments. For her, changes in the balance of pay-

4  ・

ments have been the most important measure in managing the economy and

the main factor in governing economic growth. The balance of payments

was red light for economic growth at one time レand green at another time.

(14 )

ECON 〔:〕MIC GROWTH AND THE BALANCE OF TRADE      79

Following the “stop" or “go" from the balance of payments, economic acti-

vities have moved on. This means international equilibrium has priority

over domestic; that is, the policy which gives prioirty to the former ove 「

the latter has been taken so far.

2 Trade-off Between the Growth Rate and the Trade Balance

As a result of economic policy which gives priority to international

equilibrium, there naturally eχists a regular relationship between the rate of

economic growth and the balance of trade. ,Namely, when business shows an

upward tendency and the growth rate rises, the trade balance ・ takes a bad

turn, and when business shows a downward tendency and the growth rate

lowers, the trade balance takes a good turn (See Fig. 3. After 1965,

however, this formality can not be applied and it will be discussed in the

next section )。

This in detail is as follows. In a boom, the domestic economic activity

rises and imports of capital goods for equipment investment and `of raw mate-

rials for eχpanded production increase, while e χports increase little because

export goods are used at home for the active domestic demand. So, the

trade balance takes a bad turn. In a recession, the opposite phenomenon arisen.

Imports decrease because of the depressed domestic ゛ economic activity, while

exports increase due to the phenomenon called “eχport drive", which is to seek

a market for goods in foreign countries because of the declined domestic

demand. As a result, the trade balance improves. Consequently, there eχists

a trade-off relation")between the economic growth rate and the trade balance.

To further examine this, it will be better to divide changes in the

trade balance in Fig. 3 into its components, changes in imports and exports.

Table 4 and Fig. 4 show together the rate of increase, and decrease to the

previous year in real GNP, private capital formation 丿 and imports. As is

clear on the graph, these three fluctuations are almost the same in direction

and they become larger in order of GNP, imports, and private capital

1),Among relations of this kind, the most famous one would be a trade-off between the rate of

unemployment and prices and wages, that is, the so-called “Phillips curve." It means : there

can be found empirically a counter-correlation between the rate of unemployment and the rate

of increase in monetary wages, and the rate of increase in prices has a close correlation to the

rate of increase in monetary wages, so there is a trade-off relation (alternative between objec-

tives)between maintenance of a low rate of unemployment and the stabilization in prices.

2)Private capital formation = private equipment investment + private inventory investment =gross

private capital formation - dwellings investment 。

(15 )

80

Table 4

YOSHIHIRO TOYAMA

Percentage ratio to previous year of Japan's private capital formation,

imports, exports, and world industrial production

万 万レ Private 山capitalformation

Imports ExportsWorld

industrialproduction

1952

1953

1954

1955

1956

1957

1958

1959

1960

1961

1962

1963

1964

1965

1966

1967

1968

1969

1970

100.1

100.8

110.4

105.2

155.4

162.2

65.0

129.9

148.2

149.8

87.9

107.3

123.2

85.3

117.7

145.9

122.4

125.3(2)

115.0"'

102.8

120.5

99.6

101.0

126.8

124.6

76.8

121.9

121.8

126.8

94.7

124.6

113.9

101.7

114.5

123.1

112.7

117.1

117.5")

95.2

97.6

128.1

124.5

123.7

115.0

100.6

118.8

117.0

104.1

117.2

110.9

124.3

124.3

115.7

106.1

124.7

123. 3

114.6(=)

102.5

108.9

100.0

110.4

105.3

103.0

97.0

110.0

107.3

103.4

107.3

105.3

108.0

106.7

106.9

102.4

106.9

Note

Source

(l )Private capital formation = private equipment investment + private inventory investment.

(2 )Estimate in fiscal year.

(3 )Prospect in fiscal year.

Economic Planing Agency ・

Ministry of Finance.

U. N., Monthly Bulletin of Statistics.

formation. "

From the same direction of the changes 丿it is clear that the increase

and decrease in imports depend on the rise and fall in GNP, especially on

those in private capital formation. From the difference in the amplitude,

the following is to be understood : when GNP increases, imports increase

more than it, and private capital formation increases still more. 0n the

1)The fluctuations of gross domestic fi χed capital formation are the closest to those of imports,

those of gross private fixed capital formation are a little larger than those of

imports, and those of

private capital formation are the largest, though these three fluctuations are almost the same in

direction. For her raw materials, Japan depends much on imports 、so her rate of inventory

investment to national income is higher than that of foreign countries. This is one of the

factors which make her business fluctuations larger 。

(16 )

ECONOMIC GROWTH AND THE BALANCE OF TRADE

Fig. 4 Changes to previous year in real GNP, private capital formation,

and imports                     、、

1952 53 54 55 56 57 58 59 60 61 62 63 64 65 66 67 68 69 70

(17 )

81

82 YOSHIHIRO TOYAMA

contrary, when GNP decreases, imports decrease more than it, and private

capital formation decreases even more. The reason for this is as follows :

private capital formation is the total of private equipment investment and

inventory investment, but these (especially the latter )are the major factor

of business fluctuations, while imports involve such business stabilizadon

factor as consumer goods, and, moreover, GNP involves the income of

agriculture and service industry which do not have much relation with

business fluctuations and foreign trade. In short, the increase and decrease

k ・ij  ・      ’    へin private capital formation, as a leading factor, bring about changes in

imports and GNP.               ・

Fig. 5 compares the change rate to the previous year of Japan's e χports

Fig. 5 Changes to previous year in Japan's l exports and world industrial

production                J    ス      ヽト

%30

20

10

0

10

1952 53 54 55 56 57 58 59 60 61 62 63 64 65 66 67 68 69 70

with that of world industrial production. From the same direction of the

changeSj it is clear that Japan's exports depend on foreign demand for Japa-

nese goods, that is, on world business fluctuations (Strictly speaking, analysis

according to e χport markets, above all, in relation to American business,

must be done, but it will not be gone into now). The amplitude of Japan's

exports is larger than that of world industrial production but the whole

fluctuations of the former are above those of the latter. This means the share

of Japan's exports in world trade becomes larger.

As above-mentioned, Japan's imports depend on her economic growth and

her eχports on foreign へincome growth. At this juncture, supposing income-

elasticity of import demand is almost constant, the higher the ' economic

(18)

ECONOMIC GROWTH AND THE BALANCE OF TRADE       83l                   ●   心ゝ・

growth rate is, the more the imports increase, ・so the deficit in the trade

balance becomes larger unless e χports increase still more.  So there eχists a

trade-off relation between the economic growth rate and the trade balance.

As shown in Fig. 3, it is true that this relation can be found in.past data,

and such a thinking method has been generally accepted by the policy

authorities and many others. But there are two points to be considered.

The one is the relationship between past data and economic policy, and the

other is the assumption that income-elasticity of import demand is constant.

First, past data are the product of a special economic policy, so the

same result and relationship are not necessarily found under a different policy.

Past data shown in Fig. 3 are the result of a policy which gives priority to

international equilibrium as already mentioned in the last section. When

the growth rate rises and the trade balance shows a bad turn, the government

tries hard to keep down economic growth consciously by the tight money

policy to improve the trade balance. When the trade balance takes a good

turn, the tight money policy is removed and economic growth rises again.

As a result of this policy, it is naturaトthat there should e χist a trade-off

relation between the growth rate and the trade balance. But it is difficult

to say this relationship necessarily exists in theory between the two. It

would be more realistic to regard it as a product of a special policy. The

high growth under a surplus in the trade balance in recent times shows this

trade-off relation is not necessary.

Second, if income-elasticity of import demand is actually constant, the

rate of increase of imports will be larger and the trade balance will grow

worse as the Japanese economic growth rate rises. But this is a matter in a

short term, and another action will come about in a long term. An in-

crease in equipment investment which raises the growth rate will bring about

an increase in capital goods import in a short term, but it will encourage

technical progress and raise productivity in a long term. This process will

increase the self-supply capacity of items which Japan has previously been

forced to import for technical reasons, will increase the domestic supply ca-

pacity of import substitute goods and e χports, and will strengthen her in-

ternational competitive power, ")and so will work favorably on the trade

balance. Thus, the trade balance will be improved (increase in the black or

1)This may be said to be the dual character of equipment investment in the phase of trade -

effect of substituting imports and effect of promoting exports.

(19 )

84                 YOSHIHIRO TOYAMA

decrease in the red). The Japcinese economy in the Showa 40's (after 1965)

is in just such a state. ")This will be analyzed next.

3 Coexistence of High Growth and Trade Balance Surplus

For a long time in postwar Japan, business was ll judged to have been

overheated or overrisen by a balance of payments deficit, and a favorable or

an unfavorable turn in business was related to a surplus or a deficit in the

balance of payments. The trade-off relation between the growth rate and the

balance of payments by this policy which gave priority to international equi-

librium was changed entirely as soon as it was the Showa 4O's (ten years

starting in 1965). In the Showa 3O's (a decade starting in 1955), when a

bcmm lasted two years or more, the balance of payments always showed a

deficit and growth was broken. But, in the Showa 4O's, the black basis in

the balance of payments has been fi χed in the Japanese economy and there

has coeχisted the high growth and the balance of payments (balance of trade)

surplus。

To e χamine this important and revolutionary change, it is good to be-

gin with surveying the changes in the balance of payments in the past

according to its items (See Fig. 2). They reflect the changes in the eco-

nomic structure and have a characteristic of each age.

Until:1950 in the postwar period, the transferred dollar income by the

American economic aid supported the balance of payments surplus. Until

1955 the special procurements income in the Korean War did. Until 1960

the trade balance showed a little surplus and the current balance kept the

balance for the most part. After thatレthe Japanese economy entered into a

high growth period, and until く1964 a new pattern appeared in which capital

inflow covered e χpanding deficits in services. But before and after :1964, cir-

cumstances changed entirely. Due to a remarkable increase in e χports, the

trade balance has kept a substantial surplus (before 1964 the yearly surplus

was 4 hundred million dollars at most, but from 1965 to 1969 its average

reached 2 billion dollars), and it has kept the current balance in surplus,

covering the e χpanding deficits in services and transfers。

The most outstanding characteristic after 1965 is the change in the trade

balance basis. (1)The item leading the balance of payments to the black

1)The situation in Britain immediately after World War II was just the opposite. For this, see

the last section of this article.

(20 )

ECONOMIC GROWTH AND THE BALANCE OF TRADE      85

changed from the capital balance to the trade balance, (2 )the process im-

proving the trade balance changed from the old pattern of import decrease to

a new one of e χport increase. The significance of these two changes in

the balance of payments to economic growth is important. (1)The factor

in trade to interrupt growth has ceased to e χist, and, moreover, (2)trade

has become a positive factor in supporting the high growth. Thus, the rela-

tionship between the trade balance and the growth rate changed from the

old pattern of “trade-off" to a new one of “coexistence".

The new pattern, “economy maintains a boom, a high growth, and, at

the same time, eχports increase more than imports", seems to be being fi χed

in the Japanese economy. This is, in a word, the accumulation of equip-

merit investment in the high growth period of 、the Showa 30's has borne

fruit to raise productivity in the Showa 4O's. The following are noticed :

domestic self-supply of ,imported items, strengthened international competitive

power of eχports, and a change from the old pattern of development, "eχ-

port increase →economic growth" to a new one, "economic gr )wth ―> eχport

increase". The third of them is to be discussed in detail ne χt: ・

The relationship between economic growth and e χports in Japan will be

explained in Fig. 6. In the beginning,.when exports increase √real income

Fig. 6 Relationship between economic growth and exports

increases and the capacity to save e χpands, so it becomes one of the factors

in increasing equipment investment. Moreover, an increase in exports im-

plies expansion of the market, and this stimulates an investment will on

(21 )

86                 YOSHIHIRO TOYAMA

the one hand. It requires mass production and promotes development of a

more effective technique of production on the other hand. Thus, it works

as a factor to accelerate the high growth (effect of e χports on supporting

demand, that is, “e χport increase →high growth" ).

In the past, import requirements increased rapidly as the growth rate

rose, and this led to a bad turn in the balance of payments and an interrup-

tion of the high growth. But the high growth supported by active equip-

ment investment promoted further industrialization and made an advancement

to a higher stage of industrial structure. ・ The results are as follows : (1 )

A domestic self-supply capacity of industrial goods which had been imported

so far was e χpanded rapidly, and imports declined greatly 丿 At the same

time, domestic demand increased so much that it contributed to the e χ-

pansion of domestic business scale. Further industrialization has raised the

supply capacity of e χisting e χport industries through an increase in capital and

equipment, and led to development of new e χports and new export industries.

(2 )Industrialization in the Q χport structure has been promoted. Because

income-elasticity of demand for industrial goods is larger than that for food

and raw materials, income-elasticity of foreign demands for Japan's exports

has been raised. In reality, this 出ange in the e χport structure is matched

to the world trade tendency, in which the weight of 、capital intensified

goods becomes larger. (3) Productivity of e χport industries was raised 。

■・-                            ●

This absorbed a wage increase, kept costs down, and contributed to a reduc-

tion or stabilization in export prices.

To sum up the above-mentioned, further industrialization of the Japanese

economy brought about べ1 )the marginal propensity to imports <the mar-

ginal propensity t )eχports, (2 )a change in the e χport structure along the

direction of development in world trade, and (3 )strengthening of international

competitive power. Further industrial izat ion is, however, to be realized by

economic’grwoth,-so economic growth has been linked with an export increase

through ・further industrialization (effect of economic growth on promoting

export, that is, “high growth →export increase" ).Moreover, the Japanese

heavy industry is younger than that of Europe and America, so it has more

room for development than the latter. .Likewise, stability and durability of

the “good cycle" of the high growth and e χport increase are also considered

1)The assumption, "income-elasticity of import demand is constant," in the last section is reversed

by this fact.

(22 )

much larger.

ECONOMIC GROWTH AND THE BALANCE OF TRADE

IV Problem Points in the Future

87

The development of the postwar Japanese economy,' in terms of periods,

is as follows : negative development supported by special factors of recon-

struction demand in the Showa 2O's, active development with the high growth

supported by vigorous equipment investment in the Showa 30's, and ideal

development through a good cycle with the high growth released from

restriction of the balance of payments difficulties  ≒ the Showa 4O's. The

upswing of this business cycle (the si χth cycle), having lasted 53 months as

of March, 1970, is the longest record of a boom not only in the postwar

period but in the prewar. The factor supporting this boom is a favorable

balance of payments led by e χport increase. A surplus in the balance of

payments is no longer a passing phenomenon but seems to have been fi χed in

our economy as a basis. Such a view is becoming more and more popular

in Japan. Coe χistence of the high growth with the balance of payments

surplus is being accepted as an e χample , symbolizing a physical improvement

in the Japanese economy, not simply as a passing phenomenon of good luck.

It may be said that development of this new type is the most desirable

condition of economy for Japan, but it can not be said that there are no prob-

lems. Some new problems arise and ask for new policies. But a needful

revolution in a policy view has made little progress 。

It is certain that the "ceiling of the balance of payments" has been

raised and that the balance of payments seems to be no longer a restrictive

factor to economic growth. But it is e χpected that a labor shortage and

a rise in prices will become new restrictive factors in the future. First, on

the labor shortage. “Rate of economic growth = rate of increase in labor

force 十rate of growth in labor productivity. "")So the restrictive influence

of an eχpected labor shortage in the future is serious ・and the role of growth

in productivity as a factor supporting economic growth is very important.

In the case of Japan, however, her labor productivity has been considerably

lower than that of Europe and America as shown in the gap between her

1)This is what Harrod calls the “natural rate of growth," Gn =牛

十牛 (L is labor force

ゴ こa given average wage “nd y is labor productivity under full employment of that labor

(23 )

88                 YOSHIHIRO TOYAMA

GNP and her national income per capita, so it may be said that room for

raising productivity is much larger. This is supported by the fact, as men-

tioned in the last section, that the Japanese heavy industry is still young

and there is plenty of room for development by building up the equipment

and raising the technical level. Such measures as the following must be

promoted actively: efficient allocation of labor force (promotion of a labor

movement from low productive sectors of the primary and the third industry

to a high productive sector of the secondary industry and, in the 十secondary

industry, from the light industry to the heavy industry )and promotion of

rationalizing or labor saving investment 。

Second, a rise in prices, connected with an increase in wages resulting

from that labor shortage, will be taken here in relation to the growth rate

and the balance of trade which are the theme of this article. It can'f be

discussed briefly here whether there is 丿an immediate connection between the

growth rate and a rise in prices. Some countries like Japan have a high

growth rate and rapidly rising prices, while some like West Germany make

a considerably high growth rate and stable prices compatible, and some may

suffer from rapidly rising prices despite a low growth rate. Consequently it

can't be said that there is an immediate trade-off relation between the growth

rate and a rise in prices. But when the balance of trade intervenes between

them, there comes into e χistence a clear trade-off relation, namely, high

growth →increase in e χports→substantial surplus in the balance of trade-*

excess of foreign currency うe χcess of domestic liquidity →rise in prices. To

make prices stable, therefore, the growth rate must be kept down, and so a

rise in prices becomes a restrictive factor to economic growth 。

In a high growth economy with a surplus in the balance of payments,

its domestic policy for price stabilization has a relation with its e χternal

policy because of the responsibility of surplus nati )n. First, there are such

measxires as following : gradual removal of various residual quantitative re-

strictions for imports, a substantial expansion of present quotas for imports,

promotion of lowering tariffs, alleviation of non-tariff barriers, ")active devel-

opment and import of raw materials, etc. These will lead to an expanded

equilibrium of the balance of trade through an increase in imports and, at

1)For e χample, lowering of import deposit rate, elasticizing of the method of standard import

settlement, removal of domestic tax for import control (as the commodity tax for万automobiles

according to exhaust volume), etc.

(24 )

ECONOMIC GROWTH AND THE BALANCE OF TRADE 89

the same time, to a fall in prices through lowered import prices. It requires

a change 鋤Japan's policy view from the old g χport-for-eχport principle to

the new one making much of imports, that is, from the old principle which

gives priority to international equilibrium to the new one which attaches■         I  l  j

importance to domestic equilibrium.       /

Another direction of policy is the raising of the e χchange rate. ")It

will, in 止e e χ.ternal phase, lead the\balance of trade surplus to equilibrium

through an increase in imports and a decline in e χports, and, in the internal

phase, contribute to a stabilization in prices by lowering import prices.

A raising of the e χchange rate is just a rare cure-all countermeasure that

attains three policy objectives -the high growth, the balance of trade equilib-

rium, and stabilization in prices 一at one time. This is one of the reasons why

the upvaluation of the Japanese yen has suddenly been noticed at home and

abroard in recent times. It must be noticed that a raising of the exchange

rate is|one of the basic price policies m the economy in which an e χcess

faccumulation of foreign currency brings about inflation. Therefore, the

effect of the raising of the e χchange rate on a fall in domestic prices must

not be passed if it arises from responsibility of the surplus nation. 2)

But upvaluation of the Japanese yen would have too many problems and give

too much shock in the following points : “Can price rising be controlled only

by solving an e χcess accumulation of foreign currency?", "Is the present

reserve of foreign currency (3 billion and 868 million dollars at the end of

this March )enough for an expanded economic basis?",'' "How good is the

1)There are Mr. Harrod's and Mr. Meade's studies about policy standards for a rational international

economic order when world countries (two countries model in their e χample )are both in domestic

and internati )nal disequilibrium. Both studies have four cases, and in the case of a domestic

inflation and a capital balance surplus (Harrod's )or an economic boom and an e χternal surplus

(Meade's ), the policy to be taken is a raising of factor rewards and the e χchange rate. R. F.

Harrod, International Economics, .1949, Chap. 7. J. E. Meade, The Balance of Payments,

1951, Part 4 (or p. 117 ).

2)West Germany, suffering from an excess accumulation of foreign currency and inflation, raised

the mark by 9. 29%on October 27, 1969, but raised the bank rate from % %to 7.5 % ,the

highest level in the postwar period, on March 9, 1970. This shows that the raising of the

exchange rate is never a cure-all. In this case, the raising of the mark seems not to have had

an expected effect and ended in failure.

3)Recently the Government said 5 billion dollars would be right. The reason is that it is sound

to hold payments equal to one-third of the imports in a year (14.8 billion dollars in the 1970

calendar year by estimation of the Government ). But this has no theoretical ground. In this

connection, the percentage ratio of the foreign currency reserves to yearly imports at the end of

January was Italy 35 % ,France and Belgium 30 ‰West Germany '& % ,but Japan only

24.2%.

(25 )

90                YOSHIHIRO TOYAMA

ability of Japan's export industries without the government's special treatments? ”

It would be considered better to solve this by import promotions with only

a price of gradual and partial adjustment rather than by upvaluation with a

one-stroke and overall blow 。

There are many merits in import promotions. First, to lighten and

abolish import controls is along the international tendency of trade liberaliza-

tion and is also desirable from the viewpoint of international co-operation.

Second; the important task hereafter is to increase the social overhead capital

which has been left disproportionately poor.as compared with the national eco-

nomic power because of the traditional policy of giving priority to international

equilibrium. An increase in social investment for this would decrease e χports,

increase imports, and lead to e χternal equilibrium. At the same time, it

would strengthen Japan's economic constitution and make people's lives richer.

Third, though the real cause of price rising is not clear, much would be

solved by an increase in imports of consumer goods which have been controlled

by residual quantitative restriction for imports. Moreover, Japan's price policy

has so far been to control aggregate demand, but it would be suitable

only when there is no room for e χpansion of supply capaeity. Today the price

rise of those goods of which the supply capacity is insufficient is substantial, "

so the price policy must be to increase the supply potential by an increase in

equipment investment. Up to the present, the standard for judging whether

the equipment investment was overheating or not was the balance of payments

deficits, but, at this stage of coeχistence of the high growth with the

balance of payments surplus, it must be the relationship between supply and

demand of the goods concerned. ,To control the aggregate demand to check

price rising would have an opposite effect (a rise in prices caused by stagnant

supply and unimproved productivity)in the long term. This, in the Japanese

economic development, will be clarified by the remarkable increase in equipment

investment mentioned in the last section. This will be, in the next section,

further illustrated in a British economic stagnation caused by controlling its

aggregate demand. An e χpansion of supply capacity as a policy against a

price rise and an increase in equipment investment due to that will increase

1)Prices of all goods and services 、are not rising equally・ Prices of consumer goods and services

whose supply capacity has increased little show a substantial rise, but wholesale prices whose

major components are prices of producer and capital goods (their supply capacity increased

much )show only a little rise, and durable consumer goods like television sets and cars show

little increase in prices also。

(26 )

ECONOMIC GROWTH AND THE BALANCE OF TRADE 91

imports and decrease e χports.

Thus, mitigation or abolition of import restrictions by the- trade policy

based on a new idea, would be by far better for the ,stabilization of the

Japanese economy and the leveling -up of her people's life, and be a more effec-

tive and realistic policy for raising her ecoinomic efficiency. To cope with

a rise in consumer's prices and an increase in foreign currency, now is the

time to establish a trade policy with a new idea free from the traditional

one. "

The above-mentioned is related only with the point at issue in this

article. There are many other problems to e χamine ; for eχample, problems

of improvement in the quality of growth (handicapped social welfare, deficiency

of social overhead capital, policies for environmental disruption, etc.)and

problems of the balance of payments e χcept the trade balance (expanding

deficits in services, relatively low level of gold and foreign e χchange reserves

compared with the economic scale, etc. ). Here they are only mentioned,

not discussed in detail.

V Conclusion

As above mentioned, economic growth, on the one hand, increases im-

ports of raw materials, fuel, capital goods, and consumer goods, decreases

exports by using e χport goods in the domestic market, and makes the

balance of payments deficits. At the same time, it increases eχports by

raising productivity of the domestic industries or strengthening their international

competitive power, decreases imports by e χpanding their domestic supply

capacity, and improves the balance of payments. Moreover, economic growth

makes an advancement to a higher stage of industrialization in its process,

1)The above is mentioned from the standpoint of an alternative of an abolition of import restrictions

or a raising of the e χchange rate. But there can te a combination of the two, of course. Strictly

speaking, it would call for calculating the contribution of import restrictions and comperative

moderation in the exchange rate to the balance of payments surplus and for considering the weight

of the two policies according to the result of the calculation. As a method to mitigate the

shock from the raising of the e χchange rate to import industies and to avoid an evil from specula-

tion, there is a raising of the eχchange rate not by the whole ratio needed at once. but bit by

bit, which Mr. Miyata calls “crawling peg" (cf. his thesis in this review). He says upvaluation

of the yen must be done bit by bit regularly through a year within the ratio of the cost per

annum of financing the yen which foreigners have to pay. As a matter of fact, it will be the

most effective and feasible policy to make mitigation or abolition of import restrictions the first

and complement it by raising the e χchange rate bit by bit 。

(27 ・)

92                YOSHIHIRO TOYAMA

changes the import and e χport structure through that process, and has an

effect on the volume of imports and e χports. So, to make above points clearer,

it will be wise to compare Japan and Britain. Britain has many similar points

to Japan's economic and trade structure, but forms a striking contrast in

relation to economic growth and the trade balance 。

Economic policy which gives priority to international equilibrium in Showa

3O's Japan is the same in essence as the “stop-go" policy through postwar

Britain. In both countries, economic activity has followed “stop" or “go"

from the balance of payments. But an important different point is as fol-

lows : being interrupted by the balance of payments deficits, the Japanese

economy has made a considerably high growth through the whole period, but

the British economy could not get out of the low growth. The following

facts form a sharp contrast : the high growth of the Japanese economy has

been supported by the high rate of investment and raised the “ceiling of the

balance of payments" through the advancement to a higher stage of indus-

trialization and a growth in productivity, while Britain's economic growth has

been supported rather by consumption and never raised the “ceiling of the

balance of payments. " As already mentioned, in the case of Japan, an in-

crease in equipment investment in the high growth process led, in a short

term, to a remarkable increase in imports and worked upon the trade balance

unfavorably, but, in a long term, raised the domestic supply potential of

import substitutes and exports and strengthened the international competitive

power to work favorably upon the trade balance through the e χpansion of

productive capacity and technical advancement. But, in the case of Britain,

due to the low rate of investment, an increase in exports cut down the

supply of capital goods available for domestic use and, as a result of the

principle which gave priority to e χport and foreign investment, modernization of

domestic machinery and equipment was delayed, and, thus, the basis of the

long -term development was spoiled.

As, the main causes of the low economic growth in Britain, once this

writer pointed.out the following : the low rate of increase in the labor force,

finishing of the labor movement from agriculture to industry, the low

rate of equipment investment, the wrong investment policy directed at con-

sumption and armaments, too heavy a burden of armaments for prestige,

national character, etc. ")When Mr. Alan Day, professor of London Uni-

1)By the same writer, "Problems of the Low Rate of Growth in the British Economy", in

Journal of Economics of Kwansei Gakuin University, October, 1962.

(28. )

ECONOMIC GROWTH AND THE BALANCE OF TRADE       93

ersity, lectured on the theme "The Future of the British Economy" in

Fukuoka, Japan, on October 6, 1969, he also indicated the same points as

the author's. ")The opposite of these restrictive factors to Britain's economic

growth pointed out by the two are the very factors accounting for the high

growth of the Japanese economy.

1)In the “Nippon Keizai", October 7, 1969.

Namely, he pointed out the following as restrictive factors to Britain's economic growth : (1 )

research and investment for the sake of national prestige rather than for practical uses, say,

those for atomic power and aircraft, (2 )little increase in the labor force and labor input in

industry, and (3 )the low rate of fi χed capital formation. Moreover, he added the ne χt two

points the attitude of capital and labor symbolized in frequent strikes, and a national

character which ■gave priority to a comfotable life now rather than higher income later.

Concerning the point at issue of this article, he also emphasized that there was no necessary

relationship between the rate of growth and the balance of payments 。

(29 )


Recommended