35
| Date post: | 18-Dec-2015 |
| Category: |
Documents |
| Upload: | holly-wood |
| View: | 213 times |
| Download: | 0 times |
Economic GrowthCHAPTER9
EYE ONS
Economic growth rate Real GDP per personClassical growth theory Rule of 70Neoclassical growth theory Property rightsNew growth theory Labor productivityMalthusian theory Economic freedom
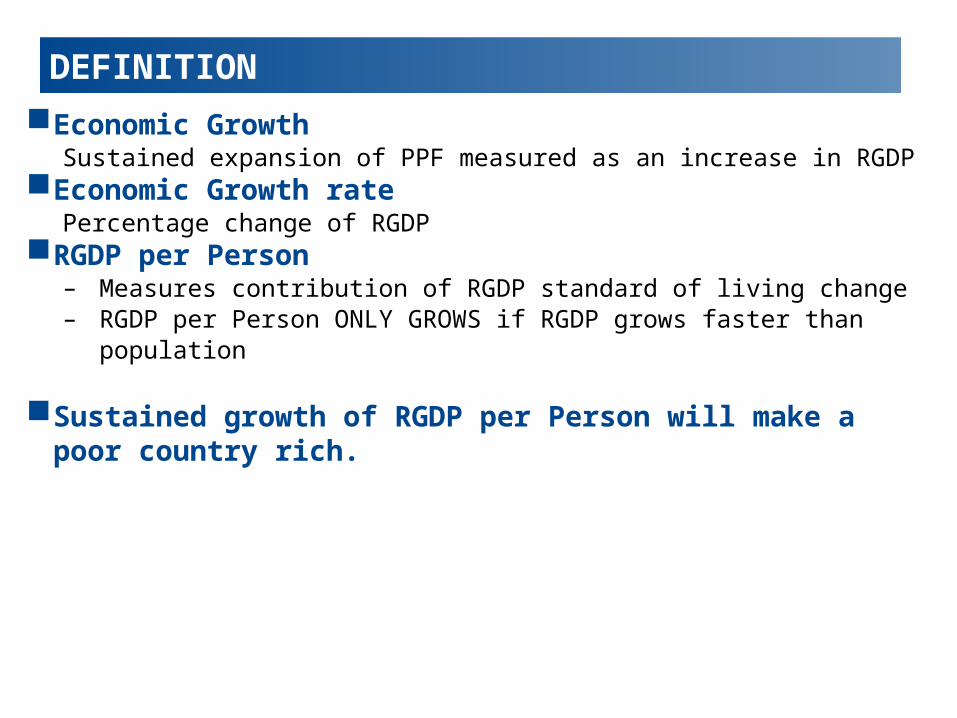
DEFINITION
Economic GrowthSustained expansion of PPF measured as an increase in RGDP
Economic Growth ratePercentage change of RGDP
RGDP per Person– Measures contribution of RGDP standard of living change– RGDP per Person ONLY GROWS if RGDP grows faster than
population
Sustained growth of RGDP per Person will make a poor country rich.
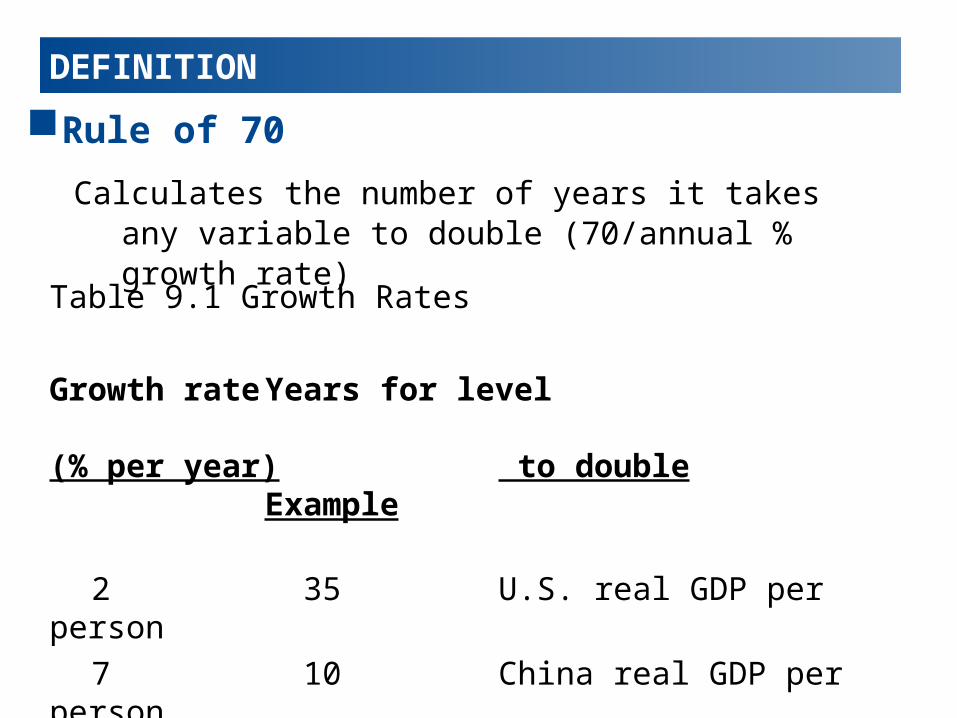
DEFINITION
Rule of 70
Calculates the number of years it takes any variable to double (70/annual % growth rate)
Table 9.1 Growth Rates
Growth rate Years for level(% per year) to double Example
2 35 U.S. real GDP per person
7 10 China real GDP per person
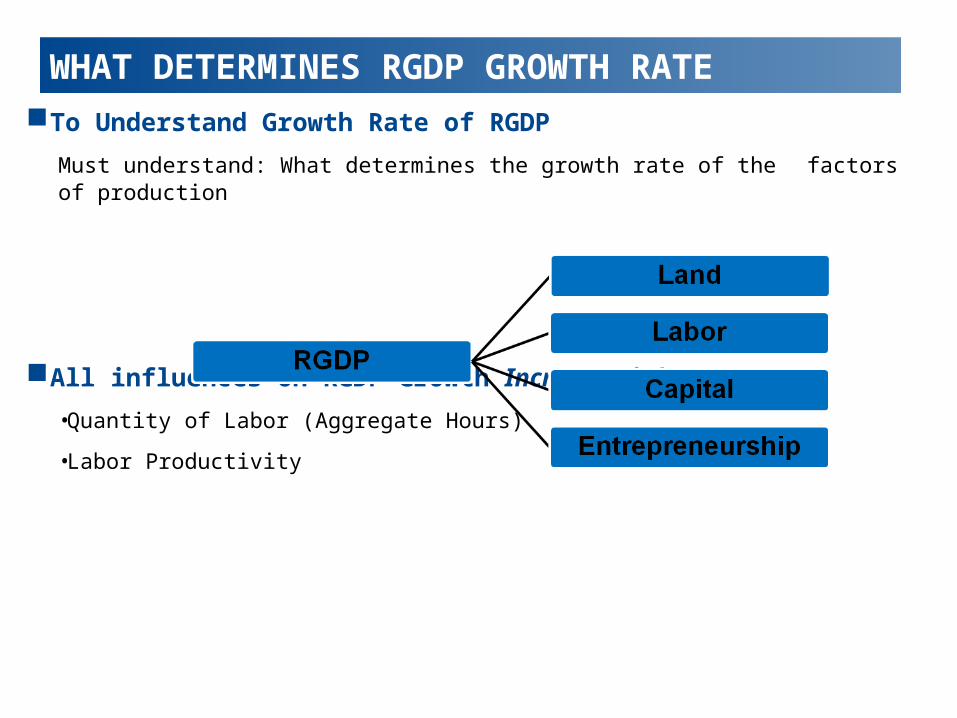
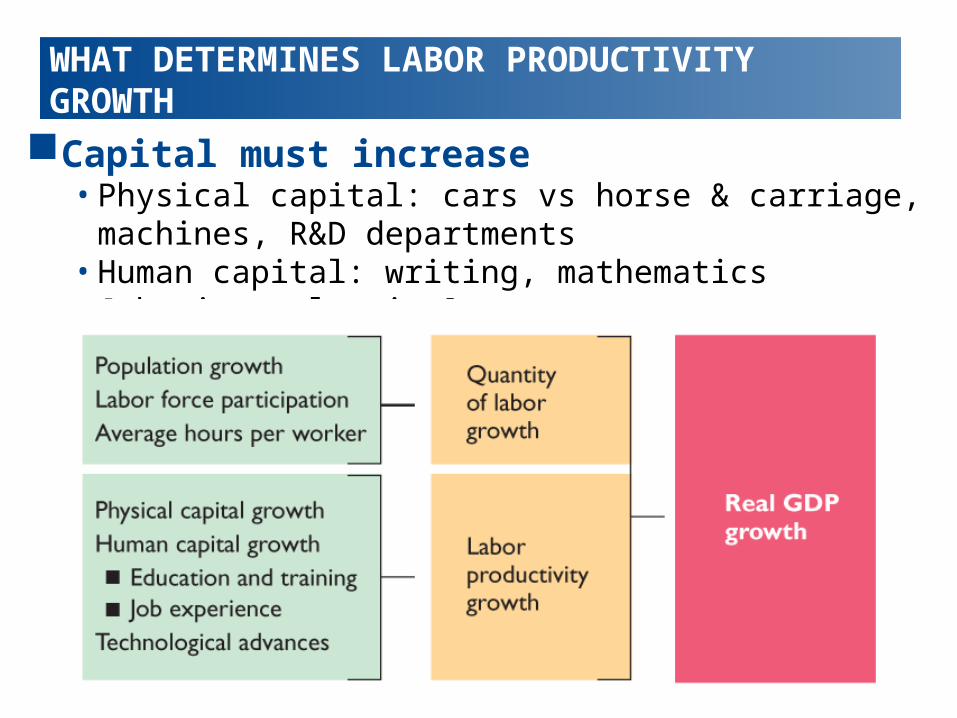
WHAT DETERMINES RGDP GROWTH RATE
To Understand Growth Rate of RGDP
Must understand: What determines the growth rate of the factors of production
All influences on RGDP Growth Increase either:
•Quantity of Labor (Aggregate Hours)
•Labor Productivity
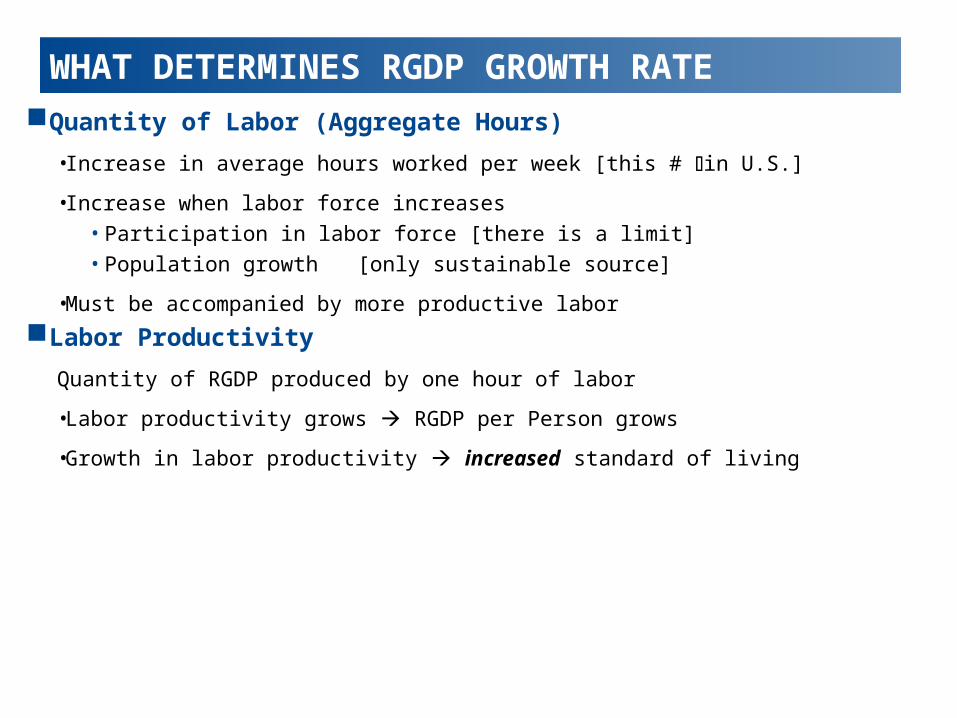
WHAT DETERMINES RGDP GROWTH RATE
Quantity of Labor (Aggregate Hours)
•Increase in average hours worked per week [this # in U.S.]
•Increase when labor force increases• Participation in labor force [there is a limit]• Population growth [only sustainable source]
•Must be accompanied by more productive labor
Labor Productivity
Quantity of RGDP produced by one hour of labor
•Labor productivity grows RGDP per Person grows
•Growth in labor productivity increased standard of living
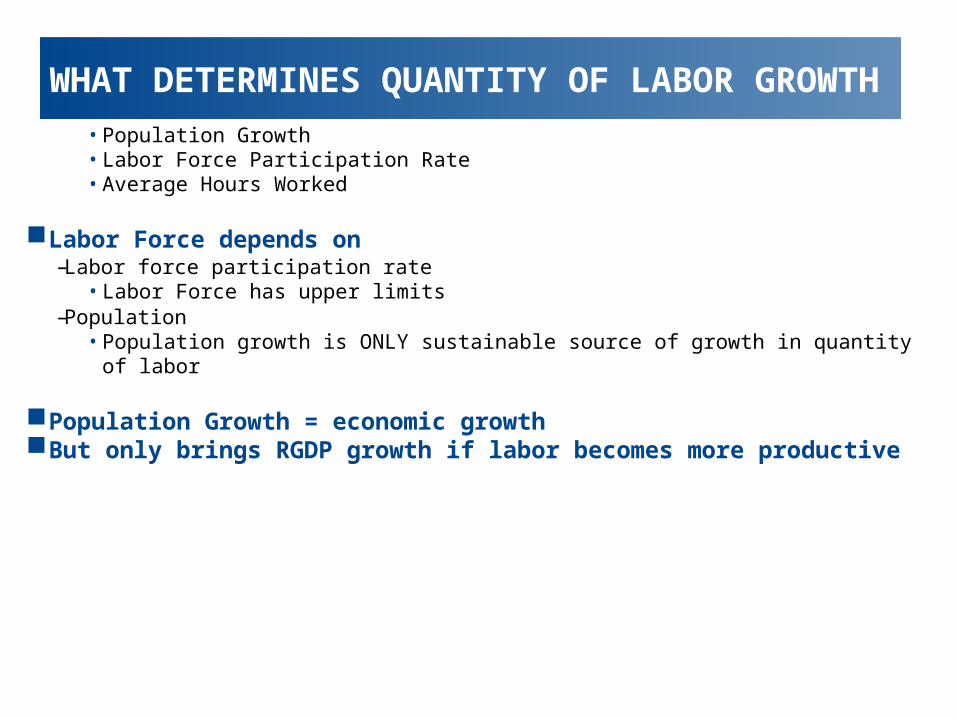
WHAT DETERMINES QUANTITY OF LABOR GROWTH
• Population Growth• Labor Force Participation Rate• Average Hours Worked
Labor Force depends on–Labor force participation rate
• Labor Force has upper limits–Population
• Population growth is ONLY sustainable source of growth in quantity of labor
Population Growth = economic growthBut only brings RGDP growth if labor becomes more productive
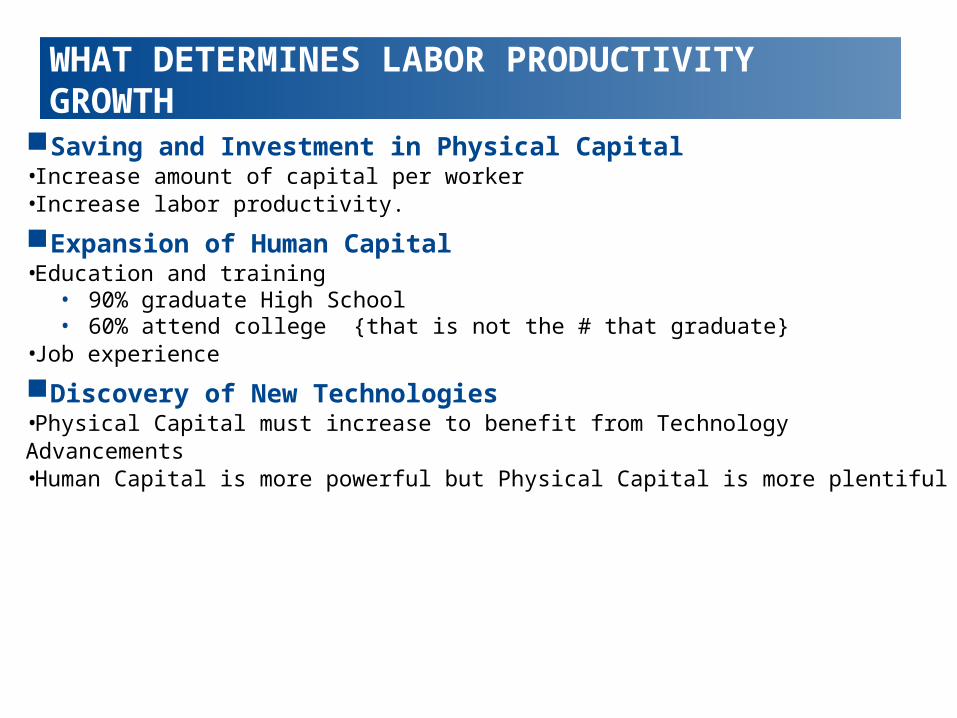
WHAT DETERMINES LABOR PRODUCTIVITY GROWTH
Saving and Investment in Physical Capital•Increase amount of capital per worker •Increase labor productivity.
Expansion of Human Capital•Education and training
• 90% graduate High School• 60% attend college {that is not the # that graduate}
•Job experience
Discovery of New Technologies•Physical Capital must increase to benefit from Technology Advancements•Human Capital is more powerful but Physical Capital is more plentiful
WHAT DETERMINES LABOR PRODUCTIVITY GROWTH
Capital must increase • Physical capital: cars vs horse & carriage, machines, R&D
departments• Human capital: writing, mathematics [physics, plastics]
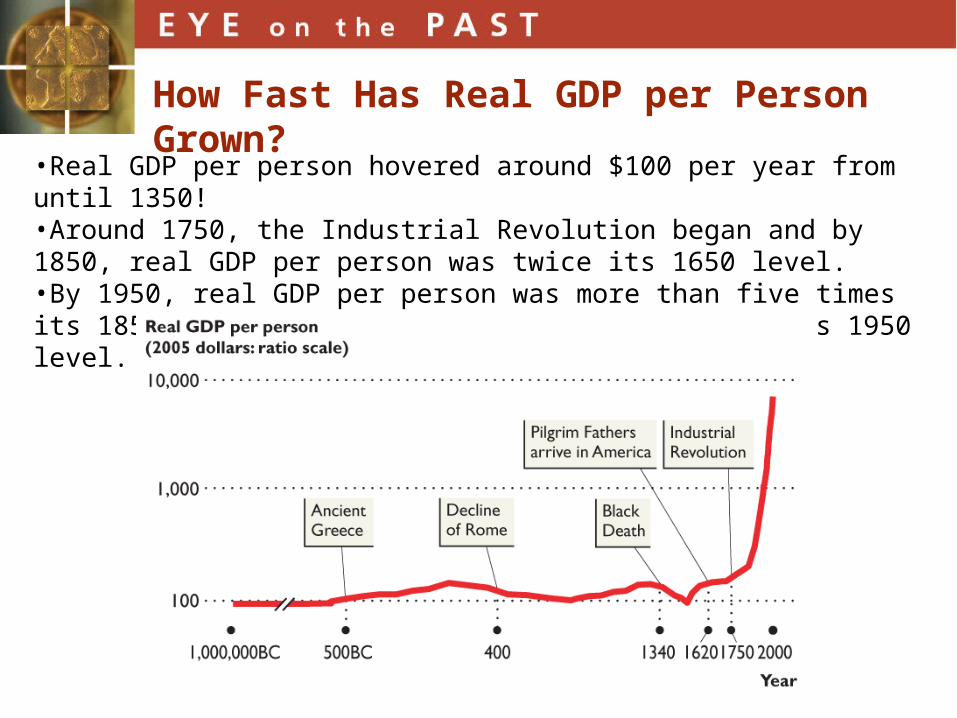
How Fast Has Real GDP per Person Grown?
•Real GDP per person hovered around $100 per year from until 1350! •Around 1750, the Industrial Revolution began and by 1850, real GDP per person was twice its 1650 level.•By 1950, real GDP per person was more than five times its 1850 level. And by 2000, it was four times its 1950 level.
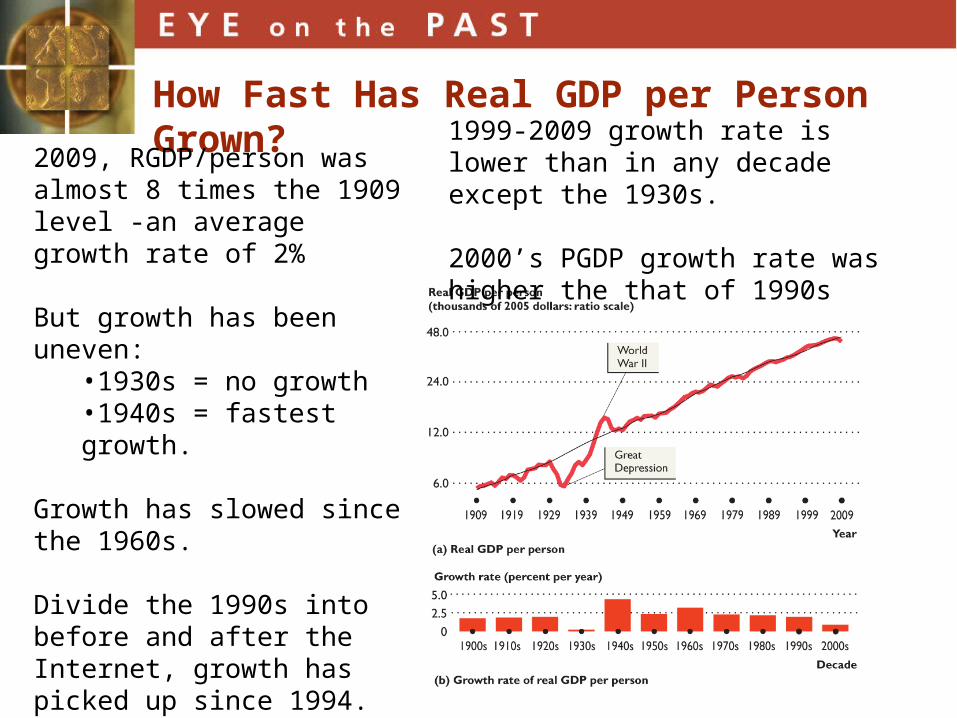
How Fast Has Real GDP per Person Grown?
2009, RGDP/person was almost 8 times the 1909 level -an average growth rate of 2%
But growth has been uneven: •1930s = no growth •1940s = fastest growth.
Growth has slowed since the 1960s.
Divide the 1990s into before and after the Internet, growth has picked up since 1994.
2009 was a year of deep recession.
1999-2009 growth rate is lower than in any decade except the 1930s.
2000’s PGDP growth rate was higher the that of 1990s
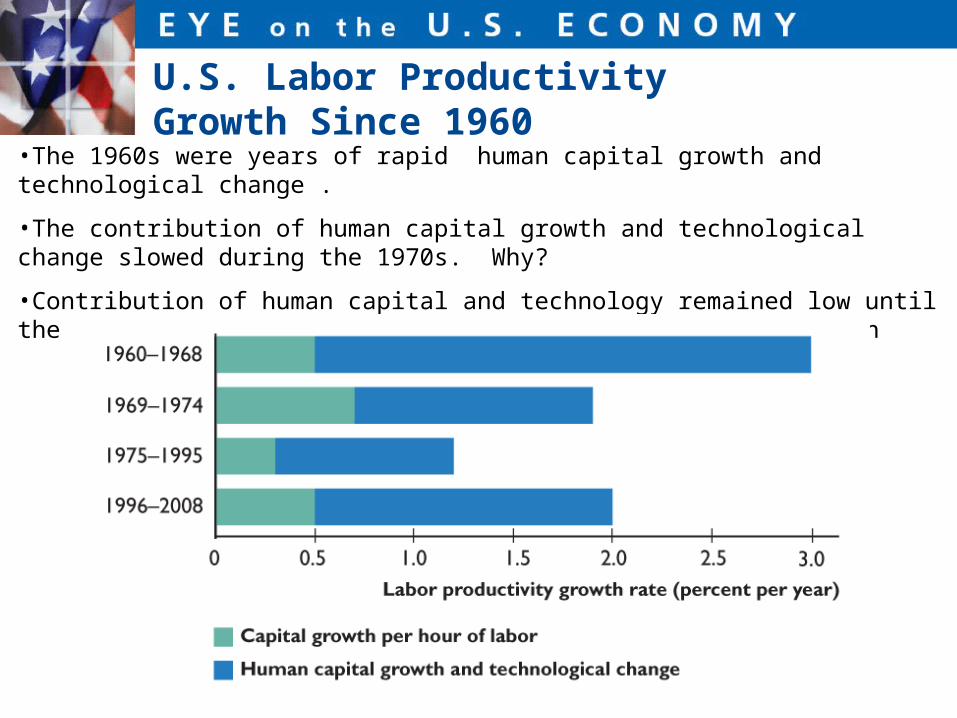
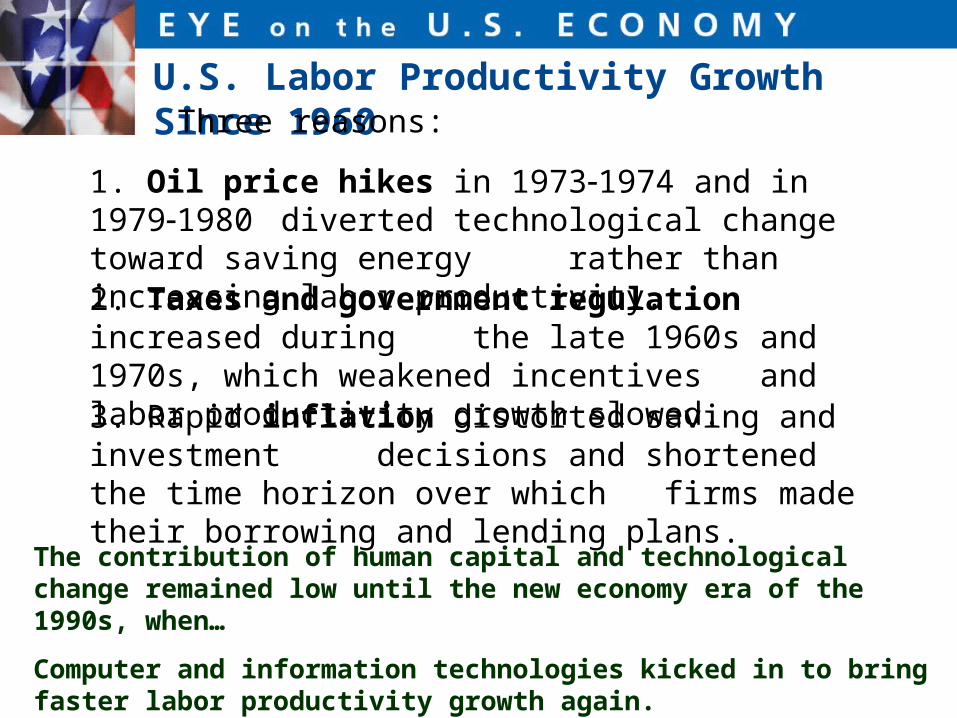
U.S. Labor Productivity Growth Since 1960
•The 1960s were years of rapid human capital growth and technological change .
•The contribution of human capital growth and technological change slowed during the 1970s. Why?
•Contribution of human capital and technology remained low until the 1990’s spurring two decades of labor productivity growth
U.S. Labor Productivity Growth Since 1960
1. Oil price hikes in 19731974 and in 19791980 diverted technological change toward saving energy rather than increasing labor productivity.2. Taxes and government regulation increased during
the late 1960s and 1970s, which weakened incentives and labor productivity growth slowed.
3. Rapid inflation distorted saving and investment decisions and shortened the time horizon over which firms made their borrowing and lending plans.
The contribution of human capital and technological change remained low until the new economy era of the 1990s, when…
Computer and information technologies kicked in to bring faster labor productivity growth again.
Three reasons:
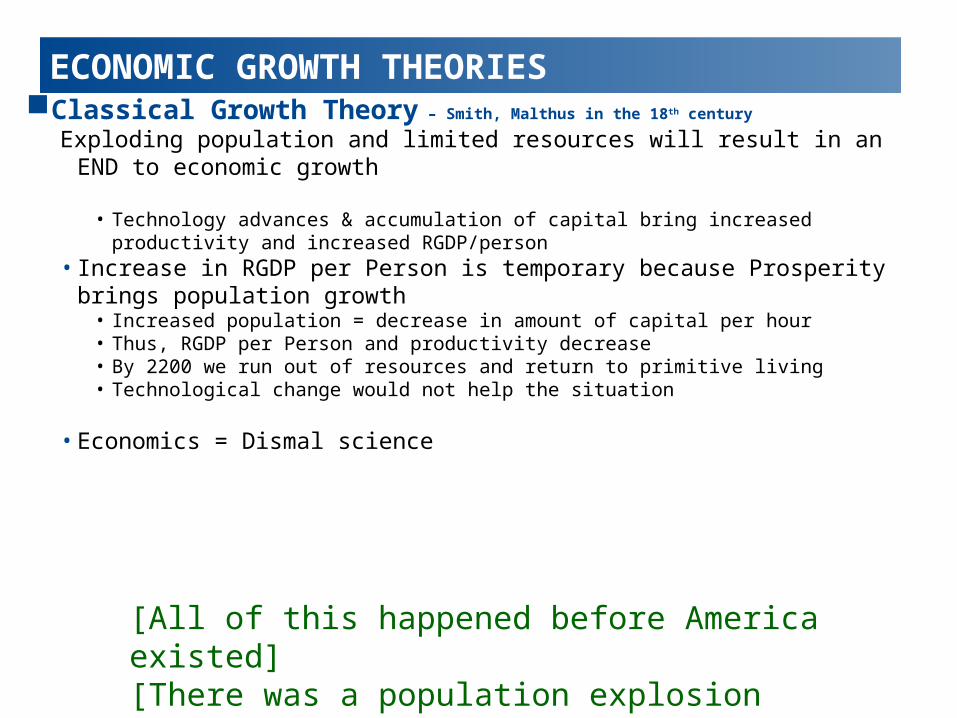
ECONOMIC GROWTH THEORIESClassical Growth Theory – Smith, Malthus in the 18th century
Exploding population and limited resources will result in an END to economic growth
• Technology advances & accumulation of capital bring increased productivity and increased RGDP/person
• Increase in RGDP per Person is temporary because Prosperity brings population growth
• Increased population = decrease in amount of capital per hour• Thus, RGDP per Person and productivity decrease• By 2200 we run out of resources and return to primitive living• Technological change would not help the situation
• Economics = Dismal science
[All of this happened before America existed] [There was a population explosion occurring at the time of this theory’s development]
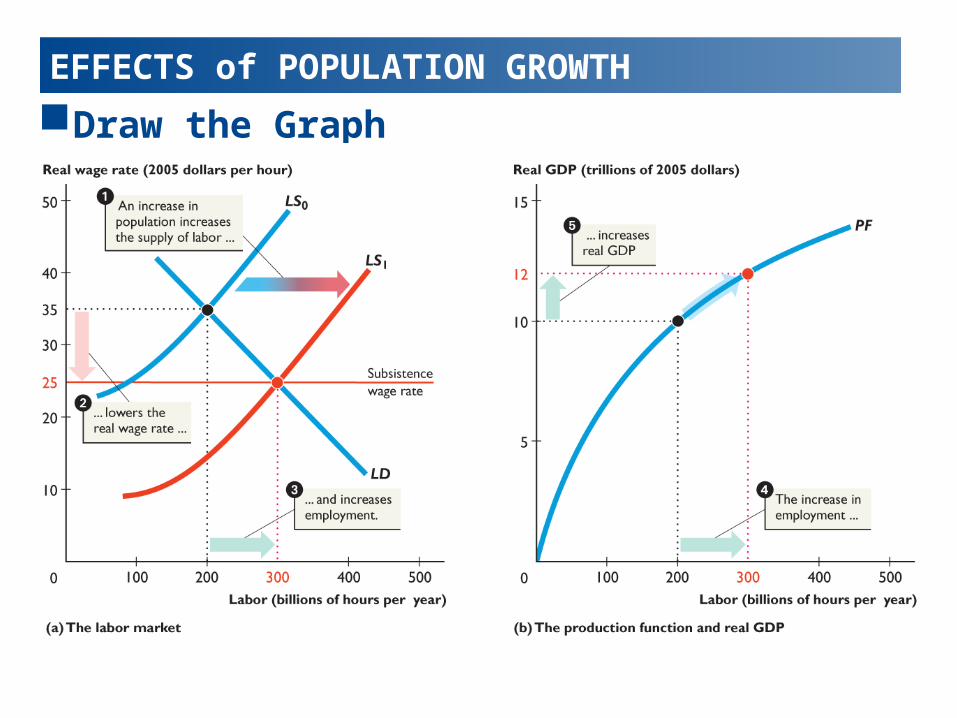
EFFECTS of POPULATION GROWTH
Draw the Graph
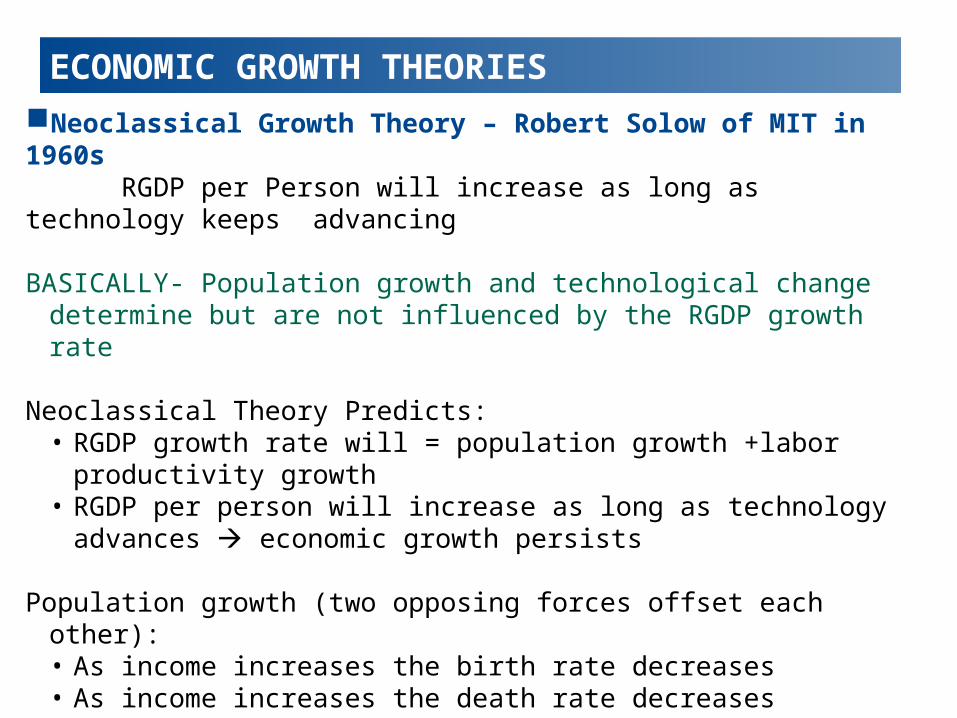
ECONOMIC GROWTH THEORIES
Neoclassical Growth Theory – Robert Solow of MIT in 1960sRGDP per Person will increase as long as technology keeps
advancing
BASICALLY- Population growth and technological change determine but are not influenced by the RGDP growth rate
Neoclassical Theory Predicts:• RGDP growth rate will = population growth +labor productivity growth• RGDP per person will increase as long as technology advances
economic growth persists
Population growth (two opposing forces offset each other):• As income increases the birth rate decreases• As income increases the death rate decreases
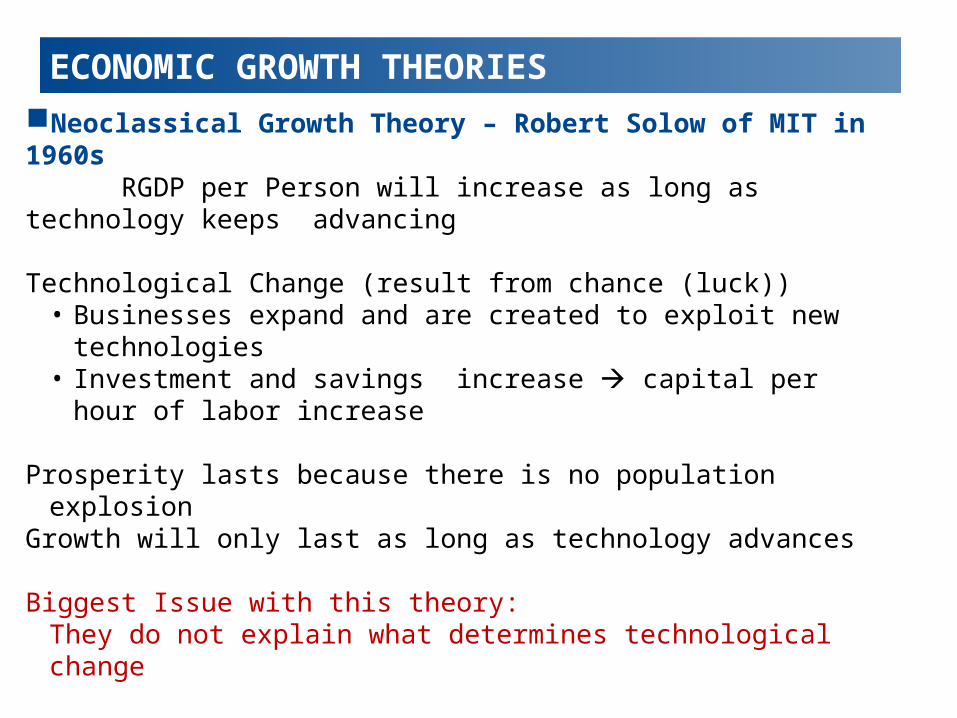
ECONOMIC GROWTH THEORIES
Neoclassical Growth Theory – Robert Solow of MIT in 1960sRGDP per Person will increase as long as technology keeps
advancing
Technological Change (result from chance (luck))• Businesses expand and are created to exploit new technologies• Investment and savings increase capital per hour of labor
increase
Prosperity lasts because there is no population explosionGrowth will only last as long as technology advances
Biggest Issue with this theory: They do not explain what determines technological change
[The population explosion ended and people realized population was related to economic factors but not as stated under the classical theory]
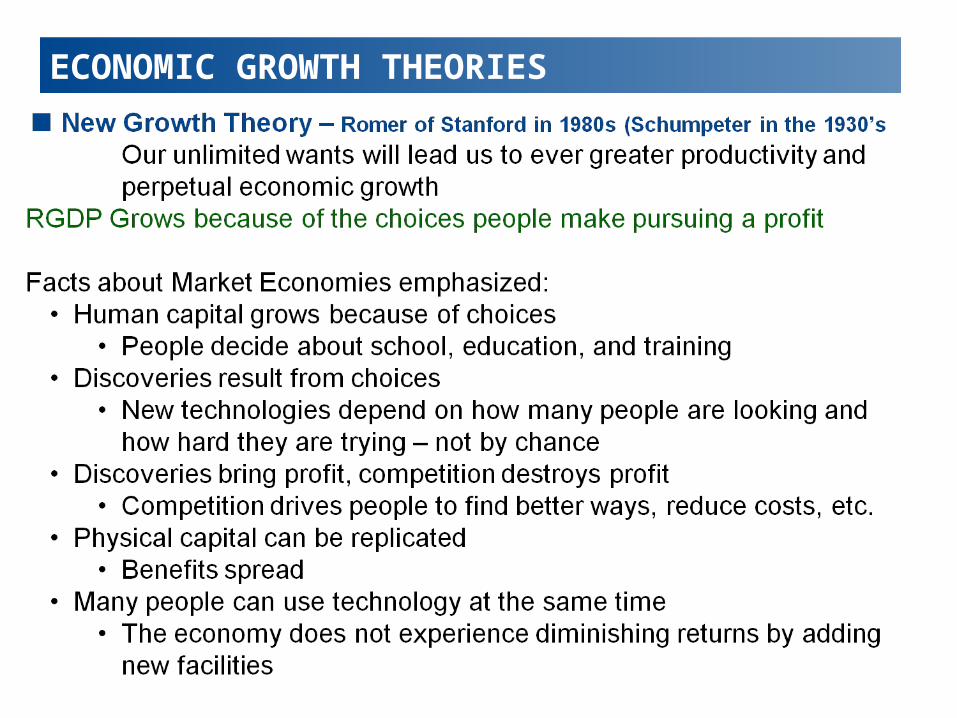
ECONOMIC GROWTH THEORIES
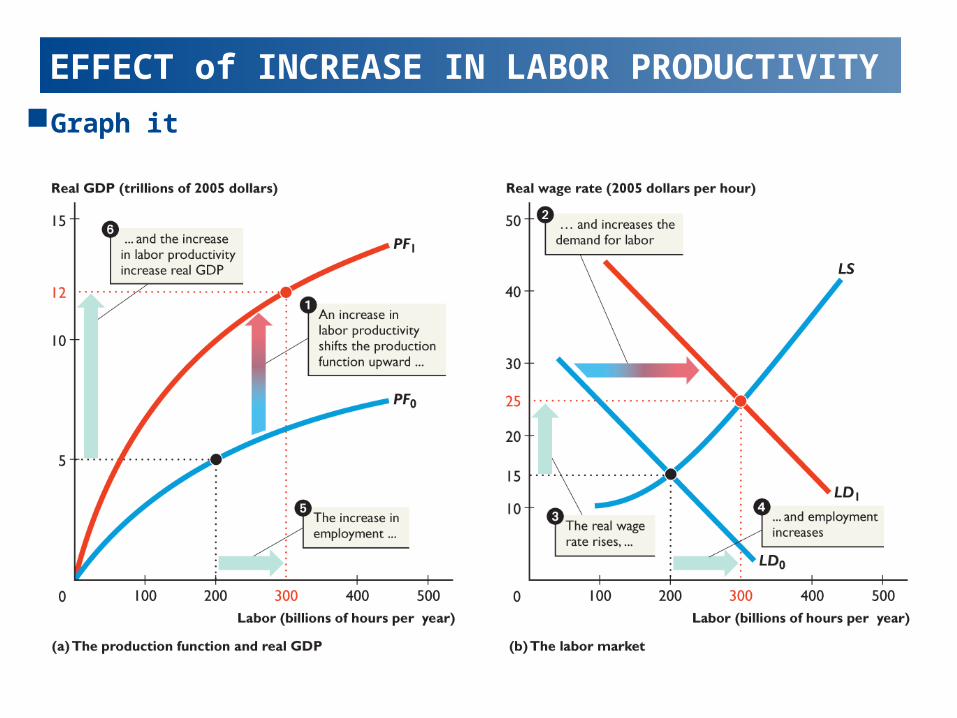
EFFECT of INCREASE IN LABOR PRODUCTIVITY
Graph it
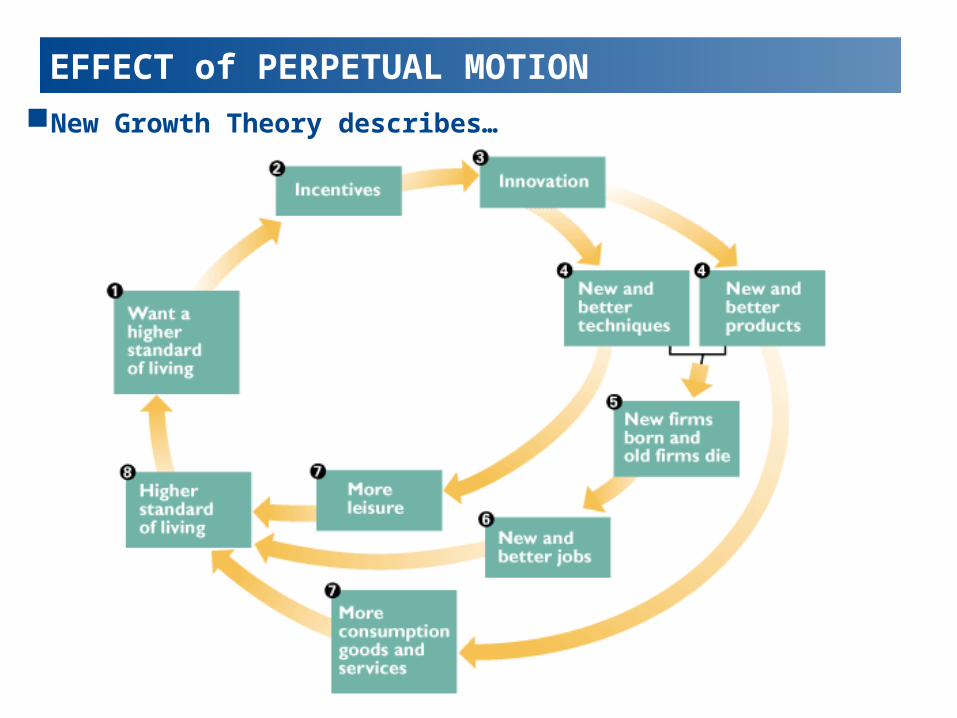
EFFECT of PERPETUAL MOTION
New Growth Theory describes…
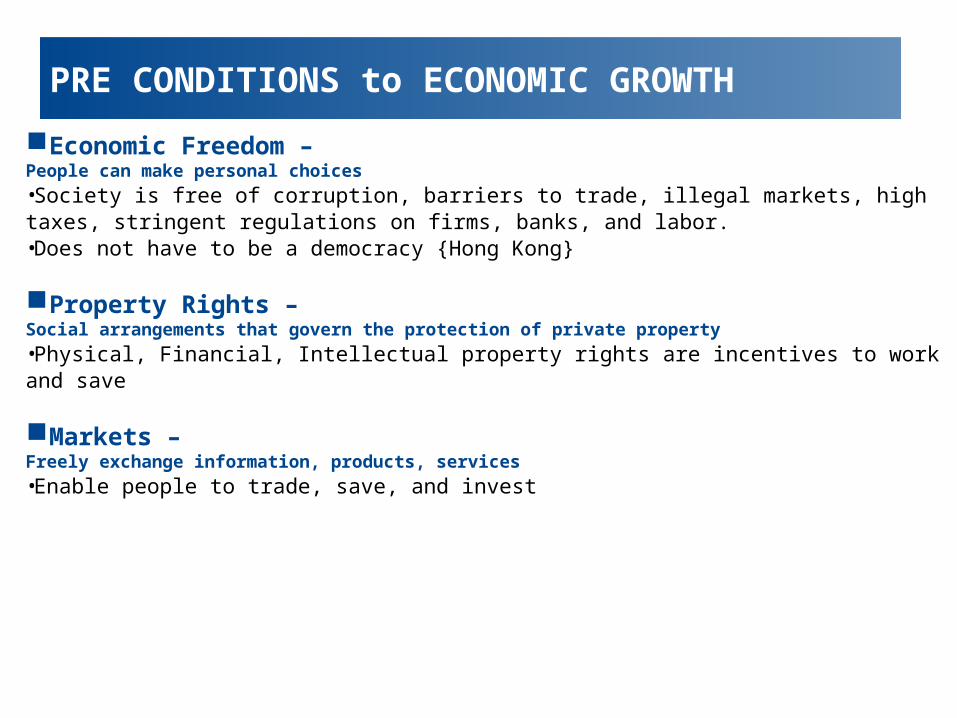
PRE CONDITIONS to ECONOMIC GROWTH
Economic Freedom – People can make personal choices
•Society is free of corruption, barriers to trade, illegal markets, high taxes, stringent regulations on firms, banks, and labor.•Does not have to be a democracy {Hong Kong}
Property Rights – Social arrangements that govern the protection of private property
•Physical, Financial, Intellectual property rights are incentives to work and save
Markets –Freely exchange information, products, services
•Enable people to trade, save, and invest
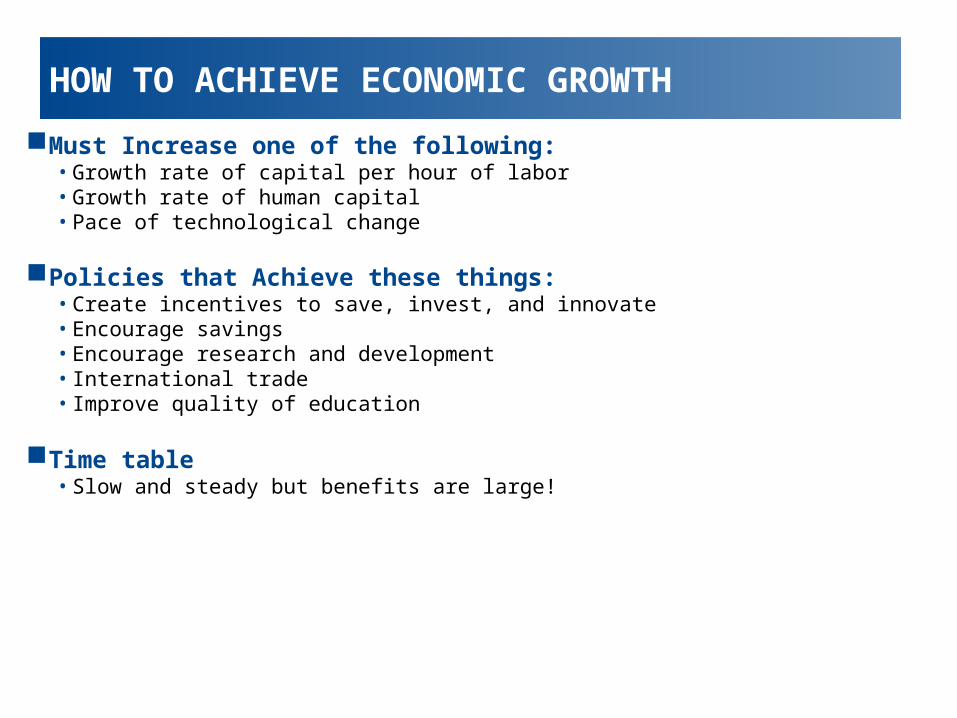
HOW TO ACHIEVE ECONOMIC GROWTH
Must Increase one of the following: • Growth rate of capital per hour of labor• Growth rate of human capital • Pace of technological change
Policies that Achieve these things:• Create incentives to save, invest, and innovate• Encourage savings• Encourage research and development• International trade• Improve quality of education
Time table• Slow and steady but benefits are large!
FORMULAS
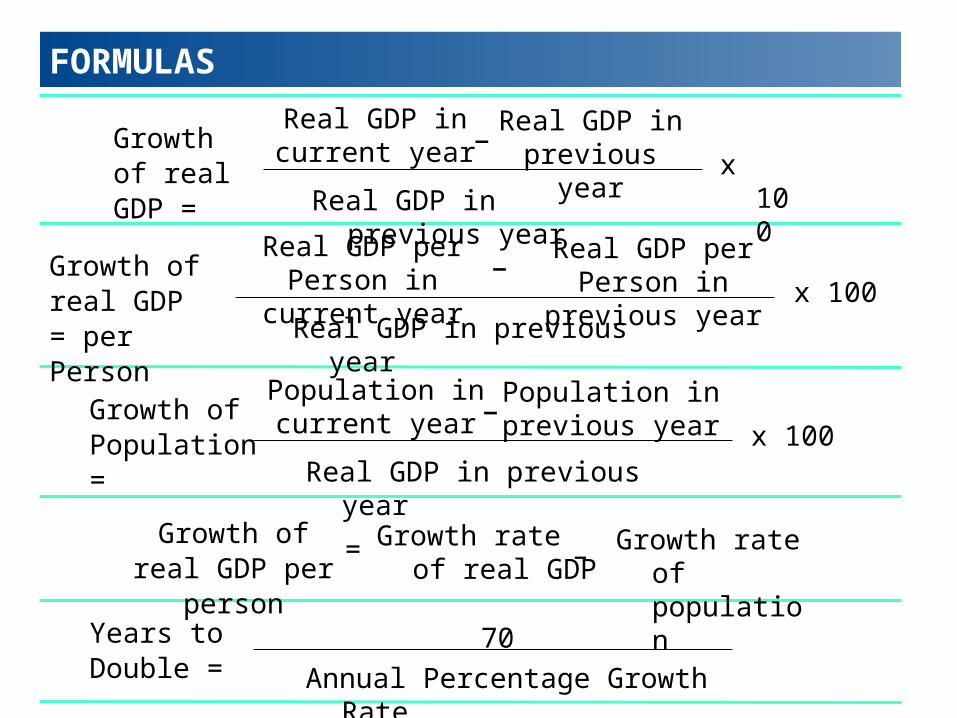
Growth of real GDP =
Real GDP in current year
Real GDP in previous yearx 100
Real GDP in previous year–
Growth of real GDP = per Person
Real GDP per Person in current year
Real GDP in previous yearx 100
Real GDP per Person in previous year–
Growth of real GDP per person
Growth rate of real GDP
Growth rate of population
– =
Growth of Population =
Population in current year
Real GDP in previous yearx 100
Population in previous year–
Years to Double = Annual Percentage Growth Rate
70
FORMULAS
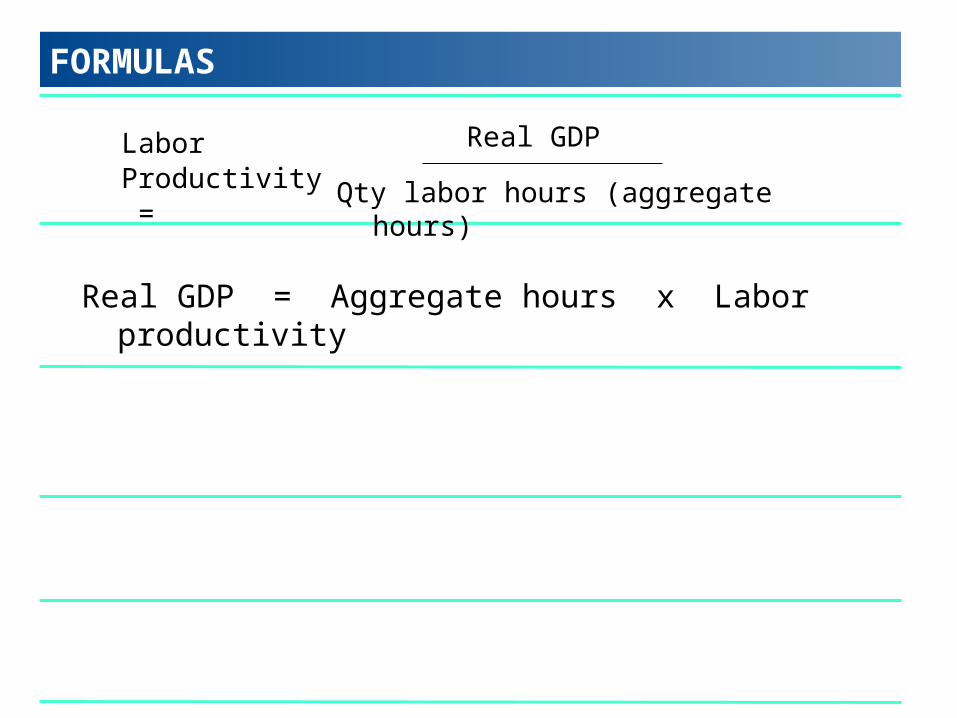
Labor Productivity =
Real GDP
Qty labor hours (aggregate hours)
Real GDP = Aggregate hours x Labor productivity
Political stability, property rights protected by the rule of law, limited government intervention in markets:
Are key features of the economies that enjoy high incomes and they are the features missing in those that remain poor.
Most of the rich nations have experienced sustained economic growth over many decades.
Europe’s Big 4 economies (France, Germany, Italy, and the United Kingdom) have been enjoying economic growth for 200 years.
The United States started to grow rapidly 150 years ago and overtook Europe in the early 20th century.
Why Are Some Nations Rich and Others Poor?
EYE on CONVERGENCE AND GAPS
EYE on the PAST
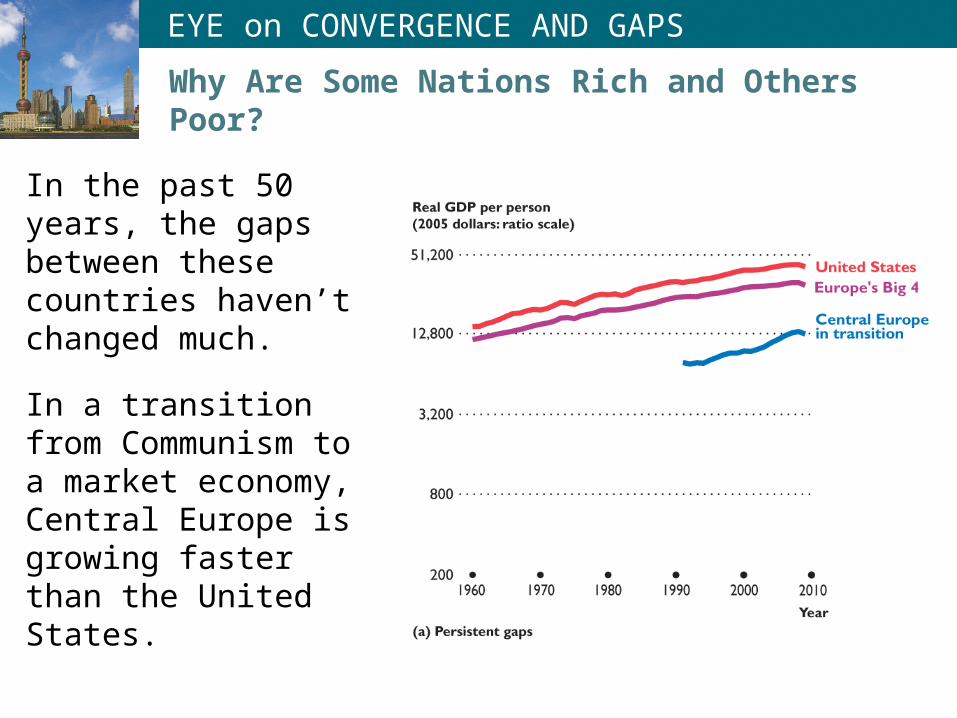
In the past 50 years, the gaps between these countries haven’t changed much.
In a transition from Communism to a market economy, Central Europe is growing faster than the United States.
Why Are Some Nations Rich and Others Poor?
EYE on CONVERGENCE AND GAPS
EYE on the PAST
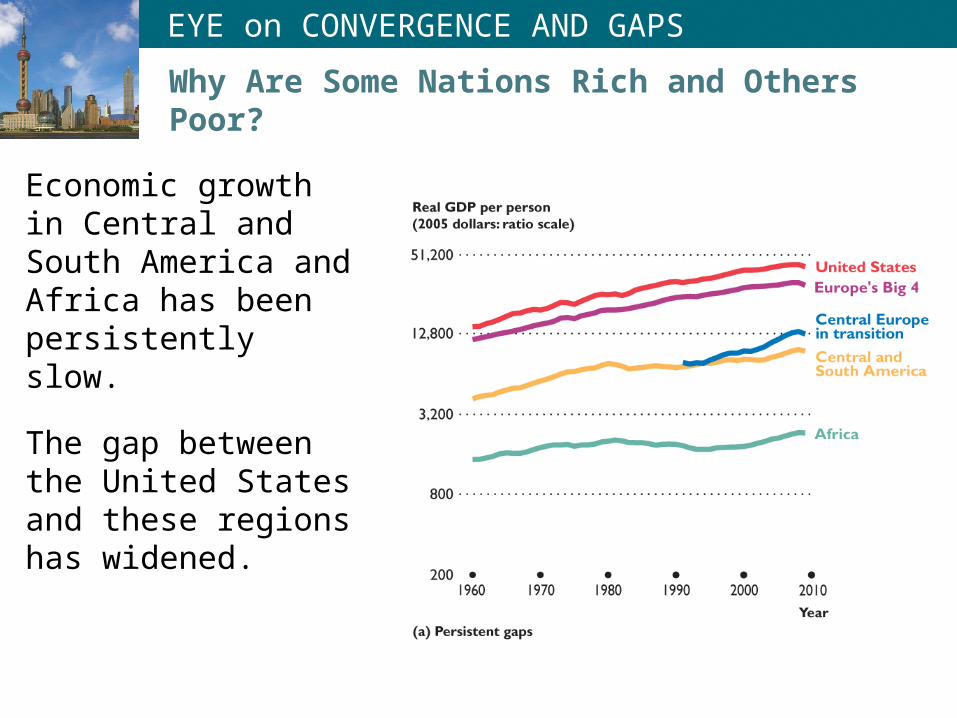
Economic growth in Central and South America and Africa has been persistently slow.
The gap between the United States and these regions has widened.
Why Are Some Nations Rich and Others Poor?
EYE on CONVERGENCE AND GAPS
EYE on the PAST
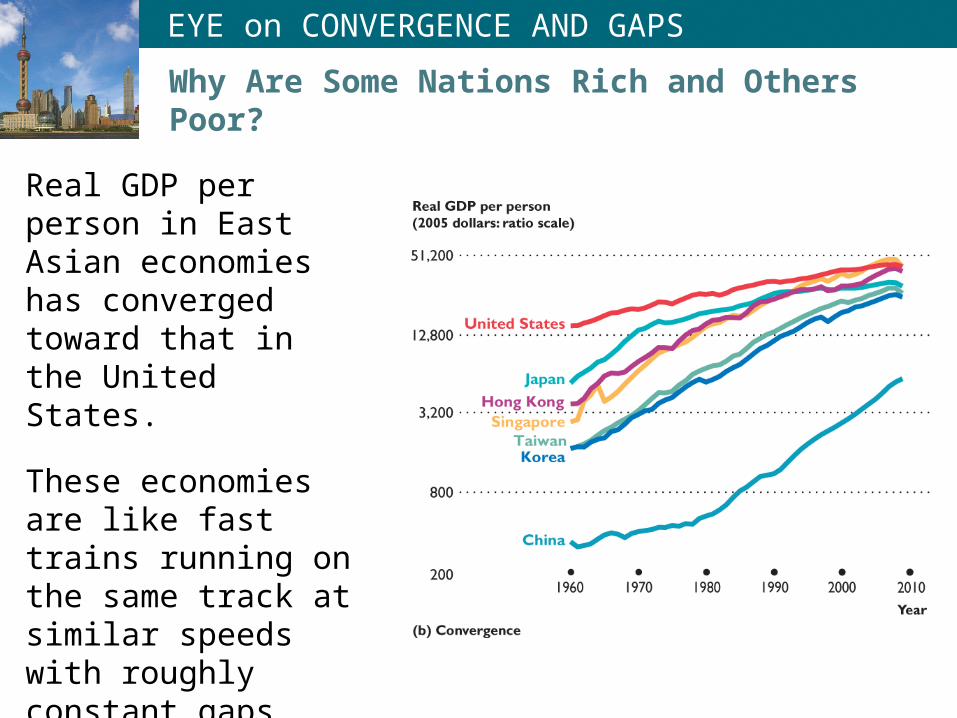
Real GDP per person in East Asian economies has converged toward that in the United States.
These economies are like fast trains running on the same track at similar speeds with roughly constant gaps.
Why Are Some Nations Rich and Others Poor?
EYE on CONVERGENCE AND GAPS
EYE on the PAST
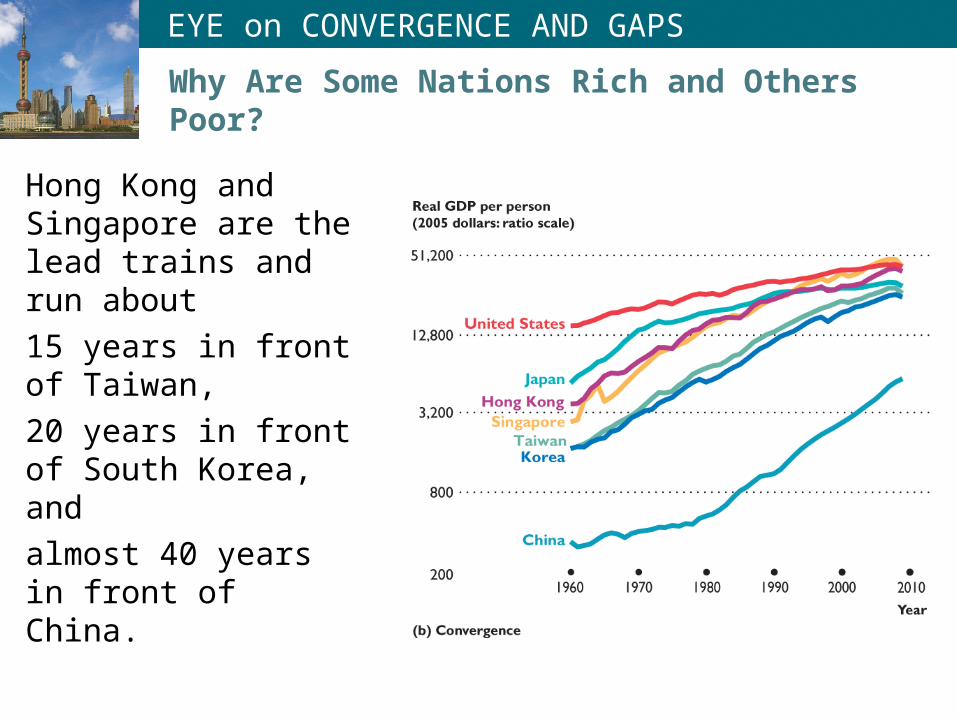
Hong Kong and Singapore are the lead trains and run about
15 years in front of Taiwan,
20 years in front of South Korea, and
almost 40 years in front of China.
Why Are Some Nations Rich and Others Poor?
EYE on CONVERGENCE AND GAPS
EYE on the PAST
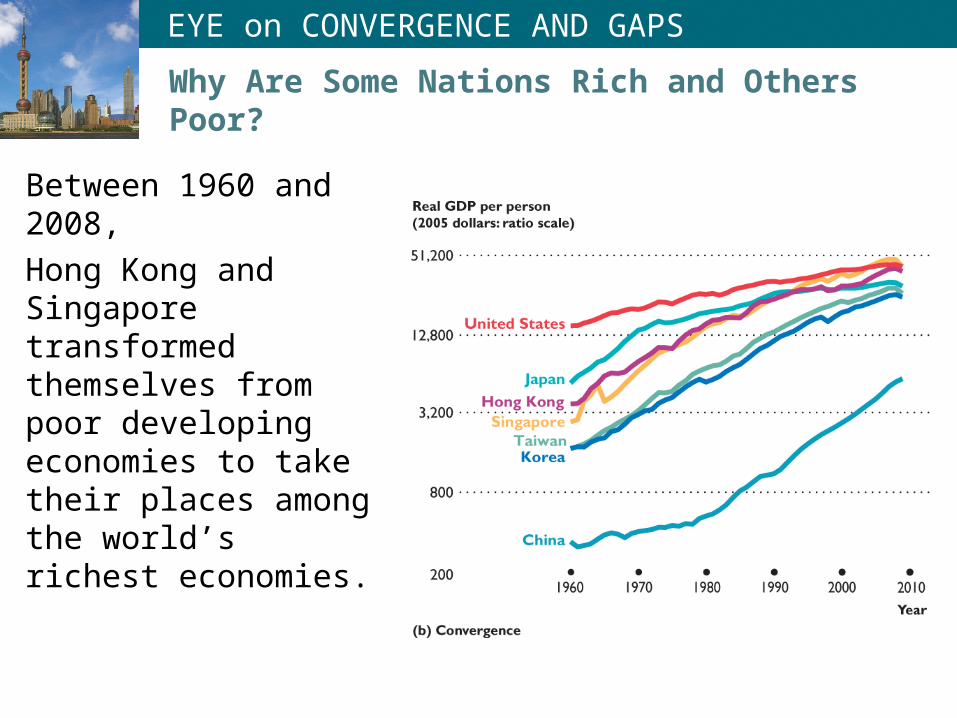
Between 1960 and 2008,
Hong Kong and Singapore transformed themselves from poor developing economies to take their places among the world’s richest economies.
Why Are Some Nations Rich and Others Poor?
EYE on CONVERGENCE AND GAPS
EYE on the U.S. ECONOMY
U.S. Labor Productivity Growth Since 1960
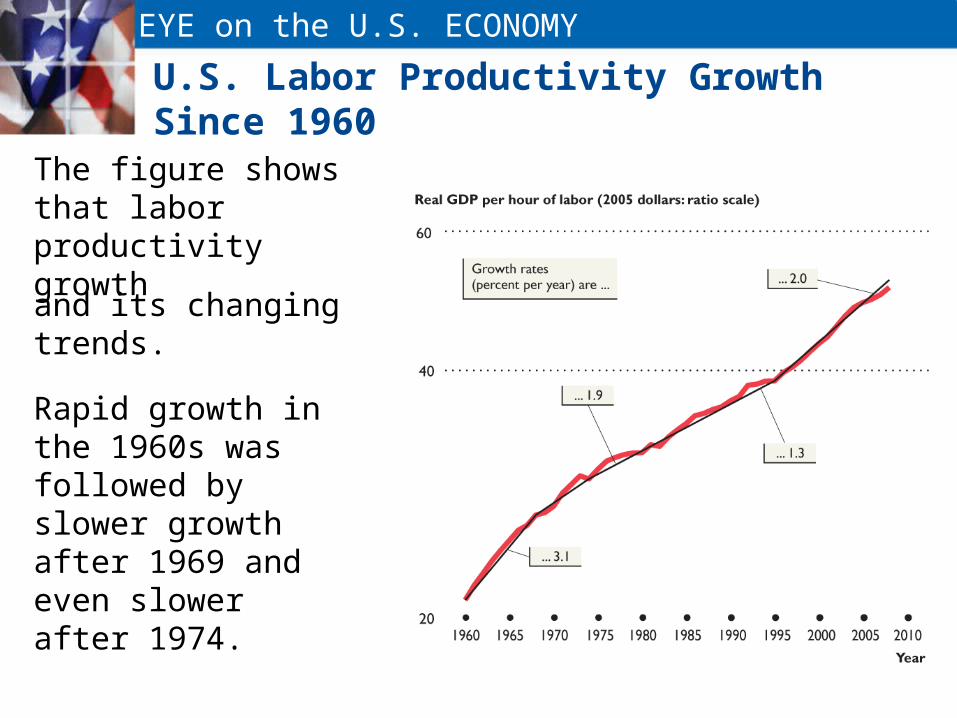
The figure shows that labor productivity growth
Rapid growth in the 1960s was followed by slower growth after 1969 and even slower after 1974.
and its changing trends.
EYE on the U.S. ECONOMY
U.S. Labor Productivity Growth Since 1960
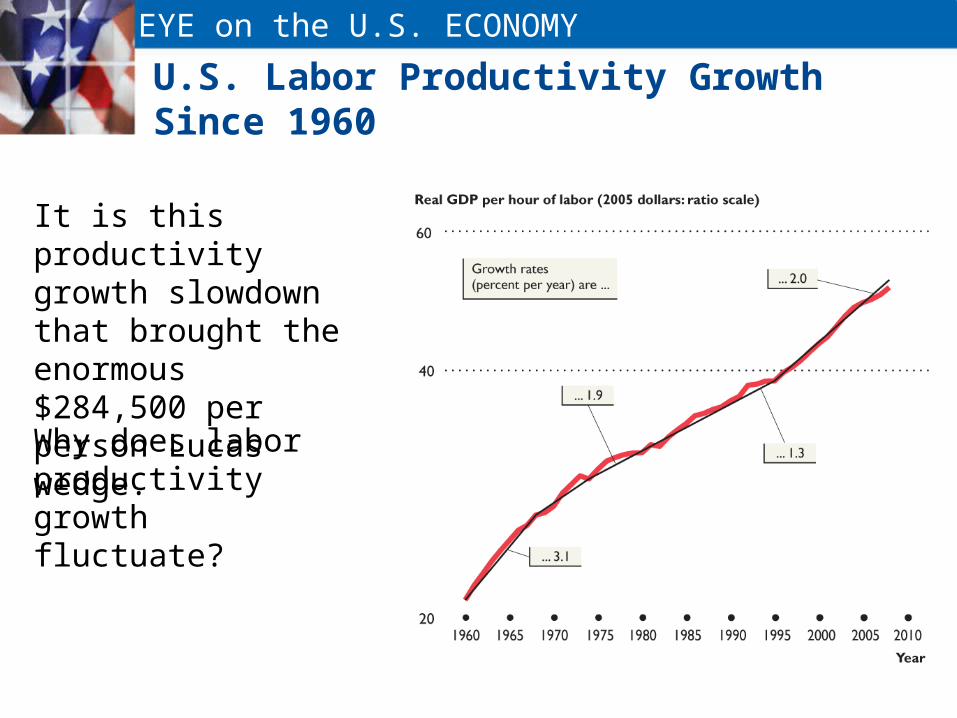
It is this productivity growth slowdown that brought the enormous $284,500 per person Lucas wedge.
Why does labor productivity growth fluctuate?

EYE on YOUR LIFE
How You Influence and Are Influenced by Economic Growth
Many of the choices that you make affect your personal economic growth rate—the pace of expansion of your own standard of living.
These same choices, in combination with similar choices made by millions of other people, have a profound effect on the economic growth of the nation and the world.
The most important of these choices right now is your choice to increase your human capital.

EYE on YOUR LIFE
How You Influence and Are Influenced by Economic Growth
A choice that will become increasingly important later in your life is to accumulate a pension fund.
This choice provides a source of income for you when you eventually retire.
But it also provides financial resources that firms can use to finance the expansion of physical capital.
Not only do your choices influence economic growth; economic growth also has a big influence on you—on how you earn your income and on the standard of living that your income makes possible.

EYE on YOUR LIFE
How You Influence and Are Influenced by Economic Growth
Because of economic growth, the jobs available today are more interesting and less dangerous and strenuous than those of 100 years ago.
Today’s jobs are hugely better paid.
But for many of us, economic growth means that we must accept change and be ready to learn new skills and get new jobs.


