16
Economic Indicators City of Oakland PREPARED BY: THE OFFICE OF ECONOMIC AND WORKFORCE DEVELOPMENT CITY OF OAKLAND OCTOBER 2012
| Date post: | 20-Apr-2017 |
| Category: |
Documents |
| Upload: | recordtrac-city-of-oakland |
| View: | 217 times |
| Download: | 0 times |
Economic Indicators City of Oakland
PREPARED BY: THE OFFICE OF ECONOMIC AND WORKFORCE DEVELOPMENT
CITY OF OAKLAND
OCTOBER 2012
CITY OF OAKLAND ECONOMIC INDICATORS 2
Executive Summary
These economic indicators are intended to provide Oakland’s city leaders and decision makers with benchmarks for economic development and a baseline against which to measure progress toward economic goals. This report outlines a few leading indicators that help articulate the factors that contribute to Oakland’s economy and how those factors activities shape the city’s economic well-being. The most important news is that, after the rollercoaster of the past decade, Oakland’s economy has stabilized and is slowly regaining strength. This brief executive summary shares some highlights of the data presented in more detail on the following pages.
Oakland’s businesses are a pillar of city revenues Between fiscal 2010 and fiscal 2012, Oakland saw a marked increase in the number of business licenses issued and in the business tax revenues associated with those licenses. In fiscal 2011, residential and commercial rental property accounted for more than one-third (35%) of that income, with professional and semi-professional services generating an additional 23%. Revenue from sales tax has also risen steadily for the past two years. This rebound has been bolstered in part by high fuel costs – sales tax revenues from service stations increased 29% between 2010 and 2011. During the same period (fiscal 2010-12) transient occupancy tax revenues rose and then stabilized – from $8.9 million in fiscal 2010 to $12.4 million in fiscal 2012 – thanks to increased occupancy and higher room rates throughout the East Bay.
Of the nearly 25,000 business establishments in Oakland In 2011, almost half (44%) were in the professional, business and other service sectors. (This broad category essentially means professional businesses and the array of administrative, managerial and other services that support them.) What is known as the “clean and green sector” – encompassing green building, green manufacturing, green transportation, environmental services, energy research and services, recycling and remediation industries – has been a bright spot for
Oakland and is a promising area for growth in the future. Other sectors that were promising in the mid-2000s, including digital media and bioscience have not recovered as well, but the nonprofit sector is robust. Although the nonprofit sector does not contribute sales or property tax revenue to the city, these organizations represent a core strength for employment within the city.
Jobs for Oakland’s residents remain a challenge Oakland is home to nearly a quarter of the jobs available in Alameda County. In Alameda County, as in Oakland, most of the jobs have traditionally been in finance, insurance, and real estate (collectively referred to as FIRE) and the professional services sectors. Oakland has experienced a sharper loss of FIRE jobs, than the rest of the county. Manufacturing, on the other hand, has retained jobs in the city, but not in other parts of the county. Other sectors, such as public administration and education, have remained relatively steady or even experienced growth. Unemployment in Oakland has decreased to 15.6% in 2012, down from 16.9% the previous year, but still higher than for Alameda County as a whole. On the other hand, household incomes in Oakland fell less dramatically than in the rest of Alameda County between 2000 and 2010.
Commercial and residential real estate markets have stabilized Commercial real estate in Oakland is priced competitively with comparable areas in the East Bay and the city enjoys a lower vacancy rate for commercial properties than Alameda or Contra Costa counties – perhaps indicating an opportunity for new commercial and industrial spaces. In the residential market, after plummeting from 2005 to 2007, home prices are stabilizing, as are the number of homes sold. And the market for rental apartments is very strong, following a trend of increasing demand for rentals across the Bay Area.
CITY OF OAKLAND ECONOMIC INDICATORS 3
An Economic Dashboard
Economic indicators allow city leaders and citizens who live, work, and invest in Oakland to track the economic health of their city. Indicators can also provide a way for city leaders and decision makers to measure progress against goals and benchmarks set in future strategic plans. This report outlines a few leading indicators that help articulate the factors that contribute to Oakland’s economy and how those factors activities shape the city’s economic well-being.
The August 2012 report is a snapshot of how Oakland’s businesses and residents are faring in the aftermath of the financial downturn of the past five years. Going forward, this dashboard will be updated on a regular basis, as new data becomes available, to track the effectiveness of policies and the state of the city’s recovery.
Comparing 2010 to 2011: Stabilizing and Gaining Strength
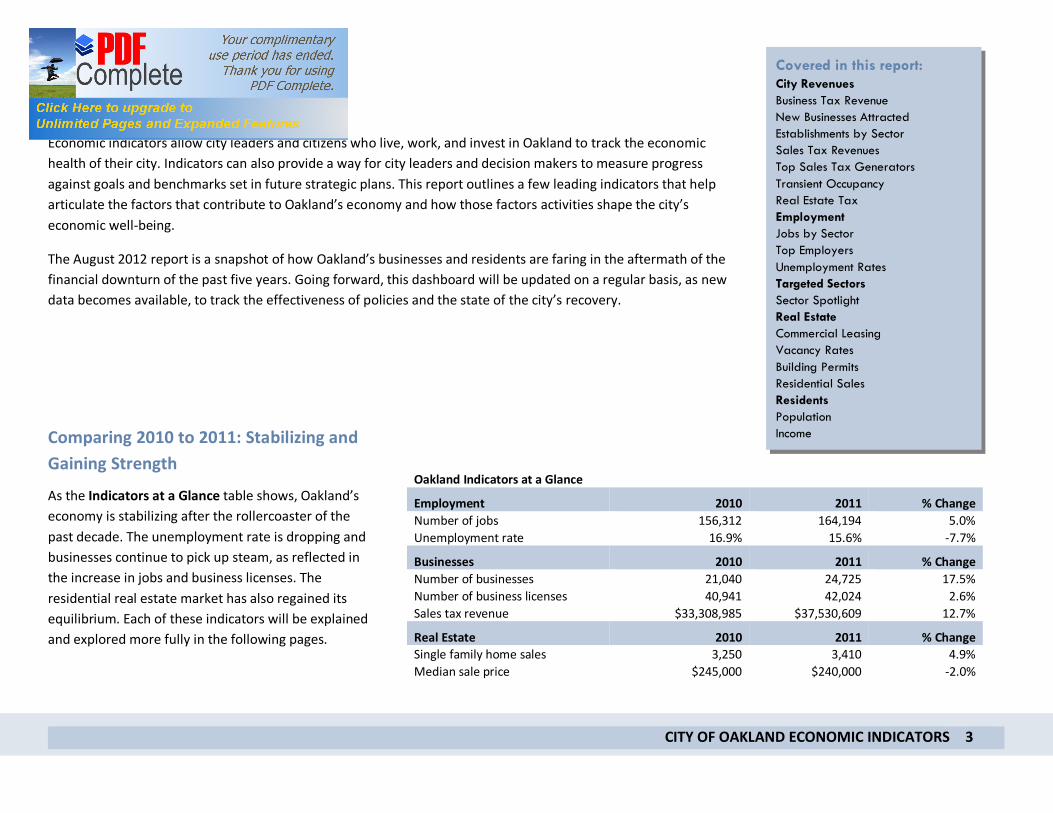
As the Indicators at a Glance table shows, Oakland’s economy is stabilizing after the rollercoaster of the past decade. The unemployment rate is dropping and businesses continue to pick up steam, as reflected in the increase in jobs and business licenses. The residential real estate market has also regained its equilibrium. Each of these indicators will be explained and explored more fully in the following pages.
Oakland Indicators at a Glance
Employment 2010 2011 % Change Number of jobs 156,312 164,194 5.0% Unemployment rate 16.9% 15.6% -7.7%
Businesses 2010 2011 % Change Number of businesses 21,040 24,725 17.5% Number of business licenses 40,941 42,024 2.6% Sales tax revenue $33,308,985 $37,530,609 12.7%
Real Estate 2010 2011 % Change Single family home sales 3,250 3,410 4.9% Median sale price $245,000 $240,000 -2.0%
Covered in this report: City Revenues Business Tax Revenue New Businesses Attracted Establishments by Sector Sales Tax Revenues Top Sales Tax Generators Transient Occupancy Real Estate Tax Employment Jobs by Sector Top Employers Unemployment Rates Targeted Sectors Sector Spotlight Real Estate Commercial Leasing Vacancy Rates Building Permits Residential Sales Residents Population Income

CITY OF OAKLAND ECONOMIC INDICATORS 4
City Revenues The City’s annual budget across all funds is just under $1 billion for the FY 2011-2013 budget. About 58% of those funds are restricted for specific purposes such as infrastructure, housing development, and bond-funded programs such as the Measure DD improvements at Lake Merritt. Restricted funds come from grants, fees, bonds or revenues that are collected for a specific purpose.
The remaining 42 % of the City’s total budget is the General Fund which pays for basic programs and services such as police and fire protection, libraries, senior centers and recreation programs. The largest source of revenue to the General Fund comes from property tax.
Business Tax Revenue Citywide business license estimates are based on the total number of businesses that have paid license fees within a given year. This number includes businesses headquartered in other cities, doing business in Oakland. In fiscal 2011, Oakland issued 1,083 more business licenses than in fiscal 2010, an increase of 2.65%. Fiscal 2012 saw a continuation of this trend. Collectively, these businesses generated $47,704,712.44 in business tax revenue for the city in 2012. In 2012, license taxes paid by businesses in the Professional/ Semi-Professional Service sector generated 24% of tax revenue for the city, while businesses in the Residential and Commercial Rental Property sector generated 21% and 19% of tax revenue respectively.
New Businesses Attracted During the months of June, July and August roughly 40 new businesses were engaged with the potential for trading in Oakland. These businesses present the opportunity for an estimated 1,000 new jobs gain.
Oakland Business Licenses Fiscal 2010 Fiscal 2011 Fiscal 2012 Total Business Licenses Issued 40,941 42,024 42,841 Total Business Tax Revenues $44,508,641.06 $48,862,301.78 $47,704,712.44
Source: HdL City to State comparison FY11-12
SOURCE: OAKLAND BUDGET & REVENUE DEPT
Sector Revenue Contribution

CITY OF OAKLAND ECONOMIC INDICATORS 5
Establishments by Sector In 2011, EconoVue reports 24,725 establishments were located in the city of Oakland. This is a 17% increase from 2010. The Professional/Business/Other Services sector represents 44% of businesses in Oakland. This broad category includes personal services; professional, scientific and technical services; management of companies and enterprises; and administrative, support, waste management and remediation services. The Leisure/Entertainment/Retail industry holds 15% of business establishments. FIRE, Construction, and Manufacturing each represent 7% of businesses located in Oakland.
SOURCE: ECONOVUE

CITY OF OAKLAND ECONOMIC INDICATORS 6
Sales Tax Revenues Revenue from sales tax, an important source of income for Oakland has risen steadily for the past two years. Alameda and Contra Costa Counties have seen similar rebounds, though not as dramatic as Oakland’s. Oakland’s rebound has been bolstered by high fuel costs. Sales tax revenues from service stations increased 29% between 2010 and 2011, from $4.4 million to $5.6 million. Fuel and Service Stations and Auto sales make up the other largest source of sales tax revenue, contributing $11.3 million of Oakland’s revenue, in 2011. In addition, nearly all other retail categories saw an increase in revenue, helping to return retail sales tax revenues almost to pre-2007 levels.
Total Annual Sales Tax Revenues 2010 2011 % Change
Oakland $33,308,985 $37,530,609 13% Alameda County $188,456,860 $202,807,827 8%
Top 25 Sales Producers (Alphabetically) Audi Mazda of Oakland Give Something Back Best Buy Harborside Health Center Broadway Volkswagen Home Depot Chevron Honda of Oakland Chevron Mercedes Benz of Oakland Coliseum Lexus Oakland Coliseum CVS Pharmacy One Toyota of Oakland Downtown Saab-
Subaru- Toyota Oncesource Supply Solutions Safeway
East Bay Restaurant Supply
Southwest Jet Fuel Target
Enterprise Commercial Truck
Walgreens Walmart
Food Maxx Westside Building Material Source: HdL.
Manufacturing and Wholesale, Auto sales, Fuel and Service Stations as well as eating and drinking places are the major contributing sectors to the retain sales revenue.
Source: HdL – City of Oakland Sales Tax Update Q1 2012
CITY OF OAKLAND ECONOMIC INDICATORS 7
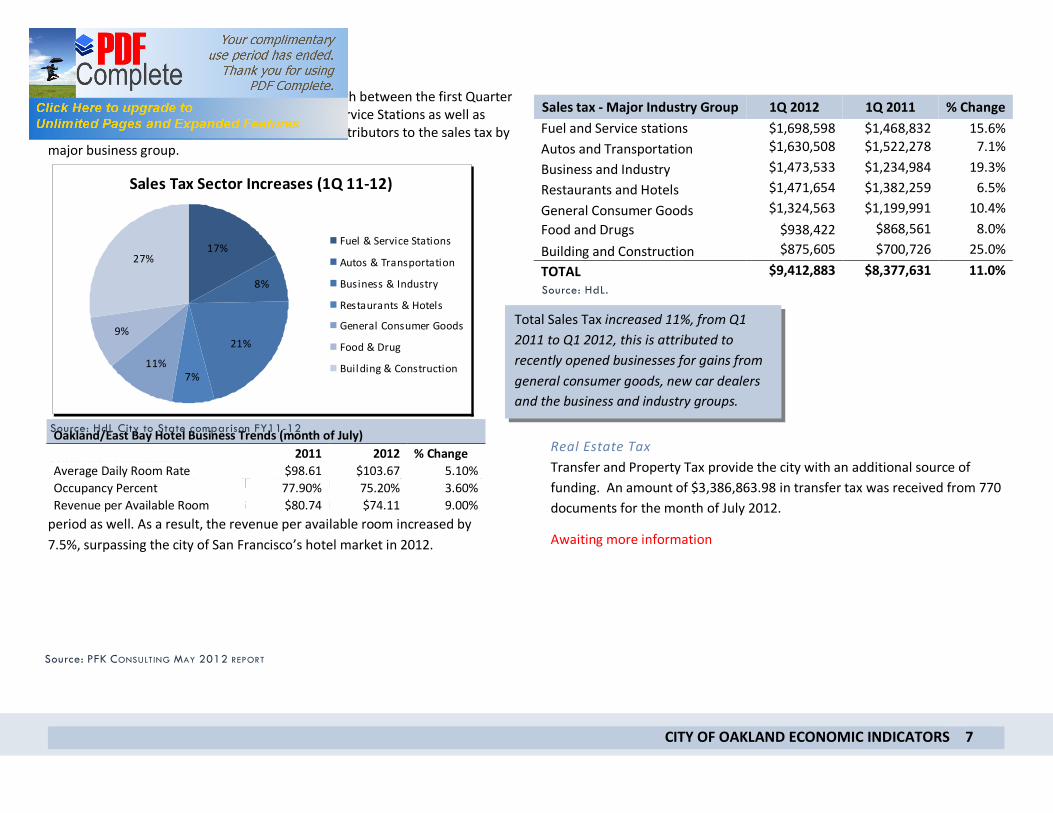
Sales Tax Sector Increases (1Q 11-12)
7%11%
9%
27%17%
8%
21%
Fuel & Service Stations
Autos & Transportation
Business & Industry
Restaurants & Hotels
General Consumer Goods
Food & Drug
Building & Construction
Top Sales Tax Generators
Business and Industry saw the largest sector growth between the first Quarter of 2011 and the first Quarter of 2012. Fuel and Service Stations as well as Autos and Transportation are still the greatest contributors to the sales tax by major business group.
Transient Occupancy Hotel Occupancy in the Oakland/East Bay region increased between 2011 and 2012 by 3.6%. The average daily rate increased by 5.1% between this period as well. As a result, the revenue per available room increased by 7.5%, surpassing the city of San Francisco’s hotel market in 2012.
Real Estate Tax Transfer and Property Tax provide the city with an additional source of funding. An amount of $3,386,863.98 in transfer tax was received from 770 documents for the month of July 2012.
Awaiting more information
Sales tax - Major Industry Group 1Q 2012 1Q 2011 % Change Fuel and Service stations $1,698,598 $1,468,832 15.6% Autos and Transportation $1,630,508 $1,522,278 7.1% Business and Industry $1,473,533 $1,234,984 19.3% Restaurants and Hotels $1,471,654 $1,382,259 6.5% General Consumer Goods $1,324,563 $1,199,991 10.4% Food and Drugs $938,422 $868,561 8.0% Building and Construction $875,605 $700,726 25.0% TOTAL $9,412,883 $8,377,631 11.0%
Oakland/East Bay Hotel Business Trends (month of July) 2011 2012 % Change Average Daily Room Rate $98.61 $103.67 5.10% Occupancy Percent 77.90% 75.20% 3.60% Revenue per Available Room $80.74 $74.11 9.00%
Total Sales Tax increased 11%, from Q1 2011 to Q1 2012, this is attributed to recently opened businesses for gains from general consumer goods, new car dealers and the business and industry groups.
Source: HdL.
Source: PFK CONSULTING MAY 2012 REPORT
Source: HdL City to State comparison FY11-12
CITY OF OAKLAND ECONOMIC INDICATORS 8
Employment
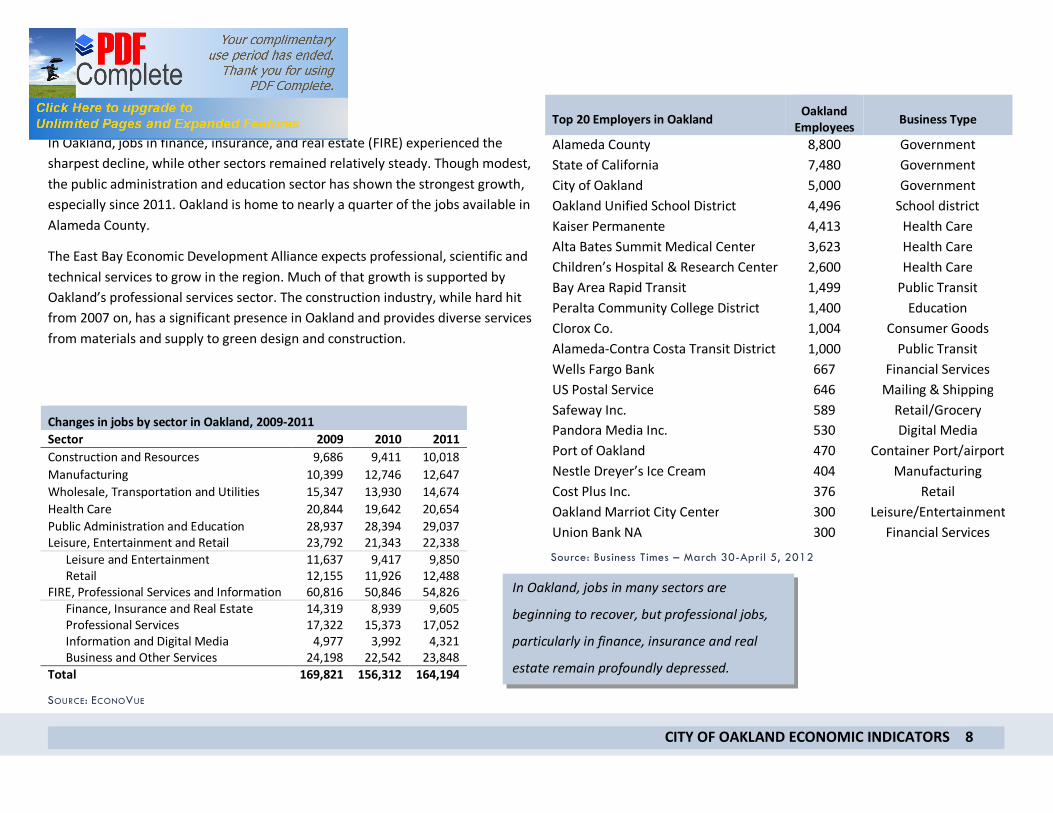
Jobs In Oakland, jobs in finance, insurance, and real estate (FIRE) experienced the sharpest decline, while other sectors remained relatively steady. Though modest, the public administration and education sector has shown the strongest growth, especially since 2011. Oakland is home to nearly a quarter of the jobs available in Alameda County.
The East Bay Economic Development Alliance expects professional, scientific and technical services to grow in the region. Much of that growth is supported by Oakland’s professional services sector. The construction industry, while hard hit from 2007 on, has a significant presence in Oakland and provides diverse services from materials and supply to green design and construction.
Top 20 Employers in Oakland Oakland Employees Business Type
Alameda County 8,800 Government State of California 7,480 Government City of Oakland 5,000 Government Oakland Unified School District 4,496 School district Kaiser Permanente 4,413 Health Care Alta Bates Summit Medical Center 3,623 Health Care Children’s Hospital & Research Center 2,600 Health Care Bay Area Rapid Transit 1,499 Public Transit Peralta Community College District 1,400 Education Clorox Co. 1,004 Consumer Goods Alameda-Contra Costa Transit District 1,000 Public Transit Wells Fargo Bank 667 Financial Services US Postal Service 646 Mailing & Shipping Safeway Inc. 589 Retail/Grocery Pandora Media Inc. 530 Digital Media Port of Oakland 470 Container Port/airport Nestle Dreyer’s Ice Cream 404 Manufacturing Cost Plus Inc. 376 Retail Oakland Marriot City Center 300 Leisure/Entertainment Union Bank NA 300 Financial Services
Changes in jobs by sector in Oakland, 2009-2011 Sector 2009 2010 2011 Construction and Resources 9,686 9,411 10,018 Manufacturing 10,399 12,746 12,647 Wholesale, Transportation and Utilities 15,347 13,930 14,674 Health Care 20,844 19,642 20,654 Public Administration and Education 28,937 28,394 29,037 Leisure, Entertainment and Retail 23,792 21,343 22,338
Leisure and Entertainment 11,637 9,417 9,850 Retail 12,155 11,926 12,488
FIRE, Professional Services and Information 60,816 50,846 54,826 Finance, Insurance and Real Estate 14,319 8,939 9,605 Professional Services 17,322 15,373 17,052 Information and Digital Media 4,977 3,992 4,321 Business and Other Services 24,198 22,542 23,848
Total 169,821 156,312 164,194
SOURCE: ECONOVUE
Source: Business Times – March 30-April 5, 2012
In Oakland, jobs in many sectors are
beginning to recover, but professional jobs,
particularly in finance, insurance and real
estate remain profoundly depressed.
CITY OF OAKLAND ECONOMIC INDICATORS 9
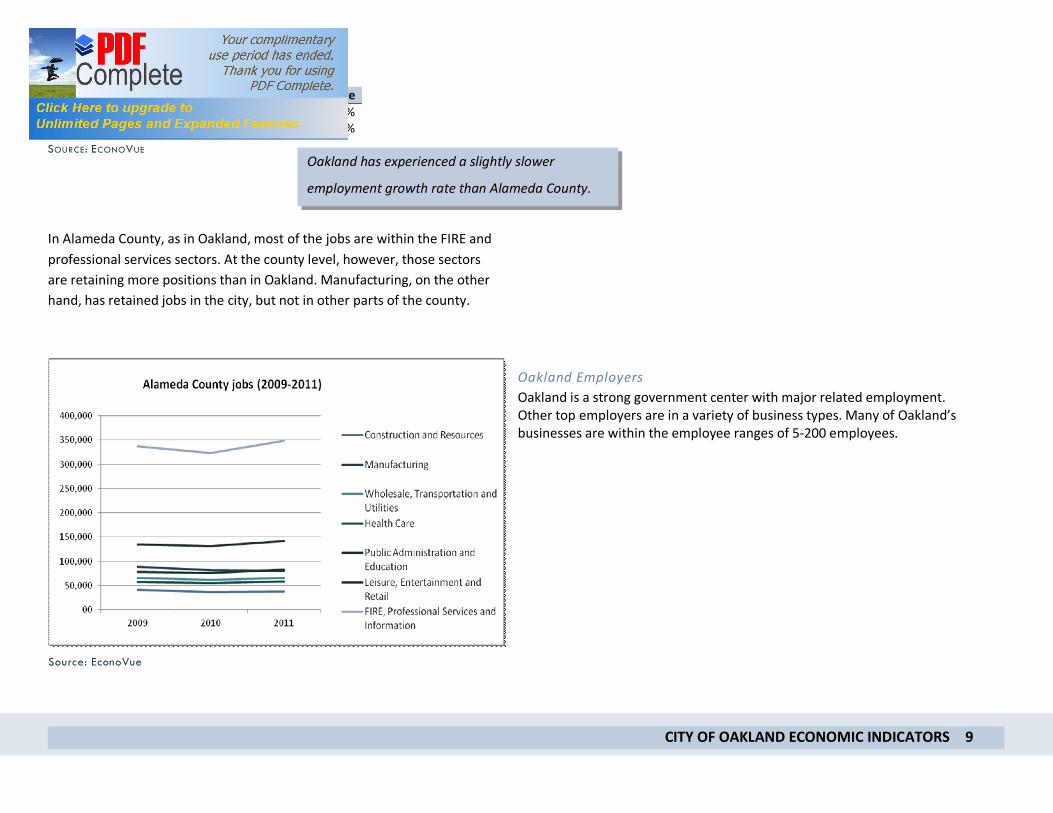
In Alameda County, as in Oakland, most of the jobs are within the FIRE and professional services sectors. At the county level, however, those sectors are retaining more positions than in Oakland. Manufacturing, on the other hand, has retained jobs in the city, but not in other parts of the county.
Oakland Employers Oakland is a strong government center with major related employment. Other top employers are in a variety of business types. Many of Oakland’s businesses are within the employee ranges of 5-200 employees.
Jobs 2010 2011 % Change Oakland 156,312 164,194 5.0% Alameda County 604,349 639,544 5.8% SOURCE: ECONOVUE
Source: EconoVue
Oakland has experienced a slightly slower
employment growth rate than Alameda County.
CITY OF OAKLAND ECONOMIC INDICATORS 10
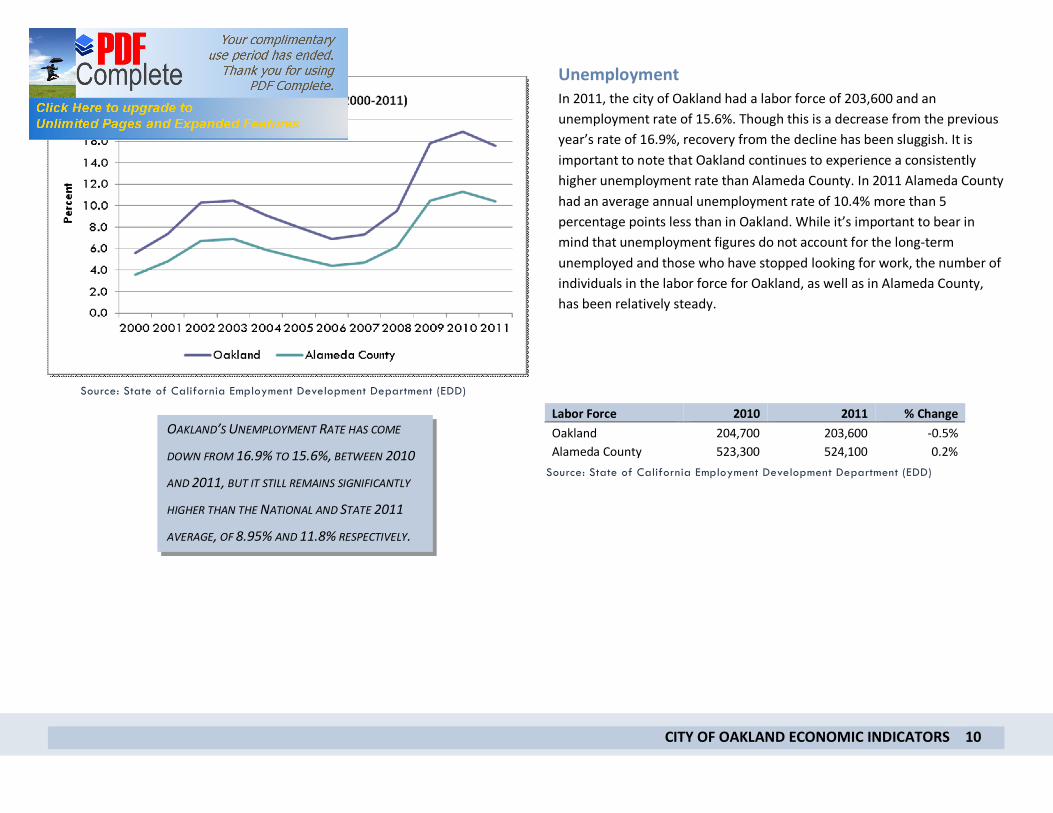
Unemployment In 2011, the city of Oakland had a labor force of 203,600 and an unemployment rate of 15.6%. Though this is a decrease from the previous year’s rate of 16.9%, recovery from the decline has been sluggish. It is important to note that Oakland continues to experience a consistently higher unemployment rate than Alameda County. In 2011 Alameda County had an average annual unemployment rate of 10.4% more than 5 percentage points less than in Oakland. While it’s important to bear in mind that unemployment figures do not account for the long-term unemployed and those who have stopped looking for work, the number of individuals in the labor force for Oakland, as well as in Alameda County, has been relatively steady.
Labor Force 2010 2011 % Change Oakland 204,700 203,600 -0.5% Alameda County 523,300 524,100 0.2%
OAKLAND’S UNEMPLOYMENT RATE HAS COME
DOWN FROM 16.9% TO 15.6%, BETWEEN 2010
AND 2011, BUT IT STILL REMAINS SIGNIFICANTLY
HIGHER THAN THE NATIONAL AND STATE 2011
AVERAGE, OF 8.95% AND 11.8% RESPECTIVELY.
Source: State of California Employment Development Department (EDD)
Source: State of California Employment Development Department (EDD)

CITY OF OAKLAND ECONOMIC INDICATORS 11
Targeted Sectors
The City is focusing its business retention, expansion and attraction efforts on the economic sectors which are most dynamic- contributing revenue, jobs, “cache” and/or helping strengthen other parts of the City’s economic base. These include: • Food & Beverage • Wellness/Healthcare • Green/Clean Technology/ Green Building • International Trade/Goods Movement • The Creative Economy, comprised of:
1. Technology and its “ecosystem” of software, hardware, social media, communications innovations, including accompanying technical design and engineering activities; and
2. Custom, Advanced and Artisan Production and Industrial Arts, Print, Film & Photography, related Mechanical Design & Engineering, Interior Design and Fabrication, Architecture and Urban Design
As the City builds its partnership with cluster businesses, it is expected that collaborative public/private partnerships will form to foster and grow the social capital and shared learning of sector businesses. The support of the City as a participant in the growth of these clusters will boost social capital and networking, thereby boost innovation and lead to the expansion and generation of new Oakland-based businesses in this field.
CITY OF OAKLAND ECONOMIC INDICATORS 12
Certified Green Businesses in Oakland
0
20
40
60
80
100
120
140
2005 2006 2007 2008 2009 2010 2011
Num
ber o
f Gre
en B
usin
esse
s
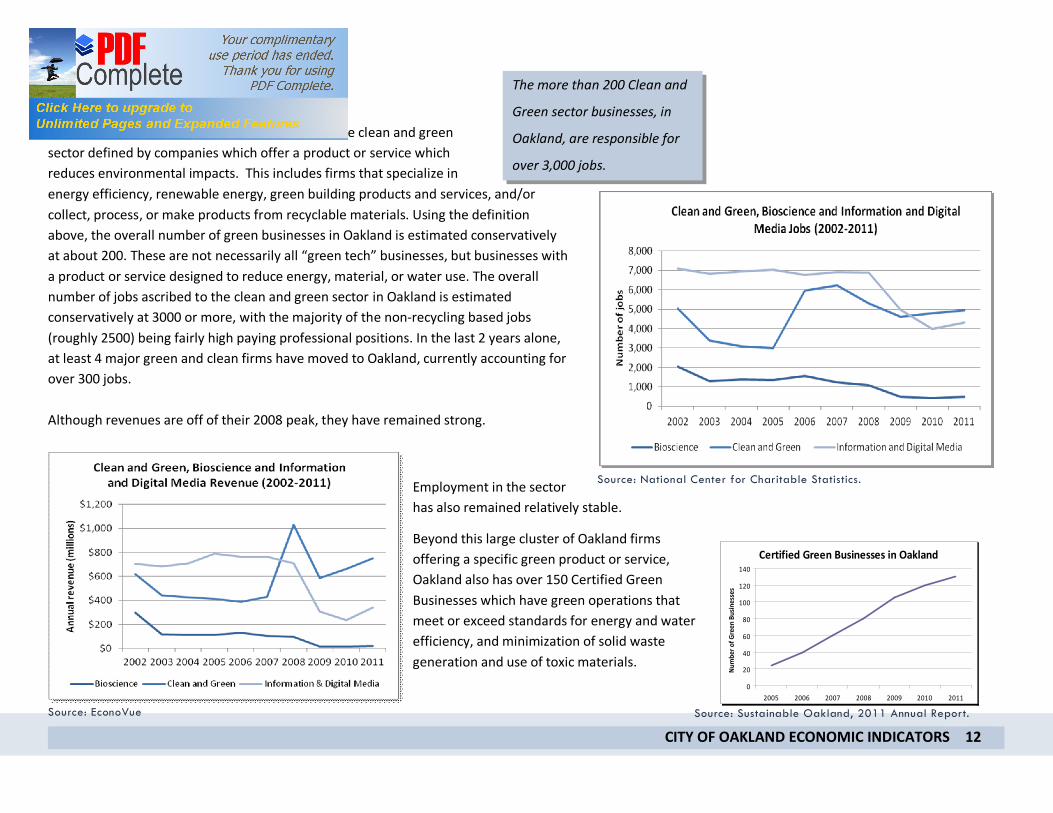
The more than 200 Clean and
Green sector businesses, in
Oakland, are responsible for
over 3,000 jobs.
Sector Spotlight
A strong clean and green economy One of the bright lights in Oakland’s economy is the clean and green sector defined by companies which offer a product or service which reduces environmental impacts. This includes firms that specialize in energy efficiency, renewable energy, green building products and services, and/or collect, process, or make products from recyclable materials. Using the definition above, the overall number of green businesses in Oakland is estimated conservatively at about 200. These are not necessarily all “green tech” businesses, but businesses with a product or service designed to reduce energy, material, or water use. The overall number of jobs ascribed to the clean and green sector in Oakland is estimated conservatively at 3000 or more, with the majority of the non-recycling based jobs (roughly 2500) being fairly high paying professional positions. In the last 2 years alone, at least 4 major green and clean firms have moved to Oakland, currently accounting for over 300 jobs. Although revenues are off of their 2008 peak, they have remained strong.
Employment in the sector has also remained relatively stable.
Beyond this large cluster of Oakland firms offering a specific green product or service, Oakland also has over 150 Certified Green Businesses which have green operations that meet or exceed standards for energy and water efficiency, and minimization of solid waste generation and use of toxic materials.
Source: National Center for Charitable Statistics.
Source: Sustainable Oakland, 2011 Annual Report. Source: EconoVue
CITY OF OAKLAND ECONOMIC INDICATORS 13
Real Estate
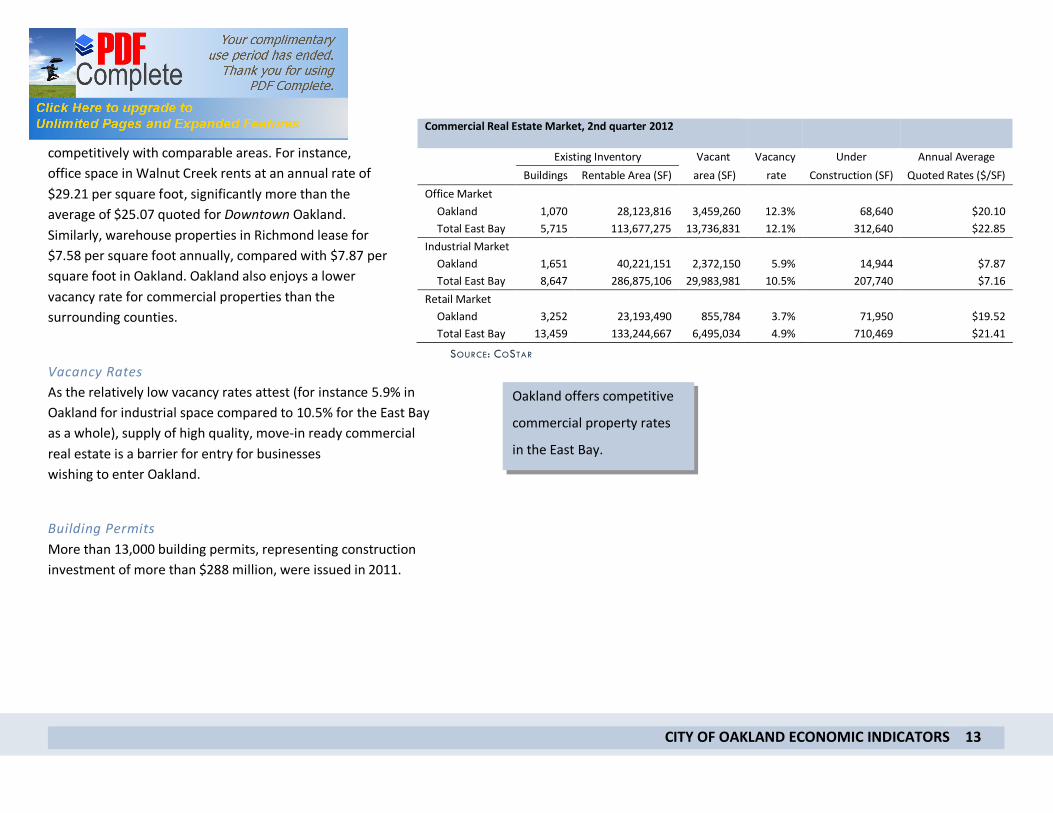
Commercial properties for lease Commercial real estate in Oakland is priced competitively with comparable areas. For instance, office space in Walnut Creek rents at an annual rate of $29.21 per square foot, significantly more than the average of $25.07 quoted for Downtown Oakland. Similarly, warehouse properties in Richmond lease for $7.58 per square foot annually, compared with $7.87 per square foot in Oakland. Oakland also enjoys a lower vacancy rate for commercial properties than the surrounding counties.
Vacancy Rates As the relatively low vacancy rates attest (for instance 5.9% in Oakland for industrial space compared to 10.5% for the East Bay as a whole), supply of high quality, move-in ready commercial real estate is a barrier for entry for businesses wishing to enter Oakland.
Building Permits More than 13,000 building permits, representing construction investment of more than $288 million, were issued in 2011.
SOURCE: COSTAR
Commercial Real Estate Market, 2nd quarter 2012
Existing Inventory Vacant Vacancy Under Annual Average Buildings Rentable Area (SF) area (SF) rate Construction (SF) Quoted Rates ($/SF)
Office Market Oakland 1,070 28,123,816 3,459,260 12.3% 68,640 $20.10 Total East Bay 5,715 113,677,275 13,736,831 12.1% 312,640 $22.85
Industrial Market Oakland 1,651 40,221,151 2,372,150 5.9% 14,944 $7.87 Total East Bay 8,647 286,875,106 29,983,981 10.5% 207,740 $7.16
Retail Market Oakland 3,252 23,193,490 855,784 3.7% 71,950 $19.52 Total East Bay 13,459 133,244,667 6,495,034 4.9% 710,469 $21.41
Oakland offers competitive
commercial property rates
in the East Bay.
CITY OF OAKLAND ECONOMIC INDICATORS 14
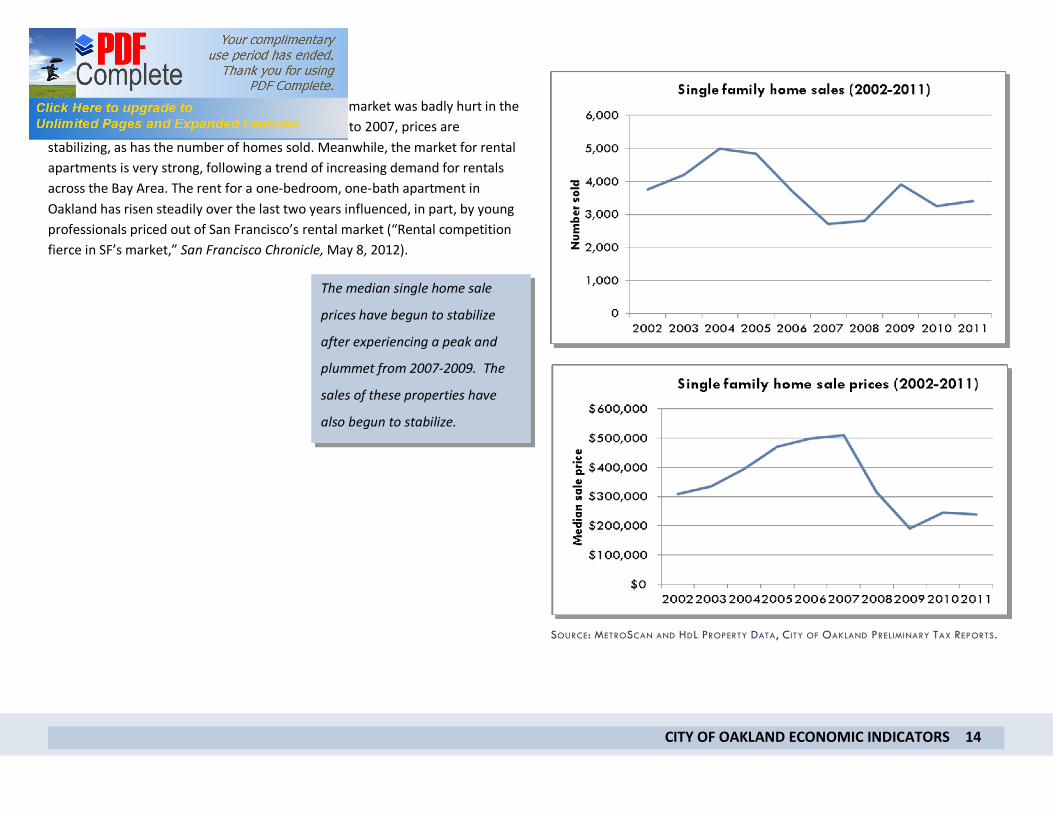
Residential property sales As in the rest of the country, Oakland’s residential market was badly hurt in the economic downturn. After plummeting from 2005 to 2007, prices are stabilizing, as has the number of homes sold. Meanwhile, the market for rental apartments is very strong, following a trend of increasing demand for rentals across the Bay Area. The rent for a one-bedroom, one-bath apartment in Oakland has risen steadily over the last two years influenced, in part, by young professionals priced out of San Francisco’s rental market (“Rental competition fierce in SF’s market,” San Francisco Chronicle, May 8, 2012).
SOURCE: METROSCAN AND HDL PROPERTY DATA, CITY OF OAKLAND PRELIMINARY TAX REPORTS.
SOURCE: METROSCAN AND HDL PROPERTY DATA, CITY OF OAKLAND PRELIMINARY TAX REPORTS.
The median single home sale
prices have begun to stabilize
after experiencing a peak and
plummet from 2007-2009. The
sales of these properties have
also begun to stabilize.
CITY OF OAKLAND ECONOMIC INDICATORS 15
Residents
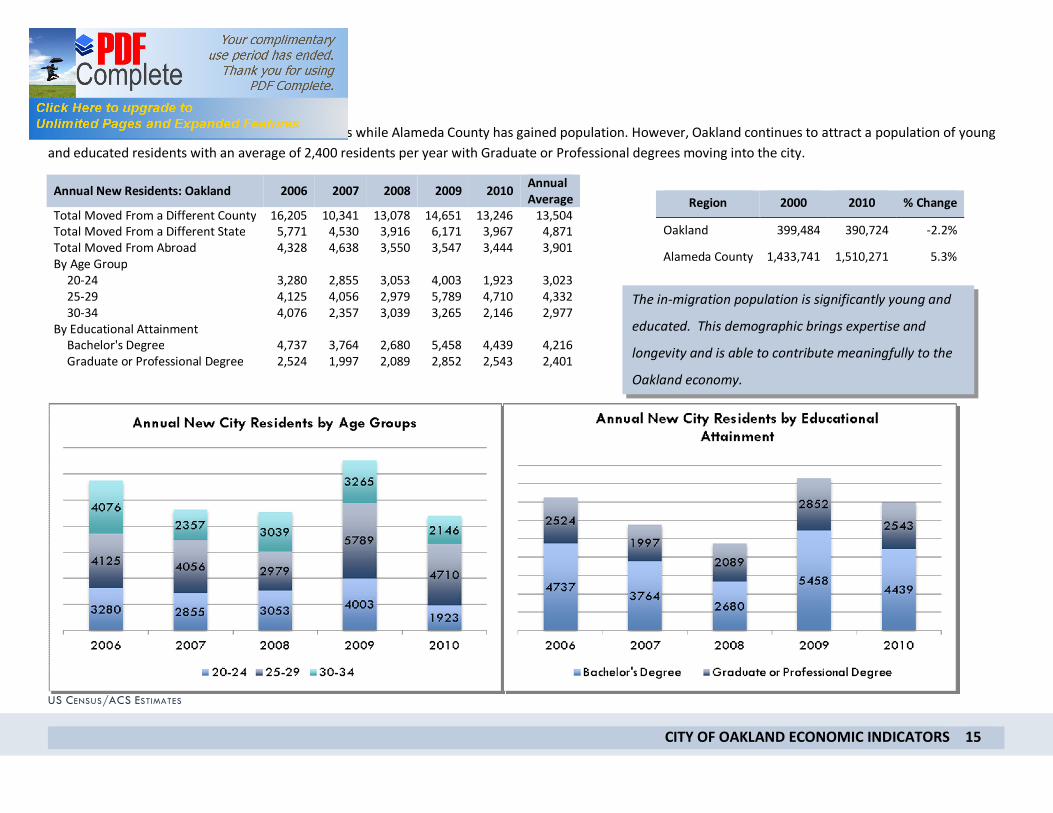
Population Over the past ten years, Oakland has lost residents while Alameda County has gained population. However, Oakland continues to attract a population of young and educated residents with an average of 2,400 residents per year with Graduate or Professional degrees moving into the city.
Annual New Residents: Oakland 2006 2007 2008 2009 2010 Annual Average
Total Moved From a Different County 16,205 10,341 13,078 14,651 13,246 13,504 Total Moved From a Different State 5,771 4,530 3,916 6,171 3,967 4,871 Total Moved From Abroad 4,328 4,638 3,550 3,547 3,444 3,901 By Age Group
20-24 3,280 2,855 3,053 4,003 1,923 3,023 25-29 4,125 4,056 2,979 5,789 4,710 4,332 30-34 4,076 2,357 3,039 3,265 2,146 2,977
By Educational Attainment Bachelor's Degree 4,737 3,764 2,680 5,458 4,439 4,216 Graduate or Professional Degree 2,524 1,997 2,089 2,852 2,543 2,401
US CENSUS/ACS ESTIMATES
Region 2000 2010 % Change
Oakland 399,484 390,724 -2.2%
Alameda County 1,433,741 1,510,271 5.3%
The in-migration population is significantly young and
educated. This demographic brings expertise and
longevity and is able to contribute meaningfully to the
Oakland economy.
CITY OF OAKLAND ECONOMIC INDICATORS 16
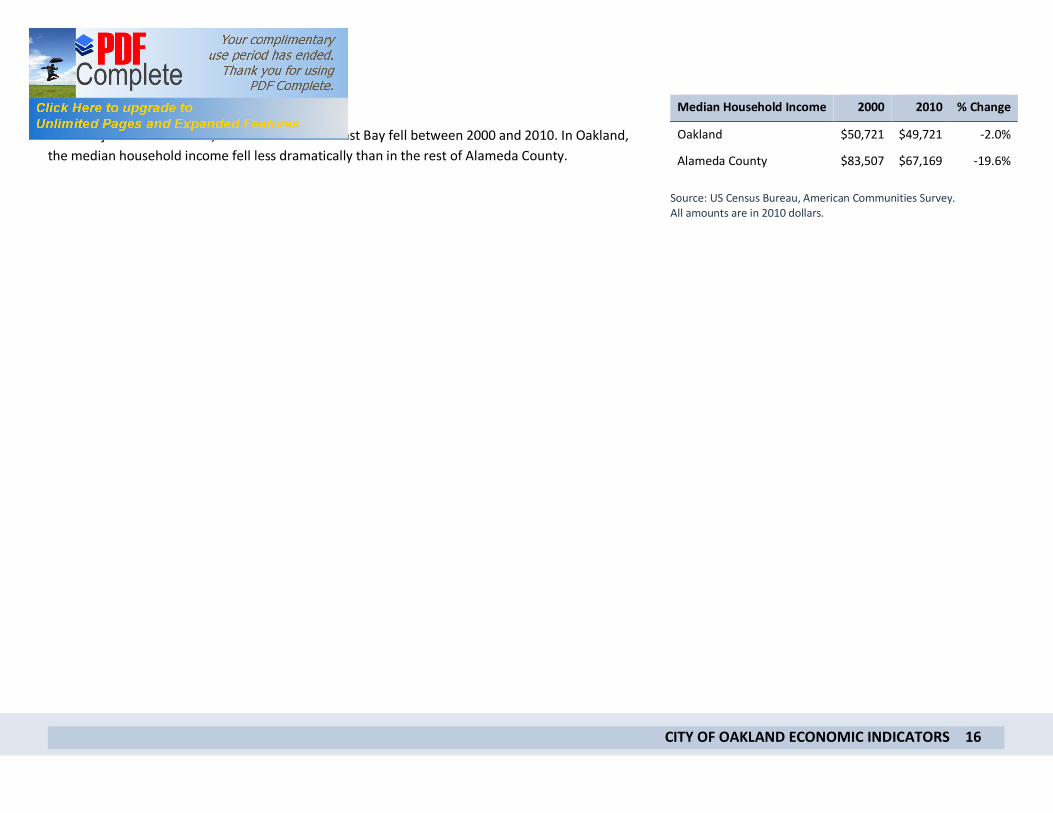
Income When adjusted for inflation, incomes across the East Bay fell between 2000 and 2010. In Oakland, the median household income fell less dramatically than in the rest of Alameda County.
Median Household Income 2000 2010 % Change
Oakland $50,721 $49,721 -2.0%
Alameda County $83,507 $67,169 -19.6%
Source: US Census Bureau, American Communities Survey. All amounts are in 2010 dollars.


