+ All Categories
Home > Documents > ECONOMIC INDICATORS Jobs and Earnings Trends in Ohio

ECONOMIC INDICATORS Jobs and Earnings Trends in Ohio

Date post: 11-Feb-2022
Category:
Upload: others
View: 3 times
Download: 0 times
Share this document with a friend
52
ECONOMIC INDICATORS Jobs and Earnings Trends in Ohio Counties Third Quarter 2010 Update Ohio Loses 586,593 Jobs during 2000s Recession through Late 2010; 10.9% of Ohio Jobs Gone A Catastrophic -33.6% of Ohio’s High Wage Manufacturing Jobs Vanish in Nine Years -$17.7 Billion in Annual Ohio Paycheck Earnings Disappear 32 Ohio Counties Lose More than One-Seventh of Their Jobs But, a Slow Recovery Finally Starts during 3Q 2010 Ohio Gains 1,150 Jobs during 3Q 2010 Ohio Gains 12,605 Manufacturing Jobs during 3Q 2010 By George Zeller Economic Research Analyst May 2011 Summary The lengthy 2000s recession has been extraordinarily damaging in Ohio. The state’s loss of 586,593 jobs between 2000 and 201- represented a -10.9% decline in the state’s employment. That employment loss caused an annual loss in annual Ohio paycheck earnings of -$17.7 billion. The United States gained jobs during this period until national job losses started in 2008, so Ohio trailed national trends badly. The recession was driven primarily by manufacturing job losses. Ohio lost a staggering -33.6% of its high wage Manufacturing employment in just nine years between 2001 and 2010. In 59 of the state’s 88 counties and in all of its large urban counties, more than a fifth of all high wage manufacturing jobs disappeared during the 2000s recession. More than one third of all Manufacturing jobs vanished during this period in 42 of Ohio’s 88 counties. These mammoth Manufacturing losses rippled widely through the rest of the Ohio economy, causing losses in a large majority of the state’s other industries. A small number of industries bucked this highly negative trend, notably Health Care and Social Assistance, where employment increased by 20% despite the extremely severe statewide labor market recession. Job losses of this magnitude were extraordinarily damaging to Ohio workers and their families. During most of the 2000s recession, average paycheck earnings of surviving jobs actually increased in most Ohio industries, even when adjusted for inflation. But, that situation reversed itself in 2008, when average job earnings in Ohio fell sharply to a level lower than what was generated by the average Ohio job in 2000. This report updates findings with new data that that are now available through the third quarter of 2010. In the new data, Ohio finally stopped losing jobs, albeit barely, with a small increase of 1,150 jobs between 2009 and 2010 during the third quarter. An additional gain during the third quarter of 2010 of 5,703 Federal agency jobs moved Ohio’s total job increase to 6,853 jobs when the Federal agency jobs are included. The situation in Cuyahoga County was similar. During the first quarter 2009 employment loss in Cuyahoga County was an additional -24,060 lost jobs. The same figure during the second quarter of 2009 was an additional loss of -11,320 Cuyahoga County jobs. But, during the third quarter of 2009
Transcript

ECONOMIC INDICATORS

Jobs and Earnings Trends in Ohio CountiesThird Quarter 2010 Update

Ohio Loses 586,593 Jobs during 2000s Recession through Late 2010; 10.9% of Ohio Jobs GoneA Catastrophic -33.6% of Ohio’s High Wage Manufacturing Jobs Vanish in Nine Years

-$17.7 Billion in Annual Ohio Paycheck Earnings Disappear32 Ohio Counties Lose More than One-Seventh of Their Jobs

But, a Slow Recovery Finally Starts during 3Q 2010Ohio Gains 1,150 Jobs during 3Q 2010

Ohio Gains 12,605 Manufacturing Jobs during 3Q 2010

By George ZellerEconomic Research Analyst

May 2011

Summary

The lengthy 2000s recession has been extraordinarily damaging in Ohio. The state’s loss of 586,593jobs between 2000 and 201- represented a -10.9% decline in the state’s employment. That employment loss caused an annual loss in annual Ohio paycheck earnings of -$17.7 billion. The United States gained jobs during this period until national job losses started in 2008, so Ohio trailed national trends badly. The recession was driven primarily by manufacturing job losses. Ohio lost a staggering -33.6% of its high wage Manufacturing employment in just nine years between 2001 and 2010. In 59 of the state’s 88 counties and in all of its large urban counties, more than a fifth of all high wage manufacturing jobs disappeared during the 2000s recession. More than one third of all Manufacturing jobs vanished during this period in 42 of Ohio’s 88 counties. These mammoth Manufacturing losses rippled widely through the rest of the Ohio economy, causing losses in a large majority of the state’s other industries.

A small number of industries bucked this highly negative trend, notably Health Care and Social Assistance, where employment increased by 20% despite the extremely severe statewide labor marketrecession.

Job losses of this magnitude were extraordinarily damaging to Ohio workers and their families. During most of the 2000s recession, average paycheck earnings of surviving jobs actually increased in most Ohio industries, even when adjusted for inflation. But, that situation reversed itself in 2008, when average job earnings in Ohio fell sharply to a level lower than what was generated by the average Ohio job in 2000. This report updates findings with new data that that are now available through the thirdquarter of 2010. In the new data, Ohio finally stopped losing jobs, albeit barely, with a small increase of 1,150 jobs between 2009 and 2010 during the third quarter. An additional gain during the third quarter of 2010 of 5,703 Federal agency jobs moved Ohio’s total job increase to 6,853 jobs when the Federal agency jobs are included.

The situation in Cuyahoga County was similar. During the first quarter 2009 employment loss in Cuyahoga County was an additional -24,060 lost jobs. The same figure during the second quarter of 2009 was an additional loss of -11,320 Cuyahoga County jobs. But, during the third quarter of 2009

Cuyahoga County lost only 50 nonfederal jobs. But, when a gain of 779 Federal agency jobs in Cuyahoga County is considered, Cuyahoga County actually gained 729 jobs between the third quarter of 2009 and the third quarter of 2010. But, all of that net gain was accounted for by Federal agency employment alone.

There is no question that the 2000s recession deepened sharply in 2008 within Ohio, with both employment and mean earnings falling sharply. Every one of Ohio’s 88 counties lost employment during 2009. But, in 2009, despite the large job loss in Ohio, the mean earnings of a surviving Ohio job actually increased by 0.8% in 2009, returning average job earnings in Ohio to a level 0.3% above the same inflation-adjusted level that Ohio jobs paid in 2000.

Then, in the new data for the third quarter of 2010, employment levels actually increased relative to the third quarter of 2009 in 47 of Ohio’s 88 counties. The increases were heavily concentrated in only seven counties that gained over 1,000 jobs each over the year between the third quarters of 2009-2010. Those five counties were Delaware, Trumbull, Sandusky, Hancock Butler, Wood, and Mercer.

Among Ohio’s largest urban counties, only Lucas, Lorain, Stark, and Franklin registered small nonfederal job increases between the third quarter of 2009 and 2010.

The most positive news in the new data for the third quarter of 2010 is that the tiny job recovery in Ohio was driven by increases in high wage Manufacturing jobs. Ohio gained 12,605 Manufacturing jobs between the third quarters of 2009 and 2010, an increase of 2%. Of Ohio’s 88 counties, 59 registered increases in Manufacturing jobs in the new data. Prominent exceptions were unfortunately Hamilton (Cincinnati) and Franklin (Columbus) counties that continue to lose Manufacturing jobs on a year over year basis through the third quarter of 2010.

The fact that Ohio finally stopped losing jobs and blue collar Manufacturing jobs during the third quarter of 2010 is exceptionally good news. But, the statewide increase was less than one tenth of one percent with a gain of only 1,150 jobs statewide.

This very slow recovery still leaves Ohio’s employment level well below where it was during the third quarter of 2000, the last period of time when Ohio gained any significant level of employment.

Since 2000, Ohio still has lost 586,593 jobs as a result of the 2000-2011 recession in the Ohio labor market. The loss was -10.9% of Ohio’s 2000 employment level.

A corresponding increase in aggregate paycheck earnings was faster than the 2009-2011 job growth. Ohio gained $1.2 billion in paychecks between the third quarters of 2009 and 2010. That one year increase was 2.5%. The growth in paychecks was widely distributed across Ohio, with 71 of the 88 counties enjoying a one year increase. The worst exception was Clinton County in the Wilmington area where total paycheck earnings fell by -20.4%.

The very welcome gain of both jobs and paycheck earnings in Ohio during the third quarter of 2010 is extremely good news. But, the size of the gains was small. It did not make up for large prior losses in both employment and earnings in the state.

Since 2000, Ohio has still lost -586,593 jobs, a decline of -10.9%. The simultaneous 2000-2010 loss in annualized paycheck earnings fell slightly over the year between 2009 and 2010, but it remains a very large loss of -$17.72 billion, or 8.4% of the earnings that Ohio had in 2000. That loss of nearly $18billion in Ohio payroll has been catastrophic. In Cuyahoga County alone, the annual loss in paycheck earnings was a very alarming $5.17 billion or 14.5% of Cuyahoga County’s total 2000 paycheck earnings. A large fraction of that loss took place in only one year between 2007 and 2008 as a result of the deep statewide and worldwide recession. But, other years also registered losses prior to the 2.6% increase that Cuyahoga County experienced between the third quarters of 2009 and 2010.

Overall, the end of additional job losses across almost all of Ohio during the third quarter of 2010 is extremely good news. But, the speed of the recovery is still extremely slow. The fact that much of the recovery is finally in Manufacturing is a very positive development.

But, the recovery is still not universal among Ohio’s firms and industries. In a very unusual development, both Cuyahoga County and Ohio lost jobs in Finance and Insurance between the third quarters of 2009 and 2010. Cuyahoga County’s loss of -1,198 Finance and Insurance jobs while it simultaneously gained 1,729 Manufacturing jobs is a highly unusual trend. A similar trend is evident in the statewide Ohio data. The state gained 12,605 Manufacturing jobs during the past year while it simultaneously lost -2,828 jobs in Finance and Insurance. The impact of the worldwide financial crisis is still influencing the trend in Ohio jobs and paychecks.

One industry in Ohio actually grew during the 2000s recession and also during the past year in the new data for 2009-2010. That industry is Health Care and Social Assistance. The Health Services industry added 12,427 jobs during the past year for an increase of 1.7%. That increased its 2001-2010 growth to a very large 121,401 jobs with a growth rate of 20% over nine years. Cuyahoga County alone added 19,892 Health Services jobs between 2001 and 2010. That generated growth of 19.6%, a figure slightly below the statewide Ohio growth rate in Health Services employment of 20%.

The date in this report from the complete count of Ohio jobs is always delayed by several months behind real time. Unfortunately, it is known that additional job destruction has taken place since the third quarter of 2010 across Ohio. New claims for unemployment were filed in Ohio on a highly elevated basis during all weeks of February, March, and April 2011. During the last two weeks of April those layoff figures grew at an alarmingly rapid rate. As a result, the data in this report slightly underestimate the local impact of the 2000-2011 recession in Ohio.

Nevertheless, a definitive measure that shows with certainty that Ohio stopped losing employment during the third quarter of 2010 is extremely good news. The fact that payroll earnings are also increasing across the state following a decade of declines is also an extremely positive development. But, the good news remains uneven, tenuous, and weak. Ohio will need many years of strong growth, particularly in Manufacturing employment, if the remaining large 2000-2010 deficits in Ohio employment and paycheck earnings are to be eliminated.

Definitions

Employment is measured in this report by the QCEW Quarterly Census of Employment and wagescomplete count of jobs released by the Ohio Department of Jobs and Family Services under contract to

the United States Department of Labor. Formerly known as the ES-202 series, these data are extracted from the unemployment insurance database. Although they are subject to a real time delay of at leastsix months prior to their release, they represent by far the most comprehensive and precise count of employment and aggregate earnings in all Ohio private sector firms. The data are reported for all 88 counties in Ohio.

Aggregate paycheck earnings are also from the QCEW complete count of earnings. In this report they are presented in real inflation-adjusted September 2010 dollars for the third quarter of all years. The inflation adjustment is from the Consumer Price Index.

The National Bureau of Economic Research has determined that the United States economy was in recession between March 2001 and November 2001. Thus, at the national level the duration of the 2000s recession was quite brief. But, in the state of Ohio sustained employment losses associated with the 2000s recession as early as July 2000. Those continual employment losses have continued through 2009. In Ohio’s labor market the duration of the 2000s recession now exceeds eight years, as measured by continual declines in total employment within the state. With a declaration by the National Bureau of Economic Research that the United States officially was in recession during 2008-2010 until the end of the deepest recession since the 1930s during June 2009. That very deep national recession increased the damage from the lengthy 2000s recession within Ohio’s labor market.

Employment losses in Ohio have of course been associated with payroll earnings losses for workers.This report measures the size of both employment losses and earnings losses during the lengthy 2000s recession in Ohio.

Since QCEW data from the complete count of jobs are not seasonally adjusted, data in this report omit employment and earnings losses within industrial categories that took place during 2000. In all NAICS industries, which do not provide data prior to 2001, this report also omits employment trends in Ohio prior to the third quarter of 2000. This new report updates the trend through newly available data for the third quarter of 2010.

Data suppression. In order to maintain the confidentiality of data for individual firms, for decades the QCEW complete count of jobs data have been suppressed within some industries in small counties. In instances where there are only one or two firms in a given industry within a county, or in cases where one single firm dominates a large majority of the market in that industry within a county, then QCEW data for certain industries in such counties have always been suppressed. This is done so that employment and earnings data for individual firms cannot be identified within QCEW data, so as to maintain the confidentiality of employment and earnings data within firms.

Secondary suppression. Beginning with the data for the first quarter of 2009, the US Bureau of Labor Statistics dramatically increased the level at which it suppresses data within some industries in the QCEW database. BLS is now releasing data in QCEW for a variety of detailed levels within firms, in addition to the data that it has traditionally released for major industrial categories in the North American Industrial Classification System. For example, BLS not only releases data for Health Care and Social Assistance for counties, but it also releases subcategories such as Hospitals, Physicians,Nursing and Residential Care Facilities, Child Day Care Services, and a host of other subcategories. In order to protect confidentiality of individual firms in these industries, BLS has drastically increased the

degree of suppression of data for many small counties, whether or not those counties meet the traditional criteria for data suppression in QCEW. By far the worst negative impact of this counterproductive policy has been greatly increased suppression of data in NAICS industry 26, Health Care and Social Assistance. Beginning with data for the first quarter of 2009, BLS no longer provides any QCEW data for Health Care and Social Assistance in 30 Ohio counties. Such widespread suppression of data within Ohio’s only growing industry was clearly a disservice to the general public by the US Bureau of Labor Statistics. As a result, data within Health Care and Social Assistance are no longer provided in this report for dozens of Ohio counties, including Adams, Ashland, Brown, Carroll, Champaign, Clinton, Crawford, Fayette, Fulton, Gallia, Hardin, Harrison, Highland, Hocking Holmes, Huron, Jefferson, Madison, Meigs, Mercer, Monroe, Morgan, Morrow, Paulding, Perry, Pike, Preble, Sandusky, and Wyandot. This outrageous censorship of previously available data was clearly a substantial blunder by the US Bureau of Labor Statistics. As a result of this blunder, data for these counties are combined into a single figure in this report within Health Care and Social Assistance.

Interpolation of Suppressed Data. Certain other data are also suppressed using traditional privacy criteria in some small counties in various industries. In situations where less than three firms operate in an industry within a county, data have always been suppressed in QCEW for valid confidentiality reasons. In this report, such suppressed data are estimated by interpolation of the data from statewide totals. This causes certain data elements to be less precise than other data in this report. Such interpolations, when evident, are noted at the bottom of this report’s tables. In particular, the estimate for employment and earnings during the third quarter of 2009 may be less accurate than other data in this report within 2007, 2008, and 2009 Manufacturing data in Monroe and Meigs County.

NOTE: Data in Cuyahoga County in Finance and Insurance are distorted by an industrial coding change made by two units of a very large firm in Cleveland during the first quarter of 2007. That firm reclassified those units from Finance and Insurance to Management of Companies and Enterprises. This artificially increased Cuyahoga County losses in Finance and Insurance for that quarter, and thus for the 2001-2007 period, while it artificially elevates growth in Management of Companies and Enterprises within Cuyahoga County. However, the 2008-2010 trend is not impacted by this reclassification of units within one firm.

Tables One through Five and Tables Seven through Eleven in this report are based on nonfederal employment, a standard pattern in data from the Quarterly Census of Employment and Wages. Federal agency employment is tabulated separately in Tables Six and Twelve.

The Data

The National Bureau of Economic Research has determined that the 2000s recession was brief, lasting only from March 2001 to November 2001. In the Ohio labor market that “brief” recession lasted a dramatically longer period of time. Ohio reached a peak of the business cycle expansion in June 2000 at the end of the second quarter. Since June 2000 the labor market in Ohio has suffered sustained continual employment losses. It is now clear from the complete count of employment in Ohio that the state has not seen even one year of significant employment growth between 2000 and 2009. A brief period of apparent stabilization of Ohio employment during the first quarter of 2006 was not sustained during the remainder of that year. Thus, Ohio’s labor market has continually lost employment and

earnings for ten years since the first quarter of 2000. Then, the National Bureau of Economic Research found that a new recession began in December 2007, with an official end in July 2010. That new 2007-2010 national recession was deeper than any prior USA recession since the 1930s. It caused additional plunges in employment and paycheck earnings across Ohio.

Ohio’s level of employment declined dramatically during the period between the third quarter of 2009and the third quarter of 2009. The one year job loss during 3Q 2009 in comparison to 3Q 2008 was 338,824 jobs, or 6.6% of Ohio’s employment in only one year. In stark contrast to the national recession that lasted ten months in 2001 and two and a half years beginning in December 2007, the 2000s recession in Ohio’s employment market lingered more than nine years. Losses of both employment and aggregate paycheck earnings were dramatically more severe and lengthy in Ohio than they have been in the United States as a whole.

The National Bureau of Economic Statistics declared that a new national USA recession began in December 2007. Ohio never recovered from the 2000-2001 national recession, and then it was impacted extremely severely by the 2007-2010 recession.

But, in the new data for 3Q 2010 a more optimistic trend has finally emerged. Between the third quarters of 2009 and 2010, Ohio gained 1,150 nonfederal jobs. When the additional one year gain of 5,703 Ohio jobs in Federal agencies is considered, Ohio’s actual one year increase in employment was 6,853 jobs. While this is very slow growth in comparison with the massive prior losses between 2000 and 2010, it is growth nevertheless. The newly updated measures of Ohio employment finally are not measuring additional losses across the state as a whole.

Total Employment Losses in Ohio

Table One tabulates employment trends in Ohio in third quarter data between 2000 and 2010. Ohio lost 10.9% of its employment during this nine year period. The losses were not continuous on a quarterly basis. The state actually hit an employment trough during the third quarter of 2003, a period of two years following the end of the national recession. But, after tiny and extremely limited growth in 2003-2006 at very slow growth rates of 0.4% in 2004, 0.3% in 2005 and less than 0.1 in 2006, Ohio again began to lose jobs during the third quarter of 2007. The virtually continuous Ohio employmentlosses deepened severely in newly data for the third quarter of 2008 and 2009. But, finally, during the third quarter of 2010 Ohio’s additional job losses from the 2007-2009 recession ceased. The growth of 1,150 nonfederal jobs was very slow growth, but it was growth nevertheless. That extremely positive trend finally ended the huge drops in Ohio employment from the 2000s recession, albeit barely with very slow growth.

Even considering the positive growth seen during the third quarter of 2010, between the third quarters of 2000 and 2010, employment levels have declined in 74 of Ohio’s 88 counties (see Table One). All of the state’s large urban counties suffered employment losses during the 2000s recession in Ohio.Summit County (Akron) had previously avoided job losses during the decade, but a three year job loss of 21,277 jobs in Summit County between 2007 and 2010 pulled Summit County’s current employment level below its number of jobs in 2000.

Among 14 Ohio counties losing more than 10,000 jobs between 3Q 2000 and 3Q 2011, Trumbull County (Warren) suffered the worst percentage loss at 26.2% from a loss of 24,826 jobs. Cuyahoga County (Cleveland) was also hit very hard by the state’s largest numeric loss of 132,762 jobs, which represented 16.5% of Cuyahoga County’s employment ten years ago. Urban employment losses were also severe in Dayton, Springfield, Toledo, Lima, Mansfield, Canton, Youngstown, Cincinnati, and Lorain, where more than a tenth of all local jobs disappeared during the last ten years.

The fourteen Ohio counties that experienced employment growth between 2000 and 2009 were heavily dominated by suburban counties at the fringes of urban areas. Delaware, Warren, Butler, Greene and Medina, counties all generated double-digit employment percentage increases during the ten year period in Ohio. All six of these counties are suburban counties adjacent to Columbus, Cincinnati, Dayton, and Cleveland. As the statewide employment base of Ohio contracted, sprawl development created healthy employment growth in these suburban counties. But, employment levels fell in all threeof these counties in 2009 relative to 2008, as the state lost an enormous 338,824 jobs during that one year period. Astonishingly, all 88 Ohio counties lost employment between 2008 and 2009. Then, during 2010 all of these suburban counties except for Greene returned to one year job growth.

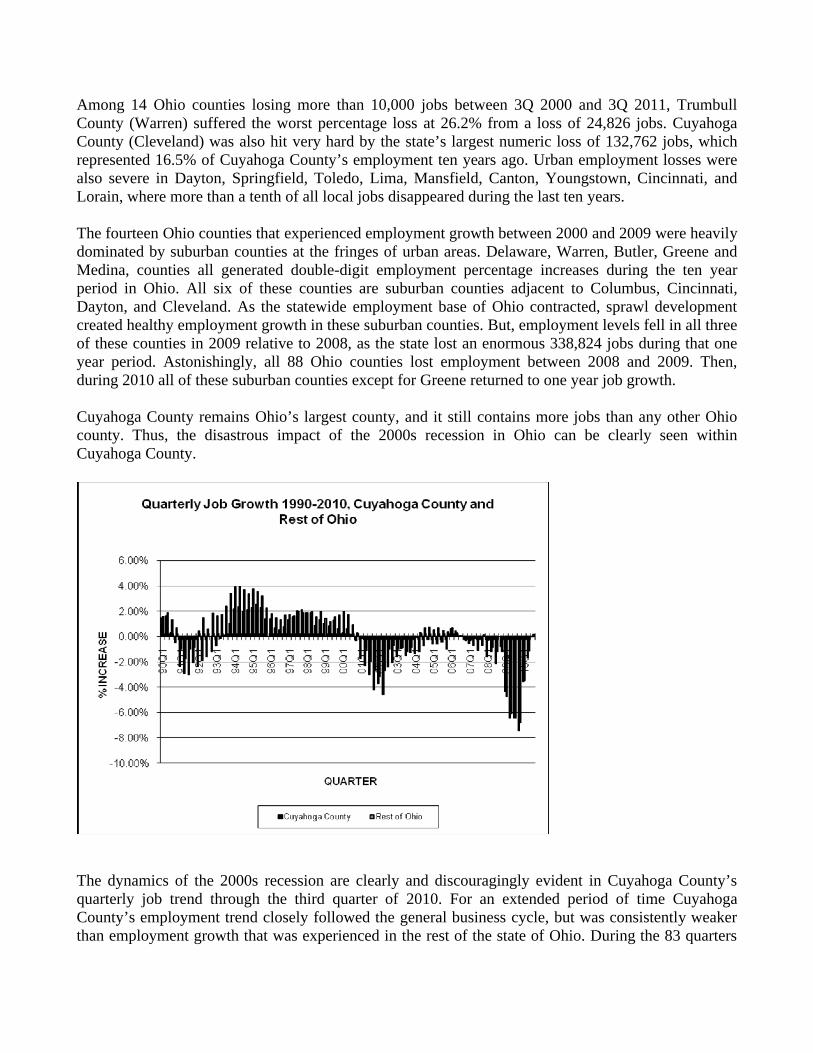
Cuyahoga County remains Ohio’s largest county, and it still contains more jobs than any other Ohio county. Thus, the disastrous impact of the 2000s recession in Ohio can be clearly seen within Cuyahoga County.

The dynamics of the 2000s recession are clearly and discouragingly evident in Cuyahoga County’s quarterly job trend through the third quarter of 2010. For an extended period of time Cuyahoga County’s employment trend closely followed the general business cycle, but was consistently weaker than employment growth that was experienced in the rest of the state of Ohio. During the 83 quarters

since 2000, Cuyahoga County has had only fourteen quarters when its employment growth exceeded the Ohio statewide average. Those robust growth quarters in Cuyahoga County were three of the four 1990 quarters, the third and fourth quarters of 1997, the first quarter of 1998, the second, third, and fourth quarters of 2006, the fourth quarter of 2008, and the first three quarters of 2009. In new data for the third quarter of 2010, Cuyahoga County’s job growth slower than Ohio’s statewide rate of job growth during the most recently available 2008-2009 period. Cuyahoga County lost an additional 6.5% of its employment between the third quarters of 2009 and 2010, a one year loss of 50 nonfederal jobs, while the state of Ohio gained 1,150 nonfederal jobs during the same period, an increase of less than one tenth of one percent. The ongoing 2007-2010 recession is a statewide phenomenon.

The Cuyahoga County graph also clearly illustrates the unfortunate finding that the 2000s recession was considerably deeper and more lengthy than the 1990s recession was in both Ohio and in Cuyahoga County. The 1990s recession lasted less than two years in the Ohio labor market, while the 2000s recession has now extended its duration to ten years in Ohio.

It had appeared during 2004 and 2005 that the 2000s recession might finally be coming to an end within the state of Ohio. The state experienced ten consecutive quarters of employment growth between the second quarter of 2004 and the third quarter of 2006. However, all of those quarterly growth periods generated employment increases of less than seven tenths of one percent on a statewide basis, with most of the quarterly growth figures below five tenths of one percent on a statewide basis. Then, during the fourth quarter of 2006 the state of Ohio again started to lose employment. The state’s lost employment during all subsequent quarters of 2007 and 2008, and again lost employment at an accelerating rate through the second quarter of 2010. The lengthy period of job loss in Ohio finally came to an end during the third quarter of 2010, albeit barely by less than one tenth of one percent.

In Cuyahoga County the excessive employment losses have been nearly continuous since 2000. Except for tiny employment gains of less than 1% during the first, second, and third quarters of 2006 and the third quarter of 2007, Cuyahoga County has generated employment growth below the Ohio statewide average during 66 of the 79 quarters since the third quarter of 2000. The county’s employment loss between the third quarter of 2009 and the third quarter of 2010 was only 50 nonfederal jobs, representing negative growth of -0.0% during the most recent one year period. If a gain of 779 Cuyahoga County jobs in federal agencies is added, then Cuyahoga County actually registered a gain of 829 jobs between the third quarter of 2009 and 2010. While these figures are extremely weak growth, they nevertheless represent growth instead of losses.

Manufacturing Job Losses in Ohio

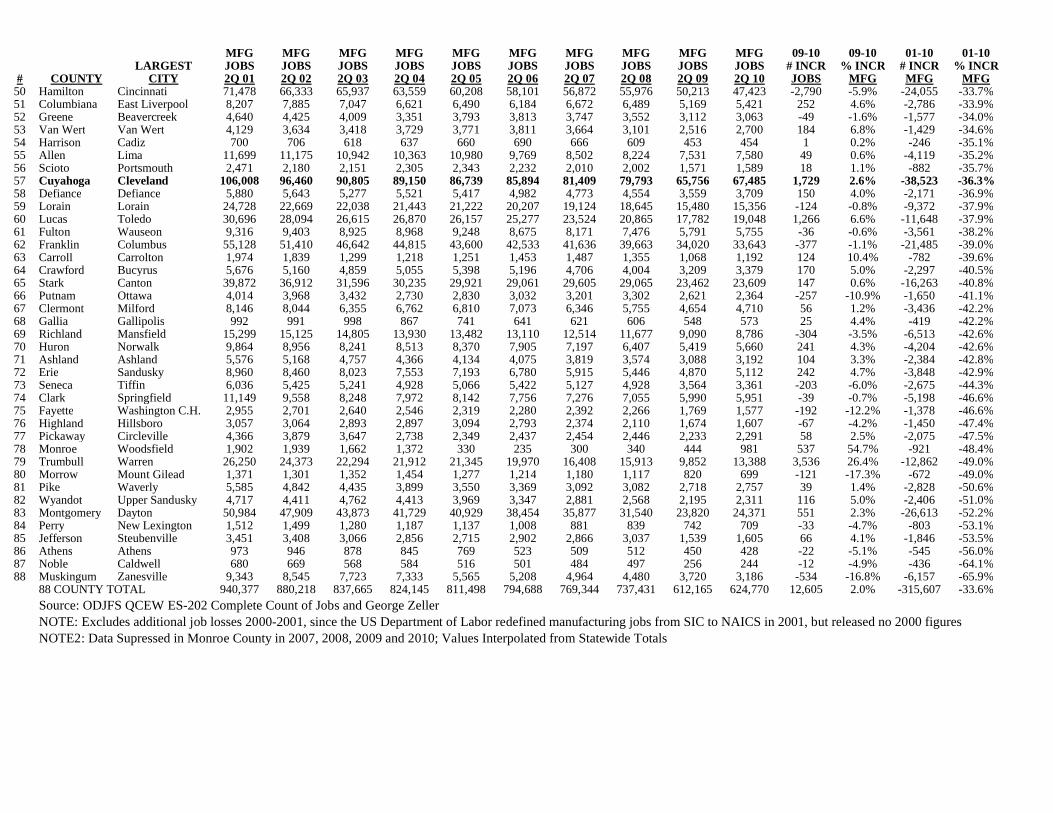
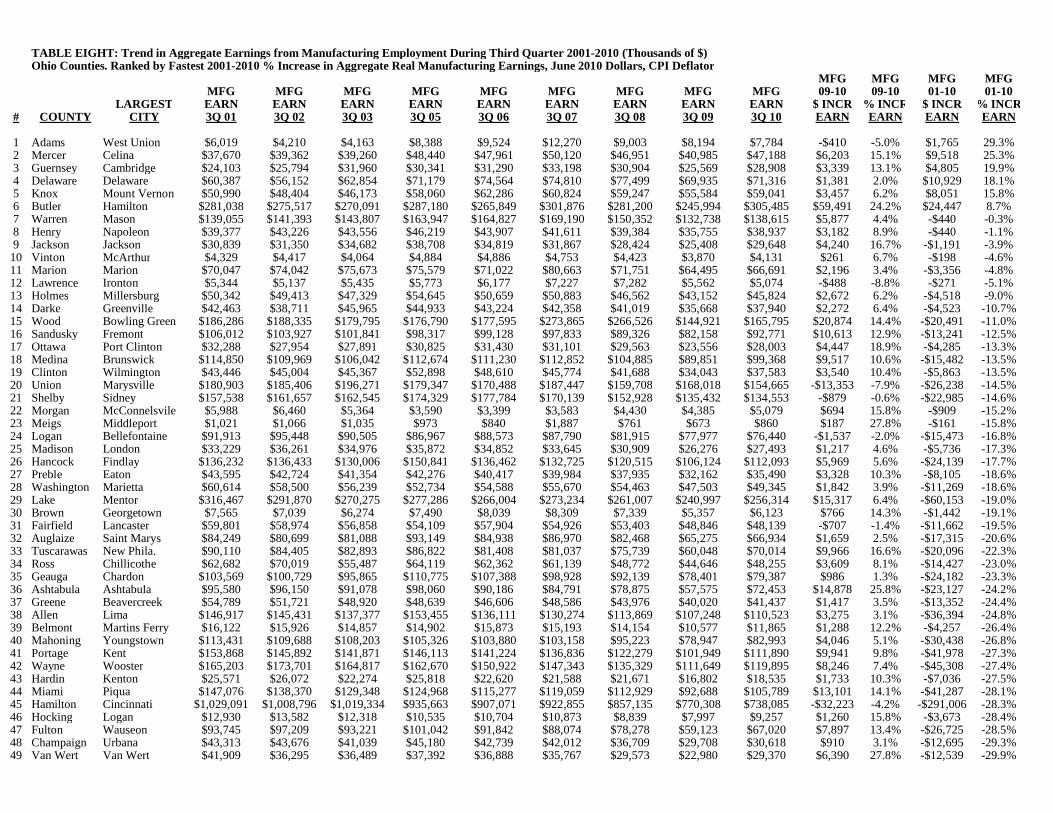
Table Two measures the trend in Manufacturing employment within Ohio’s counties between the thirdquarters of 2001 and 2010. Since the definition of all industrial categories was changed in 2001, this table omits additional Manufacturing job losses that were suffered between 2000 and 2001. The data therefore unfortunately underestimate the magnitude of manufacturing job losses in Ohio during the 2000s recession. Manufacturing employs more Ohio workers than any other industry in the economy, and thus it is the main base of Ohio’s economy, even though the percentage of all Ohio workers employed in Manufacturing fell from 17.3% in 2001 to 13.0% in 2009. The state lost 326,516Manufacturing jobs between the third quarters of 2001 and 2009. That loss represented a startling and

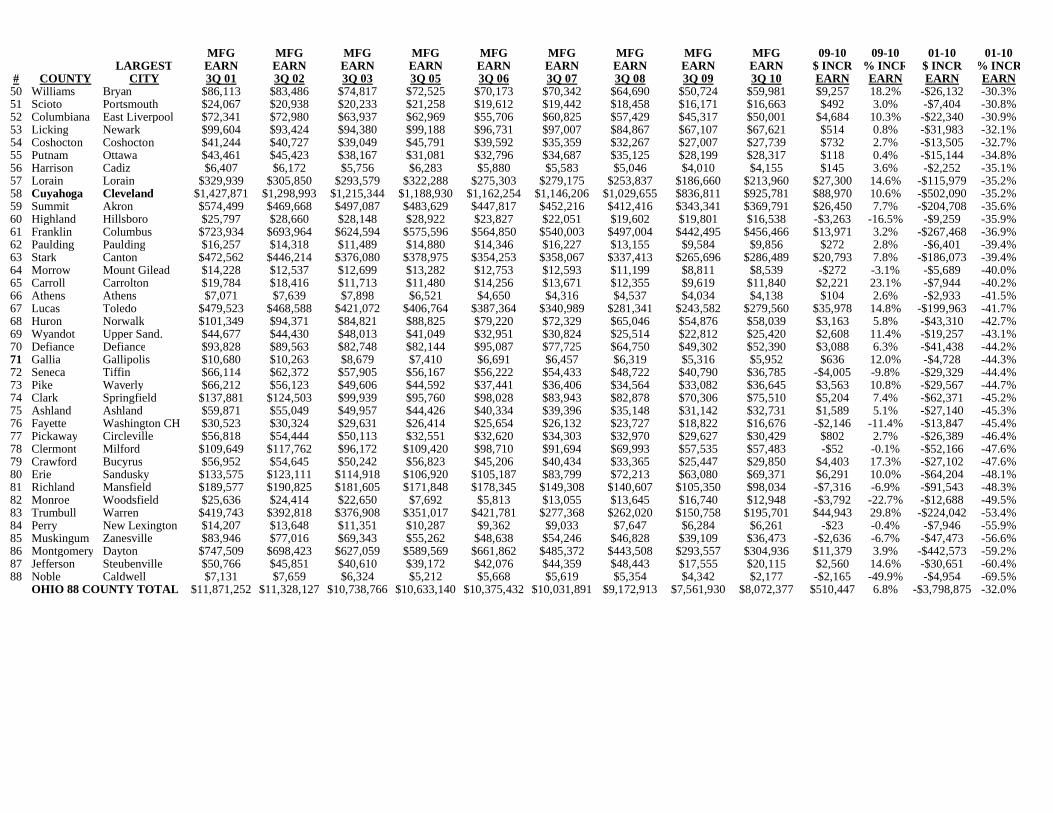
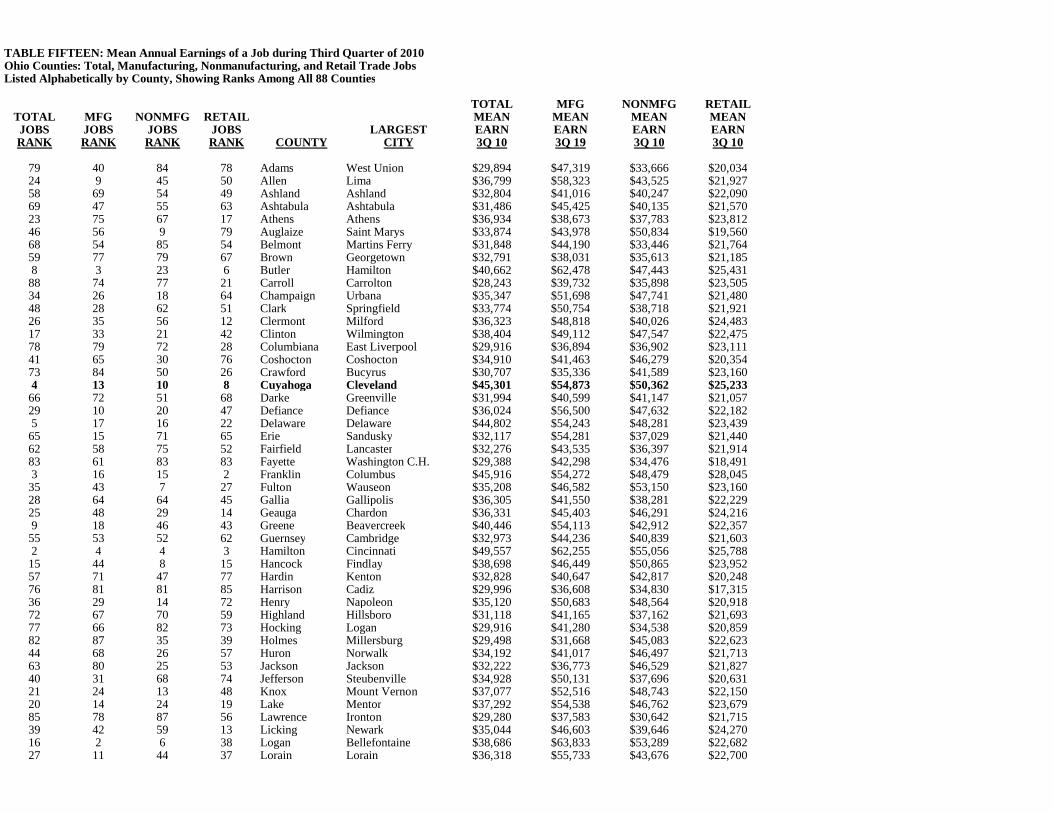
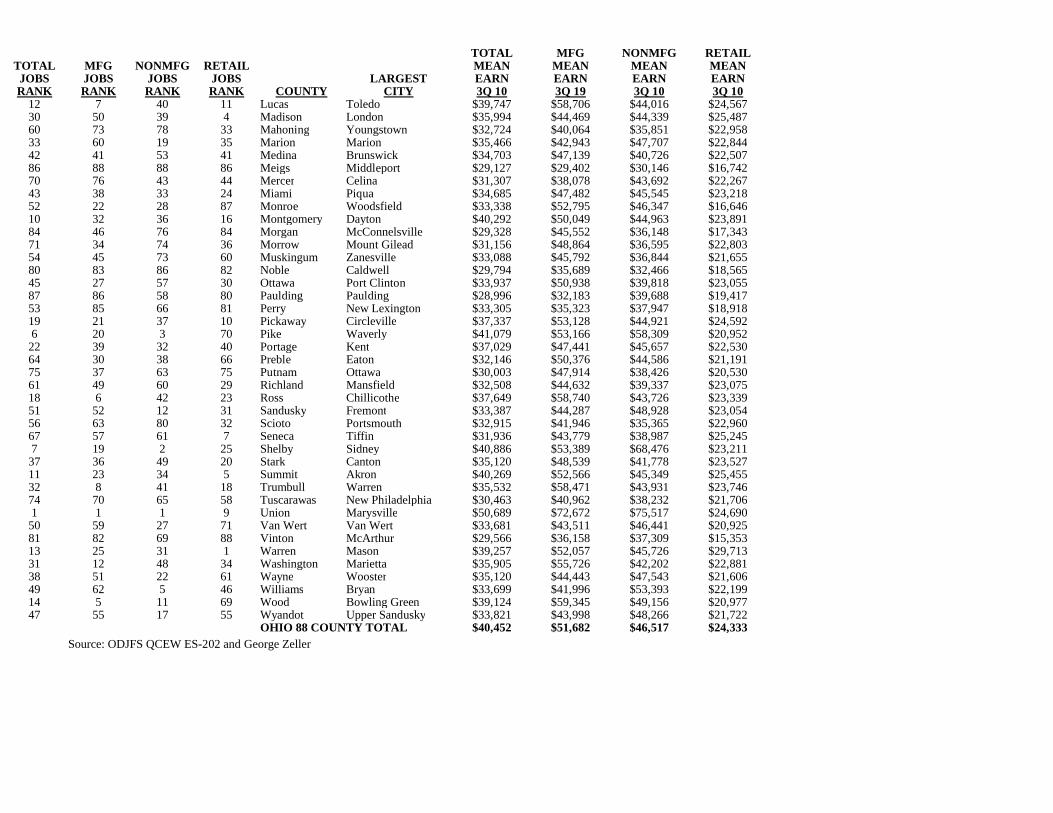
staggering 34.7% loss of the state’s Manufacturing jobs in only eight years. Then, in a very welcome turnaround, Ohio gained 12,605 Manufacturing jobs between the third quarter of 2009 and 2010, a one year growth rate of 2%. Table Fifteen finds that the average earnings of a Manufacturing job in Ohio is currently $51,682 while the mean earnings of all other Ohiononmanufacturing jobs is currently $46,517. It is therefore clear that Ohio’s job losses during the 2000s recession were heavily concentrated in high wage jobs formerly held by blue collar Ohio workers. That process was catastrophically damaging to both Ohio’s economy and to its blue collar workers. The loss of more than 315,000 high wage blue collar jobs was a disaster, both to Ohio’s overall economy and to the families of the former workers in Manufacturing firms. More than one third of all manufacturing jobs vanished statewide in Ohio. More than 10,000 Manufacturing jobs were lost during the 2000s recession in eight Ohio counties since 2001, including Cuyahoga (Cleveland), Montgomery (Dayton), Hamilton (Cincinnati), Franklin (Columbus), Stark (Canton), Summit (Akron),Trumbull (Warren), and Lucas (Toledo). These gigantic and horrible Manufacturing job losses rippled heavily into the rest of Ohio’s economy. The fact that Manufacturing employment returned to slow growth in Ohio during the third quarter of 2010 is a major development of the highest magnitude.

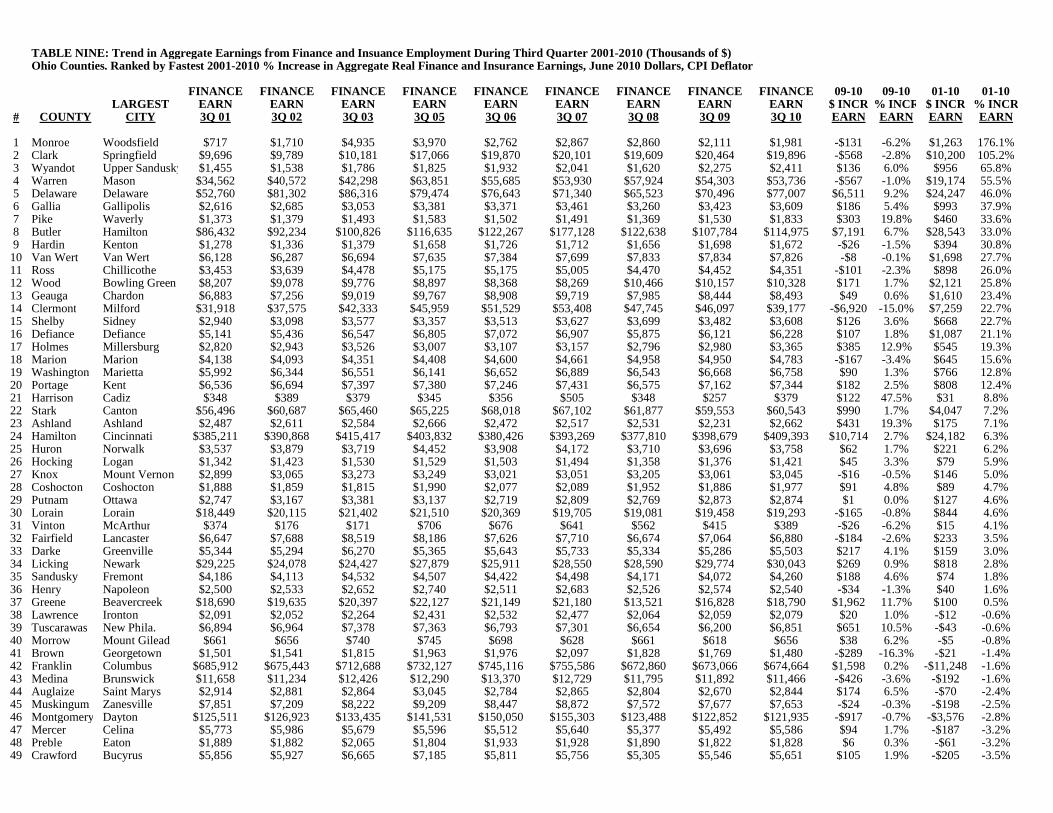
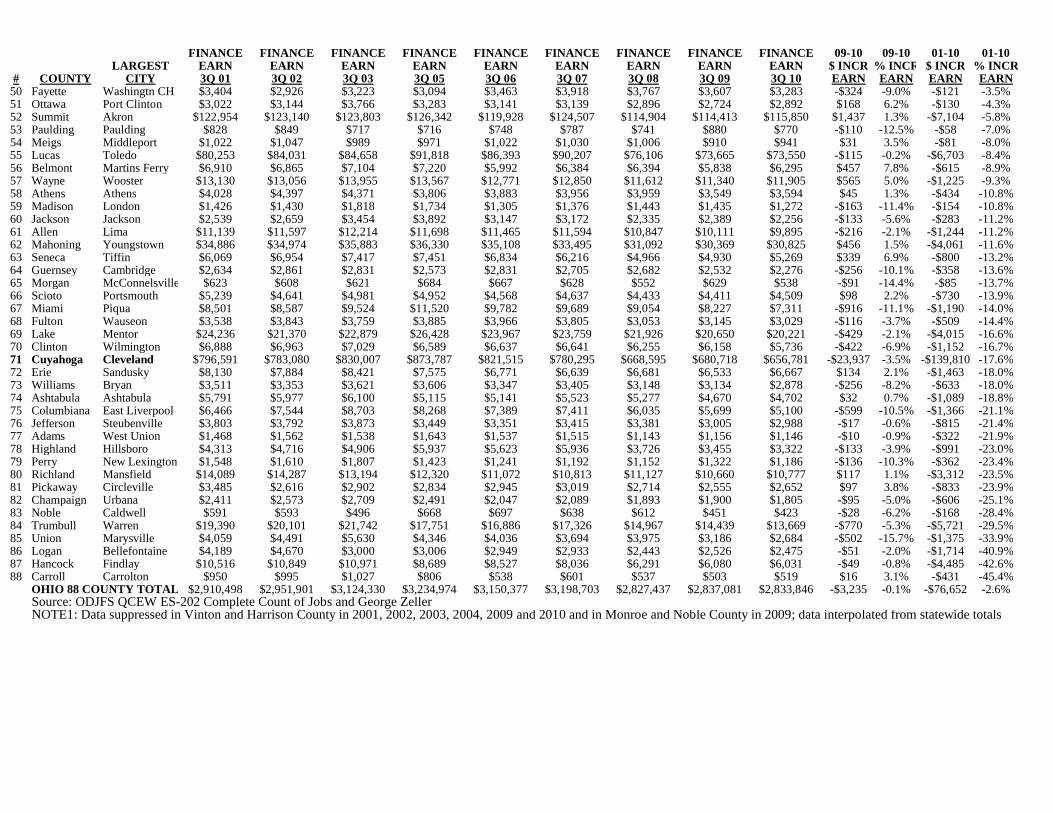
Finance and Insurance Job Growth Disappears During 2007-2009 National Recession

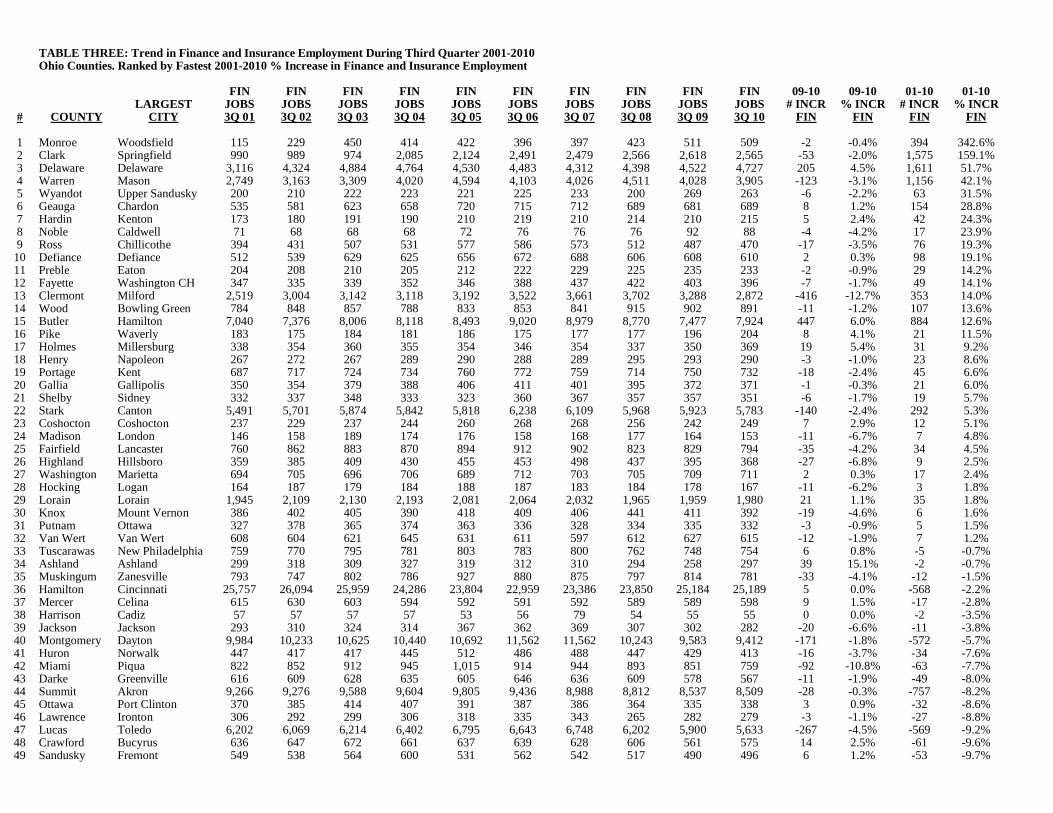
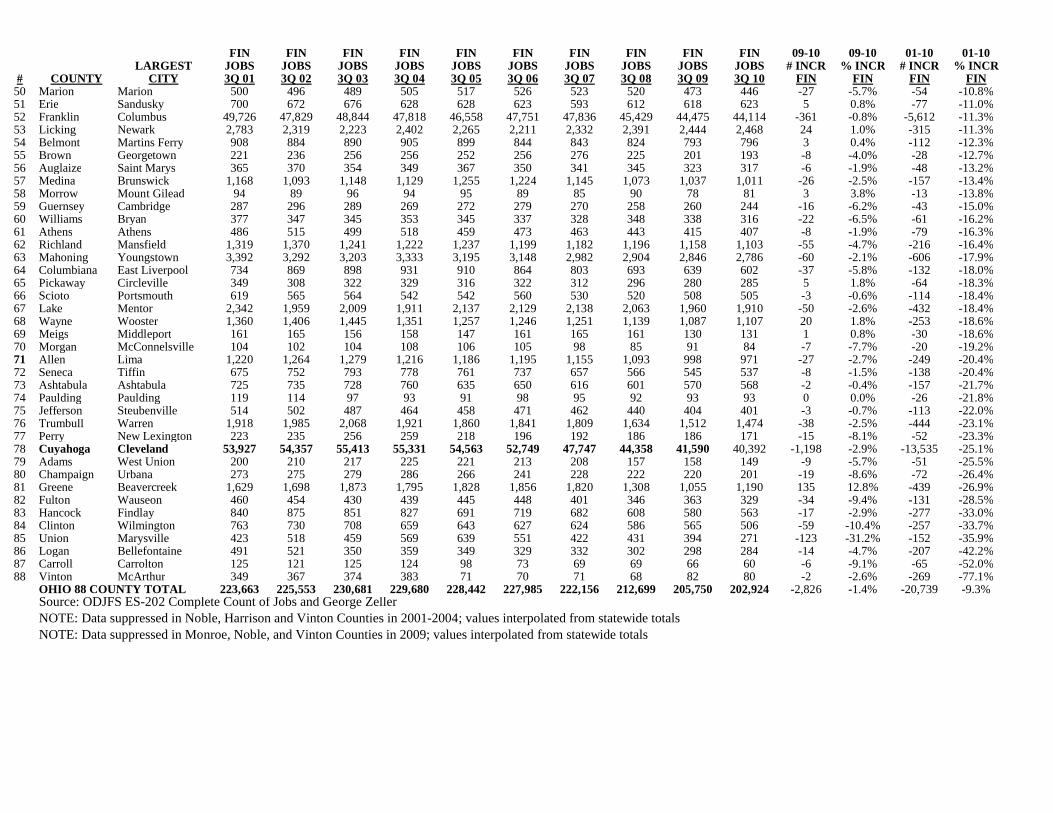
Table Three documents the trend in Ohio employment in Finance and Insurance between the thirdquarters of 2001 and 2010 for all 88 counties. Normally this important industry grows on a robust basis. But, during the 2000s recession, Ohio employment in finance and insurance declined every year between 2003 and 2010. The largest one year decline during that period took place between 2008 and 2009 during the national United States recession. As measured in third quarter data, Ohio’s level of Finance and Insurance employment decreased by xx% between 2009 and 2010, a one year decline of 2,826 jobs for a growth rate of -1.4%. The world financial and banking crisis that emerged during 2008 had a major negative impact in Ohio, but Finance and Insurance employment began to decline much earlier during 2004 in Ohio.

Ohio’s very recent losses in Finance and Insurance employment were very heavily concentrated in Cuyahoga County. In fact, for three consecutive quarters between 2Q 2009 and 4Q 2009 Cuyahoga County actually lost more jobs in Finance and Insurance than it lost in Manufacturing for the first time in measurable history. In data for the first three quarters of 2009 data that startlingpattern finally vanished, mainly because the size of Manufacturing job losses soared, and not because the losses in Finance and Insurance stopped. The pattern returned during the third quarter of 2010. Cuyahoga County lost -1,198 Finance and Insurance jobs between the third quarters of 2009 and 2010. During the same period of time, Cuyahoga County gained 1,729 Manufacturing jobs. This was only the fourth quarter in measurable history that Cuyahoga County lost more jobs in Finance and Insurance than it lost in Manufacturing.

In third quarter data, Ohio lost 2,826 Finance and Insurance jobs between 2009 and 2010. On a net basis, more than two-fifths of that decline was accounted for by Cuyahoga County alone. A stunningly large 55.2% of that one year net decline was accounted for by only two Ohio counties, Cuyahoga (Cleveland), and Franklin (Columbus) Counties. Astonishingly, a majority of the state’s recent one year 2008-2009 Finance and Insurance employment decline was concentrated in Ohio’s two largest counties by themselves.

A technical complication should be noted here. Of Ohio’s 20,739 Finance and Insurance jobs lost between 2001 and 2010, nearly one sixth (16.4%) of the net loss can be accounted for by a technicality. The Ohio Department of Jobs and Family Services Labor Market Information Division reports that a large Finance and Insurance firm in Cleveland reclassified two subsidiary divisions during the first quarter of 2007 from Finance and Insurance to Management of Companies and Enterprises. ODJFS LMI reports that this recoding impacted more than 3,400 workers. Thus, the official data understate growth in Finance and Insurance in Cuyahoga County, while they overstate growth in Cuyahoga County Management of Companies and Enterprises firms. That reclassification quirk impacts the 2001-2009 trend, but it is not present in the 2007-2009 period, when both Cuyahoga County and Ohio lost a substantial amount of employment in Finance and Insurance.

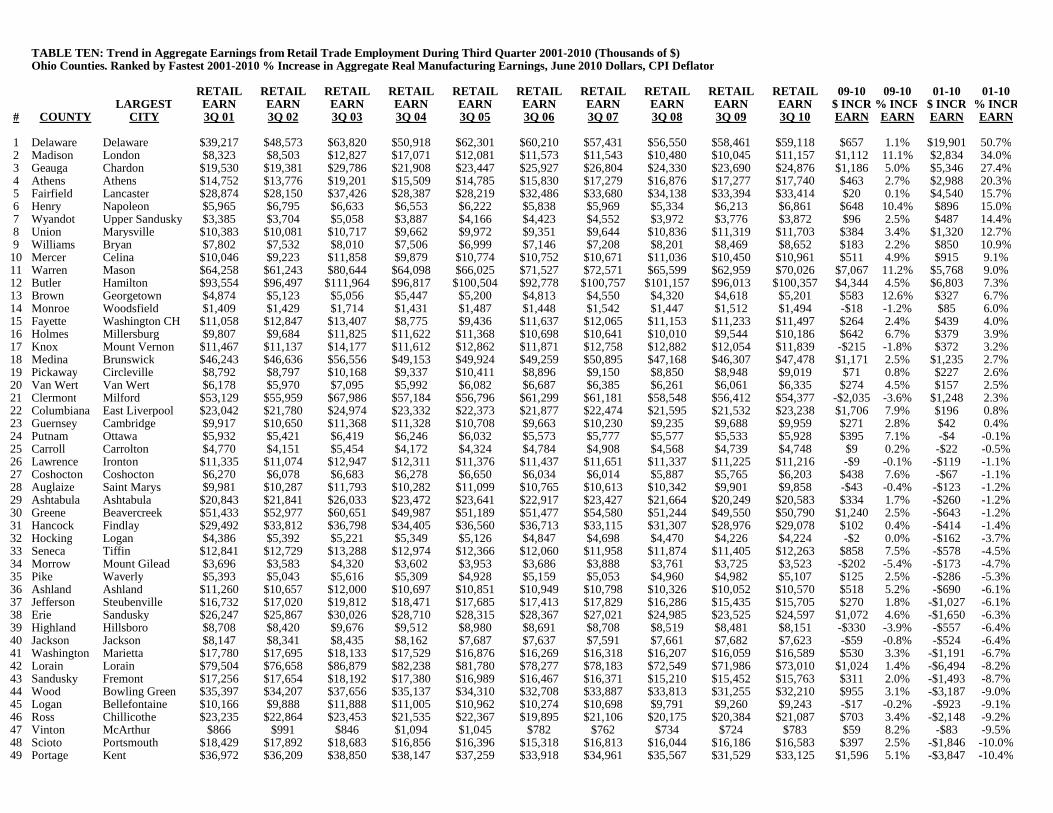
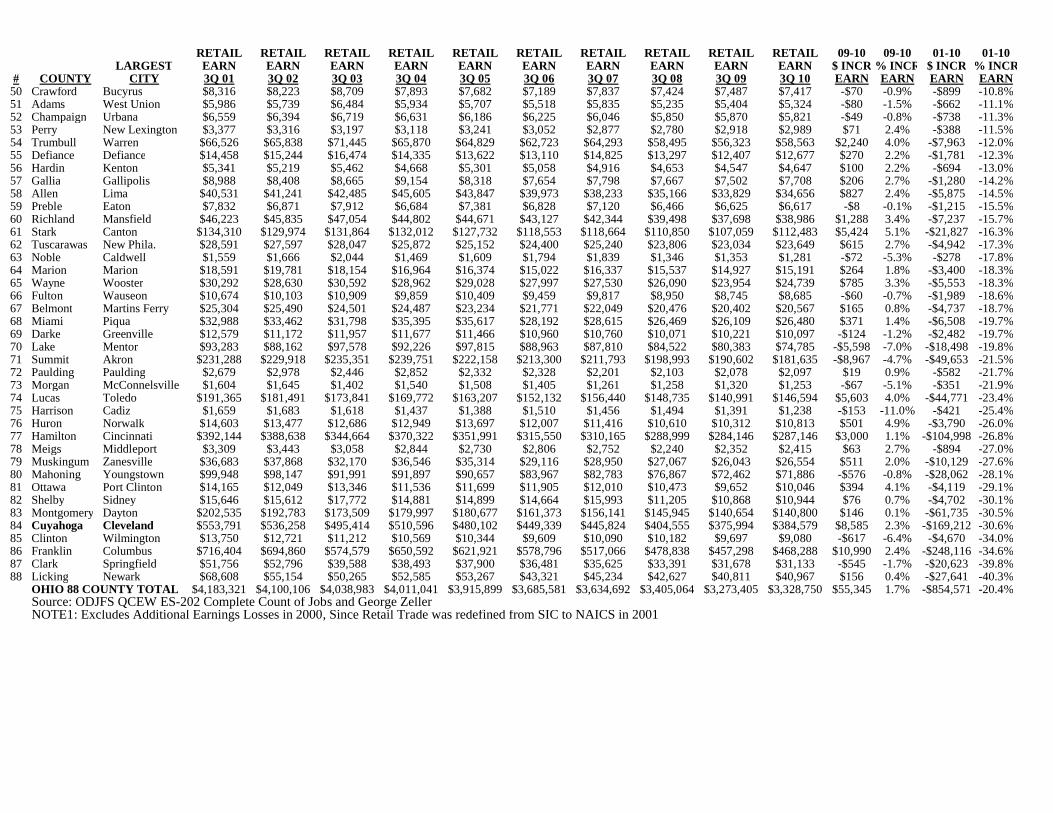
Retail Trade Job Losses in Ohio

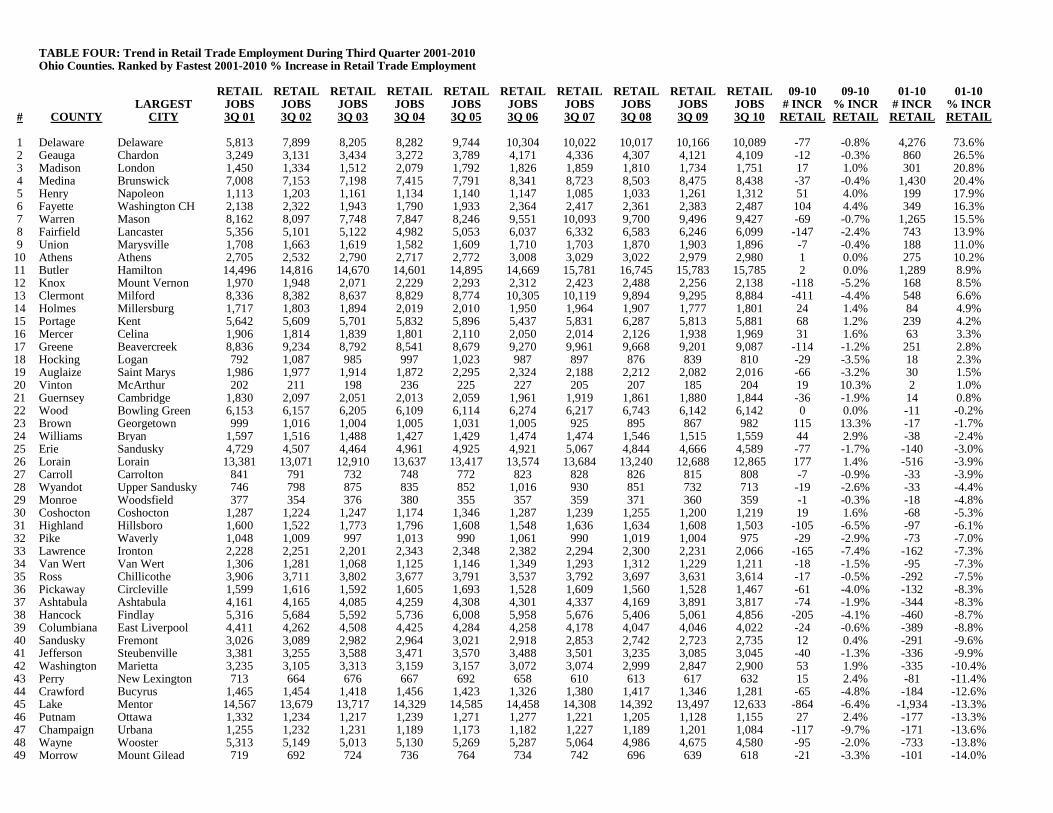
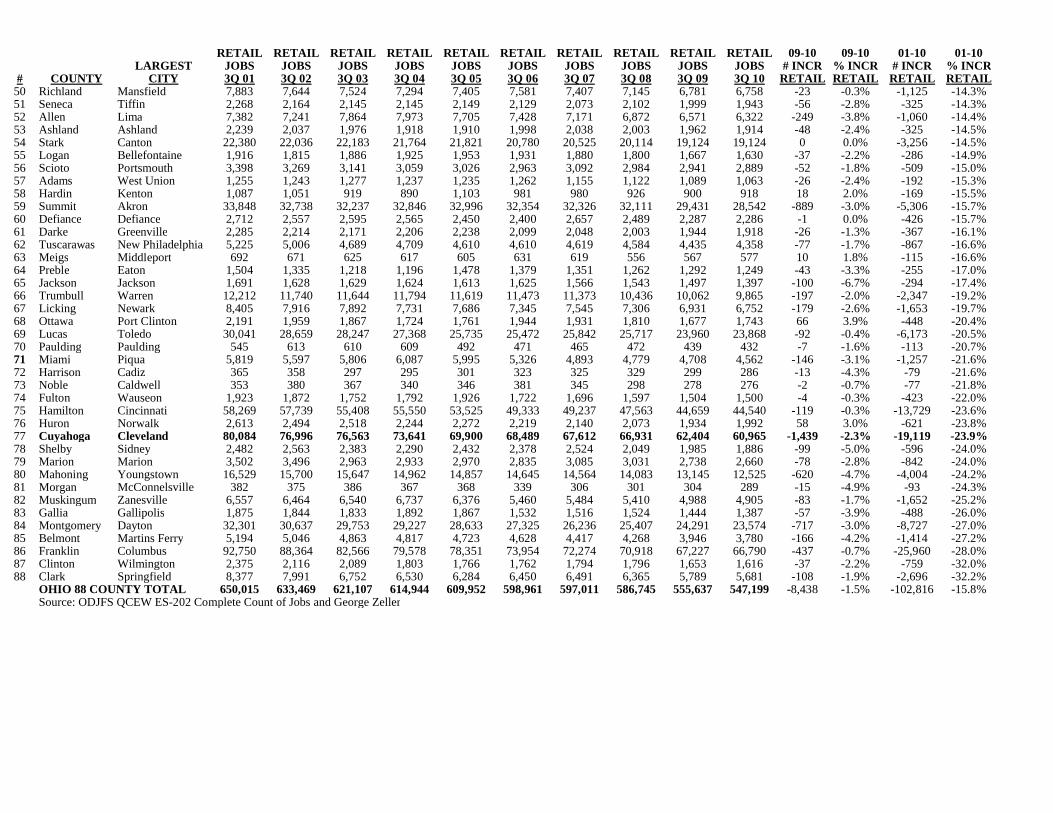
Table Four outlines the magnitude of Ohio job losses between 2001 and 2010 in Retail Trade, with those losses measured in data for the third quarter. The mean earnings of a job in this industry are currently $24,333 (see Table Fifteen), a level of compensation well less than half the $40,452 averageannualized wages for all jobs in Ohio. But, the 2000s recession had a very significant impact on employment levels in Retail Trade in Ohio. The state lost 102,816 Retail Trade jobs, representing 15.8% of the formerly existing jobs in that industry. Ohio’s large urban counties suffered very large losses in retail trade employment. Losses exceeded 14% in the counties containing Columbus, Cleveland, Cincinnati, Dayton, Toledo, Akron, Youngstown, Warren, Canton, Springfield, and Zanesville. The Retail Trade employment losses in Franklin County (Columbus) were astonishingly brutal. More than 25% of Ohio’s net retail trade job losses between 2001 and 2010 were accounted for by Franklin County alone. The 25,960 retail trade jobs lost in Franklin County were by far the largest loss in this industry by any Ohio county. This enormously large retail trade job loss was 28% of all the Retail Trade jobs that Franklin County had during the third quarter of 2001. Only two other counties, Clinton and Clark, suffered larger percentage losses in Retail Trade employment during this nine year period than were suffered in Franklin County. Since Franklin County has a long history of robust job growth, it is extraordinarily unusual to see it topping the list of Ohio’s retail trade job losses during the 2000s recession. Some of those losses were the result of sprawl development in metro Columbus outside Franklin County. Delaware, Madison, Fairfield, and UnionCounties in suburban Columbus generated double digit Retail Trade percentage job growth of 74%, 21%, 14%, and 11% during the same 2000-2009 period when Franklin County suffered extraordinarilylarge Retail Trade job destruction.

Similar sprawl development in retail trade is evident in other counties surrounding Ohio’s large cities, including Geauga and Medina Counties in Cleveland and Warren, Butler, and Clermont Counties in Cincinnati. That suburban retail growth came at the expense of Retail Trade employment formerly located in Cuyahoga County (Cleveland) and Hamilton County (Cincinnati).

The large losses in Retail Trade employment represent a contraction in low wage jobs that historically have provided an entry to the labor force by workers who have low incomes and workers who have modest educational backgrounds. This unfortunate contraction therefore has negative significance for attempts to move households of workers out of poverty, despite the low wages paid by average jobs in Retail Trade.

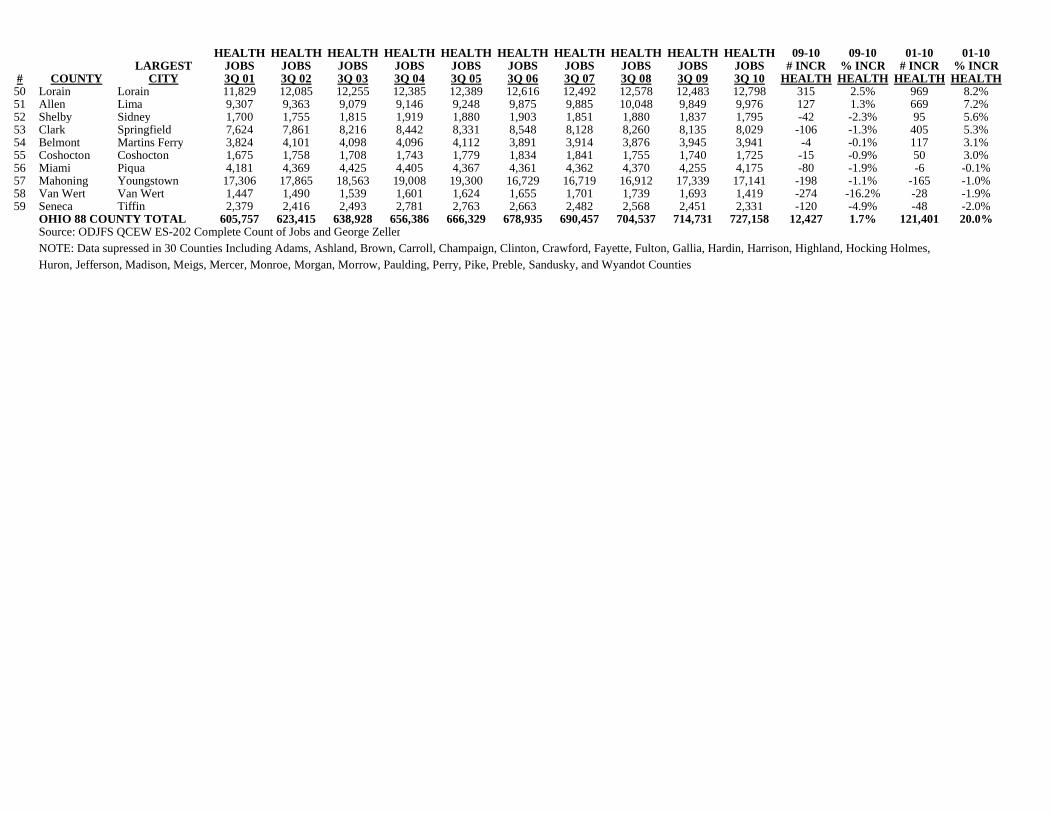
Health Care and Social Assistance Job Increases in Ohio

Table Five measures the magnitude of Ohio job increases between the third quarter of 2001 and the third quarter of 2009 in Health Care and Social Assistance. In contrast to the large job losses suffered during the 2000s recession in other major Ohio industries, the state experienced robust employment growth in Health Care and Social Assistance throughout that recessionary period.Ohio gained 111,759 jobs in Health Care and Social Assistance between the third quarter of 2001 and the third quarter of 2010, an increase of 20%.

During the same period of time between the third quarter of 2001 and the third quarter of 2009 theOhio lost 607,739 jobs in other industries, a decline of -13% of Ohio jobs in industries other thanHealth Care and Social Assistance. Financing the gigantic growth in Health Care and Social Assistance at a time when the entire remainder of Ohio’s economy was shrinking by one-eighthis clearly a growing structural problem within the state.

Employment increases in Health Care and Social Assistance were very widespread across Ohio between the first quarters of 2001 and 2009. Of the state’s 59 counties where ODJFS and the US Bureau of Labor Statistics do not suppress data in this industry, 55 generated job growth in this industry even as employment levels widely fell in other industries. The four exceptions were Seneca,Van Wert, Mahoning and Miami Counties. Madison County in suburban Columbus formerly was on this list. But, effective with the third quarter of 2010, ODJFS and BLS now suppress Health Care and Social Assistance data in Madison County.

Among Ohio’s larger urban areas, the most robust employment growth in Health Care and Social Assistance during the 2000s recession was in Franklin (Toledo) County with 30.2% growth. Summit County had the second fastest growth among the large urban counties at 28.3%. Summit County’s growth was heavily concentrated in one industry, Management of Companies and Enterprises. Health Services had the second highest growth rate among Summit County industries between 2001 and 2010.Franklin County (Columbus) had Health Services growth of 25.3%, which exceeded the Ohio statewide average. Trumbull County (Warren), which experienced very large job losses in other industries, experienced 14.9% employment growth in Health Services, a growth rate below the statewide average. Ohio’s other urban concentrations generally experienced below average employment growth in Health Care and Social Assistance between 2001 and 2009.

Cuyahoga County’s 19.6% growth in Health Care and Social Assistance was slightly below the Ohio statewide average of 20%. Even slower growth below the statewide 16.8% statewide average was present in Lucas County (Toledo), where the employment increase was 11.8%, Hamilton County (Cincinnati) where the employment increase was 12.9%, in Montgomery (Dayton) County where the employment increase was 14.2%, in Lucas County (Toledo) with 14.4% growth, and in Stark County (Canton) with 14.0% growth. Mahoning County (Youngstown) actually lost 165 Health Care and Social Assistance jobs between 2001 and 2010, a loss of -1.0%. Cuyahoga County retains Ohio’s largest concentration of Health Care and Social Assistance jobs. Its increase of 19,892 jobs during the 2000s recession was the largest numeric growth total among all Ohio counties. But, the county's below average rate of Health Care and Social Assistance job growth is troubling.

The long term financing mechanism of the growth in Health Care and Social Assistance employment in Ohio remains problematic. The growth has been financed by rapidly rising premiums for health insurance and by growth in spending by both the federal and state governments in programs such as Medicare and Medicaid. At a time when employment levels are falling in other industries, the capital devoted to the rising health care costs by Ohio firms has been at least a small factor limiting the growth of employment by those firms. The transfer of the financing to individuals through higher co-payments and deductibles has been a financial burden for individual families in the state, whether or not they have retained their own jobs. If Ohio is to continue its robust employment growth in Health Care and Social Assistance over the long run, the issue of financing this growth is an important problem that has not yet been solved.

DATA SUPPRESSION. In an extraordinarily ill-conceived decision, the US Bureau of Labor Statistics implemented dramatically increased data suppression in Health Care and Social Statistics job figures beginning with the data for the first quarter of 2009. The goal at BLS was to release more detailed figures for subsets of Health Care and Social Assistance such as Offices of Physicians, Day Care Centers, and other small categories of firms within the industry. This resulted in massive levels ofdata suppression in the detailed categories in a very large number of smaller Ohio counties. Making matters worse, BLS then suppressed the entire industry at the county level in a whopping number of 30Ohio counties. Those counties include Adams, Ashland, Brown, Carroll, Champaign, Clinton, Crawford, Fayette, Fulton, Gallia, Hardin, Harrison, Highland, Hocking Holmes, Huron, Jefferson, Madison, Meigs, Mercer, Monroe, Morgan, Morrow, Paulding, Perry, Pike, Preble, Sandusky, and Wyandot. Collectively, those 30 counties experienced below average employment growth in Health Care and Social Assistance with a growth rate of 16.5% between 2001 and 2010. The growth of earnings in these 26 counties was also below the statewide average for the industry. The damage caused at the Bureau of Labor Statistics by this new data suppression policy was clearly substantial.

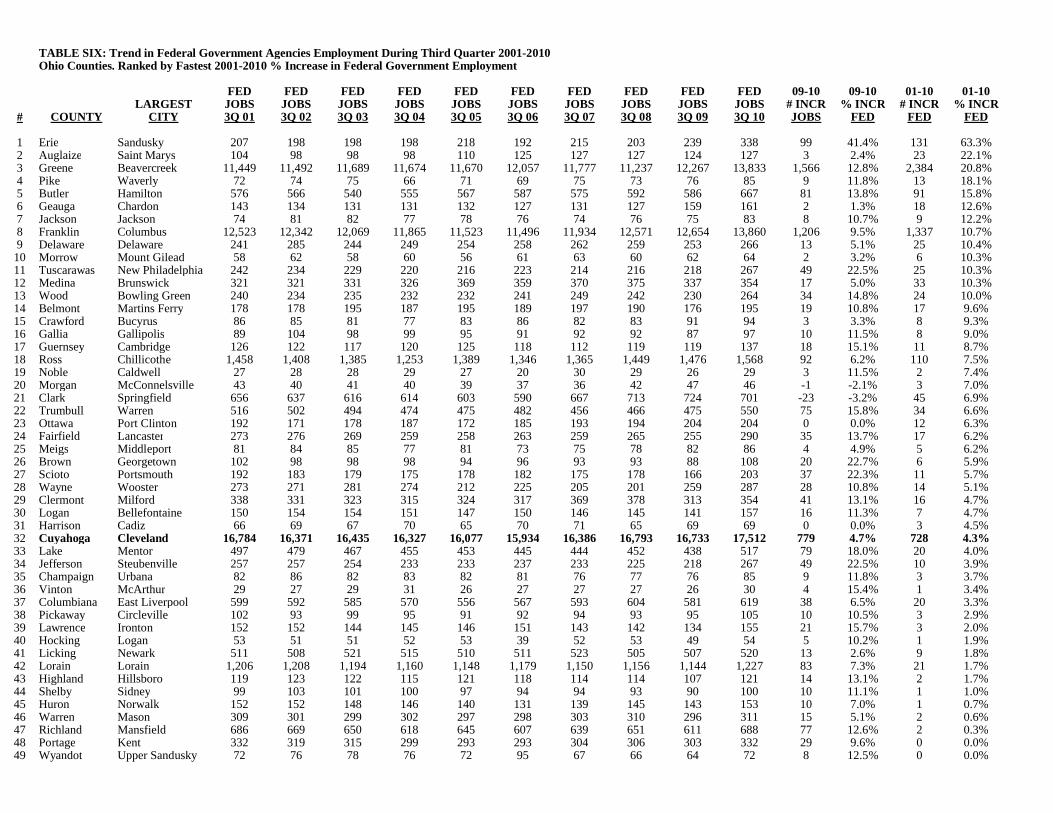
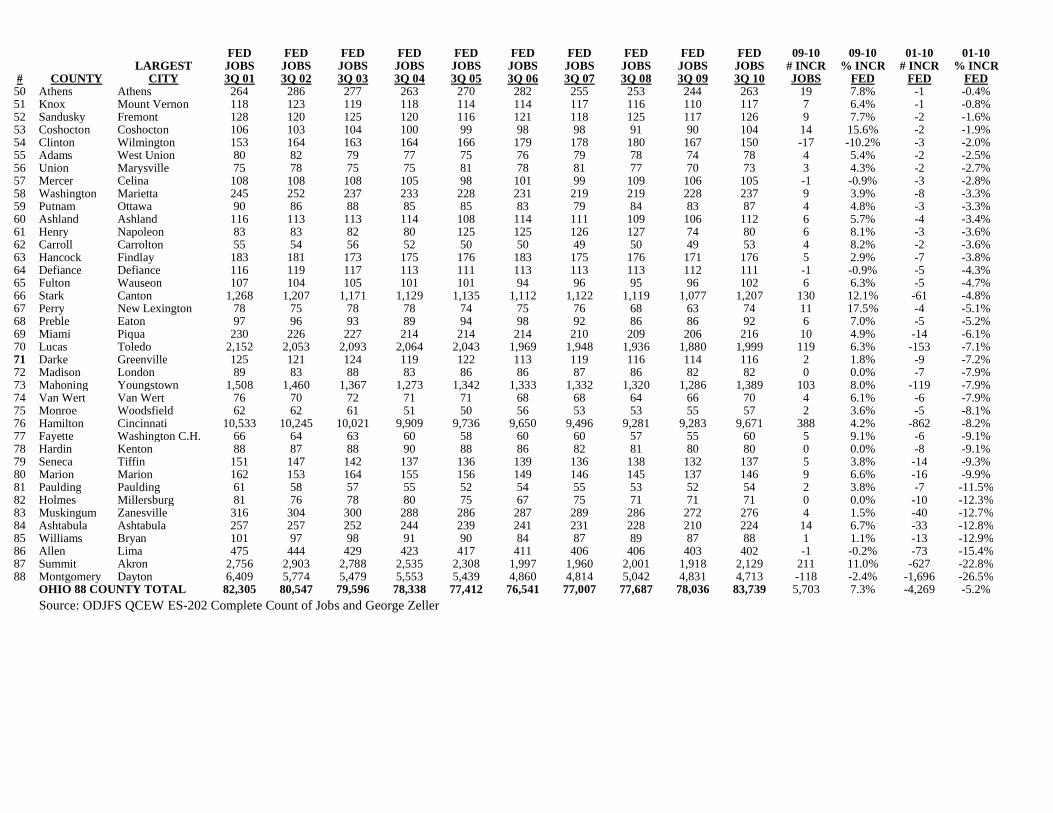
Federal Agency Job Trends in Ohio

Under the new NAICS industry system in the Quarterly Census of Employment and Earnings, since 2001, ODJFS and the Bureau of Labor Statistics have continually released data on the number of Ohio employees at firms that are federal government agencies. This had not previously been the case before 2001 under the SIC industry system. But, since 2001, data on federal employment do exist within all 88 Ohio counties. Table Six finds that federal agency employment fell in Ohio by 5.2% between the third quarters of 2001 and 2010 from a decline of 4,269 jobs. Federal agency job losses were widespread across Ohio’s counties, but Montgomery County (Dayton) alone lost 1,696 jobs.Hamilton (Cincinnati) County alone lost 852 jobs. Collectively, those two counties account for nearly half of the net 2001-2010 loss in Ohio federal agency employment. The nine year loss of federal agency employment came in Ohio despite a one year 2009-2010 increase of 7.3% during the ongoing current recession. The recent one year gain was undoubtedly associated with the federal stimulus spending during the 2007-2009 recession. Cuyahoga County’s nine year gain of 728 federal agency jobs represented a 4.3% increase that was clearly better growth than the -5.2% Ohio average. The Cuyahoga County employment gains in this industry were entirely accounted for by a one year 2008-2009 increase of 779 federal jobs in Cuyahoga County. By far the largest 2001-2010 gains and the largest one year 2009-2010 increase in federal agency employment in Ohio were both in Greene County in suburban Dayton. A complex of industries associated with Wright Patterson Air Force Base is located in Greene County.

Aggregate Earnings Losses in Ohio

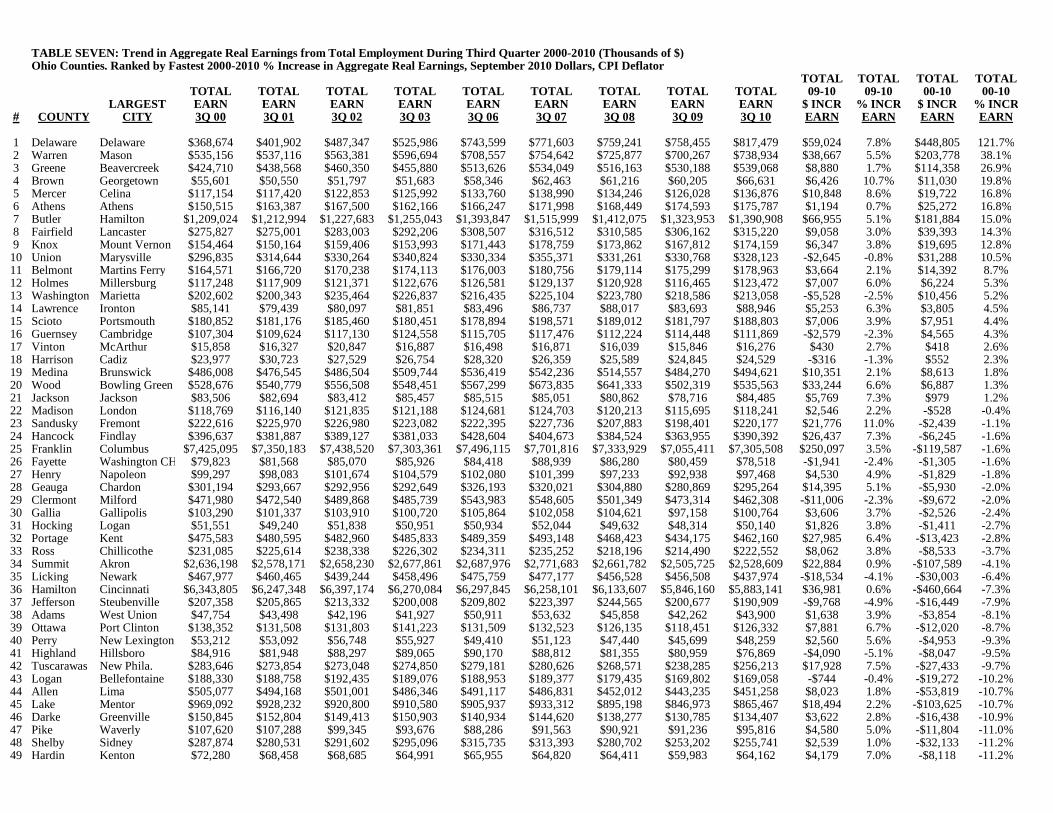
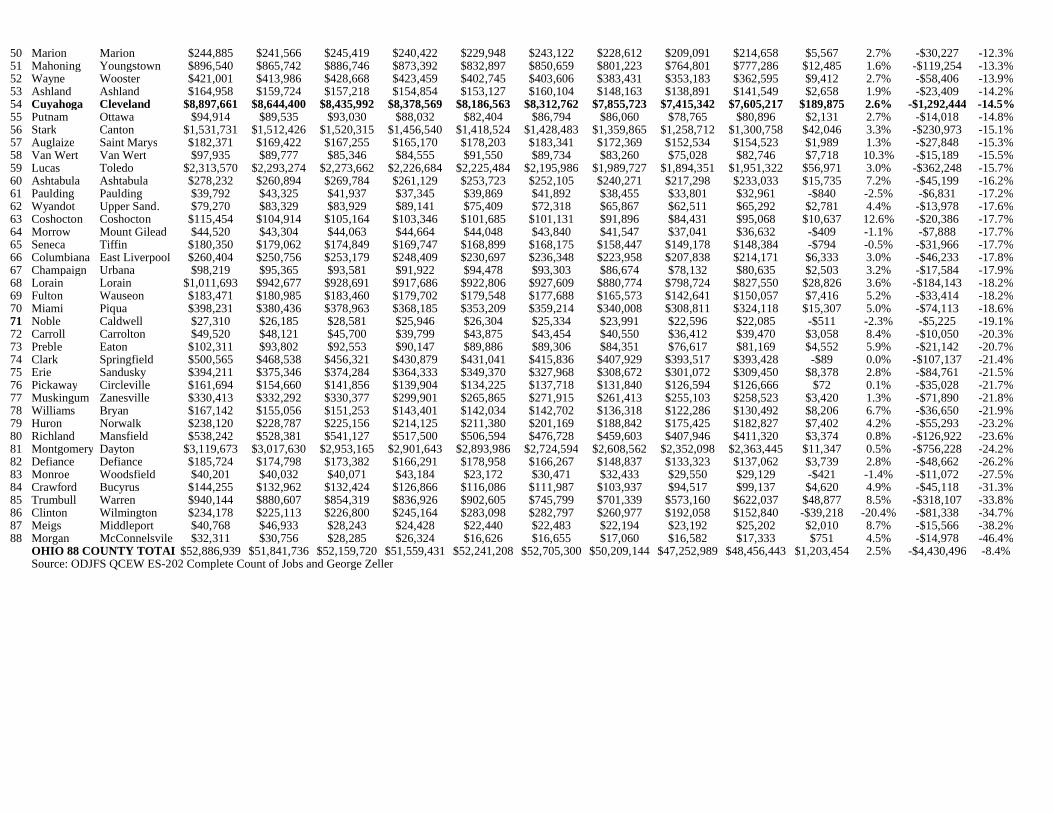
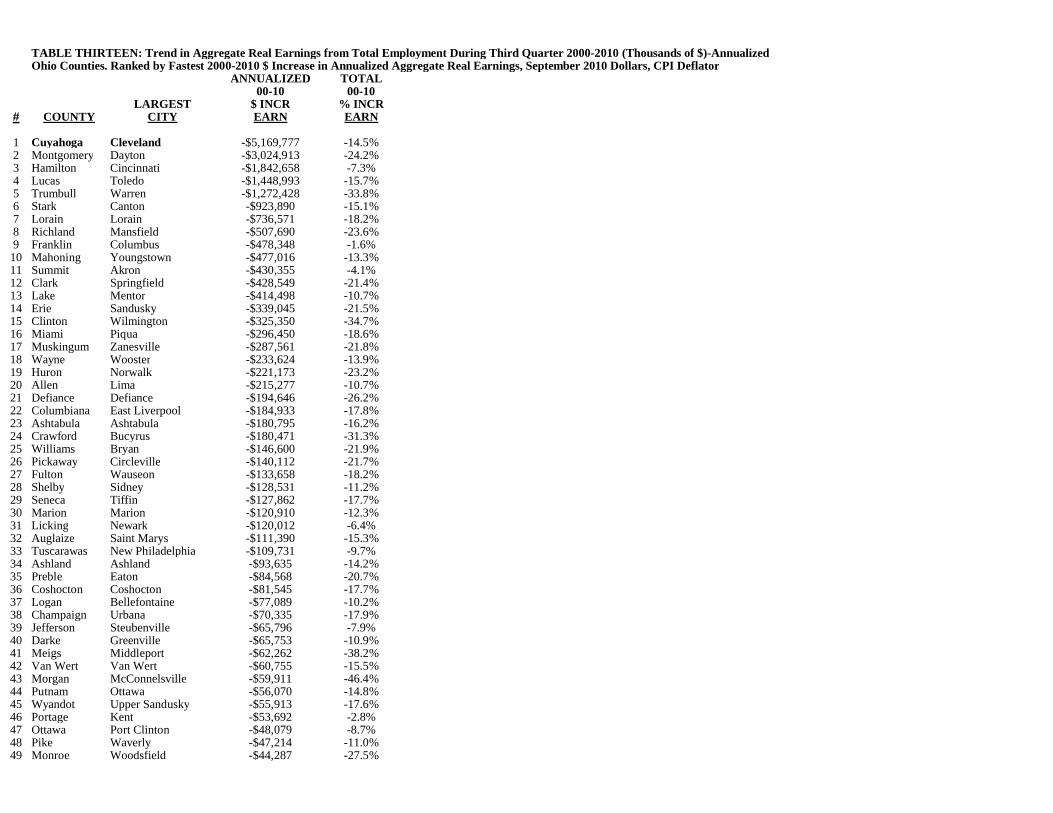
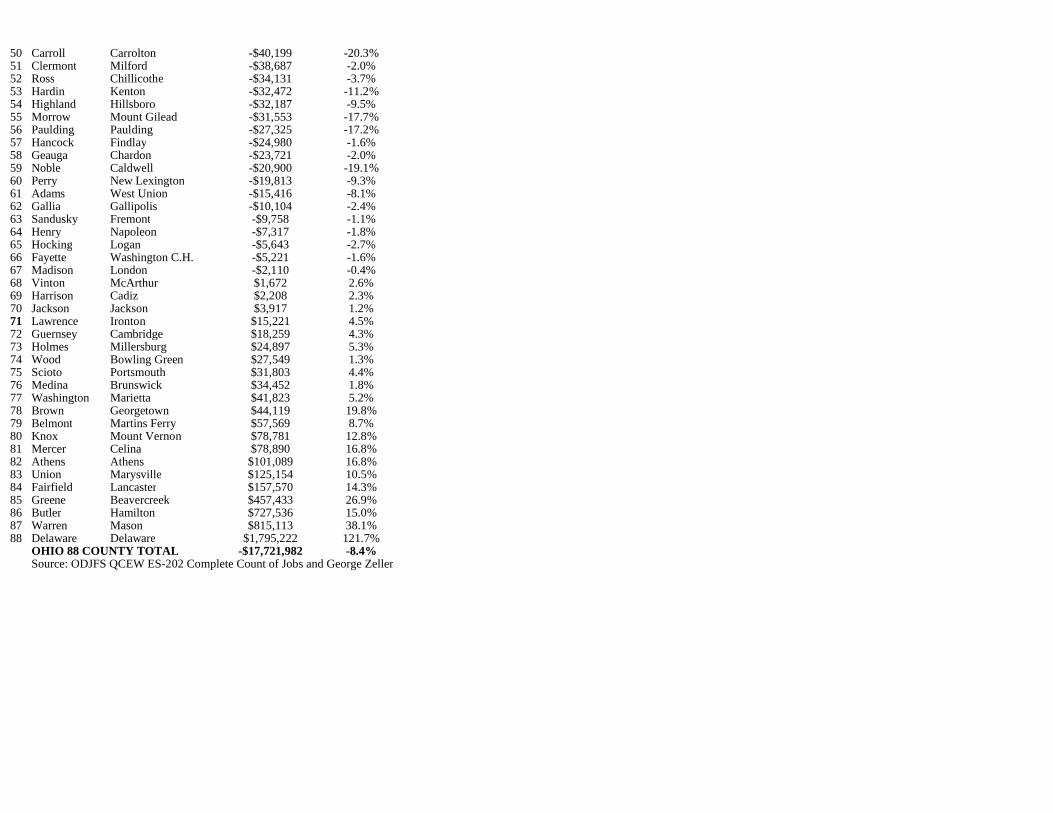
Table Seven measures the trend in real aggregate payroll earnings in all 88 Ohio counties between the third quarters of 2000 and 2010. Table Thirteen annualizes the quarterly figures from Table Seven. Ohio's real quarterly aggregate earnings declined by -4.4% during the ten year period. A quarterly decline of -$4.43 billion represents an annualized loss of -$17.72 billion in Ohio payrolls. Among the state’s 88 counties, 66 experienced payroll earnings declines. The other 20 growing counties wereheavily dominated by suburban counties adjacent to Ohio’s large cities where suburban sprawl development took place even during a deep recession. Aggregate real earnings more than doubled in Delaware County in suburban Columbus with a 121.7% increase above inflation. In Cuyahoga County, aggregate real earnings declined by -$1.29 billion on a quarterly basis, which was an utterly stunning -$5.17 billion decline on an annualized yearly basis. The percentage loss in real paychecks was -14.5% in Cuyahoga County. Of the -$17.72 billion decline in Ohio’s paycheck earnings, 29.2% was accounted for on a net basis by Cuyahoga County alone. Aggregate real paycheck earnings also declined over the nine year period in all of Ohio’s large urban counties.Summit County was the only large Ohio urban county that did not lose jobs and aggregate payroll between 2000 and 2008. But, a large 5.9% decline between 2008 and 2009 pulled Summit County’s aggregate real payroll level below its 2000 level. Slight 2009-2010 earnings growth was insufficient to return Summit County’s ten year aggregate real earnings growth to positive territory. The Franklin County payroll loss was relatively small with a decline of -1.6%, but it was nevertheless a ten yeardecline in aggregate Franklin County payroll. Most of the Franklin County payroll decline took placeduring the one year 2007-2008 periods when Franklin County lost -3.8% of its real payroll earnings.Horribly, five Ohio counties lost more than $1 billion in annualized payroll earnings during the tenyear period. In addition to Cuyahoga, those counties included Montgomery, Hamilton, Lucas, and Trumbull Counties. The Montgomery County loss in Dayton was -24.2%, and the Trumbull County payroll loss in Warren was a horrifying -33.8%. The loss of more than one-third of Trumbull County’s aggregate payroll earnings in only ten years had a devastating impact in Warren and in the rest of the Mahoning Valley.

During years of the 2000s recession prior to 2009 in Ohio, employment declined faster than payroll earnings declined. Thus, the mean earnings of a job rose in many Ohio counties despite large simultaneous employment losses. That pattern weakened in 2006 and it ended during 2008 when average earnings of an Ohio job declined. But, the pattern returned in 2009. On a one year basisdespite a massive -6.6% loss of jobs, Ohio payroll earnings declined by -5.9% during the first quarter of 2009.

Then, aggregate real earnings improved further between 2009 and 2010 in third quarter data across Ohio. On a statewide basis, aggregate real earnings increased by 2.5% during this one year period. Trumbull County had Ohio’s eighth fastest one year increase at 8.5% as Manufacturing earnings increased. Aggregate real earnings increased between the third quarters of 2009 and 2010 in all of Ohio’s large urban counties.

As a result, average earnings of a job in Ohio therefore increased by 2.5% during the thirdquarter of 2009 on a year over year basis. As a result, Ohio’s current 2010 $40,452 mean earnings of a job actually exceeds Ohio’s 2009 $39,456 mean by a small 2.5%.

Stable and rising average job earnings in Ohio despite massive and devastating simultaneous job losses created an unusual situation within Ohio’s labor market. A comparison of the industrial composition of trends in Ohio jobs and earnings during the 2000s recession makes this discrepancy clear. The state’s job losses were heavily concentrated in manufacturing, but there were widespread job losses in other economic sectors as well as the manufacturing losses rippled through the rest of Ohio’s industries. The unfortunate redefinition of all industries in the economy from Standard Industrial Codes to the North American Industrial Classification system precludes measurement of job and earnings losses in Ohio between 2000 and 2001, but since 2001 there have been substantial declines in employment within a majority of industries in Ohio. The job losses were generally not matched by corresponding declines in average wages of surviving jobs.

This set of opposite trends with massive declines in employment while wages of surviving jobs increased slightly above inflation levels is an important paradox. Workers and their families who lost employment saw their wage income fall to zero, while other workers who were still employed on average received wage increases. Some of the workers whose wages were rising failed to grasp the devastating impact of the deep recession on former workers who lost all wage income. Despite the very slow recovery of the Ohio economy in 2010, this paradox remains currently active. Inequality continues to increase between workers who are experiencing rising real wages while other workers continue to suffer a massive plunge of their earrings to zero following a recent layoff.

Manufacturing jobs declined by a horrifying 30.5% in Ohio between 2001 and 2010, as the number of manufacturing jobs in Ohio fell by -310,175. That massive and devastating Manufacturing job loss was associated with widespread declines among other Ohio industries. Double digit percentage employment losses were also present in other Ohio industries including Information, Retail Trade, and Utilities. These losses were variable among Ohio counties, as is documented in Tables One through Six.

The major exceptions to employment losses during the 2000s recession in Ohio were found in Management of Companies and Enterprises, Health Care and Social Assistance, and Educational Services. Each of those industries registered double digit percentage employment growth even during the 2000s recession as overall employment levels declined sharply. The growth in educational services is somewhat misleading, since it is dominated by a large expansion of private charter schools and a corresponding reduction in public school district employment in Local Government within the state during the recession as a result of state policy. But, the employment growth in Management of Companies and Enterprises and Health Care and Social Assistance were genuine increases in those private sector industries.

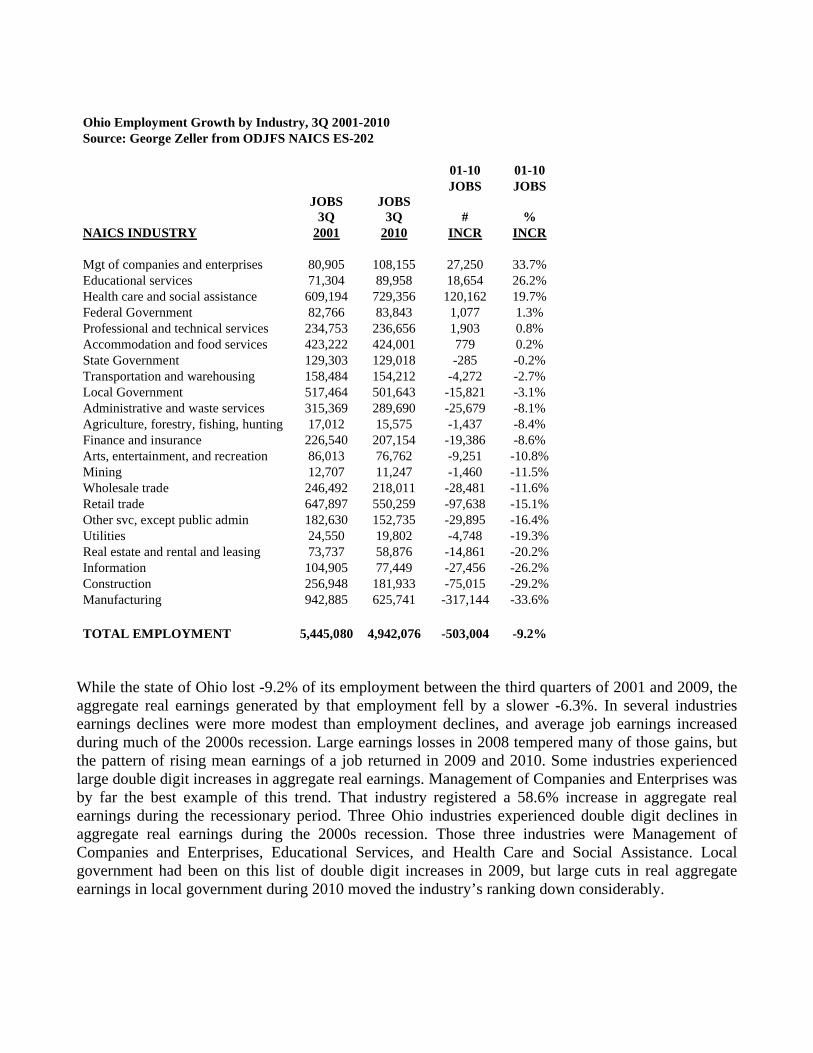
Ohio Employment Growth by Industry, 3Q 2001-2010Source: George Zeller from ODJFS NAICS ES-202

01-10 01-10JOBS JOBS

JOBS 3Q

JOBS 3Q # %

NAICS INDUSTRY 2001 2010 INCR INCR

Mgt of companies and enterprises 80,905 108,155 27,250 33.7%Educational services 71,304 89,958 18,654 26.2%Health care and social assistance 609,194 729,356 120,162 19.7%Federal Government 82,766 83,843 1,077 1.3%Professional and technical services 234,753 236,656 1,903 0.8%Accommodation and food services 423,222 424,001 779 0.2%State Government 129,303 129,018 -285 -0.2%Transportation and warehousing 158,484 154,212 -4,272 -2.7%Local Government 517,464 501,643 -15,821 -3.1%Administrative and waste services 315,369 289,690 -25,679 -8.1%Agriculture, forestry, fishing, hunting 17,012 15,575 -1,437 -8.4%Finance and insurance 226,540 207,154 -19,386 -8.6%Arts, entertainment, and recreation 86,013 76,762 -9,251 -10.8%Mining 12,707 11,247 -1,460 -11.5%Wholesale trade 246,492 218,011 -28,481 -11.6%Retail trade 647,897 550,259 -97,638 -15.1%Other svc, except public admin 182,630 152,735 -29,895 -16.4%Utilities 24,550 19,802 -4,748 -19.3%Real estate and rental and leasing 73,737 58,876 -14,861 -20.2%Information 104,905 77,449 -27,456 -26.2%Construction 256,948 181,933 -75,015 -29.2%Manufacturing 942,885 625,741 -317,144 -33.6%

TOTAL EMPLOYMENT 5,445,080 4,942,076 -503,004 -9.2%

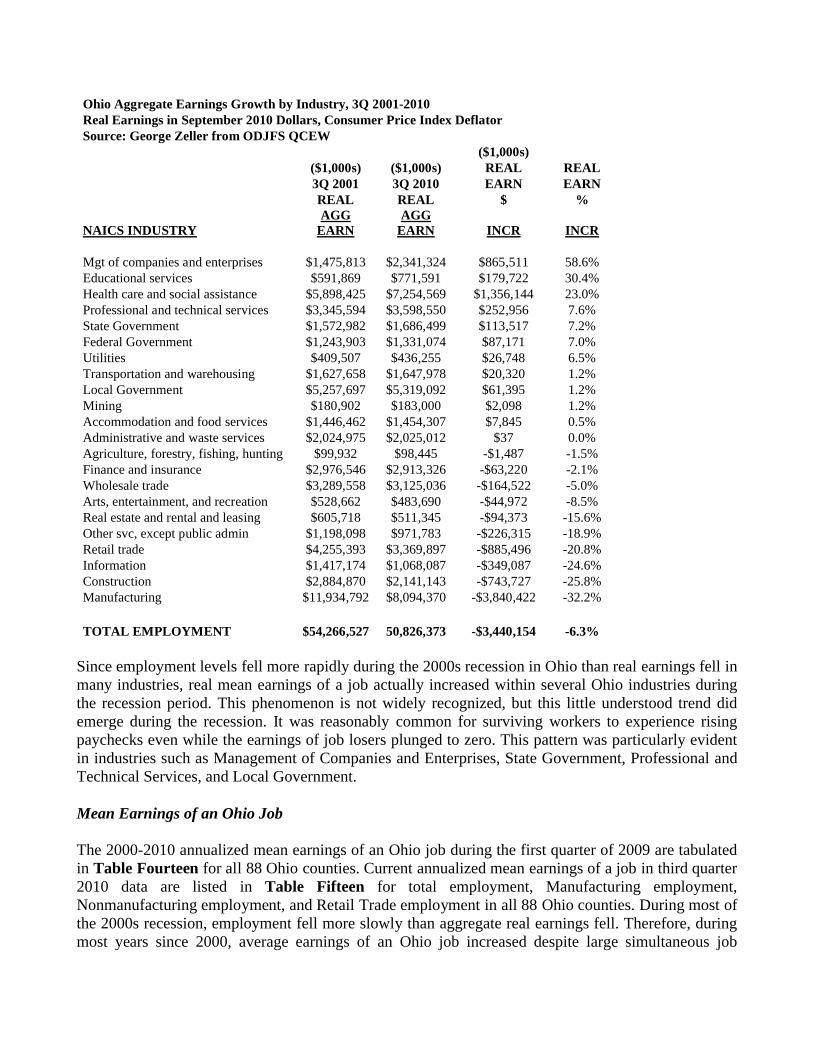
While the state of Ohio lost -9.2% of its employment between the third quarters of 2001 and 2009, the aggregate real earnings generated by that employment fell by a slower -6.3%. In several industries earnings declines were more modest than employment declines, and average job earnings increasedduring much of the 2000s recession. Large earnings losses in 2008 tempered many of those gains, but the pattern of rising mean earnings of a job returned in 2009 and 2010. Some industries experienced large double digit increases in aggregate real earnings. Management of Companies and Enterprises was by far the best example of this trend. That industry registered a 58.6% increase in aggregate real earnings during the recessionary period. Three Ohio industries experienced double digit declines in aggregate real earnings during the 2000s recession. Those three industries were Management of Companies and Enterprises, Educational Services, and Health Care and Social Assistance. Local government had been on this list of double digit increases in 2009, but large cuts in real aggregate earnings in local government during 2010 moved the industry’s ranking down considerably.

Ohio Aggregate Earnings Growth by Industry, 3Q 2001-2010Real Earnings in September 2010 Dollars, Consumer Price Index DeflatorSource: George Zeller from ODJFS QCEW

($1,000s)($1,000s) ($1,000s) REAL REAL3Q 2001 3Q 2010 EARN EARNREAL REAL $ %

NAICS INDUSTRYAGG

EARNAGG

EARN INCR INCR

Mgt of companies and enterprises $1,475,813 $2,341,324 $865,511 58.6%Educational services $591,869 $771,591 $179,722 30.4%Health care and social assistance $5,898,425 $7,254,569 $1,356,144 23.0%Professional and technical services $3,345,594 $3,598,550 $252,956 7.6%State Government $1,572,982 $1,686,499 $113,517 7.2%Federal Government $1,243,903 $1,331,074 $87,171 7.0%Utilities $409,507 $436,255 $26,748 6.5%Transportation and warehousing $1,627,658 $1,647,978 $20,320 1.2%Local Government $5,257,697 $5,319,092 $61,395 1.2%Mining $180,902 $183,000 $2,098 1.2%Accommodation and food services $1,446,462 $1,454,307 $7,845 0.5%Administrative and waste services $2,024,975 $2,025,012 $37 0.0%Agriculture, forestry, fishing, hunting $99,932 $98,445 -$1,487 -1.5%Finance and insurance $2,976,546 $2,913,326 -$63,220 -2.1%Wholesale trade $3,289,558 $3,125,036 -$164,522 -5.0%Arts, entertainment, and recreation $528,662 $483,690 -$44,972 -8.5%Real estate and rental and leasing $605,718 $511,345 -$94,373 -15.6%Other svc, except public admin $1,198,098 $971,783 -$226,315 -18.9%Retail trade $4,255,393 $3,369,897 -$885,496 -20.8%Information $1,417,174 $1,068,087 -$349,087 -24.6%Construction $2,884,870 $2,141,143 -$743,727 -25.8%Manufacturing $11,934,792 $8,094,370 -$3,840,422 -32.2%

TOTAL EMPLOYMENT $54,266,527 50,826,373 -$3,440,154 -6.3%

Since employment levels fell more rapidly during the 2000s recession in Ohio than real earnings fell in many industries, real mean earnings of a job actually increased within several Ohio industries during the recession period. This phenomenon is not widely recognized, but this little understood trend did emerge during the recession. It was reasonably common for surviving workers to experience rising paychecks even while the earnings of job losers plunged to zero. This pattern was particularly evident in industries such as Management of Companies and Enterprises, State Government, Professional and Technical Services, and Local Government.

Mean Earnings of an Ohio Job

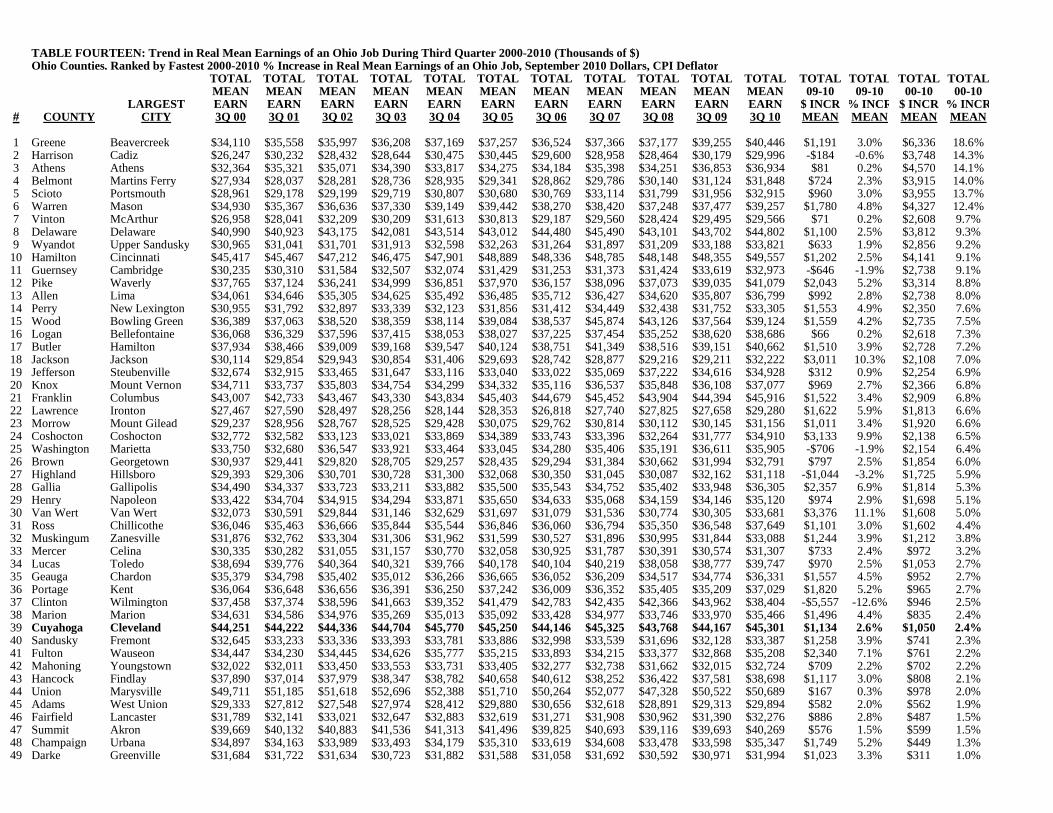
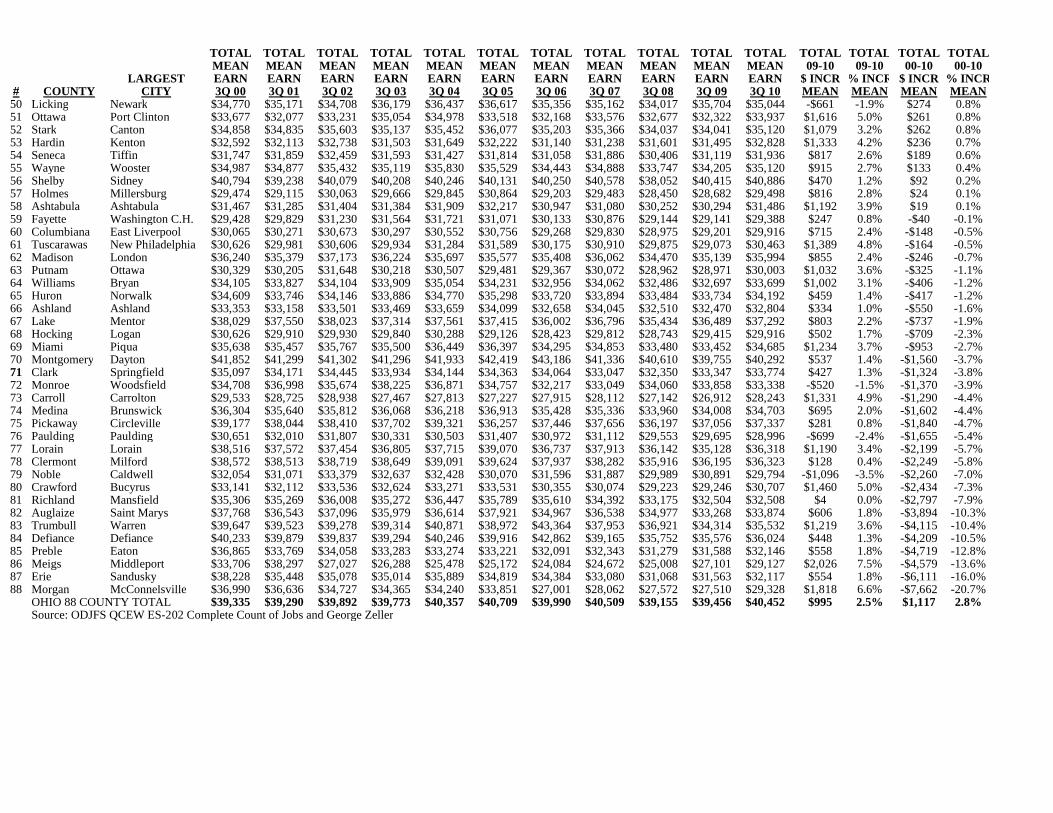
The 2000-2010 annualized mean earnings of an Ohio job during the first quarter of 2009 are tabulated in Table Fourteen for all 88 Ohio counties. Current annualized mean earnings of a job in third quarter 2010 data are listed in Table Fifteen for total employment, Manufacturing employment, Nonmanufacturing employment, and Retail Trade employment in all 88 Ohio counties. During most of the 2000s recession, employment fell more slowly than aggregate real earnings fell. Therefore, during most years since 2000, average earnings of an Ohio job increased despite large simultaneous job

losses. This led to a paradox where hundreds of thousands of Ohio workers saw their earnings fall to zero at the same time as other workers whose Ohio jobs survived experienced an increase in their average earnings. That paradox reversed itself in 2008 and 2009 during the severe national recession. Mean earnings of an Ohio job fell from $40,509 in 2007 to $39,155 in 2008. That large losecompletely obliterated growth in the mean earnings of an Ohio job that took place between 2000 and 2007. As a result, the average real earnings generated by an Ohio job fell by -0.5% from $39,335 in 2000 to $39,155 in 2008.

In 2009 and 2010, the trend reversed once again. Mean real earnings of a job in Ohio increased during the 2009-2010 period by 2.5%. They also increased between 2008 and 2009.

At the county level, there was wide variation during the 2000-2010 period in the trend of mean job earnings in Ohio. Average job earnings increased during the decade in 58 Ohio counties. The largest increase in average job earnings took place in Greene County, were mean earnings of a job grew withan 18.6% increase since 2000. The state’s ten fastest increases in mean real earnings were heavily concentrated among growing suburban counties in the Dayton, Cincinnati, and Columbus urban regions that experienced substantial sprawl growth despite the statewide recession.

The largest 2000-2010 loss in mean earnings of a job among large urban counties was in Trumbull (Warren) County. Average earnings of a Trumbull County job fell -10.4% from $39,647 in 2000 to $35,532 in 2010. The loss of 24,826 (-26.2%) Trumbull County jobs were heavily concentrated in high wage Manufacturing jobs, causing a major plunge in the mean earnings of surviving Trumbull County jobs. Other large Ohio counties suffering from similar tragic circumstances included Montgomery (Dayton), Lorain (Lorain), and Richland (Mansfield) Counties.

In Cuyahoga (Cleveland) County, mean earnings of a job increased from $44,251 in 2000 to $45,301 in 2010, representing a 2.4% increase. That entire increase took place during the past year between 2009 and 2010, when mean real earnings of a Cuyahoga County job increased by 2.6%. Real mean earnings increased during the past year between 2009 and 2010 in 78 of Ohio’s 88 counties.

Since earnings declines were slower than the rate of job losses in Ohio, average earnings of a job actually increased during most of the 2000s recession. Job totals fell more slowly during late 2008 than aggregate earnings fell, this pattern temporarily reversed during 2008. Thus, on a one year basis in2008, average earnings of an Ohio job fell on a very widespread basis. But growth in mean Ohio job earnings resumed in 2009 and 2010 despite the deep ongoing recession. This pattern is also visible in Table Fourteen, although those data exclude out of state employment at Ohio firms and therefore differ slightly from this table.

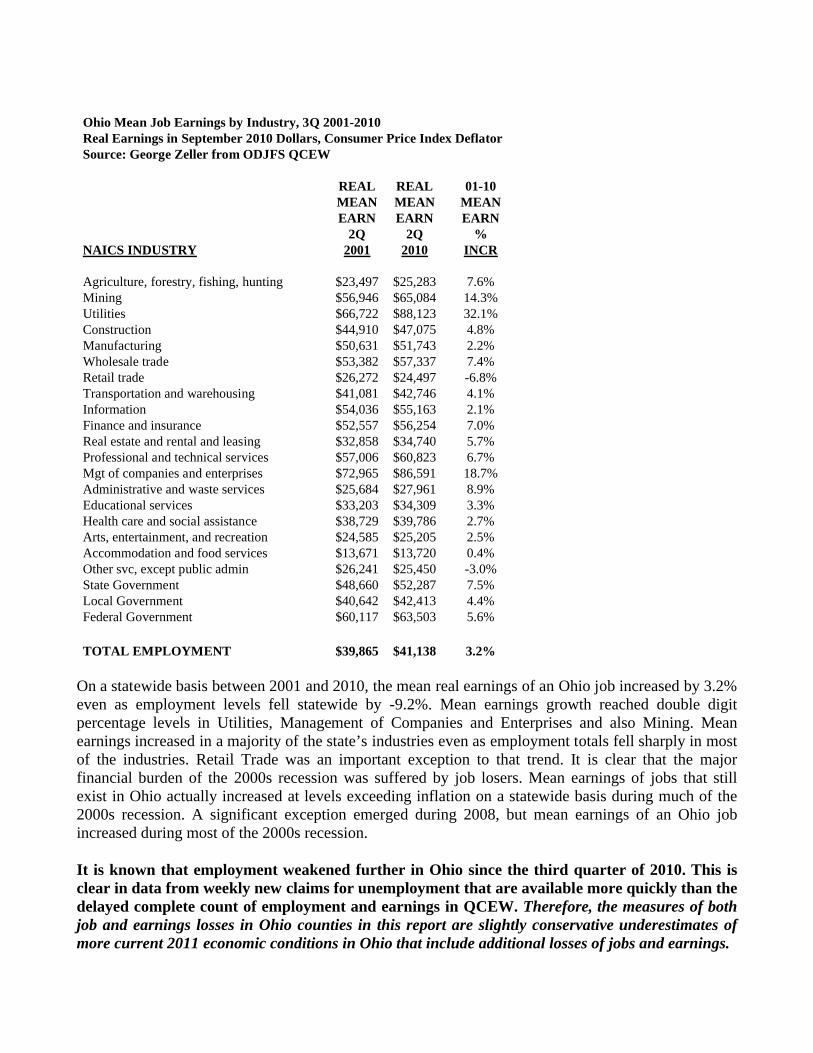
Ohio Mean Job Earnings by Industry, 3Q 2001-2010Real Earnings in September 2010 Dollars, Consumer Price Index DeflatorSource: George Zeller from ODJFS QCEW

REAL REAL 01-10MEAN MEAN MEANEARN EARN EARN

2Q 2Q %NAICS INDUSTRY 2001 2010 INCR

Agriculture, forestry, fishing, hunting $23,497 $25,283 7.6%Mining $56,946 $65,084 14.3%Utilities $66,722 $88,123 32.1%Construction $44,910 $47,075 4.8%Manufacturing $50,631 $51,743 2.2%Wholesale trade $53,382 $57,337 7.4%Retail trade $26,272 $24,497 -6.8%Transportation and warehousing $41,081 $42,746 4.1%Information $54,036 $55,163 2.1%Finance and insurance $52,557 $56,254 7.0%Real estate and rental and leasing $32,858 $34,740 5.7%Professional and technical services $57,006 $60,823 6.7%Mgt of companies and enterprises $72,965 $86,591 18.7%Administrative and waste services $25,684 $27,961 8.9%Educational services $33,203 $34,309 3.3%Health care and social assistance $38,729 $39,786 2.7%Arts, entertainment, and recreation $24,585 $25,205 2.5%Accommodation and food services $13,671 $13,720 0.4%Other svc, except public admin $26,241 $25,450 -3.0%State Government $48,660 $52,287 7.5%Local Government $40,642 $42,413 4.4%Federal Government $60,117 $63,503 5.6%

TOTAL EMPLOYMENT $39,865 $41,138 3.2%

On a statewide basis between 2001 and 2010, the mean real earnings of an Ohio job increased by 3.2% even as employment levels fell statewide by -9.2%. Mean earnings growth reached double digit percentage levels in Utilities, Management of Companies and Enterprises and also Mining. Mean earnings increased in a majority of the state’s industries even as employment totals fell sharply in most of the industries. Retail Trade was an important exception to that trend. It is clear that the major financial burden of the 2000s recession was suffered by job losers. Mean earnings of jobs that still exist in Ohio actually increased at levels exceeding inflation on a statewide basis during much of the 2000s recession. A significant exception emerged during 2008, but mean earnings of an Ohio job increased during most of the 2000s recession.

It is known that employment weakened further in Ohio since the third quarter of 2010. This is clear in data from weekly new claims for unemployment that are available more quickly than the delayed complete count of employment and earnings in QCEW. Therefore, the measures of both job and earnings losses in Ohio counties in this report are slightly conservative underestimates of more current 2011 economic conditions in Ohio that include additional losses of jobs and earnings.

Through the third quarter of 2011 that is measured in QCEW data within this report, Ohio’s job losses since 2000 now have reached -586,593 jobs, a loss of -10.9% of all jobs that Ohio had tenyears ago in 2000. This is true despite the slow job growth of 1,150 nonfederal jobs that Ohio experienced during the one year 2009-2010 period.

Regional Job and Earnings Losses in Ohio

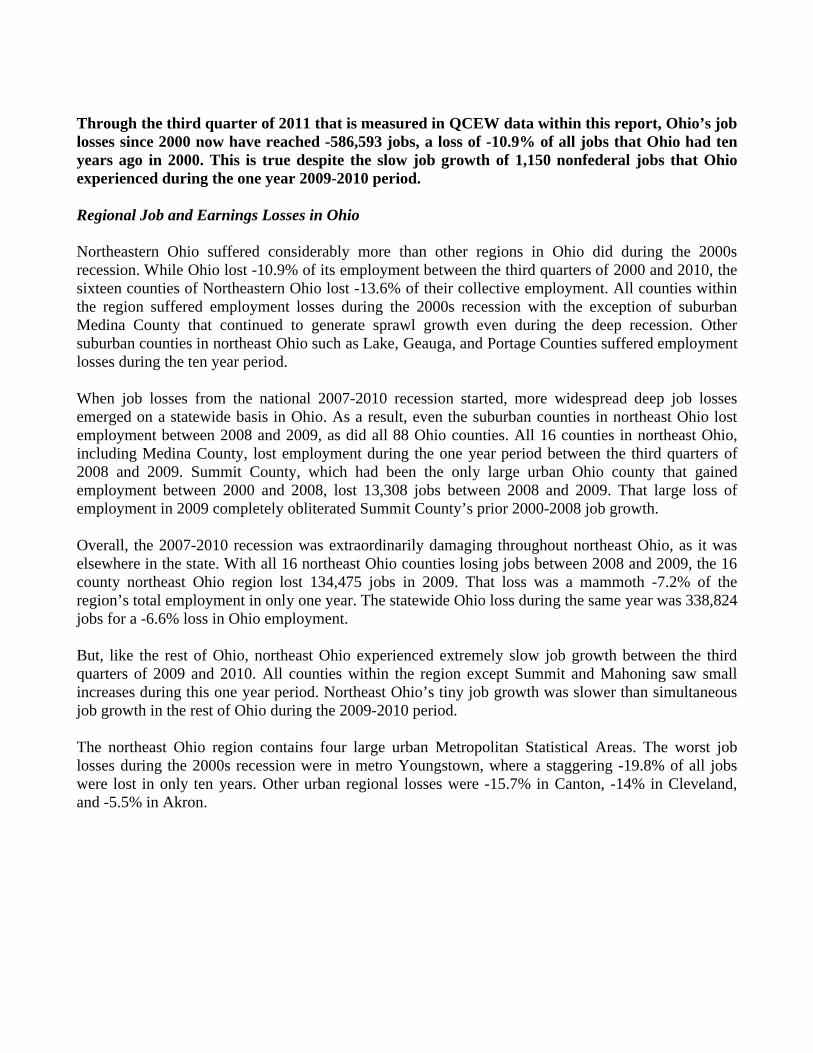
Northeastern Ohio suffered considerably more than other regions in Ohio did during the 2000srecession. While Ohio lost -10.9% of its employment between the third quarters of 2000 and 2010, the sixteen counties of Northeastern Ohio lost -13.6% of their collective employment. All counties within the region suffered employment losses during the 2000s recession with the exception of suburban Medina County that continued to generate sprawl growth even during the deep recession. Other suburban counties in northeast Ohio such as Lake, Geauga, and Portage Counties suffered employment losses during the ten year period.

When job losses from the national 2007-2010 recession started, more widespread deep job losses emerged on a statewide basis in Ohio. As a result, even the suburban counties in northeast Ohio lost employment between 2008 and 2009, as did all 88 Ohio counties. All 16 counties in northeast Ohio, including Medina County, lost employment during the one year period between the third quarters of 2008 and 2009. Summit County, which had been the only large urban Ohio county that gained employment between 2000 and 2008, lost 13,308 jobs between 2008 and 2009. That large loss of employment in 2009 completely obliterated Summit County’s prior 2000-2008 job growth.

Overall, the 2007-2010 recession was extraordinarily damaging throughout northeast Ohio, as it was elsewhere in the state. With all 16 northeast Ohio counties losing jobs between 2008 and 2009, the 16 county northeast Ohio region lost 134,475 jobs in 2009. That loss was a mammoth -7.2% of the region’s total employment in only one year. The statewide Ohio loss during the same year was 338,824 jobs for a -6.6% loss in Ohio employment.

But, like the rest of Ohio, northeast Ohio experienced extremely slow job growth between the third quarters of 2009 and 2010. All counties within the region except Summit and Mahoning saw small increases during this one year period. Northeast Ohio’s tiny job growth was slower than simultaneous job growth in the rest of Ohio during the 2009-2010 period.

The northeast Ohio region contains four large urban Metropolitan Statistical Areas. The worst job losses during the 2000s recession were in metro Youngstown, where a staggering -19.8% of all jobs were lost in only ten years. Other urban regional losses were -15.7% in Canton, -14% in Cleveland, and -5.5% in Akron.

Third Quarter 2000-2010 Job Growth

Northeast Ohio Counties: Total Employment, excluding federal employment

Sorted by 2000-2010 Total Employment % Increase

1Q 1Q 1Q 1Q

TOTAL TOTAL TOTAL TOTAL TOTAL TOTAL 09-10 09-10 00-10 00-10

LARGEST JOBS JOBS JOBS JOBS JOBS JOBS # % # %

# COUNTY CITY 3Q 00 3Q 01 3Q 03 3Q 05 3Q 09 3Q 10 INCR INCR INCR INCR

1 Medina Brunswick 53,548 53,485 56,531 59,856 56,960 57,012 52 0.1% 3,464 6.5%

2 Geauga Chardon 34,053 33,757 33,434 35,694 32,308 32,508 200 0.6% -1,545 -4.5%

3 Portage Kent 52,749 52,455 53,402 53,633 49,325 49,924 599 1.2% -2,825 -5.4%

4 Summit Akron 265,817 256,969 257,884 268,966 252,509 251,173 -1,336 -0.5% -14,644 -5.5%

5 Lake Mentor 101,932 98,879 97,612 100,905 92,847 92,831 -16 0.0% -9,101 -8.9%

6 Ashland Ashland 19,783 19,268 18,507 18,426 17,110 17,260 150 0.9% -2,523 -12.8%

7 Lorain Lorain 105,067 100,359 99,736 100,446 90,950 91,146 196 0.2% -13,921 -13.2%

8 Wayne Wooster 48,132 47,479 48,231 48,031 41,302 41,298 -4 0.0% -6,834 -14.2%

9 Mahoning Youngstown 111,991 108,182 104,120 106,113 95,555 95,011 -544 -0.6% -16,980 -15.2%

10 Stark Canton 175,766 173,668 165,812 165,357 147,906 148,149 243 0.2% -27,617 -15.7%

11 Ashtabula Ashtabula 35,368 33,357 33,282 33,635 28,692 29,605 913 3.2% -5,763 -16.3%

12 Cuyahoga Cleveland 804,287 781,918 749,699 741,135 671,575 671,525 -50 0.0% -132,762 -16.5%

13 Carroll Carrolton 6,707 6,701 5,796 5,666 5,412 5,590 178 3.3% -1,117 -16.7%

14 Richland Mansfield 60,981 59,926 58,687 57,506 50,202 50,611 409 0.8% -10,370 -17.0%

15 Columbiana E. Liverpool 34,646 33,135 32,797 31,895 28,470 28,636 166 0.6% -6,010 -17.3%

16 Trumbull Warren 94,851 89,124 85,154 83,332 66,814 70,025 3,211 4.8% -24,826 -26.2%

NE OHIO TOTAL 2,005,678 1,948,662 1,900,684 1,910,596 1,727,937 1,732,304 4,367 0.3% -273,374 -13.6%

OH 88 COUNTY TOTAL 5,378,142 5,277,887 5,185,311 5,223,382 4,790,399 4,791,549 1,150 0.0% -586,593 -10.9%

AKRON MSA 318,566 309,424 311,286 322,599 301,834 301,097 -737 -0.2% -17,469 -5.5%

CLEVELAND MSA 1,098,887 1,068,398 1,037,012 1,038,036 944,640 945,022 382 0.0% -153,865 -14.0%

CANTON MSA 182,473 180,369 171,608 171,023 153,318 153,739 421 0.3% -28,734 -15.7%

YOUNGSTOWN MSA 241,488 230,441 222,071 221,340 190,839 193,672 2,833 1.5% -47,816 -19.8%

Source: ODJFS QCEW ES-202 Complete Count of Jobs and George Zeller

In Manufacturing, the regional job losses in northeast Ohio were far worse. The sixteen county region lost a whopping -35.5% of its high wage Manufacturing jobs in only nine years between 2001 and 2010. Trumbull County in Warren lost a staggering 48% of its Manufacturing employment. All sixteen regional counties lost at least one-fifth of their Manufacturing employment, including suburban sprawl counties that actually gained employment during the 2000s recession.

All of the urban multi-county Metropolitan Statistical Areas in the northeast Ohio region lost enormous levels of Manufacturing employment during the 2000s recession. The staggering figures were terrible. Akron lost -33.8%, Cleveland lost -33.6%, Canton lost -40.7%, and Youngstown lost an absolutely crushing -41.6%.

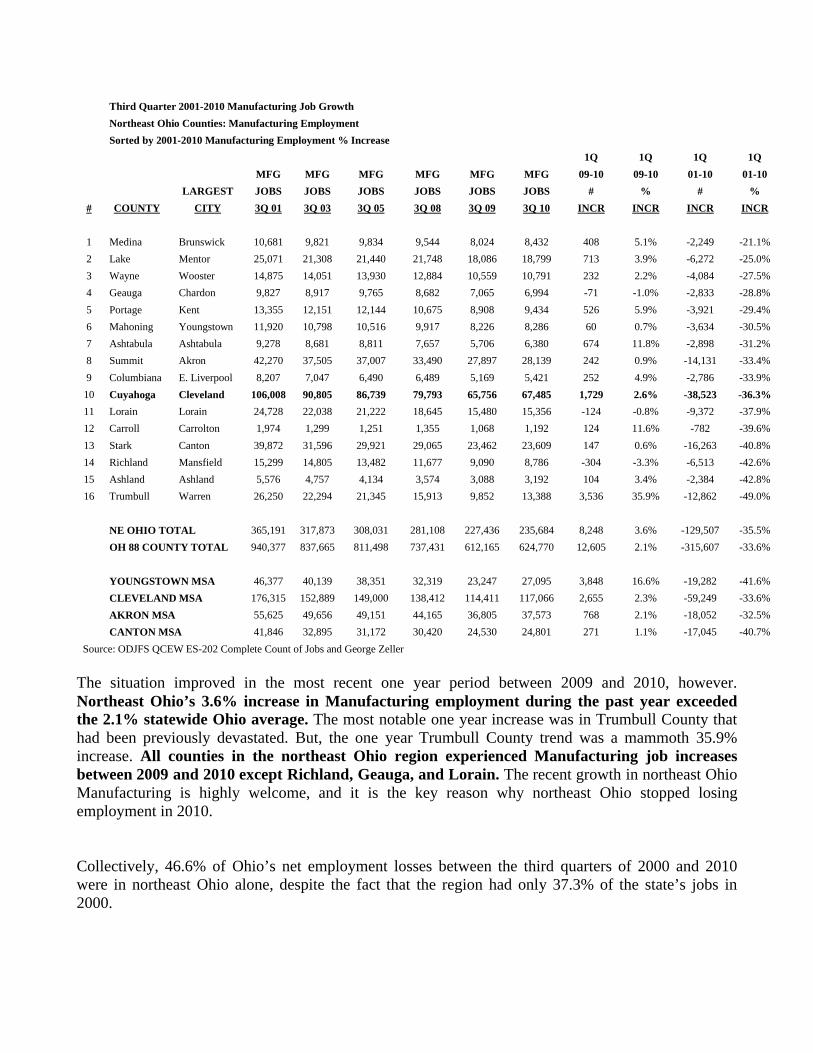
Third Quarter 2001-2010 Manufacturing Job Growth

Northeast Ohio Counties: Manufacturing Employment

Sorted by 2001-2010 Manufacturing Employment % Increase

1Q 1Q 1Q 1Q

MFG MFG MFG MFG MFG MFG 09-10 09-10 01-10 01-10

LARGEST JOBS JOBS JOBS JOBS JOBS JOBS # % # %

# COUNTY CITY 3Q 01 3Q 03 3Q 05 3Q 08 3Q 09 3Q 10 INCR INCR INCR INCR

1 Medina Brunswick 10,681 9,821 9,834 9,544 8,024 8,432 408 5.1% -2,249 -21.1%

2 Lake Mentor 25,071 21,308 21,440 21,748 18,086 18,799 713 3.9% -6,272 -25.0%

3 Wayne Wooster 14,875 14,051 13,930 12,884 10,559 10,791 232 2.2% -4,084 -27.5%

4 Geauga Chardon 9,827 8,917 9,765 8,682 7,065 6,994 -71 -1.0% -2,833 -28.8%

5 Portage Kent 13,355 12,151 12,144 10,675 8,908 9,434 526 5.9% -3,921 -29.4%

6 Mahoning Youngstown 11,920 10,798 10,516 9,917 8,226 8,286 60 0.7% -3,634 -30.5%

7 Ashtabula Ashtabula 9,278 8,681 8,811 7,657 5,706 6,380 674 11.8% -2,898 -31.2%

8 Summit Akron 42,270 37,505 37,007 33,490 27,897 28,139 242 0.9% -14,131 -33.4%

9 Columbiana E. Liverpool 8,207 7,047 6,490 6,489 5,169 5,421 252 4.9% -2,786 -33.9%

10 Cuyahoga Cleveland 106,008 90,805 86,739 79,793 65,756 67,485 1,729 2.6% -38,523 -36.3%

11 Lorain Lorain 24,728 22,038 21,222 18,645 15,480 15,356 -124 -0.8% -9,372 -37.9%

12 Carroll Carrolton 1,974 1,299 1,251 1,355 1,068 1,192 124 11.6% -782 -39.6%

13 Stark Canton 39,872 31,596 29,921 29,065 23,462 23,609 147 0.6% -16,263 -40.8%

14 Richland Mansfield 15,299 14,805 13,482 11,677 9,090 8,786 -304 -3.3% -6,513 -42.6%

15 Ashland Ashland 5,576 4,757 4,134 3,574 3,088 3,192 104 3.4% -2,384 -42.8%

16 Trumbull Warren 26,250 22,294 21,345 15,913 9,852 13,388 3,536 35.9% -12,862 -49.0%

NE OHIO TOTAL 365,191 317,873 308,031 281,108 227,436 235,684 8,248 3.6% -129,507 -35.5%

OH 88 COUNTY TOTAL 940,377 837,665 811,498 737,431 612,165 624,770 12,605 2.1% -315,607 -33.6%

YOUNGSTOWN MSA 46,377 40,139 38,351 32,319 23,247 27,095 3,848 16.6% -19,282 -41.6%

CLEVELAND MSA 176,315 152,889 149,000 138,412 114,411 117,066 2,655 2.3% -59,249 -33.6%

AKRON MSA 55,625 49,656 49,151 44,165 36,805 37,573 768 2.1% -18,052 -32.5%

CANTON MSA 41,846 32,895 31,172 30,420 24,530 24,801 271 1.1% -17,045 -40.7%

Source: ODJFS QCEW ES-202 Complete Count of Jobs and George Zeller

The situation improved in the most recent one year period between 2009 and 2010, however. Northeast Ohio’s 3.6% increase in Manufacturing employment during the past year exceeded the 2.1% statewide Ohio average. The most notable one year increase was in Trumbull County thathad been previously devastated. But, the one year Trumbull County trend was a mammoth 35.9% increase. All counties in the northeast Ohio region experienced Manufacturing job increases between 2009 and 2010 except Richland, Geauga, and Lorain. The recent growth in northeast Ohio Manufacturing is highly welcome, and it is the key reason why northeast Ohio stopped losing employment in 2010.

Collectively, 46.6% of Ohio’s net employment losses between the third quarters of 2000 and 2010were in northeast Ohio alone, despite the fact that the region had only 37.3% of the state’s jobs in 2000.

Acknowledgment

George Zeller thanks the Cuyahoga County Board of Commissioners for their important financial support that made this report possible.

Data Tables

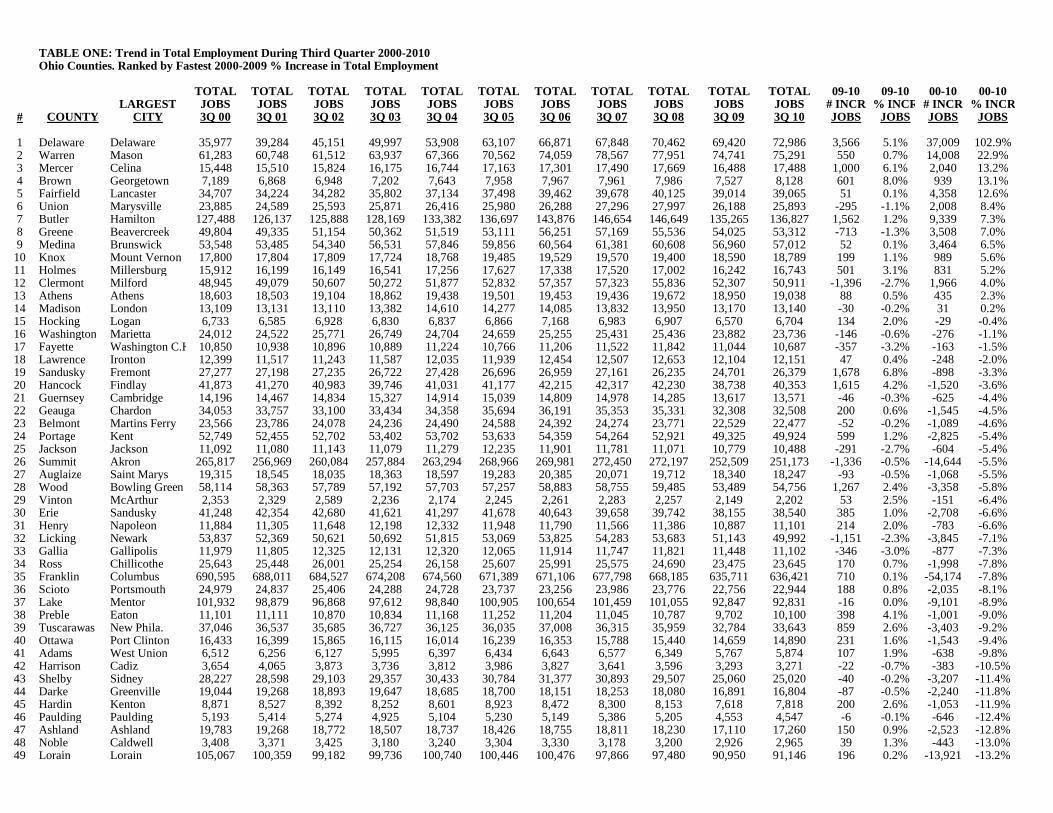
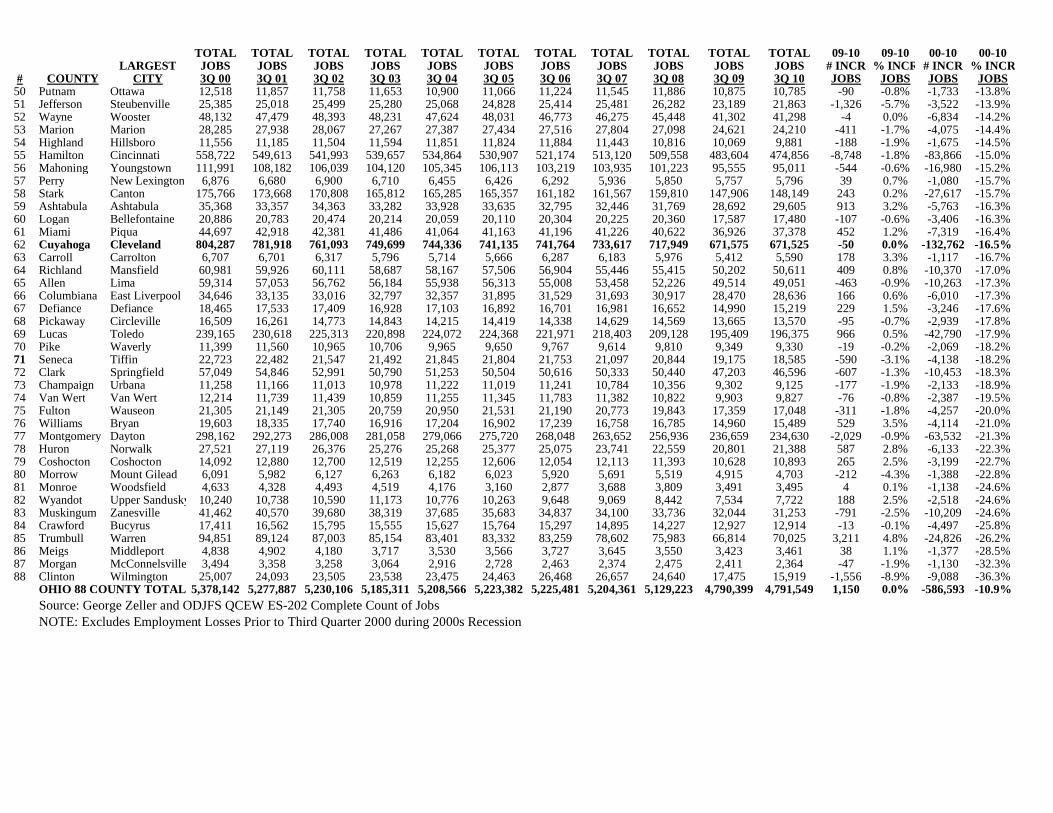
TABLE ONE: Trend in Total Employment During Third Quarter 2000-2010Ohio Counties. Ranked by Fastest 2000-2009 % Increase in Total Employment

TOTAL TOTAL TOTAL TOTAL TOTAL TOTAL TOTAL TOTAL TOTAL TOTAL TOTAL 09-10 09-10 00-10 00-10LARGEST JOBS JOBS JOBS JOBS JOBS JOBS JOBS JOBS JOBS JOBS JOBS # INCR % INCR # INCR % INCR

# COUNTY CITY 3Q 00 3Q 01 3Q 02 3Q 03 3Q 04 3Q 05 3Q 06 3Q 07 3Q 08 3Q 09 3Q 10 JOBS JOBS JOBS JOBS

1 Delaware Delaware 35,977 39,284 45,151 49,997 53,908 63,107 66,871 67,848 70,462 69,420 72,986 3,566 5.1% 37,009 102.9%2 Warren Mason 61,283 60,748 61,512 63,937 67,366 70,562 74,059 78,567 77,951 74,741 75,291 550 0.7% 14,008 22.9%3 Mercer Celina 15,448 15,510 15,824 16,175 16,744 17,163 17,301 17,490 17,669 16,488 17,488 1,000 6.1% 2,040 13.2%4 Brown Georgetown 7,189 6,868 6,948 7,202 7,643 7,958 7,967 7,961 7,986 7,527 8,128 601 8.0% 939 13.1%5 Fairfield Lancaster 34,707 34,224 34,282 35,802 37,134 37,498 39,462 39,678 40,125 39,014 39,065 51 0.1% 4,358 12.6%6 Union Marysville 23,885 24,589 25,593 25,871 26,416 25,980 26,288 27,296 27,997 26,188 25,893 -295 -1.1% 2,008 8.4%7 Butler Hamilton 127,488 126,137 125,888 128,169 133,382 136,697 143,876 146,654 146,649 135,265 136,827 1,562 1.2% 9,339 7.3%8 Greene Beavercreek 49,804 49,335 51,154 50,362 51,519 53,111 56,251 57,169 55,536 54,025 53,312 -713 -1.3% 3,508 7.0%9 Medina Brunswick 53,548 53,485 54,340 56,531 57,846 59,856 60,564 61,381 60,608 56,960 57,012 52 0.1% 3,464 6.5%

10 Knox Mount Vernon 17,800 17,804 17,809 17,724 18,768 19,485 19,529 19,570 19,400 18,590 18,789 199 1.1% 989 5.6%11 Holmes Millersburg 15,912 16,199 16,149 16,541 17,256 17,627 17,338 17,520 17,002 16,242 16,743 501 3.1% 831 5.2%12 Clermont Milford 48,945 49,079 50,607 50,272 51,877 52,832 57,357 57,323 55,836 52,307 50,911 -1,396 -2.7% 1,966 4.0%13 Athens Athens 18,603 18,503 19,104 18,862 19,438 19,501 19,453 19,436 19,672 18,950 19,038 88 0.5% 435 2.3%14 Madison London 13,109 13,131 13,110 13,382 14,610 14,277 14,085 13,832 13,950 13,170 13,140 -30 -0.2% 31 0.2%15 Hocking Logan 6,733 6,585 6,928 6,830 6,837 6,866 7,168 6,983 6,907 6,570 6,704 134 2.0% -29 -0.4%16 Washington Marietta 24,012 24,522 25,771 26,749 24,704 24,659 25,255 25,431 25,436 23,882 23,736 -146 -0.6% -276 -1.1%17 Fayette Washington C.H. 10,850 10,938 10,896 10,889 11,224 10,766 11,206 11,522 11,842 11,044 10,687 -357 -3.2% -163 -1.5%18 Lawrence Ironton 12,399 11,517 11,243 11,587 12,035 11,939 12,454 12,507 12,653 12,104 12,151 47 0.4% -248 -2.0%19 Sandusky Fremont 27,277 27,198 27,235 26,722 27,428 26,696 26,959 27,161 26,235 24,701 26,379 1,678 6.8% -898 -3.3%20 Hancock Findlay 41,873 41,270 40,983 39,746 41,031 41,177 42,215 42,317 42,230 38,738 40,353 1,615 4.2% -1,520 -3.6%21 Guernsey Cambridge 14,196 14,467 14,834 15,327 14,914 15,039 14,809 14,978 14,285 13,617 13,571 -46 -0.3% -625 -4.4%22 Geauga Chardon 34,053 33,757 33,100 33,434 34,358 35,694 36,191 35,353 35,331 32,308 32,508 200 0.6% -1,545 -4.5%23 Belmont Martins Ferry 23,566 23,786 24,078 24,236 24,490 24,588 24,392 24,274 23,771 22,529 22,477 -52 -0.2% -1,089 -4.6%24 Portage Kent 52,749 52,455 52,702 53,402 53,702 53,633 54,359 54,264 52,921 49,325 49,924 599 1.2% -2,825 -5.4%25 Jackson Jackson 11,092 11,080 11,143 11,079 11,279 12,235 11,901 11,781 11,071 10,779 10,488 -291 -2.7% -604 -5.4%26 Summit Akron 265,817 256,969 260,084 257,884 263,294 268,966 269,981 272,450 272,197 252,509 251,173 -1,336 -0.5% -14,644 -5.5%27 Auglaize Saint Marys 19,315 18,545 18,035 18,363 18,597 19,283 20,385 20,071 19,712 18,340 18,247 -93 -0.5% -1,068 -5.5%28 Wood Bowling Green 58,114 58,363 57,789 57,192 57,703 57,257 58,883 58,755 59,485 53,489 54,756 1,267 2.4% -3,358 -5.8%29 Vinton McArthur 2,353 2,329 2,589 2,236 2,174 2,245 2,261 2,283 2,257 2,149 2,202 53 2.5% -151 -6.4%30 Erie Sandusky 41,248 42,354 42,680 41,621 41,297 41,678 40,643 39,658 39,742 38,155 38,540 385 1.0% -2,708 -6.6%31 Henry Napoleon 11,884 11,305 11,648 12,198 12,332 11,948 11,790 11,566 11,386 10,887 11,101 214 2.0% -783 -6.6%32 Licking Newark 53,837 52,369 50,621 50,692 51,815 53,069 53,825 54,283 53,683 51,143 49,992 -1,151 -2.3% -3,845 -7.1%33 Gallia Gallipolis 11,979 11,805 12,325 12,131 12,320 12,065 11,914 11,747 11,821 11,448 11,102 -346 -3.0% -877 -7.3%34 Ross Chillicothe 25,643 25,448 26,001 25,254 26,158 25,607 25,991 25,575 24,690 23,475 23,645 170 0.7% -1,998 -7.8%35 Franklin Columbus 690,595 688,011 684,527 674,208 674,560 671,389 671,106 677,798 668,185 635,711 636,421 710 0.1% -54,174 -7.8%36 Scioto Portsmouth 24,979 24,837 25,406 24,288 24,728 23,737 23,256 23,986 23,776 22,756 22,944 188 0.8% -2,035 -8.1%37 Lake Mentor 101,932 98,879 96,868 97,612 98,840 100,905 100,654 101,459 101,055 92,847 92,831 -16 0.0% -9,101 -8.9%38 Preble Eaton 11,101 11,111 10,870 10,834 11,168 11,252 11,204 11,045 10,787 9,702 10,100 398 4.1% -1,001 -9.0%39 Tuscarawas New Phila. 37,046 36,537 35,685 36,727 36,125 36,035 37,008 36,315 35,959 32,784 33,643 859 2.6% -3,403 -9.2%40 Ottawa Port Clinton 16,433 16,399 15,865 16,115 16,014 16,239 16,353 15,788 15,440 14,659 14,890 231 1.6% -1,543 -9.4%41 Adams West Union 6,512 6,256 6,127 5,995 6,397 6,434 6,643 6,577 6,349 5,767 5,874 107 1.9% -638 -9.8%42 Harrison Cadiz 3,654 4,065 3,873 3,736 3,812 3,986 3,827 3,641 3,596 3,293 3,271 -22 -0.7% -383 -10.5%43 Shelby Sidney 28,227 28,598 29,103 29,357 30,433 30,784 31,377 30,893 29,507 25,060 25,020 -40 -0.2% -3,207 -11.4%44 Darke Greenville 19,044 19,268 18,893 19,647 18,685 18,700 18,151 18,253 18,080 16,891 16,804 -87 -0.5% -2,240 -11.8%45 Hardin Kenton 8,871 8,527 8,392 8,252 8,601 8,923 8,472 8,300 8,153 7,618 7,818 200 2.6% -1,053 -11.9%46 Paulding Paulding 5,193 5,414 5,274 4,925 5,104 5,230 5,149 5,386 5,205 4,553 4,547 -6 -0.1% -646 -12.4%47 Ashland Ashland 19,783 19,268 18,772 18,507 18,737 18,426 18,755 18,811 18,230 17,110 17,260 150 0.9% -2,523 -12.8%48 Noble Caldwell 3,408 3,371 3,425 3,180 3,240 3,304 3,330 3,178 3,200 2,926 2,965 39 1.3% -443 -13.0%49 Lorain Lorain 105,067 100,359 99,182 99,736 100,740 100,446 100,476 97,866 97,480 90,950 91,146 196 0.2% -13,921 -13.2%

TOTAL TOTAL TOTAL TOTAL TOTAL TOTAL TOTAL TOTAL TOTAL TOTAL TOTAL 09-10 09-10 00-10 00-10LARGEST JOBS JOBS JOBS JOBS JOBS JOBS JOBS JOBS JOBS JOBS JOBS # INCR % INCR # INCR % INCR

# COUNTY CITY 3Q 00 3Q 01 3Q 02 3Q 03 3Q 04 3Q 05 3Q 06 3Q 07 3Q 08 3Q 09 3Q 10 JOBS JOBS JOBS JOBS50 Putnam Ottawa 12,518 11,857 11,758 11,653 10,900 11,066 11,224 11,545 11,886 10,875 10,785 -90 -0.8% -1,733 -13.8%51 Jefferson Steubenville 25,385 25,018 25,499 25,280 25,068 24,828 25,414 25,481 26,282 23,189 21,863 -1,326 -5.7% -3,522 -13.9%52 Wayne Wooster 48,132 47,479 48,393 48,231 47,624 48,031 46,773 46,275 45,448 41,302 41,298 -4 0.0% -6,834 -14.2%53 Marion Marion 28,285 27,938 28,067 27,267 27,387 27,434 27,516 27,804 27,098 24,621 24,210 -411 -1.7% -4,075 -14.4%54 Highland Hillsboro 11,556 11,185 11,504 11,594 11,851 11,824 11,884 11,443 10,816 10,069 9,881 -188 -1.9% -1,675 -14.5%55 Hamilton Cincinnati 558,722 549,613 541,993 539,657 534,864 530,907 521,174 513,120 509,558 483,604 474,856 -8,748 -1.8% -83,866 -15.0%56 Mahoning Youngstown 111,991 108,182 106,039 104,120 105,345 106,113 103,219 103,935 101,223 95,555 95,011 -544 -0.6% -16,980 -15.2%57 Perry New Lexington 6,876 6,680 6,900 6,710 6,455 6,426 6,292 5,936 5,850 5,757 5,796 39 0.7% -1,080 -15.7%58 Stark Canton 175,766 173,668 170,808 165,812 165,285 165,357 161,182 161,567 159,810 147,906 148,149 243 0.2% -27,617 -15.7%59 Ashtabula Ashtabula 35,368 33,357 34,363 33,282 33,928 33,635 32,795 32,446 31,769 28,692 29,605 913 3.2% -5,763 -16.3%60 Logan Bellefontaine 20,886 20,783 20,474 20,214 20,059 20,110 20,304 20,225 20,360 17,587 17,480 -107 -0.6% -3,406 -16.3%61 Miami Piqua 44,697 42,918 42,381 41,486 41,064 41,163 41,196 41,226 40,622 36,926 37,378 452 1.2% -7,319 -16.4%62 Cuyahoga Cleveland 804,287 781,918 761,093 749,699 744,336 741,135 741,764 733,617 717,949 671,575 671,525 -50 0.0% -132,762 -16.5%63 Carroll Carrolton 6,707 6,701 6,317 5,796 5,714 5,666 6,287 6,183 5,976 5,412 5,590 178 3.3% -1,117 -16.7%64 Richland Mansfield 60,981 59,926 60,111 58,687 58,167 57,506 56,904 55,446 55,415 50,202 50,611 409 0.8% -10,370 -17.0%65 Allen Lima 59,314 57,053 56,762 56,184 55,938 56,313 55,008 53,458 52,226 49,514 49,051 -463 -0.9% -10,263 -17.3%66 Columbiana East Liverpool 34,646 33,135 33,016 32,797 32,357 31,895 31,529 31,693 30,917 28,470 28,636 166 0.6% -6,010 -17.3%67 Defiance Defiance 18,465 17,533 17,409 16,928 17,103 16,892 16,701 16,981 16,652 14,990 15,219 229 1.5% -3,246 -17.6%68 Pickaway Circleville 16,509 16,261 14,773 14,843 14,215 14,419 14,338 14,629 14,569 13,665 13,570 -95 -0.7% -2,939 -17.8%69 Lucas Toledo 239,165 230,618 225,313 220,898 224,072 224,368 221,971 218,403 209,128 195,409 196,375 966 0.5% -42,790 -17.9%70 Pike Waverly 11,399 11,560 10,965 10,706 9,965 9,650 9,767 9,614 9,810 9,349 9,330 -19 -0.2% -2,069 -18.2%71 Seneca Tiffin 22,723 22,482 21,547 21,492 21,845 21,804 21,753 21,097 20,844 19,175 18,585 -590 -3.1% -4,138 -18.2%72 Clark Springfield 57,049 54,846 52,991 50,790 51,253 50,504 50,616 50,333 50,440 47,203 46,596 -607 -1.3% -10,453 -18.3%73 Champaign Urbana 11,258 11,166 11,013 10,978 11,222 11,019 11,241 10,784 10,356 9,302 9,125 -177 -1.9% -2,133 -18.9%74 Van Wert Van Wert 12,214 11,739 11,439 10,859 11,255 11,345 11,783 11,382 10,822 9,903 9,827 -76 -0.8% -2,387 -19.5%75 Fulton Wauseon 21,305 21,149 21,305 20,759 20,950 21,531 21,190 20,773 19,843 17,359 17,048 -311 -1.8% -4,257 -20.0%76 Williams Bryan 19,603 18,335 17,740 16,916 17,204 16,902 17,239 16,758 16,785 14,960 15,489 529 3.5% -4,114 -21.0%77 Montgomery Dayton 298,162 292,273 286,008 281,058 279,066 275,720 268,048 263,652 256,936 236,659 234,630 -2,029 -0.9% -63,532 -21.3%78 Huron Norwalk 27,521 27,119 26,376 25,276 25,268 25,377 25,075 23,741 22,559 20,801 21,388 587 2.8% -6,133 -22.3%79 Coshocton Coshocton 14,092 12,880 12,700 12,519 12,255 12,606 12,054 12,113 11,393 10,628 10,893 265 2.5% -3,199 -22.7%80 Morrow Mount Gilead 6,091 5,982 6,127 6,263 6,182 6,023 5,920 5,691 5,519 4,915 4,703 -212 -4.3% -1,388 -22.8%81 Monroe Woodsfield 4,633 4,328 4,493 4,519 4,176 3,160 2,877 3,688 3,809 3,491 3,495 4 0.1% -1,138 -24.6%82 Wyandot Upper Sandusky 10,240 10,738 10,590 11,173 10,776 10,263 9,648 9,069 8,442 7,534 7,722 188 2.5% -2,518 -24.6%83 Muskingum Zanesville 41,462 40,570 39,680 38,319 37,685 35,683 34,837 34,100 33,736 32,044 31,253 -791 -2.5% -10,209 -24.6%84 Crawford Bucyrus 17,411 16,562 15,795 15,555 15,627 15,764 15,297 14,895 14,227 12,927 12,914 -13 -0.1% -4,497 -25.8%85 Trumbull Warren 94,851 89,124 87,003 85,154 83,401 83,332 83,259 78,602 75,983 66,814 70,025 3,211 4.8% -24,826 -26.2%86 Meigs Middleport 4,838 4,902 4,180 3,717 3,530 3,566 3,727 3,645 3,550 3,423 3,461 38 1.1% -1,377 -28.5%87 Morgan McConnelsville 3,494 3,358 3,258 3,064 2,916 2,728 2,463 2,374 2,475 2,411 2,364 -47 -1.9% -1,130 -32.3%88 Clinton Wilmington 25,007 24,093 23,505 23,538 23,475 24,463 26,468 26,657 24,640 17,475 15,919 -1,556 -8.9% -9,088 -36.3%

OHIO 88 COUNTY TOTAL 5,378,142 5,277,887 5,230,106 5,185,311 5,208,566 5,223,382 5,225,481 5,204,361 5,129,223 4,790,399 4,791,549 1,150 0.0% -586,593 -10.9%Source: George Zeller and ODJFS QCEW ES-202 Complete Count of JobsNOTE: Excludes Employment Losses Prior to Third Quarter 2000 during 2000s Recession

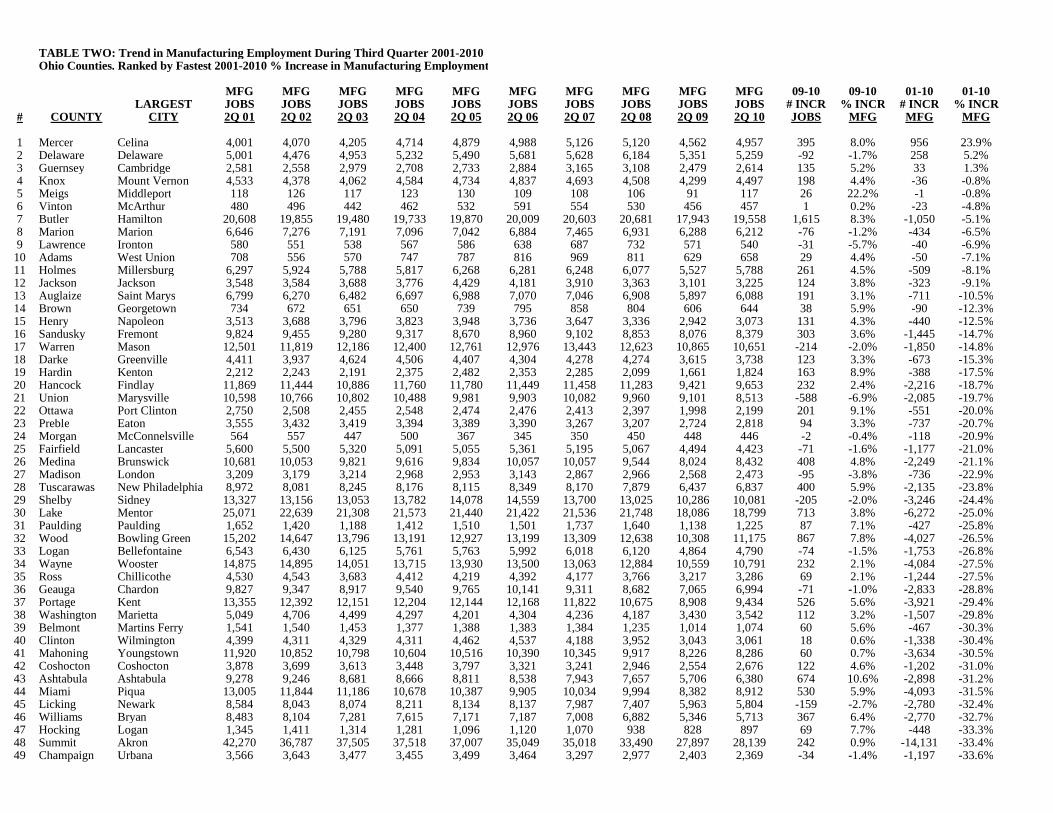
TABLE TWO: Trend in Manufacturing Employment During Third Quarter 2001-2010Ohio Counties. Ranked by Fastest 2001-2010 % Increase in Manufacturing Employment

MFG MFG MFG MFG MFG MFG MFG MFG MFG MFG 09-10 09-10 01-10 01-10LARGEST JOBS JOBS JOBS JOBS JOBS JOBS JOBS JOBS JOBS JOBS # INCR % INCR # INCR % INCR

# COUNTY CITY 2Q 01 2Q 02 2Q 03 2Q 04 2Q 05 2Q 06 2Q 07 2Q 08 2Q 09 2Q 10 JOBS MFG MFG MFG

1 Mercer Celina 4,001 4,070 4,205 4,714 4,879 4,988 5,126 5,120 4,562 4,957 395 8.0% 956 23.9%2 Delaware Delaware 5,001 4,476 4,953 5,232 5,490 5,681 5,628 6,184 5,351 5,259 -92 -1.7% 258 5.2%3 Guernsey Cambridge 2,581 2,558 2,979 2,708 2,733 2,884 3,165 3,108 2,479 2,614 135 5.2% 33 1.3%4 Knox Mount Vernon 4,533 4,378 4,062 4,584 4,734 4,837 4,693 4,508 4,299 4,497 198 4.4% -36 -0.8%5 Meigs Middleport 118 126 117 123 130 109 108 106 91 117 26 22.2% -1 -0.8%6 Vinton McArthur 480 496 442 462 532 591 554 530 456 457 1 0.2% -23 -4.8%7 Butler Hamilton 20,608 19,855 19,480 19,733 19,870 20,009 20,603 20,681 17,943 19,558 1,615 8.3% -1,050 -5.1%8 Marion Marion 6,646 7,276 7,191 7,096 7,042 6,884 7,465 6,931 6,288 6,212 -76 -1.2% -434 -6.5%9 Lawrence Ironton 580 551 538 567 586 638 687 732 571 540 -31 -5.7% -40 -6.9%

10 Adams West Union 708 556 570 747 787 816 969 811 629 658 29 4.4% -50 -7.1%11 Holmes Millersburg 6,297 5,924 5,788 5,817 6,268 6,281 6,248 6,077 5,527 5,788 261 4.5% -509 -8.1%12 Jackson Jackson 3,548 3,584 3,688 3,776 4,429 4,181 3,910 3,363 3,101 3,225 124 3.8% -323 -9.1%13 Auglaize Saint Marys 6,799 6,270 6,482 6,697 6,988 7,070 7,046 6,908 5,897 6,088 191 3.1% -711 -10.5%14 Brown Georgetown 734 672 651 650 739 795 858 804 606 644 38 5.9% -90 -12.3%15 Henry Napoleon 3,513 3,688 3,796 3,823 3,948 3,736 3,647 3,336 2,942 3,073 131 4.3% -440 -12.5%16 Sandusky Fremont 9,824 9,455 9,280 9,317 8,670 8,960 9,102 8,853 8,076 8,379 303 3.6% -1,445 -14.7%17 Warren Mason 12,501 11,819 12,186 12,400 12,761 12,976 13,443 12,623 10,865 10,651 -214 -2.0% -1,850 -14.8%18 Darke Greenville 4,411 3,937 4,624 4,506 4,407 4,304 4,278 4,274 3,615 3,738 123 3.3% -673 -15.3%19 Hardin Kenton 2,212 2,243 2,191 2,375 2,482 2,353 2,285 2,099 1,661 1,824 163 8.9% -388 -17.5%20 Hancock Findlay 11,869 11,444 10,886 11,760 11,780 11,449 11,458 11,283 9,421 9,653 232 2.4% -2,216 -18.7%21 Union Marysville 10,598 10,766 10,802 10,488 9,981 9,903 10,082 9,960 9,101 8,513 -588 -6.9% -2,085 -19.7%22 Ottawa Port Clinton 2,750 2,508 2,455 2,548 2,474 2,476 2,413 2,397 1,998 2,199 201 9.1% -551 -20.0%23 Preble Eaton 3,555 3,432 3,419 3,394 3,389 3,390 3,267 3,207 2,724 2,818 94 3.3% -737 -20.7%24 Morgan McConnelsville 564 557 447 500 367 345 350 450 448 446 -2 -0.4% -118 -20.9%25 Fairfield Lancaster 5,600 5,500 5,320 5,091 5,055 5,361 5,195 5,067 4,494 4,423 -71 -1.6% -1,177 -21.0%26 Medina Brunswick 10,681 10,053 9,821 9,616 9,834 10,057 10,057 9,544 8,024 8,432 408 4.8% -2,249 -21.1%27 Madison London 3,209 3,179 3,214 2,968 2,953 3,143 2,867 2,966 2,568 2,473 -95 -3.8% -736 -22.9%28 Tuscarawas New Philadelphia 8,972 8,081 8,245 8,176 8,115 8,349 8,170 7,879 6,437 6,837 400 5.9% -2,135 -23.8%29 Shelby Sidney 13,327 13,156 13,053 13,782 14,078 14,559 13,700 13,025 10,286 10,081 -205 -2.0% -3,246 -24.4%30 Lake Mentor 25,071 22,639 21,308 21,573 21,440 21,422 21,536 21,748 18,086 18,799 713 3.8% -6,272 -25.0%31 Paulding Paulding 1,652 1,420 1,188 1,412 1,510 1,501 1,737 1,640 1,138 1,225 87 7.1% -427 -25.8%32 Wood Bowling Green 15,202 14,647 13,796 13,191 12,927 13,199 13,309 12,638 10,308 11,175 867 7.8% -4,027 -26.5%33 Logan Bellefontaine 6,543 6,430 6,125 5,761 5,763 5,992 6,018 6,120 4,864 4,790 -74 -1.5% -1,753 -26.8%34 Wayne Wooster 14,875 14,895 14,051 13,715 13,930 13,500 13,063 12,884 10,559 10,791 232 2.1% -4,084 -27.5%35 Ross Chillicothe 4,530 4,543 3,683 4,412 4,219 4,392 4,177 3,766 3,217 3,286 69 2.1% -1,244 -27.5%36 Geauga Chardon 9,827 9,347 8,917 9,540 9,765 10,141 9,311 8,682 7,065 6,994 -71 -1.0% -2,833 -28.8%37 Portage Kent 13,355 12,392 12,151 12,204 12,144 12,168 11,822 10,675 8,908 9,434 526 5.6% -3,921 -29.4%38 Washington Marietta 5,049 4,706 4,499 4,297 4,201 4,304 4,236 4,187 3,430 3,542 112 3.2% -1,507 -29.8%39 Belmont Martins Ferry 1,541 1,540 1,453 1,377 1,388 1,383 1,384 1,235 1,014 1,074 60 5.6% -467 -30.3%40 Clinton Wilmington 4,399 4,311 4,329 4,311 4,462 4,537 4,188 3,952 3,043 3,061 18 0.6% -1,338 -30.4%41 Mahoning Youngstown 11,920 10,852 10,798 10,604 10,516 10,390 10,345 9,917 8,226 8,286 60 0.7% -3,634 -30.5%42 Coshocton Coshocton 3,878 3,699 3,613 3,448 3,797 3,321 3,241 2,946 2,554 2,676 122 4.6% -1,202 -31.0%43 Ashtabula Ashtabula 9,278 9,246 8,681 8,666 8,811 8,538 7,943 7,657 5,706 6,380 674 10.6% -2,898 -31.2%44 Miami Piqua 13,005 11,844 11,186 10,678 10,387 9,905 10,034 9,994 8,382 8,912 530 5.9% -4,093 -31.5%45 Licking Newark 8,584 8,043 8,074 8,211 8,134 8,137 7,987 7,407 5,963 5,804 -159 -2.7% -2,780 -32.4%46 Williams Bryan 8,483 8,104 7,281 7,615 7,171 7,187 7,008 6,882 5,346 5,713 367 6.4% -2,770 -32.7%47 Hocking Logan 1,345 1,411 1,314 1,281 1,096 1,120 1,070 938 828 897 69 7.7% -448 -33.3%48 Summit Akron 42,270 36,787 37,505 37,518 37,007 35,049 35,018 33,490 27,897 28,139 242 0.9% -14,131 -33.4%49 Champaign Urbana 3,566 3,643 3,477 3,455 3,499 3,464 3,297 2,977 2,403 2,369 -34 -1.4% -1,197 -33.6%

MFG MFG MFG MFG MFG MFG MFG MFG MFG MFG 09-10 09-10 01-10 01-10LARGEST JOBS JOBS JOBS JOBS JOBS JOBS JOBS JOBS JOBS JOBS # INCR % INCR # INCR % INCR

# COUNTY CITY 2Q 01 2Q 02 2Q 03 2Q 04 2Q 05 2Q 06 2Q 07 2Q 08 2Q 09 2Q 10 JOBS MFG MFG MFG50 Hamilton Cincinnati 71,478 66,333 65,937 63,559 60,208 58,101 56,872 55,976 50,213 47,423 -2,790 -5.9% -24,055 -33.7%51 Columbiana East Liverpool 8,207 7,885 7,047 6,621 6,490 6,184 6,672 6,489 5,169 5,421 252 4.6% -2,786 -33.9%52 Greene Beavercreek 4,640 4,425 4,009 3,351 3,793 3,813 3,747 3,552 3,112 3,063 -49 -1.6% -1,577 -34.0%53 Van Wert Van Wert 4,129 3,634 3,418 3,729 3,771 3,811 3,664 3,101 2,516 2,700 184 6.8% -1,429 -34.6%54 Harrison Cadiz 700 706 618 637 660 690 666 609 453 454 1 0.2% -246 -35.1%55 Allen Lima 11,699 11,175 10,942 10,363 10,980 9,769 8,502 8,224 7,531 7,580 49 0.6% -4,119 -35.2%56 Scioto Portsmouth 2,471 2,180 2,151 2,305 2,343 2,232 2,010 2,002 1,571 1,589 18 1.1% -882 -35.7%57 Cuyahoga Cleveland 106,008 96,460 90,805 89,150 86,739 85,894 81,409 79,793 65,756 67,485 1,729 2.6% -38,523 -36.3%58 Defiance Defiance 5,880 5,643 5,277 5,521 5,417 4,982 4,773 4,554 3,559 3,709 150 4.0% -2,171 -36.9%59 Lorain Lorain 24,728 22,669 22,038 21,443 21,222 20,207 19,124 18,645 15,480 15,356 -124 -0.8% -9,372 -37.9%60 Lucas Toledo 30,696 28,094 26,615 26,870 26,157 25,277 23,524 20,865 17,782 19,048 1,266 6.6% -11,648 -37.9%61 Fulton Wauseon 9,316 9,403 8,925 8,968 9,248 8,675 8,171 7,476 5,791 5,755 -36 -0.6% -3,561 -38.2%62 Franklin Columbus 55,128 51,410 46,642 44,815 43,600 42,533 41,636 39,663 34,020 33,643 -377 -1.1% -21,485 -39.0%63 Carroll Carrolton 1,974 1,839 1,299 1,218 1,251 1,453 1,487 1,355 1,068 1,192 124 10.4% -782 -39.6%64 Crawford Bucyrus 5,676 5,160 4,859 5,055 5,398 5,196 4,706 4,004 3,209 3,379 170 5.0% -2,297 -40.5%65 Stark Canton 39,872 36,912 31,596 30,235 29,921 29,061 29,605 29,065 23,462 23,609 147 0.6% -16,263 -40.8%66 Putnam Ottawa 4,014 3,968 3,432 2,730 2,830 3,032 3,201 3,302 2,621 2,364 -257 -10.9% -1,650 -41.1%67 Clermont Milford 8,146 8,044 6,355 6,762 6,810 7,073 6,346 5,755 4,654 4,710 56 1.2% -3,436 -42.2%68 Gallia Gallipolis 992 991 998 867 741 641 621 606 548 573 25 4.4% -419 -42.2%69 Richland Mansfield 15,299 15,125 14,805 13,930 13,482 13,110 12,514 11,677 9,090 8,786 -304 -3.5% -6,513 -42.6%70 Huron Norwalk 9,864 8,956 8,241 8,513 8,370 7,905 7,197 6,407 5,419 5,660 241 4.3% -4,204 -42.6%71 Ashland Ashland 5,576 5,168 4,757 4,366 4,134 4,075 3,819 3,574 3,088 3,192 104 3.3% -2,384 -42.8%72 Erie Sandusky 8,960 8,460 8,023 7,553 7,193 6,780 5,915 5,446 4,870 5,112 242 4.7% -3,848 -42.9%73 Seneca Tiffin 6,036 5,425 5,241 4,928 5,066 5,422 5,127 4,928 3,564 3,361 -203 -6.0% -2,675 -44.3%74 Clark Springfield 11,149 9,558 8,248 7,972 8,142 7,756 7,276 7,055 5,990 5,951 -39 -0.7% -5,198 -46.6%75 Fayette Washington C.H. 2,955 2,701 2,640 2,546 2,319 2,280 2,392 2,266 1,769 1,577 -192 -12.2% -1,378 -46.6%76 Highland Hillsboro 3,057 3,064 2,893 2,897 3,094 2,793 2,374 2,110 1,674 1,607 -67 -4.2% -1,450 -47.4%77 Pickaway Circleville 4,366 3,879 3,647 2,738 2,349 2,437 2,454 2,446 2,233 2,291 58 2.5% -2,075 -47.5%78 Monroe Woodsfield 1,902 1,939 1,662 1,372 330 235 300 340 444 981 537 54.7% -921 -48.4%79 Trumbull Warren 26,250 24,373 22,294 21,912 21,345 19,970 16,408 15,913 9,852 13,388 3,536 26.4% -12,862 -49.0%80 Morrow Mount Gilead 1,371 1,301 1,352 1,454 1,277 1,214 1,180 1,117 820 699 -121 -17.3% -672 -49.0%81 Pike Waverly 5,585 4,842 4,435 3,899 3,550 3,369 3,092 3,082 2,718 2,757 39 1.4% -2,828 -50.6%82 Wyandot Upper Sandusky 4,717 4,411 4,762 4,413 3,969 3,347 2,881 2,568 2,195 2,311 116 5.0% -2,406 -51.0%83 Montgomery Dayton 50,984 47,909 43,873 41,729 40,929 38,454 35,877 31,540 23,820 24,371 551 2.3% -26,613 -52.2%84 Perry New Lexington 1,512 1,499 1,280 1,187 1,137 1,008 881 839 742 709 -33 -4.7% -803 -53.1%85 Jefferson Steubenville 3,451 3,408 3,066 2,856 2,715 2,902 2,866 3,037 1,539 1,605 66 4.1% -1,846 -53.5%86 Athens Athens 973 946 878 845 769 523 509 512 450 428 -22 -5.1% -545 -56.0%87 Noble Caldwell 680 669 568 584 516 501 484 497 256 244 -12 -4.9% -436 -64.1%88 Muskingum Zanesville 9,343 8,545 7,723 7,333 5,565 5,208 4,964 4,480 3,720 3,186 -534 -16.8% -6,157 -65.9%

88 COUNTY TOTAL 940,377 880,218 837,665 824,145 811,498 794,688 769,344 737,431 612,165 624,770 12,605 2.0% -315,607 -33.6%Source: ODJFS QCEW ES-202 Complete Count of Jobs and George ZellerNOTE: Excludes additional job losses 2000-2001, since the US Department of Labor redefined manufacturing jobs from SIC to NAICS in 2001, but released no 2000 figuresNOTE2: Data Supressed in Monroe County in 2007, 2008, 2009 and 2010; Values Interpolated from Statewide Totals

TABLE THREE: Trend in Finance and Insurance Employment During Third Quarter 2001-2010Ohio Counties. Ranked by Fastest 2001-2010 % Increase in Finance and Insurance Employment

FIN FIN FIN FIN FIN FIN FIN FIN FIN FIN 09-10 09-10 01-10 01-10LARGEST JOBS JOBS JOBS JOBS JOBS JOBS JOBS JOBS JOBS JOBS # INCR % INCR # INCR % INCR

# COUNTY CITY 3Q 01 3Q 02 3Q 03 3Q 04 3Q 05 3Q 06 3Q 07 3Q 08 3Q 09 3Q 10 FIN FIN FIN FIN

1 Monroe Woodsfield 115 229 450 414 422 396 397 423 511 509 -2 -0.4% 394 342.6%2 Clark Springfield 990 989 974 2,085 2,124 2,491 2,479 2,566 2,618 2,565 -53 -2.0% 1,575 159.1%3 Delaware Delaware 3,116 4,324 4,884 4,764 4,530 4,483 4,312 4,398 4,522 4,727 205 4.5% 1,611 51.7%4 Warren Mason 2,749 3,163 3,309 4,020 4,594 4,103 4,026 4,511 4,028 3,905 -123 -3.1% 1,156 42.1%5 Wyandot Upper Sandusky 200 210 222 223 221 225 233 200 269 263 -6 -2.2% 63 31.5%6 Geauga Chardon 535 581 623 658 720 715 712 689 681 689 8 1.2% 154 28.8%7 Hardin Kenton 173 180 191 190 210 219 210 214 210 215 5 2.4% 42 24.3%8 Noble Caldwell 71 68 68 68 72 76 76 76 92 88 -4 -4.2% 17 23.9%9 Ross Chillicothe 394 431 507 531 577 586 573 512 487 470 -17 -3.5% 76 19.3%

10 Defiance Defiance 512 539 629 625 656 672 688 606 608 610 2 0.3% 98 19.1%11 Preble Eaton 204 208 210 205 212 222 229 225 235 233 -2 -0.9% 29 14.2%12 Fayette Washington CH 347 335 339 352 346 388 437 422 403 396 -7 -1.7% 49 14.1%13 Clermont Milford 2,519 3,004 3,142 3,118 3,192 3,522 3,661 3,702 3,288 2,872 -416 -12.7% 353 14.0%14 Wood Bowling Green 784 848 857 788 833 853 841 915 902 891 -11 -1.2% 107 13.6%15 Butler Hamilton 7,040 7,376 8,006 8,118 8,493 9,020 8,979 8,770 7,477 7,924 447 6.0% 884 12.6%16 Pike Waverly 183 175 184 181 186 175 177 177 196 204 8 4.1% 21 11.5%17 Holmes Millersburg 338 354 360 355 354 346 354 337 350 369 19 5.4% 31 9.2%18 Henry Napoleon 267 272 267 289 290 288 289 295 293 290 -3 -1.0% 23 8.6%19 Portage Kent 687 717 724 734 760 772 759 714 750 732 -18 -2.4% 45 6.6%20 Gallia Gallipolis 350 354 379 388 406 411 401 395 372 371 -1 -0.3% 21 6.0%21 Shelby Sidney 332 337 348 333 323 360 367 357 357 351 -6 -1.7% 19 5.7%22 Stark Canton 5,491 5,701 5,874 5,842 5,818 6,238 6,109 5,968 5,923 5,783 -140 -2.4% 292 5.3%23 Coshocton Coshocton 237 229 237 244 260 268 268 256 242 249 7 2.9% 12 5.1%24 Madison London 146 158 189 174 176 158 168 177 164 153 -11 -6.7% 7 4.8%25 Fairfield Lancaster 760 862 883 870 894 912 902 823 829 794 -35 -4.2% 34 4.5%26 Highland Hillsboro 359 385 409 430 455 453 498 437 395 368 -27 -6.8% 9 2.5%27 Washington Marietta 694 705 696 706 689 712 703 705 709 711 2 0.3% 17 2.4%28 Hocking Logan 164 187 179 184 188 187 183 184 178 167 -11 -6.2% 3 1.8%29 Lorain Lorain 1,945 2,109 2,130 2,193 2,081 2,064 2,032 1,965 1,959 1,980 21 1.1% 35 1.8%30 Knox Mount Vernon 386 402 405 390 418 409 406 441 411 392 -19 -4.6% 6 1.6%31 Putnam Ottawa 327 378 365 374 363 336 328 334 335 332 -3 -0.9% 5 1.5%32 Van Wert Van Wert 608 604 621 645 631 611 597 612 627 615 -12 -1.9% 7 1.2%33 Tuscarawas New Philadelphia 759 770 795 781 803 783 800 762 748 754 6 0.8% -5 -0.7%34 Ashland Ashland 299 318 309 327 319 312 310 294 258 297 39 15.1% -2 -0.7%35 Muskingum Zanesville 793 747 802 786 927 880 875 797 814 781 -33 -4.1% -12 -1.5%36 Hamilton Cincinnati 25,757 26,094 25,959 24,286 23,804 22,959 23,386 23,850 25,184 25,189 5 0.0% -568 -2.2%37 Mercer Celina 615 630 603 594 592 591 592 589 589 598 9 1.5% -17 -2.8%38 Harrison Cadiz 57 57 57 57 53 56 79 54 55 55 0 0.0% -2 -3.5%39 Jackson Jackson 293 310 324 314 367 362 369 307 302 282 -20 -6.6% -11 -3.8%40 Montgomery Dayton 9,984 10,233 10,625 10,440 10,692 11,562 11,562 10,243 9,583 9,412 -171 -1.8% -572 -5.7%41 Huron Norwalk 447 417 417 445 512 486 488 447 429 413 -16 -3.7% -34 -7.6%42 Miami Piqua 822 852 912 945 1,015 914 944 893 851 759 -92 -10.8% -63 -7.7%43 Darke Greenville 616 609 628 635 605 646 636 609 578 567 -11 -1.9% -49 -8.0%44 Summit Akron 9,266 9,276 9,588 9,604 9,805 9,436 8,988 8,812 8,537 8,509 -28 -0.3% -757 -8.2%45 Ottawa Port Clinton 370 385 414 407 391 387 386 364 335 338 3 0.9% -32 -8.6%46 Lawrence Ironton 306 292 299 306 318 335 343 265 282 279 -3 -1.1% -27 -8.8%47 Lucas Toledo 6,202 6,069 6,214 6,402 6,795 6,643 6,748 6,202 5,900 5,633 -267 -4.5% -569 -9.2%48 Crawford Bucyrus 636 647 672 661 637 639 628 606 561 575 14 2.5% -61 -9.6%49 Sandusky Fremont 549 538 564 600 531 562 542 517 490 496 6 1.2% -53 -9.7%

FIN FIN FIN FIN FIN FIN FIN FIN FIN FIN 09-10 09-10 01-10 01-10LARGEST JOBS JOBS JOBS JOBS JOBS JOBS JOBS JOBS JOBS JOBS # INCR % INCR # INCR % INCR

# COUNTY CITY 3Q 01 3Q 02 3Q 03 3Q 04 3Q 05 3Q 06 3Q 07 3Q 08 3Q 09 3Q 10 FIN FIN FIN FIN50 Marion Marion 500 496 489 505 517 526 523 520 473 446 -27 -5.7% -54 -10.8%51 Erie Sandusky 700 672 676 628 628 623 593 612 618 623 5 0.8% -77 -11.0%52 Franklin Columbus 49,726 47,829 48,844 47,818 46,558 47,751 47,836 45,429 44,475 44,114 -361 -0.8% -5,612 -11.3%53 Licking Newark 2,783 2,319 2,223 2,402 2,265 2,211 2,332 2,391 2,444 2,468 24 1.0% -315 -11.3%54 Belmont Martins Ferry 908 884 890 905 899 844 843 824 793 796 3 0.4% -112 -12.3%55 Brown Georgetown 221 236 256 256 252 256 276 225 201 193 -8 -4.0% -28 -12.7%56 Auglaize Saint Marys 365 370 354 349 367 350 341 345 323 317 -6 -1.9% -48 -13.2%57 Medina Brunswick 1,168 1,093 1,148 1,129 1,255 1,224 1,145 1,073 1,037 1,011 -26 -2.5% -157 -13.4%58 Morrow Mount Gilead 94 89 96 94 95 89 85 90 78 81 3 3.8% -13 -13.8%59 Guernsey Cambridge 287 296 289 269 272 279 270 258 260 244 -16 -6.2% -43 -15.0%60 Williams Bryan 377 347 345 353 345 337 328 348 338 316 -22 -6.5% -61 -16.2%61 Athens Athens 486 515 499 518 459 473 463 443 415 407 -8 -1.9% -79 -16.3%62 Richland Mansfield 1,319 1,370 1,241 1,222 1,237 1,199 1,182 1,196 1,158 1,103 -55 -4.7% -216 -16.4%63 Mahoning Youngstown 3,392 3,292 3,203 3,333 3,195 3,148 2,982 2,904 2,846 2,786 -60 -2.1% -606 -17.9%64 Columbiana East Liverpool 734 869 898 931 910 864 803 693 639 602 -37 -5.8% -132 -18.0%65 Pickaway Circleville 349 308 322 329 316 322 312 296 280 285 5 1.8% -64 -18.3%66 Scioto Portsmouth 619 565 564 542 542 560 530 520 508 505 -3 -0.6% -114 -18.4%67 Lake Mentor 2,342 1,959 2,009 1,911 2,137 2,129 2,138 2,063 1,960 1,910 -50 -2.6% -432 -18.4%68 Wayne Wooster 1,360 1,406 1,445 1,351 1,257 1,246 1,251 1,139 1,087 1,107 20 1.8% -253 -18.6%69 Meigs Middleport 161 165 156 158 147 161 165 161 130 131 1 0.8% -30 -18.6%70 Morgan McConnelsville 104 102 104 108 106 105 98 85 91 84 -7 -7.7% -20 -19.2%71 Allen Lima 1,220 1,264 1,279 1,216 1,186 1,195 1,155 1,093 998 971 -27 -2.7% -249 -20.4%72 Seneca Tiffin 675 752 793 778 761 737 657 566 545 537 -8 -1.5% -138 -20.4%73 Ashtabula Ashtabula 725 735 728 760 635 650 616 601 570 568 -2 -0.4% -157 -21.7%74 Paulding Paulding 119 114 97 93 91 98 95 92 93 93 0 0.0% -26 -21.8%75 Jefferson Steubenville 514 502 487 464 458 471 462 440 404 401 -3 -0.7% -113 -22.0%76 Trumbull Warren 1,918 1,985 2,068 1,921 1,860 1,841 1,809 1,634 1,512 1,474 -38 -2.5% -444 -23.1%77 Perry New Lexington 223 235 256 259 218 196 192 186 186 171 -15 -8.1% -52 -23.3%78 Cuyahoga Cleveland 53,927 54,357 55,413 55,331 54,563 52,749 47,747 44,358 41,590 40,392 -1,198 -2.9% -13,535 -25.1%79 Adams West Union 200 210 217 225 221 213 208 157 158 149 -9 -5.7% -51 -25.5%80 Champaign Urbana 273 275 279 286 266 241 228 222 220 201 -19 -8.6% -72 -26.4%81 Greene Beavercreek 1,629 1,698 1,873 1,795 1,828 1,856 1,820 1,308 1,055 1,190 135 12.8% -439 -26.9%82 Fulton Wauseon 460 454 430 439 445 448 401 346 363 329 -34 -9.4% -131 -28.5%83 Hancock Findlay 840 875 851 827 691 719 682 608 580 563 -17 -2.9% -277 -33.0%84 Clinton Wilmington 763 730 708 659 643 627 624 586 565 506 -59 -10.4% -257 -33.7%85 Union Marysville 423 518 459 569 639 551 422 431 394 271 -123 -31.2% -152 -35.9%86 Logan Bellefontaine 491 521 350 359 349 329 332 302 298 284 -14 -4.7% -207 -42.2%87 Carroll Carrolton 125 121 125 124 98 73 69 69 66 60 -6 -9.1% -65 -52.0%88 Vinton McArthur 349 367 374 383 71 70 71 68 82 80 -2 -2.6% -269 -77.1%

OHIO 88 COUNTY TOTAL 223,663 225,553 230,681 229,680 228,442 227,985 222,156 212,699 205,750 202,924 -2,826 -1.4% -20,739 -9.3%Source: ODJFS ES-202 Complete Count of Jobs and George ZellerNOTE: Data suppressed in Noble, Harrison and Vinton Counties in 2001-2004; values interpolated from statewide totalsNOTE: Data suppressed in Monroe, Noble, and Vinton Counties in 2009; values interpolated from statewide totals

TABLE FOUR: Trend in Retail Trade Employment During Third Quarter 2001-2010Ohio Counties. Ranked by Fastest 2001-2010 % Increase in Retail Trade Employment

RETAIL RETAIL RETAIL RETAIL RETAIL RETAIL RETAIL RETAIL RETAIL RETAIL 09-10 09-10 01-10 01-10LARGEST JOBS JOBS JOBS JOBS JOBS JOBS JOBS JOBS JOBS JOBS # INCR % INCR # INCR % INCR

# COUNTY CITY 3Q 01 3Q 02 3Q 03 3Q 04 3Q 05 3Q 06 3Q 07 3Q 08 3Q 09 3Q 10 RETAIL RETAIL RETAIL RETAIL

1 Delaware Delaware 5,813 7,899 8,205 8,282 9,744 10,304 10,022 10,017 10,166 10,089 -77 -0.8% 4,276 73.6%2 Geauga Chardon 3,249 3,131 3,434 3,272 3,789 4,171 4,336 4,307 4,121 4,109 -12 -0.3% 860 26.5%3 Madison London 1,450 1,334 1,512 2,079 1,792 1,826 1,859 1,810 1,734 1,751 17 1.0% 301 20.8%4 Medina Brunswick 7,008 7,153 7,198 7,415 7,791 8,341 8,723 8,503 8,475 8,438 -37 -0.4% 1,430 20.4%5 Henry Napoleon 1,113 1,203 1,161 1,134 1,140 1,147 1,085 1,033 1,261 1,312 51 4.0% 199 17.9%6 Fayette Washington CH 2,138 2,322 1,943 1,790 1,933 2,364 2,417 2,361 2,383 2,487 104 4.4% 349 16.3%7 Warren Mason 8,162 8,097 7,748 7,847 8,246 9,551 10,093 9,700 9,496 9,427 -69 -0.7% 1,265 15.5%8 Fairfield Lancaster 5,356 5,101 5,122 4,982 5,053 6,037 6,332 6,583 6,246 6,099 -147 -2.4% 743 13.9%9 Union Marysville 1,708 1,663 1,619 1,582 1,609 1,710 1,703 1,870 1,903 1,896 -7 -0.4% 188 11.0%

10 Athens Athens 2,705 2,532 2,790 2,717 2,772 3,008 3,029 3,022 2,979 2,980 1 0.0% 275 10.2%11 Butler Hamilton 14,496 14,816 14,670 14,601 14,895 14,669 15,781 16,745 15,783 15,785 2 0.0% 1,289 8.9%12 Knox Mount Vernon 1,970 1,948 2,071 2,229 2,293 2,312 2,423 2,488 2,256 2,138 -118 -5.2% 168 8.5%13 Clermont Milford 8,336 8,382 8,637 8,829 8,774 10,305 10,119 9,894 9,295 8,884 -411 -4.4% 548 6.6%14 Holmes Millersburg 1,717 1,803 1,894 2,019 2,010 1,950 1,964 1,907 1,777 1,801 24 1.4% 84 4.9%15 Portage Kent 5,642 5,609 5,701 5,832 5,896 5,437 5,831 6,287 5,813 5,881 68 1.2% 239 4.2%16 Mercer Celina 1,906 1,814 1,839 1,801 2,110 2,050 2,014 2,126 1,938 1,969 31 1.6% 63 3.3%17 Greene Beavercreek 8,836 9,234 8,792 8,541 8,679 9,270 9,961 9,668 9,201 9,087 -114 -1.2% 251 2.8%18 Hocking Logan 792 1,087 985 997 1,023 987 897 876 839 810 -29 -3.5% 18 2.3%19 Auglaize Saint Marys 1,986 1,977 1,914 1,872 2,295 2,324 2,188 2,212 2,082 2,016 -66 -3.2% 30 1.5%20 Vinton McArthur 202 211 198 236 225 227 205 207 185 204 19 10.3% 2 1.0%21 Guernsey Cambridge 1,830 2,097 2,051 2,013 2,059 1,961 1,919 1,861 1,880 1,844 -36 -1.9% 14 0.8%22 Wood Bowling Green 6,153 6,157 6,205 6,109 6,114 6,274 6,217 6,743 6,142 6,142 0 0.0% -11 -0.2%23 Brown Georgetown 999 1,016 1,004 1,005 1,031 1,005 925 895 867 982 115 13.3% -17 -1.7%24 Williams Bryan 1,597 1,516 1,488 1,427 1,429 1,474 1,474 1,546 1,515 1,559 44 2.9% -38 -2.4%25 Erie Sandusky 4,729 4,507 4,464 4,961 4,925 4,921 5,067 4,844 4,666 4,589 -77 -1.7% -140 -3.0%26 Lorain Lorain 13,381 13,071 12,910 13,637 13,417 13,574 13,684 13,240 12,688 12,865 177 1.4% -516 -3.9%27 Carroll Carrolton 841 791 732 748 772 823 828 826 815 808 -7 -0.9% -33 -3.9%28 Wyandot Upper Sandusky 746 798 875 835 852 1,016 930 851 732 713 -19 -2.6% -33 -4.4%29 Monroe Woodsfield 377 354 376 380 355 357 359 371 360 359 -1 -0.3% -18 -4.8%30 Coshocton Coshocton 1,287 1,224 1,247 1,174 1,346 1,287 1,239 1,255 1,200 1,219 19 1.6% -68 -5.3%31 Highland Hillsboro 1,600 1,522 1,773 1,796 1,608 1,548 1,636 1,634 1,608 1,503 -105 -6.5% -97 -6.1%32 Pike Waverly 1,048 1,009 997 1,013 990 1,061 990 1,019 1,004 975 -29 -2.9% -73 -7.0%33 Lawrence Ironton 2,228 2,251 2,201 2,343 2,348 2,382 2,294 2,300 2,231 2,066 -165 -7.4% -162 -7.3%34 Van Wert Van Wert 1,306 1,281 1,068 1,125 1,146 1,349 1,293 1,312 1,229 1,211 -18 -1.5% -95 -7.3%35 Ross Chillicothe 3,906 3,711 3,802 3,677 3,791 3,537 3,792 3,697 3,631 3,614 -17 -0.5% -292 -7.5%36 Pickaway Circleville 1,599 1,616 1,592 1,605 1,693 1,528 1,609 1,560 1,528 1,467 -61 -4.0% -132 -8.3%37 Ashtabula Ashtabula 4,161 4,165 4,085 4,259 4,308 4,301 4,337 4,169 3,891 3,817 -74 -1.9% -344 -8.3%38 Hancock Findlay 5,316 5,684 5,592 5,736 6,008 5,958 5,676 5,406 5,061 4,856 -205 -4.1% -460 -8.7%39 Columbiana East Liverpool 4,411 4,262 4,508 4,425 4,284 4,258 4,178 4,047 4,046 4,022 -24 -0.6% -389 -8.8%40 Sandusky Fremont 3,026 3,089 2,982 2,964 3,021 2,918 2,853 2,742 2,723 2,735 12 0.4% -291 -9.6%41 Jefferson Steubenville 3,381 3,255 3,588 3,471 3,570 3,488 3,501 3,235 3,085 3,045 -40 -1.3% -336 -9.9%42 Washington Marietta 3,235 3,105 3,313 3,159 3,157 3,072 3,074 2,999 2,847 2,900 53 1.9% -335 -10.4%43 Perry New Lexington 713 664 676 667 692 658 610 613 617 632 15 2.4% -81 -11.4%44 Crawford Bucyrus 1,465 1,454 1,418 1,456 1,423 1,326 1,380 1,417 1,346 1,281 -65 -4.8% -184 -12.6%45 Lake Mentor 14,567 13,679 13,717 14,329 14,585 14,458 14,308 14,392 13,497 12,633 -864 -6.4% -1,934 -13.3%46 Putnam Ottawa 1,332 1,234 1,217 1,239 1,271 1,277 1,221 1,205 1,128 1,155 27 2.4% -177 -13.3%47 Champaign Urbana 1,255 1,232 1,231 1,189 1,173 1,182 1,227 1,189 1,201 1,084 -117 -9.7% -171 -13.6%48 Wayne Wooster 5,313 5,149 5,013 5,130 5,269 5,287 5,064 4,986 4,675 4,580 -95 -2.0% -733 -13.8%49 Morrow Mount Gilead 719 692 724 736 764 734 742 696 639 618 -21 -3.3% -101 -14.0%

RETAIL RETAIL RETAIL RETAIL RETAIL RETAIL RETAIL RETAIL RETAIL RETAIL 09-10 09-10 01-10 01-10LARGEST JOBS JOBS JOBS JOBS JOBS JOBS JOBS JOBS JOBS JOBS # INCR % INCR # INCR % INCR

# COUNTY CITY 3Q 01 3Q 02 3Q 03 3Q 04 3Q 05 3Q 06 3Q 07 3Q 08 3Q 09 3Q 10 RETAIL RETAIL RETAIL RETAIL50 Richland Mansfield 7,883 7,644 7,524 7,294 7,405 7,581 7,407 7,145 6,781 6,758 -23 -0.3% -1,125 -14.3%51 Seneca Tiffin 2,268 2,164 2,145 2,145 2,149 2,129 2,073 2,102 1,999 1,943 -56 -2.8% -325 -14.3%52 Allen Lima 7,382 7,241 7,864 7,973 7,705 7,428 7,171 6,872 6,571 6,322 -249 -3.8% -1,060 -14.4%53 Ashland Ashland 2,239 2,037 1,976 1,918 1,910 1,998 2,038 2,003 1,962 1,914 -48 -2.4% -325 -14.5%54 Stark Canton 22,380 22,036 22,183 21,764 21,821 20,780 20,525 20,114 19,124 19,124 0 0.0% -3,256 -14.5%55 Logan Bellefontaine 1,916 1,815 1,886 1,925 1,953 1,931 1,880 1,800 1,667 1,630 -37 -2.2% -286 -14.9%56 Scioto Portsmouth 3,398 3,269 3,141 3,059 3,026 2,963 3,092 2,984 2,941 2,889 -52 -1.8% -509 -15.0%57 Adams West Union 1,255 1,243 1,277 1,237 1,235 1,262 1,155 1,122 1,089 1,063 -26 -2.4% -192 -15.3%58 Hardin Kenton 1,087 1,051 919 890 1,103 981 980 926 900 918 18 2.0% -169 -15.5%59 Summit Akron 33,848 32,738 32,237 32,846 32,996 32,354 32,326 32,111 29,431 28,542 -889 -3.0% -5,306 -15.7%60 Defiance Defiance 2,712 2,557 2,595 2,565 2,450 2,400 2,657 2,489 2,287 2,286 -1 0.0% -426 -15.7%61 Darke Greenville 2,285 2,214 2,171 2,206 2,238 2,099 2,048 2,003 1,944 1,918 -26 -1.3% -367 -16.1%62 Tuscarawas New Philadelphia 5,225 5,006 4,689 4,709 4,610 4,610 4,619 4,584 4,435 4,358 -77 -1.7% -867 -16.6%63 Meigs Middleport 692 671 625 617 605 631 619 556 567 577 10 1.8% -115 -16.6%64 Preble Eaton 1,504 1,335 1,218 1,196 1,478 1,379 1,351 1,262 1,292 1,249 -43 -3.3% -255 -17.0%65 Jackson Jackson 1,691 1,628 1,629 1,624 1,613 1,625 1,566 1,543 1,497 1,397 -100 -6.7% -294 -17.4%66 Trumbull Warren 12,212 11,740 11,644 11,794 11,619 11,473 11,373 10,436 10,062 9,865 -197 -2.0% -2,347 -19.2%67 Licking Newark 8,405 7,916 7,892 7,731 7,686 7,345 7,545 7,306 6,931 6,752 -179 -2.6% -1,653 -19.7%68 Ottawa Port Clinton 2,191 1,959 1,867 1,724 1,761 1,944 1,931 1,810 1,677 1,743 66 3.9% -448 -20.4%69 Lucas Toledo 30,041 28,659 28,247 27,368 25,735 25,472 25,842 25,717 23,960 23,868 -92 -0.4% -6,173 -20.5%70 Paulding Paulding 545 613 610 609 492 471 465 472 439 432 -7 -1.6% -113 -20.7%71 Miami Piqua 5,819 5,597 5,806 6,087 5,995 5,326 4,893 4,779 4,708 4,562 -146 -3.1% -1,257 -21.6%72 Harrison Cadiz 365 358 297 295 301 323 325 329 299 286 -13 -4.3% -79 -21.6%73 Noble Caldwell 353 380 367 340 346 381 345 298 278 276 -2 -0.7% -77 -21.8%74 Fulton Wauseon 1,923 1,872 1,752 1,792 1,926 1,722 1,696 1,597 1,504 1,500 -4 -0.3% -423 -22.0%75 Hamilton Cincinnati 58,269 57,739 55,408 55,550 53,525 49,333 49,237 47,563 44,659 44,540 -119 -0.3% -13,729 -23.6%76 Huron Norwalk 2,613 2,494 2,518 2,244 2,272 2,219 2,140 2,073 1,934 1,992 58 3.0% -621 -23.8%77 Cuyahoga Cleveland 80,084 76,996 76,563 73,641 69,900 68,489 67,612 66,931 62,404 60,965 -1,439 -2.3% -19,119 -23.9%78 Shelby Sidney 2,482 2,563 2,383 2,290 2,432 2,378 2,524 2,049 1,985 1,886 -99 -5.0% -596 -24.0%79 Marion Marion 3,502 3,496 2,963 2,933 2,970 2,835 3,085 3,031 2,738 2,660 -78 -2.8% -842 -24.0%80 Mahoning Youngstown 16,529 15,700 15,647 14,962 14,857 14,645 14,564 14,083 13,145 12,525 -620 -4.7% -4,004 -24.2%81 Morgan McConnelsville 382 375 386 367 368 339 306 301 304 289 -15 -4.9% -93 -24.3%82 Muskingum Zanesville 6,557 6,464 6,540 6,737 6,376 5,460 5,484 5,410 4,988 4,905 -83 -1.7% -1,652 -25.2%83 Gallia Gallipolis 1,875 1,844 1,833 1,892 1,867 1,532 1,516 1,524 1,444 1,387 -57 -3.9% -488 -26.0%84 Montgomery Dayton 32,301 30,637 29,753 29,227 28,633 27,325 26,236 25,407 24,291 23,574 -717 -3.0% -8,727 -27.0%85 Belmont Martins Ferry 5,194 5,046 4,863 4,817 4,723 4,628 4,417 4,268 3,946 3,780 -166 -4.2% -1,414 -27.2%86 Franklin Columbus 92,750 88,364 82,566 79,578 78,351 73,954 72,274 70,918 67,227 66,790 -437 -0.7% -25,960 -28.0%87 Clinton Wilmington 2,375 2,116 2,089 1,803 1,766 1,762 1,794 1,796 1,653 1,616 -37 -2.2% -759 -32.0%88 Clark Springfield 8,377 7,991 6,752 6,530 6,284 6,450 6,491 6,365 5,789 5,681 -108 -1.9% -2,696 -32.2%

OHIO 88 COUNTY TOTAL 650,015 633,469 621,107 614,944 609,952 598,961 597,011 586,745 555,637 547,199 -8,438 -1.5% -102,816 -15.8%Source: ODJFS QCEW ES-202 Complete Count of Jobs and George Zeller

TABLE FIVE: Trend in Health Care and Social Assistance Employment During Third Quarter 2001-2010Ohio Counties. Ranked by Fastest 2001-2010 % Increase in Heallth Care and Social Assistance Employment

HEALTH HEALTH HEALTH HEALTH HEALTH HEALTH HEALTH HEALTH HEALTH HEALTH 09-10 09-10 01-10 01-10LARGEST JOBS JOBS JOBS JOBS JOBS JOBS JOBS JOBS JOBS JOBS # INCR % INCR # INCR % INCR

# COUNTY CITY 3Q 01 3Q 02 3Q 03 3Q 04 3Q 05 3Q 06 3Q 07 3Q 08 3Q 09 3Q 10 HEALTH HEALTH HEALTH HEALTH

1 Fairfield Lancaster 2,823 2,833 2,998 3,178 3,444 3,623 3,914 3,978 4,047 6,257 2,210 54.6% 3,434 121.6%2 Delaware Delaware 2,464 2,687 3,002 3,527 3,763 4,107 4,721 4,905 4,989 5,407 418 8.4% 2,943 119.4%3 Auglaize Saint Marys 1,087 1,100 1,696 1,765 1,781 2,069 2,170 2,166 2,242 2,310 68 3.0% 1,223 112.5%4 Marion Marion 2,349 2,423 2,531 2,716 3,008 2,996 3,013 3,043 3,061 4,108 1,047 34.2% 1,759 74.9%5 Pickaway Circleville 1,012 1,191 1,330 1,398 1,805 1,675 1,721 1,730 1,635 1,707 72 4.4% 695 68.7%6 Union Marysville 652 709 706 723 749 784 823 933 1,091 1,090 -1 -0.1% 438 67.2%7 Warren Mason 4,253 4,381 4,651 4,864 5,063 5,028 5,463 5,917 6,201 6,566 365 5.9% 2,313 54.4%8 Lawrence Ironton 1,619 1,465 1,576 1,722 1,628 2,170 2,143 2,140 2,248 2,458 210 9.3% 839 51.8%9 Geauga Chardon 2,774 2,963 3,014 3,074 3,330 2,670 2,907 3,798 3,827 4,038 211 5.5% 1,264 45.6%

10 Putnam Ottawa 753 804 1,013 1,046 1,020 930 915 949 956 1,065 109 11.4% 312 41.4%11 Knox Mount Vernon 2,089 2,130 2,187 2,297 2,422 2,554 2,614 2,666 2,771 2,899 128 4.6% 810 38.8%12 Clermont Milford 3,958 4,200 4,406 4,605 4,520 4,872 5,253 5,565 5,340 5,376 36 0.7% 1,418 35.8%13 Butler Hamilton 12,881 13,527 13,723 14,465 15,143 15,791 16,932 17,119 17,484 17,445 -39 -0.2% 4,564 35.4%14 Medina Brunswick 4,999 5,302 5,430 5,616 5,704 5,963 6,095 6,330 6,578 6,749 171 2.6% 1,750 35.0%15 Hancock Findlay 3,448 3,560 3,778 3,866 3,776 3,978 4,256 4,590 4,489 4,592 103 2.3% 1,144 33.2%16 Jackson Jackson 951 935 985 1,096 1,114 1,154 1,131 1,195 1,285 1,266 -19 -1.5% 315 33.1%17 Ottawa Port Clinton 1,220 1,267 1,310 1,369 1,386 1,416 1,461 1,491 1,533 1,612 79 5.2% 392 32.1%18 Franklin Columbus 64,952 67,913 70,696 73,040 74,143 75,458 76,187 78,474 81,206 84,598 3,392 4.2% 19,646 30.2%19 Portage Kent 3,031 3,104 3,062 3,374 3,417 3,424 3,696 3,909 3,875 3,927 52 1.3% 896 29.6%20 Summit Akron 32,627 33,898 34,605 35,904 37,060 38,027 39,343 40,613 41,007 41,847 840 2.0% 9,220 28.3%21 Ross Chillicothe 3,386 3,534 3,762 3,999 3,995 3,929 3,929 4,152 4,143 4,306 163 3.9% 920 27.2%22 Henry Napoleon 1,058 1,073 1,123 1,169 1,171 1,211 1,175 1,317 1,330 1,323 -7 -0.5% 265 25.0%23 Washington Marietta 3,358 3,801 4,373 3,807 3,791 3,925 4,049 4,165 4,227 4,167 -60 -1.4% 809 24.1%24 Guernsey Cambridge 1,948 2,157 2,261 2,364 2,426 2,405 2,437 2,218 2,395 2,409 14 0.6% 461 23.7%25 Tuscarawas New Philadelphia 3,972 4,308 4,377 4,595 4,676 4,564 4,523 4,728 4,781 4,876 95 2.0% 904 22.8%26 Logan Bellefontaine 1,521 1,576 1,684 1,932 1,810 1,927 1,961 1,973 1,910 1,866 -44 -2.3% 345 22.7%27 Scioto Portsmouth 5,357 5,905 6,064 6,057 5,985 6,132 6,397 6,157 6,333 6,469 136 2.1% 1,112 20.8%28 Darke Greenville 1,951 2,018 2,011 2,022 1,980 1,930 2,048 2,125 2,260 2,337 77 3.4% 386 19.8%29 Lake Mentor 9,525 9,904 9,909 10,373 10,558 10,450 11,050 10,767 11,228 11,392 164 1.5% 1,867 19.6%30 Cuyahoga Cleveland 101,543 105,476 106,715 107,603 108,433 111,616 114,098 115,104 118,895 121,435 2,540 2.1% 19,892 19.6%31 Williams Bryan 1,514 1,475 1,524 1,583 1,600 1,654 1,676 1,761 1,947 1,795 -152 -7.8% 281 18.6%32 Muskingum Zanesville 5,546 5,772 5,854 6,074 6,290 6,207 6,062 6,637 6,669 6,574 -95 -1.4% 1,028 18.5%33 Noble Caldwell 394 417 415 460 532 553 516 504 457 464 7 1.5% 70 17.8%34 Licking Newark 5,471 5,416 4,941 5,258 5,485 5,780 6,042 6,223 6,447 6,442 -5 -0.1% 971 17.7%35 Ashtabula Ashtabula 4,569 4,594 4,656 4,932 4,952 5,021 5,342 5,405 5,345 5,362 17 0.3% 793 17.4%36 Wood Bowling Green 4,036 4,208 4,497 4,521 4,611 4,797 5,024 4,875 4,811 4,731 -80 -1.7% 695 17.2%37 OTHER 30 COUNTIES 34,522 35,334 36,620 37,329 36,361 37,099 37,573 38,225 38,341 40,232 1,891 4.9% 5,710 16.5%38 Greene Beavercreek 4,506 4,515 4,870 4,971 5,209 5,176 5,204 5,225 5,323 5,244 -79 -1.5% 738 16.4%39 Erie Sandusky 4,331 4,247 4,305 4,484 4,579 4,978 4,922 4,965 4,884 5,022 138 2.8% 691 16.0%40 Wayne Wooster 3,727 3,968 4,150 4,158 4,240 4,075 4,199 4,273 4,161 4,318 157 3.8% 591 15.9%41 Trumbull Warren 10,161 10,124 10,611 10,294 10,430 12,529 12,242 12,194 11,735 11,674 -61 -0.5% 1,513 14.9%42 Montgomery Dayton 40,043 40,215 40,879 42,333 42,344 42,678 43,575 45,057 45,389 45,736 347 0.8% 5,693 14.2%43 Stark Canton 23,111 23,238 23,598 25,153 25,397 25,513 25,606 26,192 26,370 26,337 -33 -0.1% 3,226 14.0%44 Athens Athens 2,457 2,638 2,804 2,976 2,908 3,162 3,053 3,123 3,148 2,796 -352 -11.2% 339 13.8%45 Richland Mansfield 6,935 7,074 7,339 7,531 7,232 7,428 7,631 7,816 8,060 7,846 -214 -2.7% 911 13.1%46 Columbiana East Liverpool 4,531 4,604 4,658 4,743 4,758 5,000 5,109 5,100 5,156 5,121 -35 -0.7% 590 13.0%47 Hamilton Cincinnati 70,256 70,795 73,028 74,114 76,018 77,562 78,073 80,216 80,303 79,331 -972 -1.2% 9,075 12.9%48 Lucas Toledo 34,580 35,348 34,780 36,132 38,254 38,652 38,564 38,288 38,795 38,646 -149 -0.4% 4,066 11.8%49 Vinton McArthur 234 226 230 248 235 218 244 255 296 260 -36 -12.2% 26 11.1%

HEALTH HEALTH HEALTH HEALTH HEALTH HEALTH HEALTH HEALTH HEALTH HEALTH 09-10 09-10 01-10 01-10LARGEST JOBS JOBS JOBS JOBS JOBS JOBS JOBS JOBS JOBS JOBS # INCR % INCR # INCR % INCR

# COUNTY CITY 3Q 01 3Q 02 3Q 03 3Q 04 3Q 05 3Q 06 3Q 07 3Q 08 3Q 09 3Q 10 HEALTH HEALTH HEALTH HEALTH50 Lorain Lorain 11,829 12,085 12,255 12,385 12,389 12,616 12,492 12,578 12,483 12,798 315 2.5% 969 8.2%51 Allen Lima 9,307 9,363 9,079 9,146 9,248 9,875 9,885 10,048 9,849 9,976 127 1.3% 669 7.2%52 Shelby Sidney 1,700 1,755 1,815 1,919 1,880 1,903 1,851 1,880 1,837 1,795 -42 -2.3% 95 5.6%53 Clark Springfield 7,624 7,861 8,216 8,442 8,331 8,548 8,128 8,260 8,135 8,029 -106 -1.3% 405 5.3%54 Belmont Martins Ferry 3,824 4,101 4,098 4,096 4,112 3,891 3,914 3,876 3,945 3,941 -4 -0.1% 117 3.1%55 Coshocton Coshocton 1,675 1,758 1,708 1,743 1,779 1,834 1,841 1,755 1,740 1,725 -15 -0.9% 50 3.0%56 Miami Piqua 4,181 4,369 4,425 4,405 4,367 4,361 4,362 4,370 4,255 4,175 -80 -1.9% -6 -0.1%57 Mahoning Youngstown 17,306 17,865 18,563 19,008 19,300 16,729 16,719 16,912 17,339 17,141 -198 -1.1% -165 -1.0%58 Van Wert Van Wert 1,447 1,490 1,539 1,601 1,624 1,655 1,701 1,739 1,693 1,419 -274 -16.2% -28 -1.9%59 Seneca Tiffin 2,379 2,416 2,493 2,781 2,763 2,663 2,482 2,568 2,451 2,331 -120 -4.9% -48 -2.0%

OHIO 88 COUNTY TOTAL 605,757 623,415 638,928 656,386 666,329 678,935 690,457 704,537 714,731 727,158 12,427 1.7% 121,401 20.0%Source: ODJFS QCEW ES-202 Complete Count of Jobs and George ZellerNOTE: Data supressed in 30 Counties Including Adams, Ashland, Brown, Carroll, Champaign, Clinton, Crawford, Fayette, Fulton, Gallia, Hardin, Harrison, Highland, Hocking Holmes,Huron, Jefferson, Madison, Meigs, Mercer, Monroe, Morgan, Morrow, Paulding, Perry, Pike, Preble, Sandusky, and Wyandot Counties

TABLE SIX: Trend in Federal Government Agencies Employment During Third Quarter 2001-2010Ohio Counties. Ranked by Fastest 2001-2010 % Increase in Federal Government Employment

FED FED FED FED FED FED FED FED FED FED 09-10 09-10 01-10 01-10LARGEST JOBS JOBS JOBS JOBS JOBS JOBS JOBS JOBS JOBS JOBS # INCR % INCR # INCR % INCR

# COUNTY CITY 3Q 01 3Q 02 3Q 03 3Q 04 3Q 05 3Q 06 3Q 07 3Q 08 3Q 09 3Q 10 JOBS FED FED FED

1 Erie Sandusky 207 198 198 198 218 192 215 203 239 338 99 41.4% 131 63.3%2 Auglaize Saint Marys 104 98 98 98 110 125 127 127 124 127 3 2.4% 23 22.1%3 Greene Beavercreek 11,449 11,492 11,689 11,674 11,670 12,057 11,777 11,237 12,267 13,833 1,566 12.8% 2,384 20.8%4 Pike Waverly 72 74 75 66 71 69 75 73 76 85 9 11.8% 13 18.1%5 Butler Hamilton 576 566 540 555 567 587 575 592 586 667 81 13.8% 91 15.8%6 Geauga Chardon 143 134 131 131 132 127 131 127 159 161 2 1.3% 18 12.6%7 Jackson Jackson 74 81 82 77 78 76 74 76 75 83 8 10.7% 9 12.2%8 Franklin Columbus 12,523 12,342 12,069 11,865 11,523 11,496 11,934 12,571 12,654 13,860 1,206 9.5% 1,337 10.7%9 Delaware Delaware 241 285 244 249 254 258 262 259 253 266 13 5.1% 25 10.4%

10 Morrow Mount Gilead 58 62 58 60 56 61 63 60 62 64 2 3.2% 6 10.3%11 Tuscarawas New Philadelphia 242 234 229 220 216 223 214 216 218 267 49 22.5% 25 10.3%12 Medina Brunswick 321 321 331 326 369 359 370 375 337 354 17 5.0% 33 10.3%13 Wood Bowling Green 240 234 235 232 232 241 249 242 230 264 34 14.8% 24 10.0%14 Belmont Martins Ferry 178 178 195 187 195 189 197 190 176 195 19 10.8% 17 9.6%15 Crawford Bucyrus 86 85 81 77 83 86 82 83 91 94 3 3.3% 8 9.3%16 Gallia Gallipolis 89 104 98 99 95 91 92 92 87 97 10 11.5% 8 9.0%17 Guernsey Cambridge 126 122 117 120 125 118 112 119 119 137 18 15.1% 11 8.7%18 Ross Chillicothe 1,458 1,408 1,385 1,253 1,389 1,346 1,365 1,449 1,476 1,568 92 6.2% 110 7.5%19 Noble Caldwell 27 28 28 29 27 20 30 29 26 29 3 11.5% 2 7.4%20 Morgan McConnelsville 43 40 41 40 39 37 36 42 47 46 -1 -2.1% 3 7.0%21 Clark Springfield 656 637 616 614 603 590 667 713 724 701 -23 -3.2% 45 6.9%22 Trumbull Warren 516 502 494 474 475 482 456 466 475 550 75 15.8% 34 6.6%23 Ottawa Port Clinton 192 171 178 187 172 185 193 194 204 204 0 0.0% 12 6.3%24 Fairfield Lancaster 273 276 269 259 258 263 259 265 255 290 35 13.7% 17 6.2%25 Meigs Middleport 81 84 85 77 81 73 75 78 82 86 4 4.9% 5 6.2%26 Brown Georgetown 102 98 98 98 94 96 93 93 88 108 20 22.7% 6 5.9%27 Scioto Portsmouth 192 183 179 175 178 182 175 178 166 203 37 22.3% 11 5.7%28 Wayne Wooster 273 271 281 274 212 225 205 201 259 287 28 10.8% 14 5.1%29 Clermont Milford 338 331 323 315 324 317 369 378 313 354 41 13.1% 16 4.7%30 Logan Bellefontaine 150 154 154 151 147 150 146 145 141 157 16 11.3% 7 4.7%31 Harrison Cadiz 66 69 67 70 65 70 71 65 69 69 0 0.0% 3 4.5%32 Cuyahoga Cleveland 16,784 16,371 16,435 16,327 16,077 15,934 16,386 16,793 16,733 17,512 779 4.7% 728 4.3%33 Lake Mentor 497 479 467 455 453 445 444 452 438 517 79 18.0% 20 4.0%34 Jefferson Steubenville 257 257 254 233 233 237 233 225 218 267 49 22.5% 10 3.9%35 Champaign Urbana 82 86 82 83 82 81 76 77 76 85 9 11.8% 3 3.7%36 Vinton McArthur 29 27 29 31 26 27 27 27 26 30 4 15.4% 1 3.4%37 Columbiana East Liverpool 599 592 585 570 556 567 593 604 581 619 38 6.5% 20 3.3%38 Pickaway Circleville 102 93 99 95 91 92 94 93 95 105 10 10.5% 3 2.9%39 Lawrence Ironton 152 152 144 145 146 151 143 142 134 155 21 15.7% 3 2.0%40 Hocking Logan 53 51 51 52 53 39 52 53 49 54 5 10.2% 1 1.9%41 Licking Newark 511 508 521 515 510 511 523 505 507 520 13 2.6% 9 1.8%42 Lorain Lorain 1,206 1,208 1,194 1,160 1,148 1,179 1,150 1,156 1,144 1,227 83 7.3% 21 1.7%43 Highland Hillsboro 119 123 122 115 121 118 114 114 107 121 14 13.1% 2 1.7%44 Shelby Sidney 99 103 101 100 97 94 94 93 90 100 10 11.1% 1 1.0%45 Huron Norwalk 152 152 148 146 140 131 139 145 143 153 10 7.0% 1 0.7%46 Warren Mason 309 301 299 302 297 298 303 310 296 311 15 5.1% 2 0.6%47 Richland Mansfield 686 669 650 618 645 607 639 651 611 688 77 12.6% 2 0.3%48 Portage Kent 332 319 315 299 293 293 304 306 303 332 29 9.6% 0 0.0%49 Wyandot Upper Sandusky 72 76 78 76 72 95 67 66 64 72 8 12.5% 0 0.0%

FED FED FED FED FED FED FED FED FED FED 09-10 09-10 01-10 01-10LARGEST JOBS JOBS JOBS JOBS JOBS JOBS JOBS JOBS JOBS JOBS # INCR % INCR # INCR % INCR

# COUNTY CITY 3Q 01 3Q 02 3Q 03 3Q 04 3Q 05 3Q 06 3Q 07 3Q 08 3Q 09 3Q 10 JOBS FED FED FED50 Athens Athens 264 286 277 263 270 282 255 253 244 263 19 7.8% -1 -0.4%51 Knox Mount Vernon 118 123 119 118 114 114 117 116 110 117 7 6.4% -1 -0.8%52 Sandusky Fremont 128 120 125 120 116 121 118 125 117 126 9 7.7% -2 -1.6%53 Coshocton Coshocton 106 103 104 100 99 98 98 91 90 104 14 15.6% -2 -1.9%54 Clinton Wilmington 153 164 163 164 166 179 178 180 167 150 -17 -10.2% -3 -2.0%55 Adams West Union 80 82 79 77 75 76 79 78 74 78 4 5.4% -2 -2.5%56 Union Marysville 75 78 75 75 81 78 81 77 70 73 3 4.3% -2 -2.7%57 Mercer Celina 108 108 108 105 98 101 99 109 106 105 -1 -0.9% -3 -2.8%58 Washington Marietta 245 252 237 233 228 231 219 219 228 237 9 3.9% -8 -3.3%59 Putnam Ottawa 90 86 88 85 85 83 79 84 83 87 4 4.8% -3 -3.3%60 Ashland Ashland 116 113 113 114 108 114 111 109 106 112 6 5.7% -4 -3.4%61 Henry Napoleon 83 83 82 80 125 125 126 127 74 80 6 8.1% -3 -3.6%62 Carroll Carrolton 55 54 56 52 50 50 49 50 49 53 4 8.2% -2 -3.6%63 Hancock Findlay 183 181 173 175 176 183 175 176 171 176 5 2.9% -7 -3.8%64 Defiance Defiance 116 119 117 113 111 113 113 113 112 111 -1 -0.9% -5 -4.3%65 Fulton Wauseon 107 104 105 101 101 94 96 95 96 102 6 6.3% -5 -4.7%66 Stark Canton 1,268 1,207 1,171 1,129 1,135 1,112 1,122 1,119 1,077 1,207 130 12.1% -61 -4.8%67 Perry New Lexington 78 75 78 78 74 75 76 68 63 74 11 17.5% -4 -5.1%68 Preble Eaton 97 96 93 89 94 98 92 86 86 92 6 7.0% -5 -5.2%69 Miami Piqua 230 226 227 214 214 214 210 209 206 216 10 4.9% -14 -6.1%70 Lucas Toledo 2,152 2,053 2,093 2,064 2,043 1,969 1,948 1,936 1,880 1,999 119 6.3% -153 -7.1%71 Darke Greenville 125 121 124 119 122 113 119 116 114 116 2 1.8% -9 -7.2%72 Madison London 89 83 88 83 86 86 87 86 82 82 0 0.0% -7 -7.9%73 Mahoning Youngstown 1,508 1,460 1,367 1,273 1,342 1,333 1,332 1,320 1,286 1,389 103 8.0% -119 -7.9%74 Van Wert Van Wert 76 70 72 71 71 68 68 64 66 70 4 6.1% -6 -7.9%75 Monroe Woodsfield 62 62 61 51 50 56 53 53 55 57 2 3.6% -5 -8.1%76 Hamilton Cincinnati 10,533 10,245 10,021 9,909 9,736 9,650 9,496 9,281 9,283 9,671 388 4.2% -862 -8.2%77 Fayette Washington C.H. 66 64 63 60 58 60 60 57 55 60 5 9.1% -6 -9.1%78 Hardin Kenton 88 87 88 90 88 86 82 81 80 80 0 0.0% -8 -9.1%79 Seneca Tiffin 151 147 142 137 136 139 136 138 132 137 5 3.8% -14 -9.3%80 Marion Marion 162 153 164 155 156 149 146 145 137 146 9 6.6% -16 -9.9%81 Paulding Paulding 61 58 57 55 52 54 55 53 52 54 2 3.8% -7 -11.5%82 Holmes Millersburg 81 76 78 80 75 67 75 71 71 71 0 0.0% -10 -12.3%83 Muskingum Zanesville 316 304 300 288 286 287 289 286 272 276 4 1.5% -40 -12.7%84 Ashtabula Ashtabula 257 257 252 244 239 241 231 228 210 224 14 6.7% -33 -12.8%85 Williams Bryan 101 97 98 91 90 84 87 89 87 88 1 1.1% -13 -12.9%86 Allen Lima 475 444 429 423 417 411 406 406 403 402 -1 -0.2% -73 -15.4%87 Summit Akron 2,756 2,903 2,788 2,535 2,308 1,997 1,960 2,001 1,918 2,129 211 11.0% -627 -22.8%88 Montgomery Dayton 6,409 5,774 5,479 5,553 5,439 4,860 4,814 5,042 4,831 4,713 -118 -2.4% -1,696 -26.5%

OHIO 88 COUNTY TOTAL 82,305 80,547 79,596 78,338 77,412 76,541 77,007 77,687 78,036 83,739 5,703 7.3% -4,269 -5.2%Source: ODJFS QCEW ES-202 Complete Count of Jobs and George Zeller

TABLE SEVEN: Trend in Aggregate Real Earnings from Total Employment During Third Quarter 2000-2010 (Thousands of $)Ohio Counties. Ranked by Fastest 2000-2010 % Increase in Aggregate Real Earnings, September 2010 Dollars, CPI Deflator

TOTAL TOTAL TOTAL TOTALTOTAL TOTAL TOTAL TOTAL TOTAL TOTAL TOTAL TOTAL TOTAL 09-10 09-10 00-10 00-10

LARGEST EARN EARN EARN EARN EARN EARN EARN EARN EARN $ INCR % INCR $ INCR % INCR# COUNTY CITY 3Q 00 3Q 01 3Q 02 3Q 03 3Q 06 3Q 07 3Q 08 3Q 09 3Q 10 EARN EARN EARN EARN

1 Delaware Delaware $368,674 $401,902 $487,347 $525,986 $743,599 $771,603 $759,241 $758,455 $817,479 $59,024 7.8% $448,805 121.7%2 Warren Mason $535,156 $537,116 $563,381 $596,694 $708,557 $754,642 $725,877 $700,267 $738,934 $38,667 5.5% $203,778 38.1%3 Greene Beavercreek $424,710 $438,568 $460,350 $455,880 $513,626 $534,049 $516,163 $530,188 $539,068 $8,880 1.7% $114,358 26.9%4 Brown Georgetown $55,601 $50,550 $51,797 $51,683 $58,346 $62,463 $61,216 $60,205 $66,631 $6,426 10.7% $11,030 19.8%5 Mercer Celina $117,154 $117,420 $122,853 $125,992 $133,760 $138,990 $134,246 $126,028 $136,876 $10,848 8.6% $19,722 16.8%6 Athens Athens $150,515 $163,387 $167,500 $162,166 $166,247 $171,998 $168,449 $174,593 $175,787 $1,194 0.7% $25,272 16.8%7 Butler Hamilton $1,209,024 $1,212,994 $1,227,683 $1,255,043 $1,393,847 $1,515,999 $1,412,075 $1,323,953 $1,390,908 $66,955 5.1% $181,884 15.0%8 Fairfield Lancaster $275,827 $275,001 $283,003 $292,206 $308,507 $316,512 $310,585 $306,162 $315,220 $9,058 3.0% $39,393 14.3%9 Knox Mount Vernon $154,464 $150,164 $159,406 $153,993 $171,443 $178,759 $173,862 $167,812 $174,159 $6,347 3.8% $19,695 12.8%

10 Union Marysville $296,835 $314,644 $330,264 $340,824 $330,334 $355,371 $331,261 $330,768 $328,123 -$2,645 -0.8% $31,288 10.5%11 Belmont Martins Ferry $164,571 $166,720 $170,238 $174,113 $176,003 $180,756 $179,114 $175,299 $178,963 $3,664 2.1% $14,392 8.7%12 Holmes Millersburg $117,248 $117,909 $121,371 $122,676 $126,581 $129,137 $120,928 $116,465 $123,472 $7,007 6.0% $6,224 5.3%13 Washington Marietta $202,602 $200,343 $235,464 $226,837 $216,435 $225,104 $223,780 $218,586 $213,058 -$5,528 -2.5% $10,456 5.2%14 Lawrence Ironton $85,141 $79,439 $80,097 $81,851 $83,496 $86,737 $88,017 $83,693 $88,946 $5,253 6.3% $3,805 4.5%15 Scioto Portsmouth $180,852 $181,176 $185,460 $180,451 $178,894 $198,571 $189,012 $181,797 $188,803 $7,006 3.9% $7,951 4.4%16 Guernsey Cambridge $107,304 $109,624 $117,130 $124,558 $115,705 $117,476 $112,224 $114,448 $111,869 -$2,579 -2.3% $4,565 4.3%17 Vinton McArthur $15,858 $16,327 $20,847 $16,887 $16,498 $16,871 $16,039 $15,846 $16,276 $430 2.7% $418 2.6%18 Harrison Cadiz $23,977 $30,723 $27,529 $26,754 $28,320 $26,359 $25,589 $24,845 $24,529 -$316 -1.3% $552 2.3%19 Medina Brunswick $486,008 $476,545 $486,504 $509,744 $536,419 $542,236 $514,557 $484,270 $494,621 $10,351 2.1% $8,613 1.8%20 Wood Bowling Green $528,676 $540,779 $556,508 $548,451 $567,299 $673,835 $641,333 $502,319 $535,563 $33,244 6.6% $6,887 1.3%21 Jackson Jackson $83,506 $82,694 $83,412 $85,457 $85,515 $85,051 $80,862 $78,716 $84,485 $5,769 7.3% $979 1.2%22 Madison London $118,769 $116,140 $121,835 $121,188 $124,681 $124,703 $120,213 $115,695 $118,241 $2,546 2.2% -$528 -0.4%23 Sandusky Fremont $222,616 $225,970 $226,980 $223,082 $222,395 $227,736 $207,883 $198,401 $220,177 $21,776 11.0% -$2,439 -1.1%24 Hancock Findlay $396,637 $381,887 $389,127 $381,033 $428,604 $404,673 $384,524 $363,955 $390,392 $26,437 7.3% -$6,245 -1.6%25 Franklin Columbus $7,425,095 $7,350,183 $7,438,520 $7,303,361 $7,496,115 $7,701,816 $7,333,929 $7,055,411 $7,305,508 $250,097 3.5% -$119,587 -1.6%26 Fayette Washington CH $79,823 $81,568 $85,070 $85,926 $84,418 $88,939 $86,280 $80,459 $78,518 -$1,941 -2.4% -$1,305 -1.6%27 Henry Napoleon $99,297 $98,083 $101,674 $104,579 $102,080 $101,399 $97,233 $92,938 $97,468 $4,530 4.9% -$1,829 -1.8%28 Geauga Chardon $301,194 $293,667 $292,956 $292,649 $326,193 $320,021 $304,880 $280,869 $295,264 $14,395 5.1% -$5,930 -2.0%29 Clermont Milford $471,980 $472,540 $489,868 $485,739 $543,983 $548,605 $501,349 $473,314 $462,308 -$11,006 -2.3% -$9,672 -2.0%30 Gallia Gallipolis $103,290 $101,337 $103,910 $100,720 $105,864 $102,058 $104,621 $97,158 $100,764 $3,606 3.7% -$2,526 -2.4%31 Hocking Logan $51,551 $49,240 $51,838 $50,951 $50,934 $52,044 $49,632 $48,314 $50,140 $1,826 3.8% -$1,411 -2.7%32 Portage Kent $475,583 $480,595 $482,960 $485,833 $489,359 $493,148 $468,423 $434,175 $462,160 $27,985 6.4% -$13,423 -2.8%33 Ross Chillicothe $231,085 $225,614 $238,338 $226,302 $234,311 $235,252 $218,196 $214,490 $222,552 $8,062 3.8% -$8,533 -3.7%34 Summit Akron $2,636,198 $2,578,171 $2,658,230 $2,677,861 $2,687,976 $2,771,683 $2,661,782 $2,505,725 $2,528,609 $22,884 0.9% -$107,589 -4.1%35 Licking Newark $467,977 $460,465 $439,244 $458,496 $475,759 $477,177 $456,528 $456,508 $437,974 -$18,534 -4.1% -$30,003 -6.4%36 Hamilton Cincinnati $6,343,805 $6,247,348 $6,397,174 $6,270,084 $6,297,845 $6,258,101 $6,133,607 $5,846,160 $5,883,141 $36,981 0.6% -$460,664 -7.3%37 Jefferson Steubenville $207,358 $205,865 $213,332 $200,008 $209,802 $223,397 $244,565 $200,677 $190,909 -$9,768 -4.9% -$16,449 -7.9%38 Adams West Union $47,754 $43,498 $42,196 $41,927 $50,911 $53,632 $45,858 $42,262 $43,900 $1,638 3.9% -$3,854 -8.1%39 Ottawa Port Clinton $138,352 $131,508 $131,803 $141,223 $131,509 $132,523 $126,135 $118,451 $126,332 $7,881 6.7% -$12,020 -8.7%40 Perry New Lexington $53,212 $53,092 $56,748 $55,927 $49,410 $51,123 $47,440 $45,699 $48,259 $2,560 5.6% -$4,953 -9.3%41 Highland Hillsboro $84,916 $81,948 $88,297 $89,065 $90,170 $88,812 $81,355 $80,959 $76,869 -$4,090 -5.1% -$8,047 -9.5%42 Tuscarawas New Phila. $283,646 $273,854 $273,048 $274,850 $279,181 $280,626 $268,571 $238,285 $256,213 $17,928 7.5% -$27,433 -9.7%43 Logan Bellefontaine $188,330 $188,758 $192,435 $189,076 $188,953 $189,377 $179,435 $169,802 $169,058 -$744 -0.4% -$19,272 -10.2%44 Allen Lima $505,077 $494,168 $501,001 $486,346 $491,117 $486,831 $452,012 $443,235 $451,258 $8,023 1.8% -$53,819 -10.7%45 Lake Mentor $969,092 $928,232 $920,800 $910,580 $905,937 $933,312 $895,198 $846,973 $865,467 $18,494 2.2% -$103,625 -10.7%46 Darke Greenville $150,845 $152,804 $149,413 $150,903 $140,934 $144,620 $138,277 $130,785 $134,407 $3,622 2.8% -$16,438 -10.9%47 Pike Waverly $107,620 $107,288 $99,345 $93,676 $88,286 $91,563 $90,921 $91,236 $95,816 $4,580 5.0% -$11,804 -11.0%48 Shelby Sidney $287,874 $280,531 $291,602 $295,096 $315,735 $313,393 $280,702 $253,202 $255,741 $2,539 1.0% -$32,133 -11.2%49 Hardin Kenton $72,280 $68,458 $68,685 $64,991 $65,955 $64,820 $64,411 $59,983 $64,162 $4,179 7.0% -$8,118 -11.2%

50 Marion Marion $244,885 $241,566 $245,419 $240,422 $229,948 $243,122 $228,612 $209,091 $214,658 $5,567 2.7% -$30,227 -12.3%51 Mahoning Youngstown $896,540 $865,742 $886,746 $873,392 $832,897 $850,659 $801,223 $764,801 $777,286 $12,485 1.6% -$119,254 -13.3%52 Wayne Wooster $421,001 $413,986 $428,668 $423,459 $402,745 $403,606 $383,431 $353,183 $362,595 $9,412 2.7% -$58,406 -13.9%53 Ashland Ashland $164,958 $159,724 $157,218 $154,854 $153,127 $160,104 $148,163 $138,891 $141,549 $2,658 1.9% -$23,409 -14.2%54 Cuyahoga Cleveland $8,897,661 $8,644,400 $8,435,992 $8,378,569 $8,186,563 $8,312,762 $7,855,723 $7,415,342 $7,605,217 $189,875 2.6% -$1,292,444 -14.5%55 Putnam Ottawa $94,914 $89,535 $93,030 $88,032 $82,404 $86,794 $86,060 $78,765 $80,896 $2,131 2.7% -$14,018 -14.8%56 Stark Canton $1,531,731 $1,512,426 $1,520,315 $1,456,540 $1,418,524 $1,428,483 $1,359,865 $1,258,712 $1,300,758 $42,046 3.3% -$230,973 -15.1%57 Auglaize Saint Marys $182,371 $169,422 $167,255 $165,170 $178,203 $183,341 $172,369 $152,534 $154,523 $1,989 1.3% -$27,848 -15.3%58 Van Wert Van Wert $97,935 $89,777 $85,346 $84,555 $91,550 $89,734 $83,260 $75,028 $82,746 $7,718 10.3% -$15,189 -15.5%59 Lucas Toledo $2,313,570 $2,293,274 $2,273,662 $2,226,684 $2,225,484 $2,195,986 $1,989,727 $1,894,351 $1,951,322 $56,971 3.0% -$362,248 -15.7%60 Ashtabula Ashtabula $278,232 $260,894 $269,784 $261,129 $253,723 $252,105 $240,271 $217,298 $233,033 $15,735 7.2% -$45,199 -16.2%61 Paulding Paulding $39,792 $43,325 $41,937 $37,345 $39,869 $41,892 $38,455 $33,801 $32,961 -$840 -2.5% -$6,831 -17.2%62 Wyandot Upper Sand. $79,270 $83,329 $83,929 $89,141 $75,409 $72,318 $65,867 $62,511 $65,292 $2,781 4.4% -$13,978 -17.6%63 Coshocton Coshocton $115,454 $104,914 $105,164 $103,346 $101,685 $101,131 $91,896 $84,431 $95,068 $10,637 12.6% -$20,386 -17.7%64 Morrow Mount Gilead $44,520 $43,304 $44,063 $44,664 $44,048 $43,840 $41,547 $37,041 $36,632 -$409 -1.1% -$7,888 -17.7%65 Seneca Tiffin $180,350 $179,062 $174,849 $169,747 $168,899 $168,175 $158,447 $149,178 $148,384 -$794 -0.5% -$31,966 -17.7%66 Columbiana East Liverpool $260,404 $250,756 $253,179 $248,409 $230,697 $236,348 $223,958 $207,838 $214,171 $6,333 3.0% -$46,233 -17.8%67 Champaign Urbana $98,219 $95,365 $93,581 $91,922 $94,478 $93,303 $86,674 $78,132 $80,635 $2,503 3.2% -$17,584 -17.9%68 Lorain Lorain $1,011,693 $942,677 $928,691 $917,686 $922,806 $927,609 $880,774 $798,724 $827,550 $28,826 3.6% -$184,143 -18.2%69 Fulton Wauseon $183,471 $180,985 $183,460 $179,702 $179,548 $177,688 $165,573 $142,641 $150,057 $7,416 5.2% -$33,414 -18.2%70 Miami Piqua $398,231 $380,436 $378,963 $368,185 $353,209 $359,214 $340,008 $308,811 $324,118 $15,307 5.0% -$74,113 -18.6%71 Noble Caldwell $27,310 $26,185 $28,581 $25,946 $26,304 $25,334 $23,991 $22,596 $22,085 -$511 -2.3% -$5,225 -19.1%72 Carroll Carrolton $49,520 $48,121 $45,700 $39,799 $43,875 $43,454 $40,550 $36,412 $39,470 $3,058 8.4% -$10,050 -20.3%73 Preble Eaton $102,311 $93,802 $92,553 $90,147 $89,886 $89,306 $84,351 $76,617 $81,169 $4,552 5.9% -$21,142 -20.7%74 Clark Springfield $500,565 $468,538 $456,321 $430,879 $431,041 $415,836 $407,929 $393,517 $393,428 -$89 0.0% -$107,137 -21.4%75 Erie Sandusky $394,211 $375,346 $374,284 $364,333 $349,370 $327,968 $308,672 $301,072 $309,450 $8,378 2.8% -$84,761 -21.5%76 Pickaway Circleville $161,694 $154,660 $141,856 $139,904 $134,225 $137,718 $131,840 $126,594 $126,666 $72 0.1% -$35,028 -21.7%77 Muskingum Zanesville $330,413 $332,292 $330,377 $299,901 $265,865 $271,915 $261,413 $255,103 $258,523 $3,420 1.3% -$71,890 -21.8%78 Williams Bryan $167,142 $155,056 $151,253 $143,401 $142,034 $142,702 $136,318 $122,286 $130,492 $8,206 6.7% -$36,650 -21.9%79 Huron Norwalk $238,120 $228,787 $225,156 $214,125 $211,380 $201,169 $188,842 $175,425 $182,827 $7,402 4.2% -$55,293 -23.2%80 Richland Mansfield $538,242 $528,381 $541,127 $517,500 $506,594 $476,728 $459,603 $407,946 $411,320 $3,374 0.8% -$126,922 -23.6%81 Montgomery Dayton $3,119,673 $3,017,630 $2,953,165 $2,901,643 $2,893,986 $2,724,594 $2,608,562 $2,352,098 $2,363,445 $11,347 0.5% -$756,228 -24.2%82 Defiance Defiance $185,724 $174,798 $173,382 $166,291 $178,958 $166,267 $148,837 $133,323 $137,062 $3,739 2.8% -$48,662 -26.2%83 Monroe Woodsfield $40,201 $40,032 $40,071 $43,184 $23,172 $30,471 $32,433 $29,550 $29,129 -$421 -1.4% -$11,072 -27.5%84 Crawford Bucyrus $144,255 $132,962 $132,424 $126,866 $116,086 $111,987 $103,937 $94,517 $99,137 $4,620 4.9% -$45,118 -31.3%85 Trumbull Warren $940,144 $880,607 $854,319 $836,926 $902,605 $745,799 $701,339 $573,160 $622,037 $48,877 8.5% -$318,107 -33.8%86 Clinton Wilmington $234,178 $225,113 $226,800 $245,164 $283,098 $282,797 $260,977 $192,058 $152,840 -$39,218 -20.4% -$81,338 -34.7%87 Meigs Middleport $40,768 $46,933 $28,243 $24,428 $22,440 $22,483 $22,194 $23,192 $25,202 $2,010 8.7% -$15,566 -38.2%88 Morgan McConnelsvile $32,311 $30,756 $28,285 $26,324 $16,626 $16,655 $17,060 $16,582 $17,333 $751 4.5% -$14,978 -46.4%

OHIO 88 COUNTY TOTAL $52,886,939 $51,841,736 $52,159,720 $51,559,431 $52,241,208 $52,705,300 $50,209,144 $47,252,989 $48,456,443 $1,203,454 2.5% -$4,430,496 -8.4%Source: ODJFS QCEW ES-202 Complete Count of Jobs and George Zeller

TABLE EIGHT: Trend in Aggregate Earnings from Manufacturing Employment During Third Quarter 2001-2010 (Thousands of $)Ohio Counties. Ranked by Fastest 2001-2010 % Increase in Aggregate Real Manufacturing Earnings, June 2010 Dollars, CPI Deflator

MFG MFG MFG MFGMFG MFG MFG MFG MFG MFG MFG MFG MFG 09-10 09-10 01-10 01-10

LARGEST EARN EARN EARN EARN EARN EARN EARN EARN EARN $ INCR % INCR $ INCR % INCR# COUNTY CITY 3Q 01 3Q 02 3Q 03 3Q 05 3Q 06 3Q 07 3Q 08 3Q 09 3Q 10 EARN EARN EARN EARN

1 Adams West Union $6,019 $4,210 $4,163 $8,388 $9,524 $12,270 $9,003 $8,194 $7,784 -$410 -5.0% $1,765 29.3%2 Mercer Celina $37,670 $39,362 $39,260 $48,440 $47,961 $50,120 $46,951 $40,985 $47,188 $6,203 15.1% $9,518 25.3%3 Guernsey Cambridge $24,103 $25,794 $31,960 $30,341 $31,290 $33,198 $30,904 $25,569 $28,908 $3,339 13.1% $4,805 19.9%4 Delaware Delaware $60,387 $56,152 $62,854 $71,179 $74,564 $74,810 $77,499 $69,935 $71,316 $1,381 2.0% $10,929 18.1%5 Knox Mount Vernon $50,990 $48,404 $46,173 $58,060 $62,286 $60,824 $59,247 $55,584 $59,041 $3,457 6.2% $8,051 15.8%6 Butler Hamilton $281,038 $275,517 $270,091 $287,180 $265,849 $301,876 $281,200 $245,994 $305,485 $59,491 24.2% $24,447 8.7%7 Warren Mason $139,055 $141,393 $143,807 $163,947 $164,827 $169,190 $150,352 $132,738 $138,615 $5,877 4.4% -$440 -0.3%8 Henry Napoleon $39,377 $43,226 $43,556 $46,219 $43,907 $41,611 $39,384 $35,755 $38,937 $3,182 8.9% -$440 -1.1%9 Jackson Jackson $30,839 $31,350 $34,682 $38,708 $34,819 $31,867 $28,424 $25,408 $29,648 $4,240 16.7% -$1,191 -3.9%

10 Vinton McArthur $4,329 $4,417 $4,064 $4,884 $4,886 $4,753 $4,423 $3,870 $4,131 $261 6.7% -$198 -4.6%11 Marion Marion $70,047 $74,042 $75,673 $75,579 $71,022 $80,663 $71,751 $64,495 $66,691 $2,196 3.4% -$3,356 -4.8%12 Lawrence Ironton $5,344 $5,137 $5,435 $5,773 $6,177 $7,227 $7,282 $5,562 $5,074 -$488 -8.8% -$271 -5.1%13 Holmes Millersburg $50,342 $49,413 $47,329 $54,645 $50,659 $50,883 $46,562 $43,152 $45,824 $2,672 6.2% -$4,518 -9.0%14 Darke Greenville $42,463 $38,711 $45,965 $44,933 $43,224 $42,358 $41,019 $35,668 $37,940 $2,272 6.4% -$4,523 -10.7%15 Wood Bowling Green $186,286 $188,335 $179,795 $176,790 $177,595 $273,865 $266,526 $144,921 $165,795 $20,874 14.4% -$20,491 -11.0%16 Sandusky Fremont $106,012 $103,927 $101,841 $98,317 $99,128 $97,833 $89,326 $82,158 $92,771 $10,613 12.9% -$13,241 -12.5%17 Ottawa Port Clinton $32,288 $27,954 $27,891 $30,825 $31,430 $31,101 $29,563 $23,556 $28,003 $4,447 18.9% -$4,285 -13.3%18 Medina Brunswick $114,850 $109,969 $106,042 $112,674 $111,230 $112,852 $104,885 $89,851 $99,368 $9,517 10.6% -$15,482 -13.5%19 Clinton Wilmington $43,446 $45,004 $45,367 $52,898 $48,610 $45,774 $41,688 $34,043 $37,583 $3,540 10.4% -$5,863 -13.5%20 Union Marysville $180,903 $185,406 $196,271 $179,347 $170,488 $187,447 $159,708 $168,018 $154,665 -$13,353 -7.9% -$26,238 -14.5%21 Shelby Sidney $157,538 $161,657 $162,545 $174,329 $177,784 $170,139 $152,928 $135,432 $134,553 -$879 -0.6% -$22,985 -14.6%22 Morgan McConnelsvile $5,988 $6,460 $5,364 $3,590 $3,399 $3,583 $4,430 $4,385 $5,079 $694 15.8% -$909 -15.2%23 Meigs Middleport $1,021 $1,066 $1,035 $973 $840 $1,887 $761 $673 $860 $187 27.8% -$161 -15.8%24 Logan Bellefontaine $91,913 $95,448 $90,505 $86,967 $88,573 $87,790 $81,915 $77,977 $76,440 -$1,537 -2.0% -$15,473 -16.8%25 Madison London $33,229 $36,261 $34,976 $35,872 $34,852 $33,645 $30,909 $26,276 $27,493 $1,217 4.6% -$5,736 -17.3%26 Hancock Findlay $136,232 $136,433 $130,006 $150,841 $136,462 $132,725 $120,515 $106,124 $112,093 $5,969 5.6% -$24,139 -17.7%27 Preble Eaton $43,595 $42,724 $41,354 $42,276 $40,417 $39,984 $37,935 $32,162 $35,490 $3,328 10.3% -$8,105 -18.6%28 Washington Marietta $60,614 $58,500 $56,239 $52,734 $54,588 $55,670 $54,463 $47,503 $49,345 $1,842 3.9% -$11,269 -18.6%29 Lake Mentor $316,467 $291,870 $270,275 $277,286 $266,004 $273,234 $261,007 $240,997 $256,314 $15,317 6.4% -$60,153 -19.0%30 Brown Georgetown $7,565 $7,039 $6,274 $7,490 $8,039 $8,309 $7,339 $5,357 $6,123 $766 14.3% -$1,442 -19.1%31 Fairfield Lancaster $59,801 $58,974 $56,858 $54,109 $57,904 $54,926 $53,403 $48,846 $48,139 -$707 -1.4% -$11,662 -19.5%32 Auglaize Saint Marys $84,249 $80,699 $81,088 $93,149 $84,938 $86,970 $82,468 $65,275 $66,934 $1,659 2.5% -$17,315 -20.6%33 Tuscarawas New Phila. $90,110 $84,405 $82,893 $86,822 $81,408 $81,037 $75,739 $60,048 $70,014 $9,966 16.6% -$20,096 -22.3%34 Ross Chillicothe $62,682 $70,019 $55,487 $64,119 $62,362 $61,139 $48,772 $44,646 $48,255 $3,609 8.1% -$14,427 -23.0%35 Geauga Chardon $103,569 $100,729 $95,865 $110,775 $107,388 $98,928 $92,139 $78,401 $79,387 $986 1.3% -$24,182 -23.3%36 Ashtabula Ashtabula $95,580 $96,150 $91,078 $98,060 $90,186 $84,791 $78,875 $57,575 $72,453 $14,878 25.8% -$23,127 -24.2%37 Greene Beavercreek $54,789 $51,721 $48,920 $48,639 $46,606 $48,586 $43,976 $40,020 $41,437 $1,417 3.5% -$13,352 -24.4%38 Allen Lima $146,917 $145,431 $137,377 $153,455 $136,111 $130,274 $113,869 $107,248 $110,523 $3,275 3.1% -$36,394 -24.8%39 Belmont Martins Ferry $16,122 $15,926 $14,857 $14,902 $15,873 $15,193 $14,154 $10,577 $11,865 $1,288 12.2% -$4,257 -26.4%40 Mahoning Youngstown $113,431 $109,688 $108,203 $105,326 $103,880 $103,158 $95,223 $78,947 $82,993 $4,046 5.1% -$30,438 -26.8%41 Portage Kent $153,868 $145,892 $141,871 $146,113 $141,224 $136,836 $122,279 $101,949 $111,890 $9,941 9.8% -$41,978 -27.3%42 Wayne Wooster $165,203 $173,701 $164,817 $162,670 $150,922 $147,343 $135,329 $111,649 $119,895 $8,246 7.4% -$45,308 -27.4%43 Hardin Kenton $25,571 $26,072 $22,274 $25,818 $22,620 $21,588 $21,671 $16,802 $18,535 $1,733 10.3% -$7,036 -27.5%44 Miami Piqua $147,076 $138,370 $129,348 $124,968 $115,277 $119,059 $112,929 $92,688 $105,789 $13,101 14.1% -$41,287 -28.1%45 Hamilton Cincinnati $1,029,091 $1,008,796 $1,019,334 $935,663 $907,071 $922,855 $857,135 $770,308 $738,085 -$32,223 -4.2% -$291,006 -28.3%46 Hocking Logan $12,930 $13,582 $12,318 $10,535 $10,704 $10,873 $8,839 $7,997 $9,257 $1,260 15.8% -$3,673 -28.4%47 Fulton Wauseon $93,745 $97,209 $93,221 $101,042 $91,842 $88,074 $78,278 $59,123 $67,020 $7,897 13.4% -$26,725 -28.5%48 Champaign Urbana $43,313 $43,676 $41,039 $45,180 $42,739 $42,012 $36,709 $29,708 $30,618 $910 3.1% -$12,695 -29.3%49 Van Wert Van Wert $41,909 $36,295 $36,489 $37,392 $36,888 $35,767 $29,573 $22,980 $29,370 $6,390 27.8% -$12,539 -29.9%

MFG MFG MFG MFG MFG MFG MFG MFG MFG 09-10 09-10 01-10 01-10LARGEST EARN EARN EARN EARN EARN EARN EARN EARN EARN $ INCR % INCR $ INCR % INCR

# COUNTY CITY 3Q 01 3Q 02 3Q 03 3Q 05 3Q 06 3Q 07 3Q 08 3Q 09 3Q 10 EARN EARN EARN EARN50 Williams Bryan $86,113 $83,486 $74,817 $72,525 $70,173 $70,342 $64,690 $50,724 $59,981 $9,257 18.2% -$26,132 -30.3%51 Scioto Portsmouth $24,067 $20,938 $20,233 $21,258 $19,612 $19,442 $18,458 $16,171 $16,663 $492 3.0% -$7,404 -30.8%52 Columbiana East Liverpool $72,341 $72,980 $63,937 $62,969 $55,706 $60,825 $57,429 $45,317 $50,001 $4,684 10.3% -$22,340 -30.9%53 Licking Newark $99,604 $93,424 $94,380 $99,188 $96,731 $97,007 $84,867 $67,107 $67,621 $514 0.8% -$31,983 -32.1%54 Coshocton Coshocton $41,244 $40,727 $39,049 $45,791 $39,592 $35,359 $32,267 $27,007 $27,739 $732 2.7% -$13,505 -32.7%55 Putnam Ottawa $43,461 $45,423 $38,167 $31,081 $32,796 $34,687 $35,125 $28,199 $28,317 $118 0.4% -$15,144 -34.8%56 Harrison Cadiz $6,407 $6,172 $5,756 $6,283 $5,880 $5,583 $5,046 $4,010 $4,155 $145 3.6% -$2,252 -35.1%57 Lorain Lorain $329,939 $305,850 $293,579 $322,288 $275,303 $279,175 $253,837 $186,660 $213,960 $27,300 14.6% -$115,979 -35.2%58 Cuyahoga Cleveland $1,427,871 $1,298,993 $1,215,344 $1,188,930 $1,162,254 $1,146,206 $1,029,655 $836,811 $925,781 $88,970 10.6% -$502,090 -35.2%59 Summit Akron $574,499 $469,668 $497,087 $483,629 $447,817 $452,216 $412,416 $343,341 $369,791 $26,450 7.7% -$204,708 -35.6%60 Highland Hillsboro $25,797 $28,660 $28,148 $28,922 $23,827 $22,051 $19,602 $19,801 $16,538 -$3,263 -16.5% -$9,259 -35.9%61 Franklin Columbus $723,934 $693,964 $624,594 $575,596 $564,850 $540,003 $497,004 $442,495 $456,466 $13,971 3.2% -$267,468 -36.9%62 Paulding Paulding $16,257 $14,318 $11,489 $14,880 $14,346 $16,227 $13,155 $9,584 $9,856 $272 2.8% -$6,401 -39.4%63 Stark Canton $472,562 $446,214 $376,080 $378,975 $354,253 $358,067 $337,413 $265,696 $286,489 $20,793 7.8% -$186,073 -39.4%64 Morrow Mount Gilead $14,228 $12,537 $12,699 $13,282 $12,753 $12,593 $11,199 $8,811 $8,539 -$272 -3.1% -$5,689 -40.0%65 Carroll Carrolton $19,784 $18,416 $11,713 $11,480 $14,256 $13,671 $12,355 $9,619 $11,840 $2,221 23.1% -$7,944 -40.2%66 Athens Athens $7,071 $7,639 $7,898 $6,521 $4,650 $4,316 $4,537 $4,034 $4,138 $104 2.6% -$2,933 -41.5%67 Lucas Toledo $479,523 $468,588 $421,072 $406,764 $387,364 $340,989 $281,341 $243,582 $279,560 $35,978 14.8% -$199,963 -41.7%68 Huron Norwalk $101,349 $94,371 $84,821 $88,825 $79,220 $72,329 $65,046 $54,876 $58,039 $3,163 5.8% -$43,310 -42.7%69 Wyandot Upper Sand. $44,677 $44,430 $48,013 $41,049 $32,951 $30,824 $25,514 $22,812 $25,420 $2,608 11.4% -$19,257 -43.1%70 Defiance Defiance $93,828 $89,563 $82,748 $82,144 $95,087 $77,725 $64,750 $49,302 $52,390 $3,088 6.3% -$41,438 -44.2%71 Gallia Gallipolis $10,680 $10,263 $8,679 $7,410 $6,691 $6,457 $6,319 $5,316 $5,952 $636 12.0% -$4,728 -44.3%72 Seneca Tiffin $66,114 $62,372 $57,905 $56,167 $56,222 $54,433 $48,722 $40,790 $36,785 -$4,005 -9.8% -$29,329 -44.4%73 Pike Waverly $66,212 $56,123 $49,606 $44,592 $37,441 $36,406 $34,564 $33,082 $36,645 $3,563 10.8% -$29,567 -44.7%74 Clark Springfield $137,881 $124,503 $99,939 $95,760 $98,028 $83,943 $82,878 $70,306 $75,510 $5,204 7.4% -$62,371 -45.2%75 Ashland Ashland $59,871 $55,049 $49,957 $44,426 $40,334 $39,396 $35,148 $31,142 $32,731 $1,589 5.1% -$27,140 -45.3%76 Fayette Washington CH $30,523 $30,324 $29,631 $26,414 $25,654 $26,132 $23,727 $18,822 $16,676 -$2,146 -11.4% -$13,847 -45.4%77 Pickaway Circleville $56,818 $54,444 $50,113 $32,551 $32,620 $34,303 $32,970 $29,627 $30,429 $802 2.7% -$26,389 -46.4%78 Clermont Milford $109,649 $117,762 $96,172 $109,420 $98,710 $91,694 $69,993 $57,535 $57,483 -$52 -0.1% -$52,166 -47.6%79 Crawford Bucyrus $56,952 $54,645 $50,242 $56,823 $45,206 $40,434 $33,365 $25,447 $29,850 $4,403 17.3% -$27,102 -47.6%80 Erie Sandusky $133,575 $123,111 $114,918 $106,920 $105,187 $83,799 $72,213 $63,080 $69,371 $6,291 10.0% -$64,204 -48.1%81 Richland Mansfield $189,577 $190,825 $181,605 $171,848 $178,345 $149,308 $140,607 $105,350 $98,034 -$7,316 -6.9% -$91,543 -48.3%82 Monroe Woodsfield $25,636 $24,414 $22,650 $7,692 $5,813 $13,055 $13,645 $16,740 $12,948 -$3,792 -22.7% -$12,688 -49.5%83 Trumbull Warren $419,743 $392,818 $376,908 $351,017 $421,781 $277,368 $262,020 $150,758 $195,701 $44,943 29.8% -$224,042 -53.4%84 Perry New Lexington $14,207 $13,648 $11,351 $10,287 $9,362 $9,033 $7,647 $6,284 $6,261 -$23 -0.4% -$7,946 -55.9%85 Muskingum Zanesville $83,946 $77,016 $69,343 $55,262 $48,638 $54,246 $46,828 $39,109 $36,473 -$2,636 -6.7% -$47,473 -56.6%86 Montgomery Dayton $747,509 $698,423 $627,059 $589,569 $661,862 $485,372 $443,508 $293,557 $304,936 $11,379 3.9% -$442,573 -59.2%87 Jefferson Steubenville $50,766 $45,851 $40,610 $39,172 $42,076 $44,359 $48,443 $17,555 $20,115 $2,560 14.6% -$30,651 -60.4%88 Noble Caldwell $7,131 $7,659 $6,324 $5,212 $5,668 $5,619 $5,354 $4,342 $2,177 -$2,165 -49.9% -$4,954 -69.5%

OHIO 88 COUNTY TOTAL $11,871,252 $11,328,127 $10,738,766 $10,633,140 $10,375,432 $10,031,891 $9,172,913 $7,561,930 $8,072,377 $510,447 6.8% -$3,798,875 -32.0%

TABLE NINE: Trend in Aggregate Earnings from Finance and Insuance Employment During Third Quarter 2001-2010 (Thousands of $)Ohio Counties. Ranked by Fastest 2001-2010 % Increase in Aggregate Real Finance and Insurance Earnings, June 2010 Dollars, CPI Deflator

FINANCE FINANCE FINANCE FINANCE FINANCE FINANCE FINANCE FINANCE FINANCE 09-10 09-10 01-10 01-10LARGEST EARN EARN EARN EARN EARN EARN EARN EARN EARN $ INCR % INCR $ INCR % INCR

# COUNTY CITY 3Q 01 3Q 02 3Q 03 3Q 05 3Q 06 3Q 07 3Q 08 3Q 09 3Q 10 EARN EARN EARN EARN

1 Monroe Woodsfield $717 $1,710 $4,935 $3,970 $2,762 $2,867 $2,860 $2,111 $1,981 -$131 -6.2% $1,263 176.1%2 Clark Springfield $9,696 $9,789 $10,181 $17,066 $19,870 $20,101 $19,609 $20,464 $19,896 -$568 -2.8% $10,200 105.2%3 Wyandot Upper Sandusky $1,455 $1,538 $1,786 $1,825 $1,932 $2,041 $1,620 $2,275 $2,411 $136 6.0% $956 65.8%4 Warren Mason $34,562 $40,572 $42,298 $63,851 $55,685 $53,930 $57,924 $54,303 $53,736 -$567 -1.0% $19,174 55.5%5 Delaware Delaware $52,760 $81,302 $86,316 $79,474 $76,643 $71,340 $65,523 $70,496 $77,007 $6,511 9.2% $24,247 46.0%6 Gallia Gallipolis $2,616 $2,685 $3,053 $3,381 $3,371 $3,461 $3,260 $3,423 $3,609 $186 5.4% $993 37.9%7 Pike Waverly $1,373 $1,379 $1,493 $1,583 $1,502 $1,491 $1,369 $1,530 $1,833 $303 19.8% $460 33.6%8 Butler Hamilton $86,432 $92,234 $100,826 $116,635 $122,267 $177,128 $122,638 $107,784 $114,975 $7,191 6.7% $28,543 33.0%9 Hardin Kenton $1,278 $1,336 $1,379 $1,658 $1,726 $1,712 $1,656 $1,698 $1,672 -$26 -1.5% $394 30.8%

10 Van Wert Van Wert $6,128 $6,287 $6,694 $7,635 $7,384 $7,699 $7,833 $7,834 $7,826 -$8 -0.1% $1,698 27.7%11 Ross Chillicothe $3,453 $3,639 $4,478 $5,175 $5,175 $5,005 $4,470 $4,452 $4,351 -$101 -2.3% $898 26.0%12 Wood Bowling Green $8,207 $9,078 $9,776 $8,897 $8,368 $8,269 $10,466 $10,157 $10,328 $171 1.7% $2,121 25.8%13 Geauga Chardon $6,883 $7,256 $9,019 $9,767 $8,908 $9,719 $7,985 $8,444 $8,493 $49 0.6% $1,610 23.4%14 Clermont Milford $31,918 $37,575 $42,333 $45,959 $51,529 $53,408 $47,745 $46,097 $39,177 -$6,920 -15.0% $7,259 22.7%15 Shelby Sidney $2,940 $3,098 $3,577 $3,357 $3,513 $3,627 $3,699 $3,482 $3,608 $126 3.6% $668 22.7%16 Defiance Defiance $5,141 $5,436 $6,547 $6,805 $7,072 $6,907 $5,875 $6,121 $6,228 $107 1.8% $1,087 21.1%17 Holmes Millersburg $2,820 $2,943 $3,526 $3,007 $3,107 $3,157 $2,796 $2,980 $3,365 $385 12.9% $545 19.3%18 Marion Marion $4,138 $4,093 $4,351 $4,408 $4,600 $4,661 $4,958 $4,950 $4,783 -$167 -3.4% $645 15.6%19 Washington Marietta $5,992 $6,344 $6,551 $6,141 $6,652 $6,889 $6,543 $6,668 $6,758 $90 1.3% $766 12.8%20 Portage Kent $6,536 $6,694 $7,397 $7,380 $7,246 $7,431 $6,575 $7,162 $7,344 $182 2.5% $808 12.4%21 Harrison Cadiz $348 $389 $379 $345 $356 $505 $348 $257 $379 $122 47.5% $31 8.8%22 Stark Canton $56,496 $60,687 $65,460 $65,225 $68,018 $67,102 $61,877 $59,553 $60,543 $990 1.7% $4,047 7.2%23 Ashland Ashland $2,487 $2,611 $2,584 $2,666 $2,472 $2,517 $2,531 $2,231 $2,662 $431 19.3% $175 7.1%24 Hamilton Cincinnati $385,211 $390,868 $415,417 $403,832 $380,426 $393,269 $377,810 $398,679 $409,393 $10,714 2.7% $24,182 6.3%25 Huron Norwalk $3,537 $3,879 $3,719 $4,452 $3,908 $4,172 $3,710 $3,696 $3,758 $62 1.7% $221 6.2%26 Hocking Logan $1,342 $1,423 $1,530 $1,529 $1,503 $1,494 $1,358 $1,376 $1,421 $45 3.3% $79 5.9%27 Knox Mount Vernon $2,899 $3,065 $3,273 $3,249 $3,021 $3,051 $3,205 $3,061 $3,045 -$16 -0.5% $146 5.0%28 Coshocton Coshocton $1,888 $1,859 $1,815 $1,990 $2,077 $2,089 $1,952 $1,886 $1,977 $91 4.8% $89 4.7%29 Putnam Ottawa $2,747 $3,167 $3,381 $3,137 $2,719 $2,809 $2,769 $2,873 $2,874 $1 0.0% $127 4.6%30 Lorain Lorain $18,449 $20,115 $21,402 $21,510 $20,369 $19,705 $19,081 $19,458 $19,293 -$165 -0.8% $844 4.6%31 Vinton McArthur $374 $176 $171 $706 $676 $641 $562 $415 $389 -$26 -6.2% $15 4.1%32 Fairfield Lancaster $6,647 $7,688 $8,519 $8,186 $7,626 $7,710 $6,674 $7,064 $6,880 -$184 -2.6% $233 3.5%33 Darke Greenville $5,344 $5,294 $6,270 $5,365 $5,643 $5,733 $5,334 $5,286 $5,503 $217 4.1% $159 3.0%34 Licking Newark $29,225 $24,078 $24,427 $27,879 $25,911 $28,550 $28,590 $29,774 $30,043 $269 0.9% $818 2.8%35 Sandusky Fremont $4,186 $4,113 $4,532 $4,507 $4,422 $4,498 $4,171 $4,072 $4,260 $188 4.6% $74 1.8%36 Henry Napoleon $2,500 $2,533 $2,652 $2,740 $2,511 $2,683 $2,526 $2,574 $2,540 -$34 -1.3% $40 1.6%37 Greene Beavercreek $18,690 $19,635 $20,397 $22,127 $21,149 $21,180 $13,521 $16,828 $18,790 $1,962 11.7% $100 0.5%38 Lawrence Ironton $2,091 $2,052 $2,264 $2,431 $2,532 $2,477 $2,064 $2,059 $2,079 $20 1.0% -$12 -0.6%39 Tuscarawas New Phila. $6,894 $6,964 $7,378 $7,363 $6,793 $7,301 $6,654 $6,200 $6,851 $651 10.5% -$43 -0.6%40 Morrow Mount Gilead $661 $656 $740 $745 $698 $628 $661 $618 $656 $38 6.2% -$5 -0.8%41 Brown Georgetown $1,501 $1,541 $1,815 $1,963 $1,976 $2,097 $1,828 $1,769 $1,480 -$289 -16.3% -$21 -1.4%42 Franklin Columbus $685,912 $675,443 $712,688 $732,127 $745,116 $755,586 $672,860 $673,066 $674,664 $1,598 0.2% -$11,248 -1.6%43 Medina Brunswick $11,658 $11,234 $12,426 $12,290 $13,370 $12,729 $11,795 $11,892 $11,466 -$426 -3.6% -$192 -1.6%44 Auglaize Saint Marys $2,914 $2,881 $2,864 $3,045 $2,784 $2,865 $2,804 $2,670 $2,844 $174 6.5% -$70 -2.4%45 Muskingum Zanesville $7,851 $7,209 $8,222 $9,209 $8,447 $8,872 $7,572 $7,677 $7,653 -$24 -0.3% -$198 -2.5%46 Montgomery Dayton $125,511 $126,923 $133,435 $141,531 $150,050 $155,303 $123,488 $122,852 $121,935 -$917 -0.7% -$3,576 -2.8%47 Mercer Celina $5,773 $5,986 $5,679 $5,596 $5,512 $5,640 $5,377 $5,492 $5,586 $94 1.7% -$187 -3.2%48 Preble Eaton $1,889 $1,882 $2,065 $1,804 $1,933 $1,928 $1,890 $1,822 $1,828 $6 0.3% -$61 -3.2%49 Crawford Bucyrus $5,856 $5,927 $6,665 $7,185 $5,811 $5,756 $5,305 $5,546 $5,651 $105 1.9% -$205 -3.5%

FINANCE FINANCE FINANCE FINANCE FINANCE FINANCE FINANCE FINANCE FINANCE 09-10 09-10 01-10 01-10LARGEST EARN EARN EARN EARN EARN EARN EARN EARN EARN $ INCR % INCR $ INCR % INCR

# COUNTY CITY 3Q 01 3Q 02 3Q 03 3Q 05 3Q 06 3Q 07 3Q 08 3Q 09 3Q 10 EARN EARN EARN EARN50 Fayette Washingtn CH $3,404 $2,926 $3,223 $3,094 $3,463 $3,918 $3,767 $3,607 $3,283 -$324 -9.0% -$121 -3.5%51 Ottawa Port Clinton $3,022 $3,144 $3,766 $3,283 $3,141 $3,139 $2,896 $2,724 $2,892 $168 6.2% -$130 -4.3%52 Summit Akron $122,954 $123,140 $123,803 $126,342 $119,928 $124,507 $114,904 $114,413 $115,850 $1,437 1.3% -$7,104 -5.8%53 Paulding Paulding $828 $849 $717 $716 $748 $787 $741 $880 $770 -$110 -12.5% -$58 -7.0%54 Meigs Middleport $1,022 $1,047 $989 $971 $1,022 $1,030 $1,006 $910 $941 $31 3.5% -$81 -8.0%55 Lucas Toledo $80,253 $84,031 $84,658 $91,818 $86,393 $90,207 $76,106 $73,665 $73,550 -$115 -0.2% -$6,703 -8.4%56 Belmont Martins Ferry $6,910 $6,865 $7,104 $7,220 $5,992 $6,384 $6,394 $5,838 $6,295 $457 7.8% -$615 -8.9%57 Wayne Wooster $13,130 $13,056 $13,955 $13,567 $12,771 $12,850 $11,612 $11,340 $11,905 $565 5.0% -$1,225 -9.3%58 Athens Athens $4,028 $4,397 $4,371 $3,806 $3,883 $3,956 $3,959 $3,549 $3,594 $45 1.3% -$434 -10.8%59 Madison London $1,426 $1,430 $1,818 $1,734 $1,305 $1,376 $1,443 $1,435 $1,272 -$163 -11.4% -$154 -10.8%60 Jackson Jackson $2,539 $2,659 $3,454 $3,892 $3,147 $3,172 $2,335 $2,389 $2,256 -$133 -5.6% -$283 -11.2%61 Allen Lima $11,139 $11,597 $12,214 $11,698 $11,465 $11,594 $10,847 $10,111 $9,895 -$216 -2.1% -$1,244 -11.2%62 Mahoning Youngstown $34,886 $34,974 $35,883 $36,330 $35,108 $33,495 $31,092 $30,369 $30,825 $456 1.5% -$4,061 -11.6%63 Seneca Tiffin $6,069 $6,954 $7,417 $7,451 $6,834 $6,216 $4,966 $4,930 $5,269 $339 6.9% -$800 -13.2%64 Guernsey Cambridge $2,634 $2,861 $2,831 $2,573 $2,831 $2,705 $2,682 $2,532 $2,276 -$256 -10.1% -$358 -13.6%65 Morgan McConnelsville $623 $608 $621 $684 $667 $628 $552 $629 $538 -$91 -14.4% -$85 -13.7%66 Scioto Portsmouth $5,239 $4,641 $4,981 $4,952 $4,568 $4,637 $4,433 $4,411 $4,509 $98 2.2% -$730 -13.9%67 Miami Piqua $8,501 $8,587 $9,524 $11,520 $9,782 $9,689 $9,054 $8,227 $7,311 -$916 -11.1% -$1,190 -14.0%68 Fulton Wauseon $3,538 $3,843 $3,759 $3,885 $3,966 $3,805 $3,053 $3,145 $3,029 -$116 -3.7% -$509 -14.4%69 Lake Mentor $24,236 $21,370 $22,879 $26,428 $23,967 $23,759 $21,926 $20,650 $20,221 -$429 -2.1% -$4,015 -16.6%70 Clinton Wilmington $6,888 $6,963 $7,029 $6,589 $6,637 $6,641 $6,255 $6,158 $5,736 -$422 -6.9% -$1,152 -16.7%71 Cuyahoga Cleveland $796,591 $783,080 $830,007 $873,787 $821,515 $780,295 $668,595 $680,718 $656,781 -$23,937 -3.5% -$139,810 -17.6%72 Erie Sandusky $8,130 $7,884 $8,421 $7,575 $6,771 $6,639 $6,681 $6,533 $6,667 $134 2.1% -$1,463 -18.0%73 Williams Bryan $3,511 $3,353 $3,621 $3,606 $3,347 $3,405 $3,148 $3,134 $2,878 -$256 -8.2% -$633 -18.0%74 Ashtabula Ashtabula $5,791 $5,977 $6,100 $5,115 $5,141 $5,523 $5,277 $4,670 $4,702 $32 0.7% -$1,089 -18.8%75 Columbiana East Liverpool $6,466 $7,544 $8,703 $8,268 $7,389 $7,411 $6,035 $5,699 $5,100 -$599 -10.5% -$1,366 -21.1%76 Jefferson Steubenville $3,803 $3,792 $3,873 $3,449 $3,351 $3,415 $3,381 $3,005 $2,988 -$17 -0.6% -$815 -21.4%77 Adams West Union $1,468 $1,562 $1,538 $1,643 $1,537 $1,515 $1,143 $1,156 $1,146 -$10 -0.9% -$322 -21.9%78 Highland Hillsboro $4,313 $4,716 $4,906 $5,937 $5,623 $5,936 $3,726 $3,455 $3,322 -$133 -3.9% -$991 -23.0%79 Perry New Lexington $1,548 $1,610 $1,807 $1,423 $1,241 $1,192 $1,152 $1,322 $1,186 -$136 -10.3% -$362 -23.4%80 Richland Mansfield $14,089 $14,287 $13,194 $12,320 $11,072 $10,813 $11,127 $10,660 $10,777 $117 1.1% -$3,312 -23.5%81 Pickaway Circleville $3,485 $2,616 $2,902 $2,834 $2,945 $3,019 $2,714 $2,555 $2,652 $97 3.8% -$833 -23.9%82 Champaign Urbana $2,411 $2,573 $2,709 $2,491 $2,047 $2,089 $1,893 $1,900 $1,805 -$95 -5.0% -$606 -25.1%83 Noble Caldwell $591 $593 $496 $668 $697 $638 $612 $451 $423 -$28 -6.2% -$168 -28.4%84 Trumbull Warren $19,390 $20,101 $21,742 $17,751 $16,886 $17,326 $14,967 $14,439 $13,669 -$770 -5.3% -$5,721 -29.5%85 Union Marysville $4,059 $4,491 $5,630 $4,346 $4,036 $3,694 $3,975 $3,186 $2,684 -$502 -15.7% -$1,375 -33.9%86 Logan Bellefontaine $4,189 $4,670 $3,000 $3,006 $2,949 $2,933 $2,443 $2,526 $2,475 -$51 -2.0% -$1,714 -40.9%87 Hancock Findlay $10,516 $10,849 $10,971 $8,689 $8,527 $8,036 $6,291 $6,080 $6,031 -$49 -0.8% -$4,485 -42.6%88 Carroll Carrolton $950 $995 $1,027 $806 $538 $601 $537 $503 $519 $16 3.1% -$431 -45.4%

OHIO 88 COUNTY TOTAL $2,910,498 $2,951,901 $3,124,330 $3,234,974 $3,150,377 $3,198,703 $2,827,437 $2,837,081 $2,833,846 -$3,235 -0.1% -$76,652 -2.6%Source: ODJFS QCEW ES-202 Complete Count of Jobs and George ZellerNOTE1: Data suppressed in Vinton and Harrison County in 2001, 2002, 2003, 2004, 2009 and 2010 and in Monroe and Noble County in 2009; data interpolated from statewide totals

TABLE TEN: Trend in Aggregate Earnings from Retail Trade Employment During Third Quarter 2001-2010 (Thousands of $)Ohio Counties. Ranked by Fastest 2001-2010 % Increase in Aggregate Real Manufacturing Earnings, June 2010 Dollars, CPI Deflator

RETAIL RETAIL RETAIL RETAIL RETAIL RETAIL RETAIL RETAIL RETAIL RETAIL 09-10 09-10 01-10 01-10LARGEST EARN EARN EARN EARN EARN EARN EARN EARN EARN EARN $ INCR % INCR $ INCR % INCR

# COUNTY CITY 3Q 01 3Q 02 3Q 03 3Q 04 3Q 05 3Q 06 3Q 07 3Q 08 3Q 09 3Q 10 EARN EARN EARN EARN

1 Delaware Delaware $39,217 $48,573 $63,820 $50,918 $62,301 $60,210 $57,431 $56,550 $58,461 $59,118 $657 1.1% $19,901 50.7%2 Madison London $8,323 $8,503 $12,827 $17,071 $12,081 $11,573 $11,543 $10,480 $10,045 $11,157 $1,112 11.1% $2,834 34.0%3 Geauga Chardon $19,530 $19,381 $29,786 $21,908 $23,447 $25,927 $26,804 $24,330 $23,690 $24,876 $1,186 5.0% $5,346 27.4%4 Athens Athens $14,752 $13,776 $19,201 $15,509 $14,785 $15,830 $17,279 $16,876 $17,277 $17,740 $463 2.7% $2,988 20.3%5 Fairfield Lancaster $28,874 $28,150 $37,426 $28,387 $28,219 $32,486 $33,680 $34,138 $33,394 $33,414 $20 0.1% $4,540 15.7%6 Henry Napoleon $5,965 $6,795 $6,633 $6,553 $6,222 $5,838 $5,969 $5,334 $6,213 $6,861 $648 10.4% $896 15.0%7 Wyandot Upper Sandusky $3,385 $3,704 $5,058 $3,887 $4,166 $4,423 $4,552 $3,972 $3,776 $3,872 $96 2.5% $487 14.4%8 Union Marysville $10,383 $10,081 $10,717 $9,662 $9,972 $9,351 $9,644 $10,836 $11,319 $11,703 $384 3.4% $1,320 12.7%9 Williams Bryan $7,802 $7,532 $8,010 $7,506 $6,999 $7,146 $7,208 $8,201 $8,469 $8,652 $183 2.2% $850 10.9%

10 Mercer Celina $10,046 $9,223 $11,858 $9,879 $10,774 $10,752 $10,671 $11,036 $10,450 $10,961 $511 4.9% $915 9.1%11 Warren Mason $64,258 $61,243 $80,644 $64,098 $66,025 $71,527 $72,571 $65,599 $62,959 $70,026 $7,067 11.2% $5,768 9.0%12 Butler Hamilton $93,554 $96,497 $111,964 $96,817 $100,504 $92,778 $100,757 $101,157 $96,013 $100,357 $4,344 4.5% $6,803 7.3%13 Brown Georgetown $4,874 $5,123 $5,056 $5,447 $5,200 $4,813 $4,550 $4,320 $4,618 $5,201 $583 12.6% $327 6.7%14 Monroe Woodsfield $1,409 $1,429 $1,714 $1,431 $1,487 $1,448 $1,542 $1,447 $1,512 $1,494 -$18 -1.2% $85 6.0%15 Fayette Washington CH $11,058 $12,847 $13,407 $8,775 $9,436 $11,637 $12,065 $11,153 $11,233 $11,497 $264 2.4% $439 4.0%16 Holmes Millersburg $9,807 $9,684 $11,825 $11,622 $11,368 $10,698 $10,641 $10,010 $9,544 $10,186 $642 6.7% $379 3.9%17 Knox Mount Vernon $11,467 $11,137 $14,177 $11,612 $12,862 $11,871 $12,758 $12,882 $12,054 $11,839 -$215 -1.8% $372 3.2%18 Medina Brunswick $46,243 $46,636 $56,556 $49,153 $49,924 $49,259 $50,895 $47,168 $46,307 $47,478 $1,171 2.5% $1,235 2.7%19 Pickaway Circleville $8,792 $8,797 $10,168 $9,337 $10,411 $8,896 $9,150 $8,850 $8,948 $9,019 $71 0.8% $227 2.6%20 Van Wert Van Wert $6,178 $5,970 $7,095 $5,992 $6,082 $6,687 $6,385 $6,261 $6,061 $6,335 $274 4.5% $157 2.5%21 Clermont Milford $53,129 $55,959 $67,986 $57,184 $56,796 $61,299 $61,181 $58,548 $56,412 $54,377 -$2,035 -3.6% $1,248 2.3%22 Columbiana East Liverpool $23,042 $21,780 $24,974 $23,332 $22,373 $21,877 $22,474 $21,595 $21,532 $23,238 $1,706 7.9% $196 0.8%23 Guernsey Cambridge $9,917 $10,650 $11,368 $11,328 $10,708 $9,663 $10,230 $9,235 $9,688 $9,959 $271 2.8% $42 0.4%24 Putnam Ottawa $5,932 $5,421 $6,419 $6,246 $6,032 $5,573 $5,777 $5,577 $5,533 $5,928 $395 7.1% -$4 -0.1%25 Carroll Carrolton $4,770 $4,151 $5,454 $4,172 $4,324 $4,784 $4,908 $4,568 $4,739 $4,748 $9 0.2% -$22 -0.5%26 Lawrence Ironton $11,335 $11,074 $12,947 $12,311 $11,376 $11,437 $11,651 $11,337 $11,225 $11,216 -$9 -0.1% -$119 -1.1%27 Coshocton Coshocton $6,270 $6,078 $6,683 $6,278 $6,650 $6,034 $6,014 $5,887 $5,765 $6,203 $438 7.6% -$67 -1.1%28 Auglaize Saint Marys $9,981 $10,287 $11,793 $10,282 $11,099 $10,765 $10,613 $10,342 $9,901 $9,858 -$43 -0.4% -$123 -1.2%29 Ashtabula Ashtabula $20,843 $21,841 $26,033 $23,472 $23,641 $22,917 $23,427 $21,664 $20,249 $20,583 $334 1.7% -$260 -1.2%30 Greene Beavercreek $51,433 $52,977 $60,651 $49,987 $51,189 $51,477 $54,580 $51,244 $49,550 $50,790 $1,240 2.5% -$643 -1.2%31 Hancock Findlay $29,492 $33,812 $36,798 $34,405 $36,560 $36,713 $33,115 $31,307 $28,976 $29,078 $102 0.4% -$414 -1.4%32 Hocking Logan $4,386 $5,392 $5,221 $5,349 $5,126 $4,847 $4,698 $4,470 $4,226 $4,224 -$2 0.0% -$162 -3.7%33 Seneca Tiffin $12,841 $12,729 $13,288 $12,974 $12,366 $12,060 $11,958 $11,874 $11,405 $12,263 $858 7.5% -$578 -4.5%34 Morrow Mount Gilead $3,696 $3,583 $4,320 $3,602 $3,953 $3,686 $3,888 $3,761 $3,725 $3,523 -$202 -5.4% -$173 -4.7%35 Pike Waverly $5,393 $5,043 $5,616 $5,309 $4,928 $5,159 $5,053 $4,960 $4,982 $5,107 $125 2.5% -$286 -5.3%36 Ashland Ashland $11,260 $10,657 $12,000 $10,697 $10,851 $10,949 $10,798 $10,326 $10,052 $10,570 $518 5.2% -$690 -6.1%37 Jefferson Steubenville $16,732 $17,020 $19,812 $18,471 $17,685 $17,413 $17,829 $16,286 $15,435 $15,705 $270 1.8% -$1,027 -6.1%38 Erie Sandusky $26,247 $25,867 $30,026 $28,710 $28,315 $28,367 $27,021 $24,985 $23,525 $24,597 $1,072 4.6% -$1,650 -6.3%39 Highland Hillsboro $8,708 $8,420 $9,676 $9,512 $8,980 $8,691 $8,708 $8,519 $8,481 $8,151 -$330 -3.9% -$557 -6.4%40 Jackson Jackson $8,147 $8,341 $8,435 $8,162 $7,687 $7,637 $7,591 $7,661 $7,682 $7,623 -$59 -0.8% -$524 -6.4%41 Washington Marietta $17,780 $17,695 $18,133 $17,529 $16,876 $16,269 $16,318 $16,207 $16,059 $16,589 $530 3.3% -$1,191 -6.7%42 Lorain Lorain $79,504 $76,658 $86,879 $82,238 $81,780 $78,277 $78,183 $72,549 $71,986 $73,010 $1,024 1.4% -$6,494 -8.2%43 Sandusky Fremont $17,256 $17,654 $18,192 $17,380 $16,989 $16,467 $16,371 $15,210 $15,452 $15,763 $311 2.0% -$1,493 -8.7%44 Wood Bowling Green $35,397 $34,207 $37,656 $35,137 $34,310 $32,708 $33,887 $33,813 $31,255 $32,210 $955 3.1% -$3,187 -9.0%45 Logan Bellefontaine $10,166 $9,888 $11,888 $11,005 $10,962 $10,274 $10,698 $9,791 $9,260 $9,243 -$17 -0.2% -$923 -9.1%46 Ross Chillicothe $23,235 $22,864 $23,453 $21,535 $22,367 $19,895 $21,106 $20,175 $20,384 $21,087 $703 3.4% -$2,148 -9.2%47 Vinton McArthur $866 $991 $846 $1,094 $1,045 $782 $762 $734 $724 $783 $59 8.2% -$83 -9.5%48 Scioto Portsmouth $18,429 $17,892 $18,683 $16,856 $16,396 $15,318 $16,813 $16,044 $16,186 $16,583 $397 2.5% -$1,846 -10.0%49 Portage Kent $36,972 $36,209 $38,850 $38,147 $37,259 $33,918 $34,961 $35,567 $31,529 $33,125 $1,596 5.1% -$3,847 -10.4%

RETAIL RETAIL RETAIL RETAIL RETAIL RETAIL RETAIL RETAIL RETAIL RETAIL 09-10 09-10 01-10 01-10LARGEST EARN EARN EARN EARN EARN EARN EARN EARN EARN EARN $ INCR % INCR $ INCR % INCR

# COUNTY CITY 3Q 01 3Q 02 3Q 03 3Q 04 3Q 05 3Q 06 3Q 07 3Q 08 3Q 09 3Q 10 EARN EARN EARN EARN50 Crawford Bucyrus $8,316 $8,223 $8,709 $7,893 $7,682 $7,189 $7,837 $7,424 $7,487 $7,417 -$70 -0.9% -$899 -10.8%51 Adams West Union $5,986 $5,739 $6,484 $5,934 $5,707 $5,518 $5,835 $5,235 $5,404 $5,324 -$80 -1.5% -$662 -11.1%52 Champaign Urbana $6,559 $6,394 $6,719 $6,631 $6,186 $6,225 $6,046 $5,850 $5,870 $5,821 -$49 -0.8% -$738 -11.3%53 Perry New Lexington $3,377 $3,316 $3,197 $3,118 $3,241 $3,052 $2,877 $2,780 $2,918 $2,989 $71 2.4% -$388 -11.5%54 Trumbull Warren $66,526 $65,838 $71,445 $65,870 $64,829 $62,723 $64,293 $58,495 $56,323 $58,563 $2,240 4.0% -$7,963 -12.0%55 Defiance Defiance $14,458 $15,244 $16,474 $14,335 $13,622 $13,110 $14,825 $13,297 $12,407 $12,677 $270 2.2% -$1,781 -12.3%56 Hardin Kenton $5,341 $5,219 $5,462 $4,668 $5,301 $5,058 $4,916 $4,653 $4,547 $4,647 $100 2.2% -$694 -13.0%57 Gallia Gallipolis $8,988 $8,408 $8,665 $9,154 $8,318 $7,654 $7,798 $7,667 $7,502 $7,708 $206 2.7% -$1,280 -14.2%58 Allen Lima $40,531 $41,241 $42,485 $45,605 $43,847 $39,973 $38,233 $35,166 $33,829 $34,656 $827 2.4% -$5,875 -14.5%59 Preble Eaton $7,832 $6,871 $7,912 $6,684 $7,381 $6,828 $7,120 $6,466 $6,625 $6,617 -$8 -0.1% -$1,215 -15.5%60 Richland Mansfield $46,223 $45,835 $47,054 $44,802 $44,671 $43,127 $42,344 $39,498 $37,698 $38,986 $1,288 3.4% -$7,237 -15.7%61 Stark Canton $134,310 $129,974 $131,864 $132,012 $127,732 $118,553 $118,664 $110,850 $107,059 $112,483 $5,424 5.1% -$21,827 -16.3%62 Tuscarawas New Phila. $28,591 $27,597 $28,047 $25,872 $25,152 $24,400 $25,240 $23,806 $23,034 $23,649 $615 2.7% -$4,942 -17.3%63 Noble Caldwell $1,559 $1,666 $2,044 $1,469 $1,609 $1,794 $1,839 $1,346 $1,353 $1,281 -$72 -5.3% -$278 -17.8%64 Marion Marion $18,591 $19,781 $18,154 $16,964 $16,374 $15,022 $16,337 $15,537 $14,927 $15,191 $264 1.8% -$3,400 -18.3%65 Wayne Wooster $30,292 $28,630 $30,592 $28,962 $29,028 $27,997 $27,530 $26,090 $23,954 $24,739 $785 3.3% -$5,553 -18.3%66 Fulton Wauseon $10,674 $10,103 $10,909 $9,859 $10,409 $9,459 $9,817 $8,950 $8,745 $8,685 -$60 -0.7% -$1,989 -18.6%67 Belmont Martins Ferry $25,304 $25,490 $24,501 $24,487 $23,234 $21,771 $22,049 $20,476 $20,402 $20,567 $165 0.8% -$4,737 -18.7%68 Miami Piqua $32,988 $33,462 $31,798 $35,395 $35,617 $28,192 $28,615 $26,469 $26,109 $26,480 $371 1.4% -$6,508 -19.7%69 Darke Greenville $12,579 $11,172 $11,957 $11,677 $11,466 $10,960 $10,760 $10,071 $10,221 $10,097 -$124 -1.2% -$2,482 -19.7%70 Lake Mentor $93,283 $88,162 $97,578 $92,226 $97,815 $88,963 $87,810 $84,522 $80,383 $74,785 -$5,598 -7.0% -$18,498 -19.8%71 Summit Akron $231,288 $229,918 $235,351 $239,751 $222,158 $213,300 $211,793 $198,993 $190,602 $181,635 -$8,967 -4.7% -$49,653 -21.5%72 Paulding Paulding $2,679 $2,978 $2,446 $2,852 $2,332 $2,328 $2,201 $2,103 $2,078 $2,097 $19 0.9% -$582 -21.7%73 Morgan McConnelsville $1,604 $1,645 $1,402 $1,540 $1,508 $1,405 $1,261 $1,258 $1,320 $1,253 -$67 -5.1% -$351 -21.9%74 Lucas Toledo $191,365 $181,491 $173,841 $169,772 $163,207 $152,132 $156,440 $148,735 $140,991 $146,594 $5,603 4.0% -$44,771 -23.4%75 Harrison Cadiz $1,659 $1,683 $1,618 $1,437 $1,388 $1,510 $1,456 $1,494 $1,391 $1,238 -$153 -11.0% -$421 -25.4%76 Huron Norwalk $14,603 $13,477 $12,686 $12,949 $13,697 $12,007 $11,416 $10,610 $10,312 $10,813 $501 4.9% -$3,790 -26.0%77 Hamilton Cincinnati $392,144 $388,638 $344,664 $370,322 $351,991 $315,550 $310,165 $288,999 $284,146 $287,146 $3,000 1.1% -$104,998 -26.8%78 Meigs Middleport $3,309 $3,443 $3,058 $2,844 $2,730 $2,806 $2,752 $2,240 $2,352 $2,415 $63 2.7% -$894 -27.0%79 Muskingum Zanesville $36,683 $37,868 $32,170 $36,546 $35,314 $29,116 $28,950 $27,067 $26,043 $26,554 $511 2.0% -$10,129 -27.6%80 Mahoning Youngstown $99,948 $98,147 $91,991 $91,897 $90,657 $83,967 $82,783 $76,867 $72,462 $71,886 -$576 -0.8% -$28,062 -28.1%81 Ottawa Port Clinton $14,165 $12,049 $13,346 $11,536 $11,699 $11,905 $12,010 $10,473 $9,652 $10,046 $394 4.1% -$4,119 -29.1%82 Shelby Sidney $15,646 $15,612 $17,772 $14,881 $14,899 $14,664 $15,993 $11,205 $10,868 $10,944 $76 0.7% -$4,702 -30.1%83 Montgomery Dayton $202,535 $192,783 $173,509 $179,997 $180,677 $161,373 $156,141 $145,945 $140,654 $140,800 $146 0.1% -$61,735 -30.5%84 Cuyahoga Cleveland $553,791 $536,258 $495,414 $510,596 $480,102 $449,339 $445,824 $404,555 $375,994 $384,579 $8,585 2.3% -$169,212 -30.6%85 Clinton Wilmington $13,750 $12,721 $11,212 $10,569 $10,344 $9,609 $10,090 $10,182 $9,697 $9,080 -$617 -6.4% -$4,670 -34.0%86 Franklin Columbus $716,404 $694,860 $574,579 $650,592 $621,921 $578,796 $517,066 $478,838 $457,298 $468,288 $10,990 2.4% -$248,116 -34.6%87 Clark Springfield $51,756 $52,796 $39,588 $38,493 $37,900 $36,481 $35,625 $33,391 $31,678 $31,133 -$545 -1.7% -$20,623 -39.8%88 Licking Newark $68,608 $55,154 $50,265 $52,585 $53,267 $43,321 $45,234 $42,627 $40,811 $40,967 $156 0.4% -$27,641 -40.3%

OHIO 88 COUNTY TOTAL $4,183,321 $4,100,106 $4,038,983 $4,011,041 $3,915,899 $3,685,581 $3,634,692 $3,405,064 $3,273,405 $3,328,750 $55,345 1.7% -$854,571 -20.4%Source: ODJFS QCEW ES-202 Complete Count of Jobs and George ZellerNOTE1: Excludes Additional Earnings Losses in 2000, Since Retail Trade was redefined from SIC to NAICS in 2001

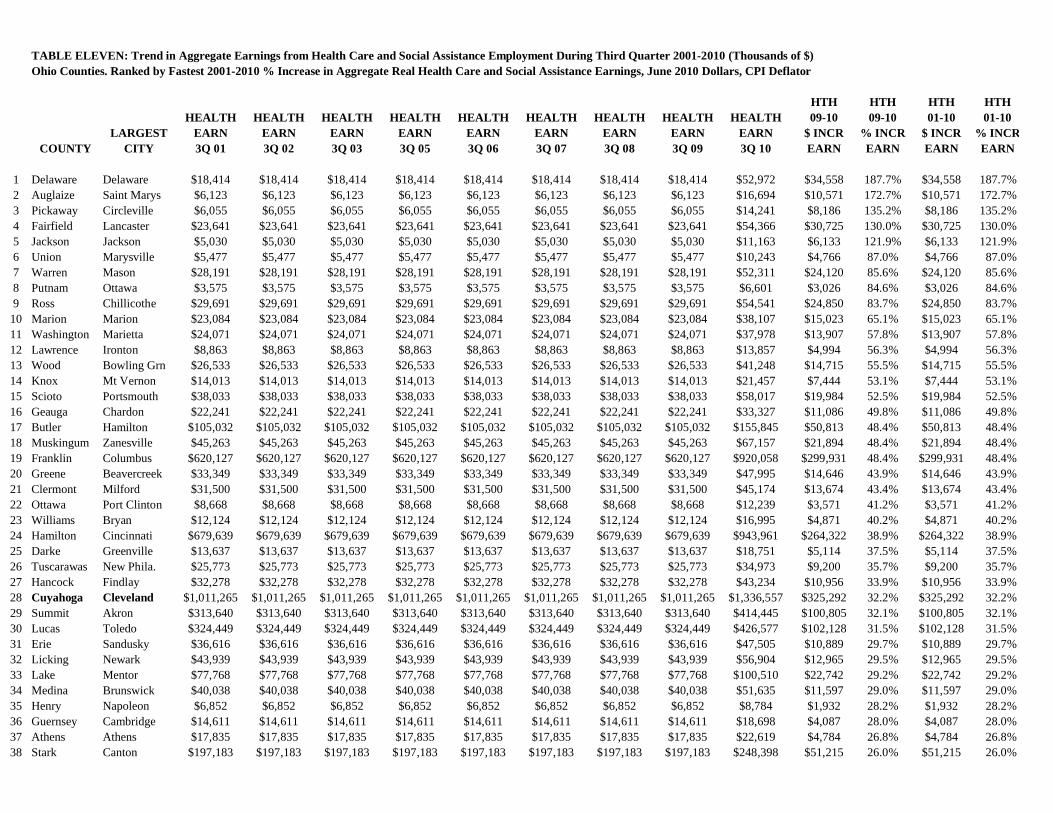
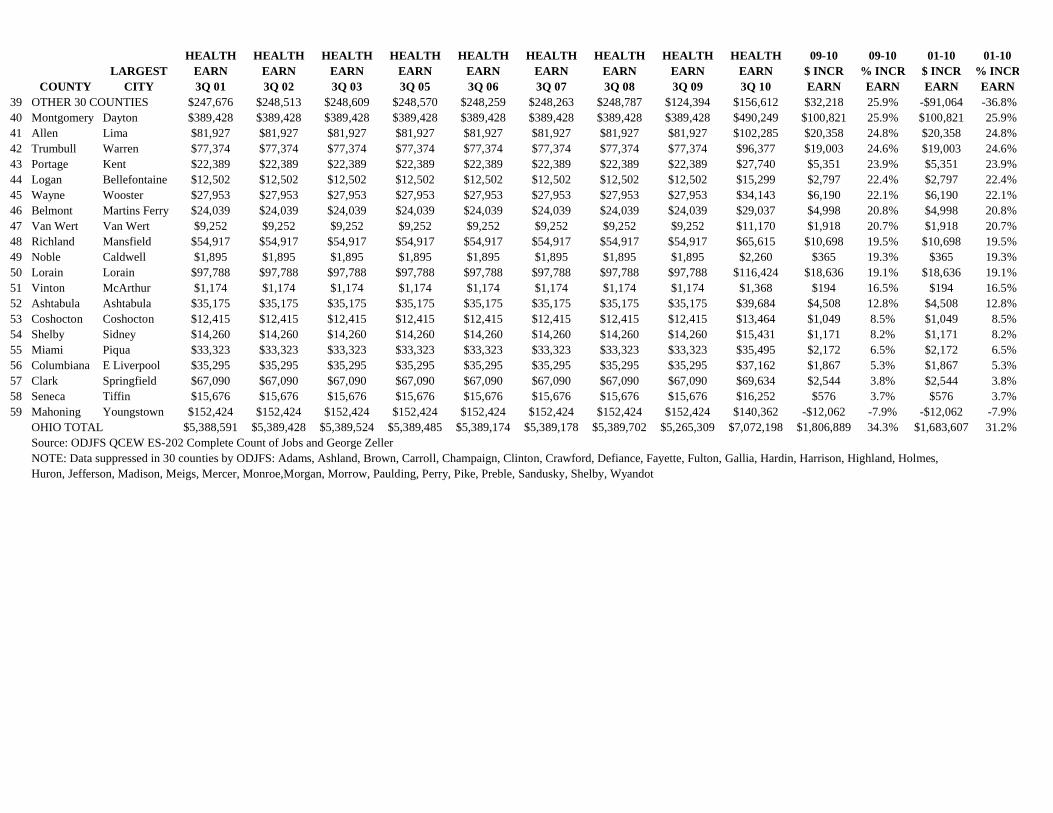
TABLE ELEVEN: Trend in Aggregate Earnings from Health Care and Social Assistance Employment During Third Quarter 2001-2010 (Thousands of $)Ohio Counties. Ranked by Fastest 2001-2010 % Increase in Aggregate Real Health Care and Social Assistance Earnings, June 2010 Dollars, CPI Deflator

HTH HTH HTH HTHHEALTH HEALTH HEALTH HEALTH HEALTH HEALTH HEALTH HEALTH HEALTH 09-10 09-10 01-10 01-10

LARGEST EARN EARN EARN EARN EARN EARN EARN EARN EARN $ INCR % INCR $ INCR % INCRCOUNTY CITY 3Q 01 3Q 02 3Q 03 3Q 05 3Q 06 3Q 07 3Q 08 3Q 09 3Q 10 EARN EARN EARN EARN

1 Delaware Delaware $18,414 $18,414 $18,414 $18,414 $18,414 $18,414 $18,414 $18,414 $52,972 $34,558 187.7% $34,558 187.7%2 Auglaize Saint Marys $6,123 $6,123 $6,123 $6,123 $6,123 $6,123 $6,123 $6,123 $16,694 $10,571 172.7% $10,571 172.7%3 Pickaway Circleville $6,055 $6,055 $6,055 $6,055 $6,055 $6,055 $6,055 $6,055 $14,241 $8,186 135.2% $8,186 135.2%4 Fairfield Lancaster $23,641 $23,641 $23,641 $23,641 $23,641 $23,641 $23,641 $23,641 $54,366 $30,725 130.0% $30,725 130.0%5 Jackson Jackson $5,030 $5,030 $5,030 $5,030 $5,030 $5,030 $5,030 $5,030 $11,163 $6,133 121.9% $6,133 121.9%6 Union Marysville $5,477 $5,477 $5,477 $5,477 $5,477 $5,477 $5,477 $5,477 $10,243 $4,766 87.0% $4,766 87.0%7 Warren Mason $28,191 $28,191 $28,191 $28,191 $28,191 $28,191 $28,191 $28,191 $52,311 $24,120 85.6% $24,120 85.6%8 Putnam Ottawa $3,575 $3,575 $3,575 $3,575 $3,575 $3,575 $3,575 $3,575 $6,601 $3,026 84.6% $3,026 84.6%9 Ross Chillicothe $29,691 $29,691 $29,691 $29,691 $29,691 $29,691 $29,691 $29,691 $54,541 $24,850 83.7% $24,850 83.7%

10 Marion Marion $23,084 $23,084 $23,084 $23,084 $23,084 $23,084 $23,084 $23,084 $38,107 $15,023 65.1% $15,023 65.1%11 Washington Marietta $24,071 $24,071 $24,071 $24,071 $24,071 $24,071 $24,071 $24,071 $37,978 $13,907 57.8% $13,907 57.8%12 Lawrence Ironton $8,863 $8,863 $8,863 $8,863 $8,863 $8,863 $8,863 $8,863 $13,857 $4,994 56.3% $4,994 56.3%13 Wood Bowling Grn $26,533 $26,533 $26,533 $26,533 $26,533 $26,533 $26,533 $26,533 $41,248 $14,715 55.5% $14,715 55.5%14 Knox Mt Vernon $14,013 $14,013 $14,013 $14,013 $14,013 $14,013 $14,013 $14,013 $21,457 $7,444 53.1% $7,444 53.1%15 Scioto Portsmouth $38,033 $38,033 $38,033 $38,033 $38,033 $38,033 $38,033 $38,033 $58,017 $19,984 52.5% $19,984 52.5%16 Geauga Chardon $22,241 $22,241 $22,241 $22,241 $22,241 $22,241 $22,241 $22,241 $33,327 $11,086 49.8% $11,086 49.8%17 Butler Hamilton $105,032 $105,032 $105,032 $105,032 $105,032 $105,032 $105,032 $105,032 $155,845 $50,813 48.4% $50,813 48.4%18 Muskingum Zanesville $45,263 $45,263 $45,263 $45,263 $45,263 $45,263 $45,263 $45,263 $67,157 $21,894 48.4% $21,894 48.4%19 Franklin Columbus $620,127 $620,127 $620,127 $620,127 $620,127 $620,127 $620,127 $620,127 $920,058 $299,931 48.4% $299,931 48.4%20 Greene Beavercreek $33,349 $33,349 $33,349 $33,349 $33,349 $33,349 $33,349 $33,349 $47,995 $14,646 43.9% $14,646 43.9%21 Clermont Milford $31,500 $31,500 $31,500 $31,500 $31,500 $31,500 $31,500 $31,500 $45,174 $13,674 43.4% $13,674 43.4%22 Ottawa Port Clinton $8,668 $8,668 $8,668 $8,668 $8,668 $8,668 $8,668 $8,668 $12,239 $3,571 41.2% $3,571 41.2%23 Williams Bryan $12,124 $12,124 $12,124 $12,124 $12,124 $12,124 $12,124 $12,124 $16,995 $4,871 40.2% $4,871 40.2%24 Hamilton Cincinnati $679,639 $679,639 $679,639 $679,639 $679,639 $679,639 $679,639 $679,639 $943,961 $264,322 38.9% $264,322 38.9%25 Darke Greenville $13,637 $13,637 $13,637 $13,637 $13,637 $13,637 $13,637 $13,637 $18,751 $5,114 37.5% $5,114 37.5%26 Tuscarawas New Phila. $25,773 $25,773 $25,773 $25,773 $25,773 $25,773 $25,773 $25,773 $34,973 $9,200 35.7% $9,200 35.7%27 Hancock Findlay $32,278 $32,278 $32,278 $32,278 $32,278 $32,278 $32,278 $32,278 $43,234 $10,956 33.9% $10,956 33.9%28 Cuyahoga Cleveland $1,011,265 $1,011,265 $1,011,265 $1,011,265 $1,011,265 $1,011,265 $1,011,265 $1,011,265 $1,336,557 $325,292 32.2% $325,292 32.2%29 Summit Akron $313,640 $313,640 $313,640 $313,640 $313,640 $313,640 $313,640 $313,640 $414,445 $100,805 32.1% $100,805 32.1%30 Lucas Toledo $324,449 $324,449 $324,449 $324,449 $324,449 $324,449 $324,449 $324,449 $426,577 $102,128 31.5% $102,128 31.5%31 Erie Sandusky $36,616 $36,616 $36,616 $36,616 $36,616 $36,616 $36,616 $36,616 $47,505 $10,889 29.7% $10,889 29.7%32 Licking Newark $43,939 $43,939 $43,939 $43,939 $43,939 $43,939 $43,939 $43,939 $56,904 $12,965 29.5% $12,965 29.5%33 Lake Mentor $77,768 $77,768 $77,768 $77,768 $77,768 $77,768 $77,768 $77,768 $100,510 $22,742 29.2% $22,742 29.2%34 Medina Brunswick $40,038 $40,038 $40,038 $40,038 $40,038 $40,038 $40,038 $40,038 $51,635 $11,597 29.0% $11,597 29.0%35 Henry Napoleon $6,852 $6,852 $6,852 $6,852 $6,852 $6,852 $6,852 $6,852 $8,784 $1,932 28.2% $1,932 28.2%36 Guernsey Cambridge $14,611 $14,611 $14,611 $14,611 $14,611 $14,611 $14,611 $14,611 $18,698 $4,087 28.0% $4,087 28.0%37 Athens Athens $17,835 $17,835 $17,835 $17,835 $17,835 $17,835 $17,835 $17,835 $22,619 $4,784 26.8% $4,784 26.8%38 Stark Canton $197,183 $197,183 $197,183 $197,183 $197,183 $197,183 $197,183 $197,183 $248,398 $51,215 26.0% $51,215 26.0%

HEALTH HEALTH HEALTH HEALTH HEALTH HEALTH HEALTH HEALTH HEALTH 09-10 09-10 01-10 01-10LARGEST EARN EARN EARN EARN EARN EARN EARN EARN EARN $ INCR % INCR $ INCR % INCR

COUNTY CITY 3Q 01 3Q 02 3Q 03 3Q 05 3Q 06 3Q 07 3Q 08 3Q 09 3Q 10 EARN EARN EARN EARN39 OTHER 30 COUNTIES $247,676 $248,513 $248,609 $248,570 $248,259 $248,263 $248,787 $124,394 $156,612 $32,218 25.9% -$91,064 -36.8%40 Montgomery Dayton $389,428 $389,428 $389,428 $389,428 $389,428 $389,428 $389,428 $389,428 $490,249 $100,821 25.9% $100,821 25.9%41 Allen Lima $81,927 $81,927 $81,927 $81,927 $81,927 $81,927 $81,927 $81,927 $102,285 $20,358 24.8% $20,358 24.8%42 Trumbull Warren $77,374 $77,374 $77,374 $77,374 $77,374 $77,374 $77,374 $77,374 $96,377 $19,003 24.6% $19,003 24.6%43 Portage Kent $22,389 $22,389 $22,389 $22,389 $22,389 $22,389 $22,389 $22,389 $27,740 $5,351 23.9% $5,351 23.9%44 Logan Bellefontaine $12,502 $12,502 $12,502 $12,502 $12,502 $12,502 $12,502 $12,502 $15,299 $2,797 22.4% $2,797 22.4%45 Wayne Wooster $27,953 $27,953 $27,953 $27,953 $27,953 $27,953 $27,953 $27,953 $34,143 $6,190 22.1% $6,190 22.1%46 Belmont Martins Ferry $24,039 $24,039 $24,039 $24,039 $24,039 $24,039 $24,039 $24,039 $29,037 $4,998 20.8% $4,998 20.8%47 Van Wert Van Wert $9,252 $9,252 $9,252 $9,252 $9,252 $9,252 $9,252 $9,252 $11,170 $1,918 20.7% $1,918 20.7%48 Richland Mansfield $54,917 $54,917 $54,917 $54,917 $54,917 $54,917 $54,917 $54,917 $65,615 $10,698 19.5% $10,698 19.5%49 Noble Caldwell $1,895 $1,895 $1,895 $1,895 $1,895 $1,895 $1,895 $1,895 $2,260 $365 19.3% $365 19.3%50 Lorain Lorain $97,788 $97,788 $97,788 $97,788 $97,788 $97,788 $97,788 $97,788 $116,424 $18,636 19.1% $18,636 19.1%51 Vinton McArthur $1,174 $1,174 $1,174 $1,174 $1,174 $1,174 $1,174 $1,174 $1,368 $194 16.5% $194 16.5%52 Ashtabula Ashtabula $35,175 $35,175 $35,175 $35,175 $35,175 $35,175 $35,175 $35,175 $39,684 $4,508 12.8% $4,508 12.8%53 Coshocton Coshocton $12,415 $12,415 $12,415 $12,415 $12,415 $12,415 $12,415 $12,415 $13,464 $1,049 8.5% $1,049 8.5%54 Shelby Sidney $14,260 $14,260 $14,260 $14,260 $14,260 $14,260 $14,260 $14,260 $15,431 $1,171 8.2% $1,171 8.2%55 Miami Piqua $33,323 $33,323 $33,323 $33,323 $33,323 $33,323 $33,323 $33,323 $35,495 $2,172 6.5% $2,172 6.5%56 Columbiana E Liverpool $35,295 $35,295 $35,295 $35,295 $35,295 $35,295 $35,295 $35,295 $37,162 $1,867 5.3% $1,867 5.3%57 Clark Springfield $67,090 $67,090 $67,090 $67,090 $67,090 $67,090 $67,090 $67,090 $69,634 $2,544 3.8% $2,544 3.8%58 Seneca Tiffin $15,676 $15,676 $15,676 $15,676 $15,676 $15,676 $15,676 $15,676 $16,252 $576 3.7% $576 3.7%59 Mahoning Youngstown $152,424 $152,424 $152,424 $152,424 $152,424 $152,424 $152,424 $152,424 $140,362 -$12,062 -7.9% -$12,062 -7.9%

OHIO TOTAL $5,388,591 $5,389,428 $5,389,524 $5,389,485 $5,389,174 $5,389,178 $5,389,702 $5,265,309 $7,072,198 $1,806,889 34.3% $1,683,607 31.2%Source: ODJFS QCEW ES-202 Complete Count of Jobs and George ZellerNOTE: Data suppressed in 30 counties by ODJFS: Adams, Ashland, Brown, Carroll, Champaign, Clinton, Crawford, Defiance, Fayette, Fulton, Gallia, Hardin, Harrison, Highland, Holmes,Huron, Jefferson, Madison, Meigs, Mercer, Monroe,Morgan, Morrow, Paulding, Perry, Pike, Preble, Sandusky, Shelby, Wyandot

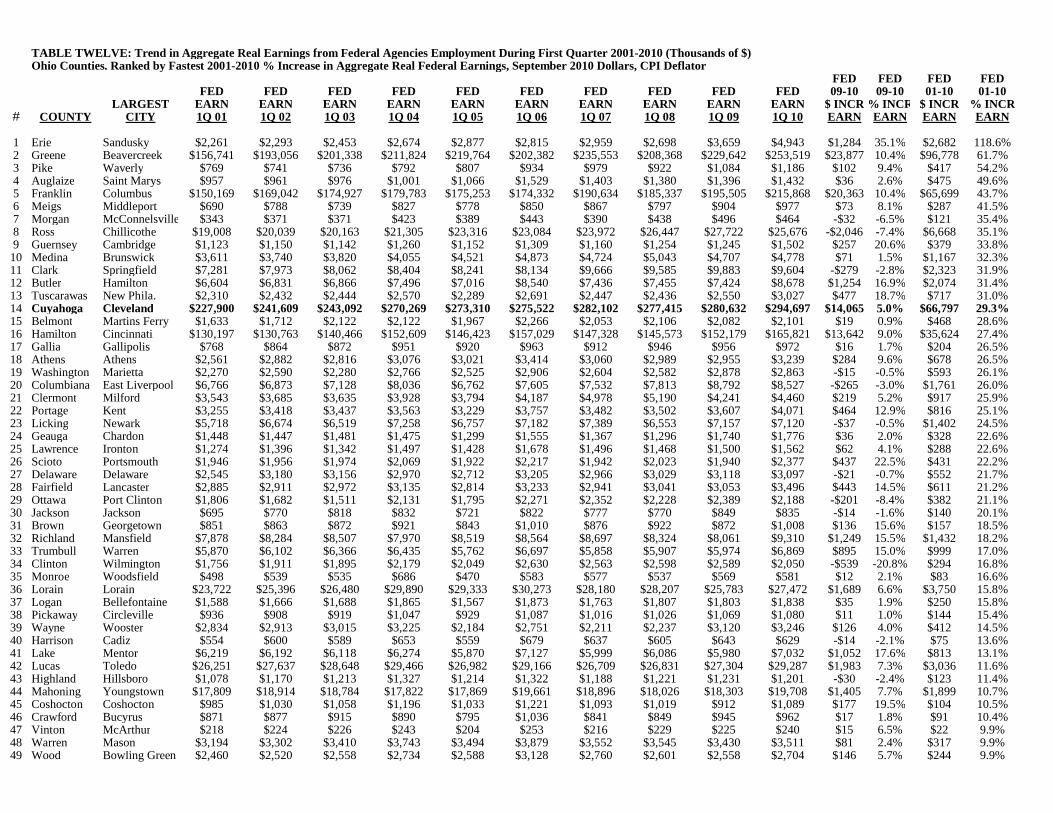
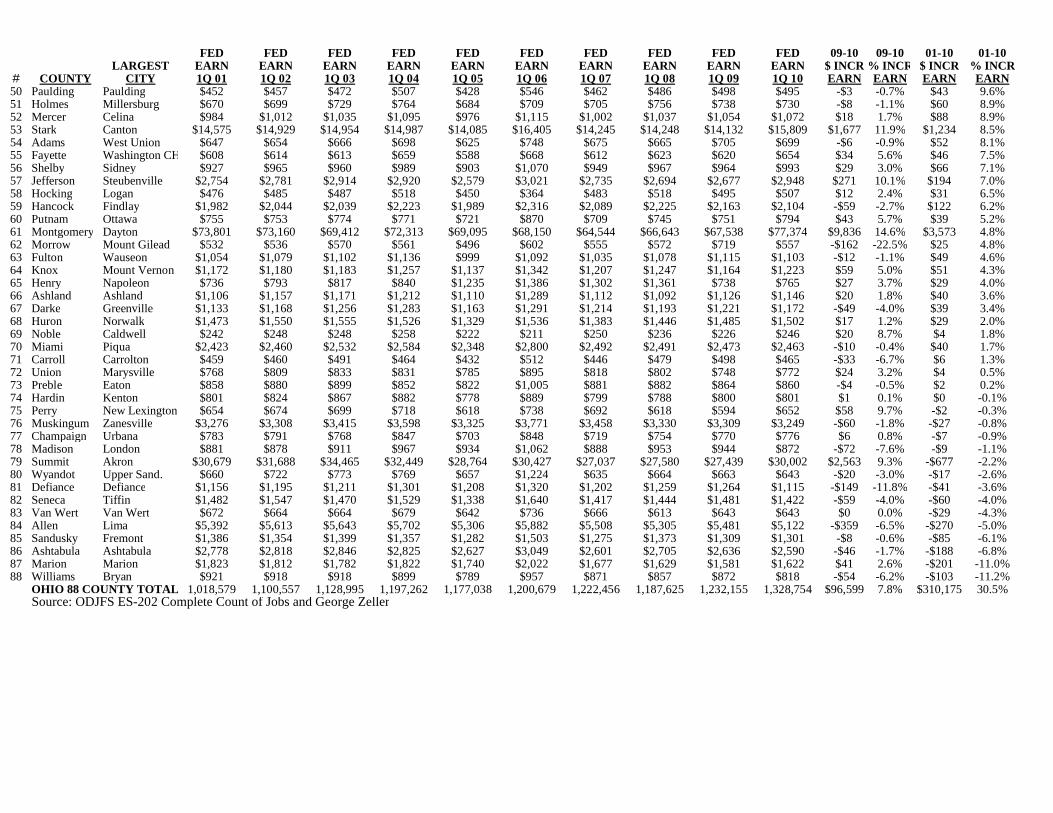
TABLE TWELVE: Trend in Aggregate Real Earnings from Federal Agencies Employment During First Quarter 2001-2010 (Thousands of $)Ohio Counties. Ranked by Fastest 2001-2010 % Increase in Aggregate Real Federal Earnings, September 2010 Dollars, CPI Deflator

FED FED FED FEDFED FED FED FED FED FED FED FED FED FED 09-10 09-10 01-10 01-10

LARGEST EARN EARN EARN EARN EARN EARN EARN EARN EARN EARN $ INCR % INCR $ INCR % INCR# COUNTY CITY 1Q 01 1Q 02 1Q 03 1Q 04 1Q 05 1Q 06 1Q 07 1Q 08 1Q 09 1Q 10 EARN EARN EARN EARN

1 Erie Sandusky $2,261 $2,293 $2,453 $2,674 $2,877 $2,815 $2,959 $2,698 $3,659 $4,943 $1,284 35.1% $2,682 118.6%2 Greene Beavercreek $156,741 $193,056 $201,338 $211,824 $219,764 $202,382 $235,553 $208,368 $229,642 $253,519 $23,877 10.4% $96,778 61.7%3 Pike Waverly $769 $741 $736 $792 $807 $934 $979 $922 $1,084 $1,186 $102 9.4% $417 54.2%4 Auglaize Saint Marys $957 $961 $976 $1,001 $1,066 $1,529 $1,403 $1,380 $1,396 $1,432 $36 2.6% $475 49.6%5 Franklin Columbus $150,169 $169,042 $174,927 $179,783 $175,253 $174,332 $190,634 $185,337 $195,505 $215,868 $20,363 10.4% $65,699 43.7%6 Meigs Middleport $690 $788 $739 $827 $778 $850 $867 $797 $904 $977 $73 8.1% $287 41.5%7 Morgan McConnelsville $343 $371 $371 $423 $389 $443 $390 $438 $496 $464 -$32 -6.5% $121 35.4%8 Ross Chillicothe $19,008 $20,039 $20,163 $21,305 $23,316 $23,084 $23,972 $26,447 $27,722 $25,676 -$2,046 -7.4% $6,668 35.1%9 Guernsey Cambridge $1,123 $1,150 $1,142 $1,260 $1,152 $1,309 $1,160 $1,254 $1,245 $1,502 $257 20.6% $379 33.8%

10 Medina Brunswick $3,611 $3,740 $3,820 $4,055 $4,521 $4,873 $4,724 $5,043 $4,707 $4,778 $71 1.5% $1,167 32.3%11 Clark Springfield $7,281 $7,973 $8,062 $8,404 $8,241 $8,134 $9,666 $9,585 $9,883 $9,604 -$279 -2.8% $2,323 31.9%12 Butler Hamilton $6,604 $6,831 $6,866 $7,496 $7,016 $8,540 $7,436 $7,455 $7,424 $8,678 $1,254 16.9% $2,074 31.4%13 Tuscarawas New Phila. $2,310 $2,432 $2,444 $2,570 $2,289 $2,691 $2,447 $2,436 $2,550 $3,027 $477 18.7% $717 31.0%14 Cuyahoga Cleveland $227,900 $241,609 $243,092 $270,269 $273,310 $275,522 $282,102 $277,415 $280,632 $294,697 $14,065 5.0% $66,797 29.3%15 Belmont Martins Ferry $1,633 $1,712 $2,122 $2,122 $1,967 $2,266 $2,053 $2,106 $2,082 $2,101 $19 0.9% $468 28.6%16 Hamilton Cincinnati $130,197 $130,763 $140,466 $152,609 $146,423 $157,029 $147,328 $145,573 $152,179 $165,821 $13,642 9.0% $35,624 27.4%17 Gallia Gallipolis $768 $864 $872 $951 $920 $963 $912 $946 $956 $972 $16 1.7% $204 26.5%18 Athens Athens $2,561 $2,882 $2,816 $3,076 $3,021 $3,414 $3,060 $2,989 $2,955 $3,239 $284 9.6% $678 26.5%19 Washington Marietta $2,270 $2,590 $2,280 $2,766 $2,525 $2,906 $2,604 $2,582 $2,878 $2,863 -$15 -0.5% $593 26.1%20 Columbiana East Liverpool $6,766 $6,873 $7,128 $8,036 $6,762 $7,605 $7,532 $7,813 $8,792 $8,527 -$265 -3.0% $1,761 26.0%21 Clermont Milford $3,543 $3,685 $3,635 $3,928 $3,794 $4,187 $4,978 $5,190 $4,241 $4,460 $219 5.2% $917 25.9%22 Portage Kent $3,255 $3,418 $3,437 $3,563 $3,229 $3,757 $3,482 $3,502 $3,607 $4,071 $464 12.9% $816 25.1%23 Licking Newark $5,718 $6,674 $6,519 $7,258 $6,757 $7,182 $7,389 $6,553 $7,157 $7,120 -$37 -0.5% $1,402 24.5%24 Geauga Chardon $1,448 $1,447 $1,481 $1,475 $1,299 $1,555 $1,367 $1,296 $1,740 $1,776 $36 2.0% $328 22.6%25 Lawrence Ironton $1,274 $1,396 $1,342 $1,497 $1,428 $1,678 $1,496 $1,468 $1,500 $1,562 $62 4.1% $288 22.6%26 Scioto Portsmouth $1,946 $1,956 $1,974 $2,069 $1,922 $2,217 $1,942 $2,023 $1,940 $2,377 $437 22.5% $431 22.2%27 Delaware Delaware $2,545 $3,180 $3,156 $2,970 $2,712 $3,205 $2,966 $3,029 $3,118 $3,097 -$21 -0.7% $552 21.7%28 Fairfield Lancaster $2,885 $2,911 $2,972 $3,135 $2,814 $3,233 $2,941 $3,041 $3,053 $3,496 $443 14.5% $611 21.2%29 Ottawa Port Clinton $1,806 $1,682 $1,511 $2,131 $1,795 $2,271 $2,352 $2,228 $2,389 $2,188 -$201 -8.4% $382 21.1%30 Jackson Jackson $695 $770 $818 $832 $721 $822 $777 $770 $849 $835 -$14 -1.6% $140 20.1%31 Brown Georgetown $851 $863 $872 $921 $843 $1,010 $876 $922 $872 $1,008 $136 15.6% $157 18.5%32 Richland Mansfield $7,878 $8,284 $8,507 $7,970 $8,519 $8,564 $8,697 $8,324 $8,061 $9,310 $1,249 15.5% $1,432 18.2%33 Trumbull Warren $5,870 $6,102 $6,366 $6,435 $5,762 $6,697 $5,858 $5,907 $5,974 $6,869 $895 15.0% $999 17.0%34 Clinton Wilmington $1,756 $1,911 $1,895 $2,179 $2,049 $2,630 $2,563 $2,598 $2,589 $2,050 -$539 -20.8% $294 16.8%35 Monroe Woodsfield $498 $539 $535 $686 $470 $583 $577 $537 $569 $581 $12 2.1% $83 16.6%36 Lorain Lorain $23,722 $25,396 $26,480 $29,890 $29,333 $30,273 $28,180 $28,207 $25,783 $27,472 $1,689 6.6% $3,750 15.8%37 Logan Bellefontaine $1,588 $1,666 $1,688 $1,865 $1,567 $1,873 $1,763 $1,807 $1,803 $1,838 $35 1.9% $250 15.8%38 Pickaway Circleville $936 $908 $919 $1,047 $929 $1,087 $1,016 $1,026 $1,069 $1,080 $11 1.0% $144 15.4%39 Wayne Wooster $2,834 $2,913 $3,015 $3,225 $2,184 $2,751 $2,211 $2,237 $3,120 $3,246 $126 4.0% $412 14.5%40 Harrison Cadiz $554 $600 $589 $653 $559 $679 $637 $605 $643 $629 -$14 -2.1% $75 13.6%41 Lake Mentor $6,219 $6,192 $6,118 $6,274 $5,870 $7,127 $5,999 $6,086 $5,980 $7,032 $1,052 17.6% $813 13.1%42 Lucas Toledo $26,251 $27,637 $28,648 $29,466 $26,982 $29,166 $26,709 $26,831 $27,304 $29,287 $1,983 7.3% $3,036 11.6%43 Highland Hillsboro $1,078 $1,170 $1,213 $1,327 $1,214 $1,322 $1,188 $1,221 $1,231 $1,201 -$30 -2.4% $123 11.4%44 Mahoning Youngstown $17,809 $18,914 $18,784 $17,822 $17,869 $19,661 $18,896 $18,026 $18,303 $19,708 $1,405 7.7% $1,899 10.7%45 Coshocton Coshocton $985 $1,030 $1,058 $1,196 $1,033 $1,221 $1,093 $1,019 $912 $1,089 $177 19.5% $104 10.5%46 Crawford Bucyrus $871 $877 $915 $890 $795 $1,036 $841 $849 $945 $962 $17 1.8% $91 10.4%47 Vinton McArthur $218 $224 $226 $243 $204 $253 $216 $229 $225 $240 $15 6.5% $22 9.9%48 Warren Mason $3,194 $3,302 $3,410 $3,743 $3,494 $3,879 $3,552 $3,545 $3,430 $3,511 $81 2.4% $317 9.9%49 Wood Bowling Green $2,460 $2,520 $2,558 $2,734 $2,588 $3,128 $2,760 $2,601 $2,558 $2,704 $146 5.7% $244 9.9%

FED FED FED FED FED FED FED FED FED FED 09-10 09-10 01-10 01-10LARGEST EARN EARN EARN EARN EARN EARN EARN EARN EARN EARN $ INCR % INCR $ INCR % INCR

# COUNTY CITY 1Q 01 1Q 02 1Q 03 1Q 04 1Q 05 1Q 06 1Q 07 1Q 08 1Q 09 1Q 10 EARN EARN EARN EARN50 Paulding Paulding $452 $457 $472 $507 $428 $546 $462 $486 $498 $495 -$3 -0.7% $43 9.6%51 Holmes Millersburg $670 $699 $729 $764 $684 $709 $705 $756 $738 $730 -$8 -1.1% $60 8.9%52 Mercer Celina $984 $1,012 $1,035 $1,095 $976 $1,115 $1,002 $1,037 $1,054 $1,072 $18 1.7% $88 8.9%53 Stark Canton $14,575 $14,929 $14,954 $14,987 $14,085 $16,405 $14,245 $14,248 $14,132 $15,809 $1,677 11.9% $1,234 8.5%54 Adams West Union $647 $654 $666 $698 $625 $748 $675 $665 $705 $699 -$6 -0.9% $52 8.1%55 Fayette Washington CH $608 $614 $613 $659 $588 $668 $612 $623 $620 $654 $34 5.6% $46 7.5%56 Shelby Sidney $927 $965 $960 $989 $903 $1,070 $949 $967 $964 $993 $29 3.0% $66 7.1%57 Jefferson Steubenville $2,754 $2,781 $2,914 $2,920 $2,579 $3,021 $2,735 $2,694 $2,677 $2,948 $271 10.1% $194 7.0%58 Hocking Logan $476 $485 $487 $518 $450 $364 $483 $518 $495 $507 $12 2.4% $31 6.5%59 Hancock Findlay $1,982 $2,044 $2,039 $2,223 $1,989 $2,316 $2,089 $2,225 $2,163 $2,104 -$59 -2.7% $122 6.2%60 Putnam Ottawa $755 $753 $774 $771 $721 $870 $709 $745 $751 $794 $43 5.7% $39 5.2%61 Montgomery Dayton $73,801 $73,160 $69,412 $72,313 $69,095 $68,150 $64,544 $66,643 $67,538 $77,374 $9,836 14.6% $3,573 4.8%62 Morrow Mount Gilead $532 $536 $570 $561 $496 $602 $555 $572 $719 $557 -$162 -22.5% $25 4.8%63 Fulton Wauseon $1,054 $1,079 $1,102 $1,136 $999 $1,092 $1,035 $1,078 $1,115 $1,103 -$12 -1.1% $49 4.6%64 Knox Mount Vernon $1,172 $1,180 $1,183 $1,257 $1,137 $1,342 $1,207 $1,247 $1,164 $1,223 $59 5.0% $51 4.3%65 Henry Napoleon $736 $793 $817 $840 $1,235 $1,386 $1,302 $1,361 $738 $765 $27 3.7% $29 4.0%66 Ashland Ashland $1,106 $1,157 $1,171 $1,212 $1,110 $1,289 $1,112 $1,092 $1,126 $1,146 $20 1.8% $40 3.6%67 Darke Greenville $1,133 $1,168 $1,256 $1,283 $1,163 $1,291 $1,214 $1,193 $1,221 $1,172 -$49 -4.0% $39 3.4%68 Huron Norwalk $1,473 $1,550 $1,555 $1,526 $1,329 $1,536 $1,383 $1,446 $1,485 $1,502 $17 1.2% $29 2.0%69 Noble Caldwell $242 $248 $248 $258 $222 $211 $250 $236 $226 $246 $20 8.7% $4 1.8%70 Miami Piqua $2,423 $2,460 $2,532 $2,584 $2,348 $2,800 $2,492 $2,491 $2,473 $2,463 -$10 -0.4% $40 1.7%71 Carroll Carrolton $459 $460 $491 $464 $432 $512 $446 $479 $498 $465 -$33 -6.7% $6 1.3%72 Union Marysville $768 $809 $833 $831 $785 $895 $818 $802 $748 $772 $24 3.2% $4 0.5%73 Preble Eaton $858 $880 $899 $852 $822 $1,005 $881 $882 $864 $860 -$4 -0.5% $2 0.2%74 Hardin Kenton $801 $824 $867 $882 $778 $889 $799 $788 $800 $801 $1 0.1% $0 -0.1%75 Perry New Lexington $654 $674 $699 $718 $618 $738 $692 $618 $594 $652 $58 9.7% -$2 -0.3%76 Muskingum Zanesville $3,276 $3,308 $3,415 $3,598 $3,325 $3,771 $3,458 $3,330 $3,309 $3,249 -$60 -1.8% -$27 -0.8%77 Champaign Urbana $783 $791 $768 $847 $703 $848 $719 $754 $770 $776 $6 0.8% -$7 -0.9%78 Madison London $881 $878 $911 $967 $934 $1,062 $888 $953 $944 $872 -$72 -7.6% -$9 -1.1%79 Summit Akron $30,679 $31,688 $34,465 $32,449 $28,764 $30,427 $27,037 $27,580 $27,439 $30,002 $2,563 9.3% -$677 -2.2%80 Wyandot Upper Sand. $660 $722 $773 $769 $657 $1,224 $635 $664 $663 $643 -$20 -3.0% -$17 -2.6%81 Defiance Defiance $1,156 $1,195 $1,211 $1,301 $1,208 $1,320 $1,202 $1,259 $1,264 $1,115 -$149 -11.8% -$41 -3.6%82 Seneca Tiffin $1,482 $1,547 $1,470 $1,529 $1,338 $1,640 $1,417 $1,444 $1,481 $1,422 -$59 -4.0% -$60 -4.0%83 Van Wert Van Wert $672 $664 $664 $679 $642 $736 $666 $613 $643 $643 $0 0.0% -$29 -4.3%84 Allen Lima $5,392 $5,613 $5,643 $5,702 $5,306 $5,882 $5,508 $5,305 $5,481 $5,122 -$359 -6.5% -$270 -5.0%85 Sandusky Fremont $1,386 $1,354 $1,399 $1,357 $1,282 $1,503 $1,275 $1,373 $1,309 $1,301 -$8 -0.6% -$85 -6.1%86 Ashtabula Ashtabula $2,778 $2,818 $2,846 $2,825 $2,627 $3,049 $2,601 $2,705 $2,636 $2,590 -$46 -1.7% -$188 -6.8%87 Marion Marion $1,823 $1,812 $1,782 $1,822 $1,740 $2,022 $1,677 $1,629 $1,581 $1,622 $41 2.6% -$201 -11.0%88 Williams Bryan $921 $918 $918 $899 $789 $957 $871 $857 $872 $818 -$54 -6.2% -$103 -11.2%

OHIO 88 COUNTY TOTAL 1,018,579 1,100,557 1,128,995 1,197,262 1,177,038 1,200,679 1,222,456 1,187,625 1,232,155 1,328,754 $96,599 7.8% $310,175 30.5%Source: ODJFS ES-202 Complete Count of Jobs and George Zeller

TABLE THIRTEEN: Trend in Aggregate Real Earnings from Total Employment During Third Quarter 2000-2010 (Thousands of $)-AnnualizedOhio Counties. Ranked by Fastest 2000-2010 $ Increase in Annualized Aggregate Real Earnings, September 2010 Dollars, CPI Deflator

ANNUALIZED TOTAL00-10 00-10

LARGEST $ INCR % INCR# COUNTY CITY EARN EARN

1 Cuyahoga Cleveland -$5,169,777 -14.5%2 Montgomery Dayton -$3,024,913 -24.2%3 Hamilton Cincinnati -$1,842,658 -7.3%4 Lucas Toledo -$1,448,993 -15.7%5 Trumbull Warren -$1,272,428 -33.8%6 Stark Canton -$923,890 -15.1%7 Lorain Lorain -$736,571 -18.2%8 Richland Mansfield -$507,690 -23.6%9 Franklin Columbus -$478,348 -1.6%

10 Mahoning Youngstown -$477,016 -13.3%11 Summit Akron -$430,355 -4.1%12 Clark Springfield -$428,549 -21.4%13 Lake Mentor -$414,498 -10.7%14 Erie Sandusky -$339,045 -21.5%15 Clinton Wilmington -$325,350 -34.7%16 Miami Piqua -$296,450 -18.6%17 Muskingum Zanesville -$287,561 -21.8%18 Wayne Wooster -$233,624 -13.9%19 Huron Norwalk -$221,173 -23.2%20 Allen Lima -$215,277 -10.7%21 Defiance Defiance -$194,646 -26.2%22 Columbiana East Liverpool -$184,933 -17.8%23 Ashtabula Ashtabula -$180,795 -16.2%24 Crawford Bucyrus -$180,471 -31.3%25 Williams Bryan -$146,600 -21.9%26 Pickaway Circleville -$140,112 -21.7%27 Fulton Wauseon -$133,658 -18.2%28 Shelby Sidney -$128,531 -11.2%29 Seneca Tiffin -$127,862 -17.7%30 Marion Marion -$120,910 -12.3%31 Licking Newark -$120,012 -6.4%32 Auglaize Saint Marys -$111,390 -15.3%33 Tuscarawas New Philadelphia -$109,731 -9.7%34 Ashland Ashland -$93,635 -14.2%35 Preble Eaton -$84,568 -20.7%36 Coshocton Coshocton -$81,545 -17.7%37 Logan Bellefontaine -$77,089 -10.2%38 Champaign Urbana -$70,335 -17.9%39 Jefferson Steubenville -$65,796 -7.9%40 Darke Greenville -$65,753 -10.9%41 Meigs Middleport -$62,262 -38.2%42 Van Wert Van Wert -$60,755 -15.5%43 Morgan McConnelsville -$59,911 -46.4%44 Putnam Ottawa -$56,070 -14.8%45 Wyandot Upper Sandusky -$55,913 -17.6%46 Portage Kent -$53,692 -2.8%47 Ottawa Port Clinton -$48,079 -8.7%48 Pike Waverly -$47,214 -11.0%49 Monroe Woodsfield -$44,287 -27.5%

50 Carroll Carrolton -$40,199 -20.3%51 Clermont Milford -$38,687 -2.0%52 Ross Chillicothe -$34,131 -3.7%53 Hardin Kenton -$32,472 -11.2%54 Highland Hillsboro -$32,187 -9.5%55 Morrow Mount Gilead -$31,553 -17.7%56 Paulding Paulding -$27,325 -17.2%57 Hancock Findlay -$24,980 -1.6%58 Geauga Chardon -$23,721 -2.0%59 Noble Caldwell -$20,900 -19.1%60 Perry New Lexington -$19,813 -9.3%61 Adams West Union -$15,416 -8.1%62 Gallia Gallipolis -$10,104 -2.4%63 Sandusky Fremont -$9,758 -1.1%64 Henry Napoleon -$7,317 -1.8%65 Hocking Logan -$5,643 -2.7%66 Fayette Washington C.H. -$5,221 -1.6%67 Madison London -$2,110 -0.4%68 Vinton McArthur $1,672 2.6%69 Harrison Cadiz $2,208 2.3%70 Jackson Jackson $3,917 1.2%71 Lawrence Ironton $15,221 4.5%72 Guernsey Cambridge $18,259 4.3%73 Holmes Millersburg $24,897 5.3%74 Wood Bowling Green $27,549 1.3%75 Scioto Portsmouth $31,803 4.4%76 Medina Brunswick $34,452 1.8%77 Washington Marietta $41,823 5.2%78 Brown Georgetown $44,119 19.8%79 Belmont Martins Ferry $57,569 8.7%80 Knox Mount Vernon $78,781 12.8%81 Mercer Celina $78,890 16.8%82 Athens Athens $101,089 16.8%83 Union Marysville $125,154 10.5%84 Fairfield Lancaster $157,570 14.3%85 Greene Beavercreek $457,433 26.9%86 Butler Hamilton $727,536 15.0%87 Warren Mason $815,113 38.1%88 Delaware Delaware $1,795,222 121.7%

OHIO 88 COUNTY TOTAL -$17,721,982 -8.4%Source: ODJFS QCEW ES-202 Complete Count of Jobs and George Zeller

TABLE FOURTEEN: Trend in Real Mean Earnings of an Ohio Job During Third Quarter 2000-2010 (Thousands of $)Ohio Counties. Ranked by Fastest 2000-2010 % Increase in Real Mean Earnings of an Ohio Job, September 2010 Dollars, CPI Deflator

TOTAL TOTAL TOTAL TOTAL TOTAL TOTAL TOTAL TOTAL TOTAL TOTAL TOTAL TOTAL TOTAL TOTAL TOTALMEAN MEAN MEAN MEAN MEAN MEAN MEAN MEAN MEAN MEAN MEAN 09-10 09-10 00-10 00-10

LARGEST EARN EARN EARN EARN EARN EARN EARN EARN EARN EARN EARN $ INCR % INCR $ INCR % INCR# COUNTY CITY 3Q 00 3Q 01 3Q 02 3Q 03 3Q 04 3Q 05 3Q 06 3Q 07 3Q 08 3Q 09 3Q 10 MEAN MEAN MEAN MEAN

1 Greene Beavercreek $34,110 $35,558 $35,997 $36,208 $37,169 $37,257 $36,524 $37,366 $37,177 $39,255 $40,446 $1,191 3.0% $6,336 18.6%2 Harrison Cadiz $26,247 $30,232 $28,432 $28,644 $30,475 $30,445 $29,600 $28,958 $28,464 $30,179 $29,996 -$184 -0.6% $3,748 14.3%3 Athens Athens $32,364 $35,321 $35,071 $34,390 $33,817 $34,275 $34,184 $35,398 $34,251 $36,853 $36,934 $81 0.2% $4,570 14.1%4 Belmont Martins Ferry $27,934 $28,037 $28,281 $28,736 $28,935 $29,341 $28,862 $29,786 $30,140 $31,124 $31,848 $724 2.3% $3,915 14.0%5 Scioto Portsmouth $28,961 $29,178 $29,199 $29,719 $30,807 $30,680 $30,769 $33,114 $31,799 $31,956 $32,915 $960 3.0% $3,955 13.7%6 Warren Mason $34,930 $35,367 $36,636 $37,330 $39,149 $39,442 $38,270 $38,420 $37,248 $37,477 $39,257 $1,780 4.8% $4,327 12.4%7 Vinton McArthur $26,958 $28,041 $32,209 $30,209 $31,613 $30,813 $29,187 $29,560 $28,424 $29,495 $29,566 $71 0.2% $2,608 9.7%8 Delaware Delaware $40,990 $40,923 $43,175 $42,081 $43,514 $43,012 $44,480 $45,490 $43,101 $43,702 $44,802 $1,100 2.5% $3,812 9.3%9 Wyandot Upper Sandusky $30,965 $31,041 $31,701 $31,913 $32,598 $32,263 $31,264 $31,897 $31,209 $33,188 $33,821 $633 1.9% $2,856 9.2%

10 Hamilton Cincinnati $45,417 $45,467 $47,212 $46,475 $47,901 $48,889 $48,336 $48,785 $48,148 $48,355 $49,557 $1,202 2.5% $4,141 9.1%11 Guernsey Cambridge $30,235 $30,310 $31,584 $32,507 $32,074 $31,429 $31,253 $31,373 $31,424 $33,619 $32,973 -$646 -1.9% $2,738 9.1%12 Pike Waverly $37,765 $37,124 $36,241 $34,999 $36,851 $37,970 $36,157 $38,096 $37,073 $39,035 $41,079 $2,043 5.2% $3,314 8.8%13 Allen Lima $34,061 $34,646 $35,305 $34,625 $35,492 $36,485 $35,712 $36,427 $34,620 $35,807 $36,799 $992 2.8% $2,738 8.0%14 Perry New Lexington $30,955 $31,792 $32,897 $33,339 $32,123 $31,856 $31,412 $34,449 $32,438 $31,752 $33,305 $1,553 4.9% $2,350 7.6%15 Wood Bowling Green $36,389 $37,063 $38,520 $38,359 $38,114 $39,084 $38,537 $45,874 $43,126 $37,564 $39,124 $1,559 4.2% $2,735 7.5%16 Logan Bellefontaine $36,068 $36,329 $37,596 $37,415 $38,053 $38,027 $37,225 $37,454 $35,252 $38,620 $38,686 $66 0.2% $2,618 7.3%17 Butler Hamilton $37,934 $38,466 $39,009 $39,168 $39,547 $40,124 $38,751 $41,349 $38,516 $39,151 $40,662 $1,510 3.9% $2,728 7.2%18 Jackson Jackson $30,114 $29,854 $29,943 $30,854 $31,406 $29,693 $28,742 $28,877 $29,216 $29,211 $32,222 $3,011 10.3% $2,108 7.0%19 Jefferson Steubenville $32,674 $32,915 $33,465 $31,647 $33,116 $33,040 $33,022 $35,069 $37,222 $34,616 $34,928 $312 0.9% $2,254 6.9%20 Knox Mount Vernon $34,711 $33,737 $35,803 $34,754 $34,299 $34,332 $35,116 $36,537 $35,848 $36,108 $37,077 $969 2.7% $2,366 6.8%21 Franklin Columbus $43,007 $42,733 $43,467 $43,330 $43,834 $45,403 $44,679 $45,452 $43,904 $44,394 $45,916 $1,522 3.4% $2,909 6.8%22 Lawrence Ironton $27,467 $27,590 $28,497 $28,256 $28,144 $28,353 $26,818 $27,740 $27,825 $27,658 $29,280 $1,622 5.9% $1,813 6.6%23 Morrow Mount Gilead $29,237 $28,956 $28,767 $28,525 $29,428 $30,075 $29,762 $30,814 $30,112 $30,145 $31,156 $1,011 3.4% $1,920 6.6%24 Coshocton Coshocton $32,772 $32,582 $33,123 $33,021 $33,869 $34,389 $33,743 $33,396 $32,264 $31,777 $34,910 $3,133 9.9% $2,138 6.5%25 Washington Marietta $33,750 $32,680 $36,547 $33,921 $33,464 $33,045 $34,280 $35,406 $35,191 $36,611 $35,905 -$706 -1.9% $2,154 6.4%26 Brown Georgetown $30,937 $29,441 $29,820 $28,705 $29,257 $28,435 $29,294 $31,384 $30,662 $31,994 $32,791 $797 2.5% $1,854 6.0%27 Highland Hillsboro $29,393 $29,306 $30,701 $30,728 $31,300 $32,068 $30,350 $31,045 $30,087 $32,162 $31,118 -$1,044 -3.2% $1,725 5.9%28 Gallia Gallipolis $34,490 $34,337 $33,723 $33,211 $33,882 $35,500 $35,543 $34,752 $35,402 $33,948 $36,305 $2,357 6.9% $1,814 5.3%29 Henry Napoleon $33,422 $34,704 $34,915 $34,294 $33,871 $35,650 $34,633 $35,068 $34,159 $34,146 $35,120 $974 2.9% $1,698 5.1%30 Van Wert Van Wert $32,073 $30,591 $29,844 $31,146 $32,629 $31,697 $31,079 $31,536 $30,774 $30,305 $33,681 $3,376 11.1% $1,608 5.0%31 Ross Chillicothe $36,046 $35,463 $36,666 $35,844 $35,544 $36,846 $36,060 $36,794 $35,350 $36,548 $37,649 $1,101 3.0% $1,602 4.4%32 Muskingum Zanesville $31,876 $32,762 $33,304 $31,306 $31,962 $31,599 $30,527 $31,896 $30,995 $31,844 $33,088 $1,244 3.9% $1,212 3.8%33 Mercer Celina $30,335 $30,282 $31,055 $31,157 $30,770 $32,058 $30,925 $31,787 $30,391 $30,574 $31,307 $733 2.4% $972 3.2%34 Lucas Toledo $38,694 $39,776 $40,364 $40,321 $39,766 $40,178 $40,104 $40,219 $38,058 $38,777 $39,747 $970 2.5% $1,053 2.7%35 Geauga Chardon $35,379 $34,798 $35,402 $35,012 $36,266 $36,665 $36,052 $36,209 $34,517 $34,774 $36,331 $1,557 4.5% $952 2.7%36 Portage Kent $36,064 $36,648 $36,656 $36,391 $36,250 $37,242 $36,009 $36,352 $35,405 $35,209 $37,029 $1,820 5.2% $965 2.7%37 Clinton Wilmington $37,458 $37,374 $38,596 $41,663 $39,352 $41,479 $42,783 $42,435 $42,366 $43,962 $38,404 -$5,557 -12.6% $946 2.5%38 Marion Marion $34,631 $34,586 $34,976 $35,269 $35,013 $35,092 $33,428 $34,977 $33,746 $33,970 $35,466 $1,496 4.4% $835 2.4%39 Cuyahoga Cleveland $44,251 $44,222 $44,336 $44,704 $45,770 $45,250 $44,146 $45,325 $43,768 $44,167 $45,301 $1,134 2.6% $1,050 2.4%40 Sandusky Fremont $32,645 $33,233 $33,336 $33,393 $33,781 $33,886 $32,998 $33,539 $31,696 $32,128 $33,387 $1,258 3.9% $741 2.3%41 Fulton Wauseon $34,447 $34,230 $34,445 $34,626 $35,777 $35,215 $33,893 $34,215 $33,377 $32,868 $35,208 $2,340 7.1% $761 2.2%42 Mahoning Youngstown $32,022 $32,011 $33,450 $33,553 $33,731 $33,405 $32,277 $32,738 $31,662 $32,015 $32,724 $709 2.2% $702 2.2%43 Hancock Findlay $37,890 $37,014 $37,979 $38,347 $38,782 $40,658 $40,612 $38,252 $36,422 $37,581 $38,698 $1,117 3.0% $808 2.1%44 Union Marysville $49,711 $51,185 $51,618 $52,696 $52,388 $51,710 $50,264 $52,077 $47,328 $50,522 $50,689 $167 0.3% $978 2.0%45 Adams West Union $29,333 $27,812 $27,548 $27,974 $28,412 $29,880 $30,656 $32,618 $28,891 $29,313 $29,894 $582 2.0% $562 1.9%46 Fairfield Lancaster $31,789 $32,141 $33,021 $32,647 $32,883 $32,619 $31,271 $31,908 $30,962 $31,390 $32,276 $886 2.8% $487 1.5%47 Summit Akron $39,669 $40,132 $40,883 $41,536 $41,313 $41,496 $39,825 $40,693 $39,116 $39,693 $40,269 $576 1.5% $599 1.5%48 Champaign Urbana $34,897 $34,163 $33,989 $33,493 $34,179 $35,310 $33,619 $34,608 $33,478 $33,598 $35,347 $1,749 5.2% $449 1.3%49 Darke Greenville $31,684 $31,722 $31,634 $30,723 $31,882 $31,588 $31,058 $31,692 $30,592 $30,971 $31,994 $1,023 3.3% $311 1.0%

TOTAL TOTAL TOTAL TOTAL TOTAL TOTAL TOTAL TOTAL TOTAL TOTAL TOTAL TOTAL TOTAL TOTAL TOTALMEAN MEAN MEAN MEAN MEAN MEAN MEAN MEAN MEAN MEAN MEAN 09-10 09-10 00-10 00-10

LARGEST EARN EARN EARN EARN EARN EARN EARN EARN EARN EARN EARN $ INCR % INCR $ INCR % INCR# COUNTY CITY 3Q 00 3Q 01 3Q 02 3Q 03 3Q 04 3Q 05 3Q 06 3Q 07 3Q 08 3Q 09 3Q 10 MEAN MEAN MEAN MEAN50 Licking Newark $34,770 $35,171 $34,708 $36,179 $36,437 $36,617 $35,356 $35,162 $34,017 $35,704 $35,044 -$661 -1.9% $274 0.8%51 Ottawa Port Clinton $33,677 $32,077 $33,231 $35,054 $34,978 $33,518 $32,168 $33,576 $32,677 $32,322 $33,937 $1,616 5.0% $261 0.8%52 Stark Canton $34,858 $34,835 $35,603 $35,137 $35,452 $36,077 $35,203 $35,366 $34,037 $34,041 $35,120 $1,079 3.2% $262 0.8%53 Hardin Kenton $32,592 $32,113 $32,738 $31,503 $31,649 $32,222 $31,140 $31,238 $31,601 $31,495 $32,828 $1,333 4.2% $236 0.7%54 Seneca Tiffin $31,747 $31,859 $32,459 $31,593 $31,427 $31,814 $31,058 $31,886 $30,406 $31,119 $31,936 $817 2.6% $189 0.6%55 Wayne Wooster $34,987 $34,877 $35,432 $35,119 $35,830 $35,529 $34,443 $34,888 $33,747 $34,205 $35,120 $915 2.7% $133 0.4%56 Shelby Sidney $40,794 $39,238 $40,079 $40,208 $40,246 $40,131 $40,250 $40,578 $38,052 $40,415 $40,886 $470 1.2% $92 0.2%57 Holmes Millersburg $29,474 $29,115 $30,063 $29,666 $29,845 $30,864 $29,203 $29,483 $28,450 $28,682 $29,498 $816 2.8% $24 0.1%58 Ashtabula Ashtabula $31,467 $31,285 $31,404 $31,384 $31,909 $32,217 $30,947 $31,080 $30,252 $30,294 $31,486 $1,192 3.9% $19 0.1%59 Fayette Washington C.H. $29,428 $29,829 $31,230 $31,564 $31,721 $31,071 $30,133 $30,876 $29,144 $29,141 $29,388 $247 0.8% -$40 -0.1%60 Columbiana East Liverpool $30,065 $30,271 $30,673 $30,297 $30,552 $30,756 $29,268 $29,830 $28,975 $29,201 $29,916 $715 2.4% -$148 -0.5%61 Tuscarawas New Philadelphia $30,626 $29,981 $30,606 $29,934 $31,284 $31,589 $30,175 $30,910 $29,875 $29,073 $30,463 $1,389 4.8% -$164 -0.5%62 Madison London $36,240 $35,379 $37,173 $36,224 $35,697 $35,577 $35,408 $36,062 $34,470 $35,139 $35,994 $855 2.4% -$246 -0.7%63 Putnam Ottawa $30,329 $30,205 $31,648 $30,218 $30,507 $29,481 $29,367 $30,072 $28,962 $28,971 $30,003 $1,032 3.6% -$325 -1.1%64 Williams Bryan $34,105 $33,827 $34,104 $33,909 $35,054 $34,231 $32,956 $34,062 $32,486 $32,697 $33,699 $1,002 3.1% -$406 -1.2%65 Huron Norwalk $34,609 $33,746 $34,146 $33,886 $34,770 $35,298 $33,720 $33,894 $33,484 $33,734 $34,192 $459 1.4% -$417 -1.2%66 Ashland Ashland $33,353 $33,158 $33,501 $33,469 $33,659 $34,099 $32,658 $34,045 $32,510 $32,470 $32,804 $334 1.0% -$550 -1.6%67 Lake Mentor $38,029 $37,550 $38,023 $37,314 $37,561 $37,415 $36,002 $36,796 $35,434 $36,489 $37,292 $803 2.2% -$737 -1.9%68 Hocking Logan $30,626 $29,910 $29,930 $29,840 $30,288 $29,126 $28,423 $29,812 $28,743 $29,415 $29,916 $502 1.7% -$709 -2.3%69 Miami Piqua $35,638 $35,457 $35,767 $35,500 $36,449 $36,397 $34,295 $34,853 $33,480 $33,452 $34,685 $1,234 3.7% -$953 -2.7%70 Montgomery Dayton $41,852 $41,299 $41,302 $41,296 $41,933 $42,419 $43,186 $41,336 $40,610 $39,755 $40,292 $537 1.4% -$1,560 -3.7%71 Clark Springfield $35,097 $34,171 $34,445 $33,934 $34,144 $34,363 $34,064 $33,047 $32,350 $33,347 $33,774 $427 1.3% -$1,324 -3.8%72 Monroe Woodsfield $34,708 $36,998 $35,674 $38,225 $36,871 $34,757 $32,217 $33,049 $34,060 $33,858 $33,338 -$520 -1.5% -$1,370 -3.9%73 Carroll Carrolton $29,533 $28,725 $28,938 $27,467 $27,813 $27,227 $27,915 $28,112 $27,142 $26,912 $28,243 $1,331 4.9% -$1,290 -4.4%74 Medina Brunswick $36,304 $35,640 $35,812 $36,068 $36,218 $36,913 $35,428 $35,336 $33,960 $34,008 $34,703 $695 2.0% -$1,602 -4.4%75 Pickaway Circleville $39,177 $38,044 $38,410 $37,702 $39,321 $36,257 $37,446 $37,656 $36,197 $37,056 $37,337 $281 0.8% -$1,840 -4.7%76 Paulding Paulding $30,651 $32,010 $31,807 $30,331 $30,503 $31,407 $30,972 $31,112 $29,553 $29,695 $28,996 -$699 -2.4% -$1,655 -5.4%77 Lorain Lorain $38,516 $37,572 $37,454 $36,805 $37,715 $39,070 $36,737 $37,913 $36,142 $35,128 $36,318 $1,190 3.4% -$2,199 -5.7%78 Clermont Milford $38,572 $38,513 $38,719 $38,649 $39,091 $39,624 $37,937 $38,282 $35,916 $36,195 $36,323 $128 0.4% -$2,249 -5.8%79 Noble Caldwell $32,054 $31,071 $33,379 $32,637 $32,428 $30,070 $31,596 $31,887 $29,989 $30,891 $29,794 -$1,096 -3.5% -$2,260 -7.0%80 Crawford Bucyrus $33,141 $32,112 $33,536 $32,624 $33,271 $33,531 $30,355 $30,074 $29,223 $29,246 $30,707 $1,460 5.0% -$2,434 -7.3%81 Richland Mansfield $35,306 $35,269 $36,008 $35,272 $36,447 $35,789 $35,610 $34,392 $33,175 $32,504 $32,508 $4 0.0% -$2,797 -7.9%82 Auglaize Saint Marys $37,768 $36,543 $37,096 $35,979 $36,614 $37,921 $34,967 $36,538 $34,977 $33,268 $33,874 $606 1.8% -$3,894 -10.3%83 Trumbull Warren $39,647 $39,523 $39,278 $39,314 $40,871 $38,972 $43,364 $37,953 $36,921 $34,314 $35,532 $1,219 3.6% -$4,115 -10.4%84 Defiance Defiance $40,233 $39,879 $39,837 $39,294 $40,246 $39,916 $42,862 $39,165 $35,752 $35,576 $36,024 $448 1.3% -$4,209 -10.5%85 Preble Eaton $36,865 $33,769 $34,058 $33,283 $33,274 $33,221 $32,091 $32,343 $31,279 $31,588 $32,146 $558 1.8% -$4,719 -12.8%86 Meigs Middleport $33,706 $38,297 $27,027 $26,288 $25,478 $25,172 $24,084 $24,672 $25,008 $27,101 $29,127 $2,026 7.5% -$4,579 -13.6%87 Erie Sandusky $38,228 $35,448 $35,078 $35,014 $35,889 $34,819 $34,384 $33,080 $31,068 $31,563 $32,117 $554 1.8% -$6,111 -16.0%88 Morgan McConnelsville $36,990 $36,636 $34,727 $34,365 $34,240 $33,851 $27,001 $28,062 $27,572 $27,510 $29,328 $1,818 6.6% -$7,662 -20.7%

OHIO 88 COUNTY TOTAL $39,335 $39,290 $39,892 $39,773 $40,357 $40,709 $39,990 $40,509 $39,155 $39,456 $40,452 $995 2.5% $1,117 2.8%Source: ODJFS QCEW ES-202 Complete Count of Jobs and George Zeller

TABLE FIFTEEN: Mean Annual Earnings of a Job during Third Quarter of 2010Ohio Counties: Total, Manufacturing, Nonmanufacturing, and Retail Trade JobsListed Alphabetically by County, Showing Ranks Among All 88 Counties

TOTAL MFG NONMFG RETAILTOTAL MFG NONMFG RETAIL MEAN MEAN MEAN MEANJOBS JOBS JOBS JOBS LARGEST EARN EARN EARN EARNRANK RANK RANK RANK COUNTY CITY 3Q 10 3Q 19 3Q 10 3Q 10

79 40 84 78 Adams West Union $29,894 $47,319 $33,666 $20,03424 9 45 50 Allen Lima $36,799 $58,323 $43,525 $21,92758 69 54 49 Ashland Ashland $32,804 $41,016 $40,247 $22,09069 47 55 63 Ashtabula Ashtabula $31,486 $45,425 $40,135 $21,57023 75 67 17 Athens Athens $36,934 $38,673 $37,783 $23,81246 56 9 79 Auglaize Saint Marys $33,874 $43,978 $50,834 $19,56068 54 85 54 Belmont Martins Ferry $31,848 $44,190 $33,446 $21,76459 77 79 67 Brown Georgetown $32,791 $38,031 $35,613 $21,1858 3 23 6 Butler Hamilton $40,662 $62,478 $47,443 $25,431

88 74 77 21 Carroll Carrolton $28,243 $39,732 $35,898 $23,50534 26 18 64 Champaign Urbana $35,347 $51,698 $47,741 $21,48048 28 62 51 Clark Springfield $33,774 $50,754 $38,718 $21,92126 35 56 12 Clermont Milford $36,323 $48,818 $40,026 $24,48317 33 21 42 Clinton Wilmington $38,404 $49,112 $47,547 $22,47578 79 72 28 Columbiana East Liverpool $29,916 $36,894 $36,902 $23,11141 65 30 76 Coshocton Coshocton $34,910 $41,463 $46,279 $20,35473 84 50 26 Crawford Bucyrus $30,707 $35,336 $41,589 $23,1604 13 10 8 Cuyahoga Cleveland $45,301 $54,873 $50,362 $25,233

66 72 51 68 Darke Greenville $31,994 $40,599 $41,147 $21,05729 10 20 47 Defiance Defiance $36,024 $56,500 $47,632 $22,1825 17 16 22 Delaware Delaware $44,802 $54,243 $48,281 $23,439

65 15 71 65 Erie Sandusky $32,117 $54,281 $37,029 $21,44062 58 75 52 Fairfield Lancaster $32,276 $43,535 $36,397 $21,91483 61 83 83 Fayette Washington C.H. $29,388 $42,298 $34,476 $18,4913 16 15 2 Franklin Columbus $45,916 $54,272 $48,479 $28,045

35 43 7 27 Fulton Wauseon $35,208 $46,582 $53,150 $23,16028 64 64 45 Gallia Gallipolis $36,305 $41,550 $38,281 $22,22925 48 29 14 Geauga Chardon $36,331 $45,403 $46,291 $24,2169 18 46 43 Greene Beavercreek $40,446 $54,113 $42,912 $22,357

55 53 52 62 Guernsey Cambridge $32,973 $44,236 $40,839 $21,6032 4 4 3 Hamilton Cincinnati $49,557 $62,255 $55,056 $25,788

15 44 8 15 Hancock Findlay $38,698 $46,449 $50,865 $23,95257 71 47 77 Hardin Kenton $32,828 $40,647 $42,817 $20,24876 81 81 85 Harrison Cadiz $29,996 $36,608 $34,830 $17,31536 29 14 72 Henry Napoleon $35,120 $50,683 $48,564 $20,91872 67 70 59 Highland Hillsboro $31,118 $41,165 $37,162 $21,69377 66 82 73 Hocking Logan $29,916 $41,280 $34,538 $20,85982 87 35 39 Holmes Millersburg $29,498 $31,668 $45,083 $22,62344 68 26 57 Huron Norwalk $34,192 $41,017 $46,497 $21,71363 80 25 53 Jackson Jackson $32,222 $36,773 $46,529 $21,82740 31 68 74 Jefferson Steubenville $34,928 $50,131 $37,696 $20,63121 24 13 48 Knox Mount Vernon $37,077 $52,516 $48,743 $22,15020 14 24 19 Lake Mentor $37,292 $54,538 $46,762 $23,67985 78 87 56 Lawrence Ironton $29,280 $37,583 $30,642 $21,71539 42 59 13 Licking Newark $35,044 $46,603 $39,646 $24,27016 2 6 38 Logan Bellefontaine $38,686 $63,833 $53,289 $22,68227 11 44 37 Lorain Lorain $36,318 $55,733 $43,676 $22,700

TOTAL MFG NONMFG RETAILTOTAL MFG NONMFG RETAIL MEAN MEAN MEAN MEANJOBS JOBS JOBS JOBS LARGEST EARN EARN EARN EARNRANK RANK RANK RANK COUNTY CITY 3Q 10 3Q 19 3Q 10 3Q 10

12 7 40 11 Lucas Toledo $39,747 $58,706 $44,016 $24,56730 50 39 4 Madison London $35,994 $44,469 $44,339 $25,48760 73 78 33 Mahoning Youngstown $32,724 $40,064 $35,851 $22,95833 60 19 35 Marion Marion $35,466 $42,943 $47,707 $22,84442 41 53 41 Medina Brunswick $34,703 $47,139 $40,726 $22,50786 88 88 86 Meigs Middleport $29,127 $29,402 $30,146 $16,74270 76 43 44 Mercer Celina $31,307 $38,078 $43,692 $22,26743 38 33 24 Miami Piqua $34,685 $47,482 $45,545 $23,21852 22 28 87 Monroe Woodsfield $33,338 $52,795 $46,347 $16,64610 32 36 16 Montgomery Dayton $40,292 $50,049 $44,963 $23,89184 46 76 84 Morgan McConnelsville $29,328 $45,552 $36,148 $17,34371 34 74 36 Morrow Mount Gilead $31,156 $48,864 $36,595 $22,80354 45 73 60 Muskingum Zanesville $33,088 $45,792 $36,844 $21,65580 83 86 82 Noble Caldwell $29,794 $35,689 $32,466 $18,56545 27 57 30 Ottawa Port Clinton $33,937 $50,938 $39,818 $23,05587 86 58 80 Paulding Paulding $28,996 $32,183 $39,688 $19,41753 85 66 81 Perry New Lexington $33,305 $35,323 $37,947 $18,91819 21 37 10 Pickaway Circleville $37,337 $53,128 $44,921 $24,5926 20 3 70 Pike Waverly $41,079 $53,166 $58,309 $20,952

22 39 32 40 Portage Kent $37,029 $47,441 $45,657 $22,53064 30 38 66 Preble Eaton $32,146 $50,376 $44,586 $21,19175 37 63 75 Putnam Ottawa $30,003 $47,914 $38,426 $20,53061 49 60 29 Richland Mansfield $32,508 $44,632 $39,337 $23,07518 6 42 23 Ross Chillicothe $37,649 $58,740 $43,726 $23,33951 52 12 31 Sandusky Fremont $33,387 $44,287 $48,928 $23,05456 63 80 32 Scioto Portsmouth $32,915 $41,946 $35,365 $22,96067 57 61 7 Seneca Tiffin $31,936 $43,779 $38,987 $25,2457 19 2 25 Shelby Sidney $40,886 $53,389 $68,476 $23,211

37 36 49 20 Stark Canton $35,120 $48,539 $41,778 $23,52711 23 34 5 Summit Akron $40,269 $52,566 $45,349 $25,45532 8 41 18 Trumbull Warren $35,532 $58,471 $43,931 $23,74674 70 65 58 Tuscarawas New Philadelphia $30,463 $40,962 $38,232 $21,7061 1 1 9 Union Marysville $50,689 $72,672 $75,517 $24,690

50 59 27 71 Van Wert Van Wert $33,681 $43,511 $46,441 $20,92581 82 69 88 Vinton McArthur $29,566 $36,158 $37,309 $15,35313 25 31 1 Warren Mason $39,257 $52,057 $45,726 $29,71331 12 48 34 Washington Marietta $35,905 $55,726 $42,202 $22,88138 51 22 61 Wayne Wooster $35,120 $44,443 $47,543 $21,60649 62 5 46 Williams Bryan $33,699 $41,996 $53,393 $22,19914 5 11 69 Wood Bowling Green $39,124 $59,345 $49,156 $20,97747 55 17 55 Wyandot Upper Sandusky $33,821 $43,998 $48,266 $21,722

OHIO 88 COUNTY TOTAL $40,452 $51,682 $46,517 $24,333Source: ODJFS QCEW ES-202 and George Zeller


Recommended