Page 1
ECONOMIC OPTIMIZATION OF AN ETHYLBENZENE PROCESS
by
Erin Leigh Dyer
A thesis submitted to the faculty of The University of Mississippi in partial fulfillment of
the requirements of the Sally McDonnell Barksdale Honors College.
Oxford
May 2015
Approved by
______________________________
Advisor: Professor Adam Smith
______________________________
Reader: Professor John O’Haver
______________________________
Reader: Professor Paul Scovazzo
Page 2
ii
©2015
Erin Leigh Dyer
ALL RIGHTS RESERVED
Page 3
iii
ACKNOWLEDGEMENTS
This project was completed with the help of my teammates in Ch E 451: Chelsea Worley
and Michael Austin Moncrief. Thank you also to my advisor, professor, and mentor Dr.
Adam Smith for your constant support and encouragement.
Page 4
iv
ABSTRACT
ERIN LEIGH DYER: Economic Optimization of an Ethylbenzene Process
(Under the direction of Adam Smith)
This report describes the process of optimizing an existing design for a chemical
plant that produces the chemical intermediate ethylbenzene. For an engineer, economic
optimization involves manipulating the design variables of a chemical process in order
to improve the economic outcome of the project. In this case, the objective of the
optimization was to maximize the net present value of the ethylbenzene plant. After
analyzing the net present value of the existing design, the team conducted subsequent
analyses on the operation of the process, adjusting variables such as temperature,
pressure, and flow rate in order to minimize the costs of manufacturing.
The most important tool in the analysis of this chemical process was SimSci
Pro/II process simulation software, which allowed the team to determine the effects of
varying many different process parameters simultaneously. The team made all decisions
about the final design of the process according to what would be the most economical
design and still be within the constraints of the project.
The team found that the most economical design would use both a new catalyst
with higher selectivity and a lower grade benzene feed. The new catalyst would
suppress the production of chemical by-products, thereby reducing the extent of the
purification process. Using the lower grade benzene feed would allow the plant to save a
significant amount of money on raw materials. The team also made other
recommendations for optimization of the process equipment.
The final optimized design is estimated to have a net present value of $50.9
million, a substantial improvement from the base case net present value of -$10.7
million. However, the team recommends many more detailed analyses of this design
before any action is taken.
Page 5
v
TABLE OF CONTENTS
INTRODUCTION .............................................................................................................. 1
COMPARISON OF POSSIBLE CHANGES ..................................................................... 5
BASE CASE ANALYSIS ............................................................................................... 5
THE REACTIONS ...................................................................................................... 9
NEW FEED ANALYSIS .............................................................................................. 13
OPTIMIZATION .............................................................................................................. 15
REACTOR TRAIN ....................................................................................................... 15
SEPARATION SECTION ............................................................................................ 22
CONCLUSIONS AND RECOMMENDATIONS ........................................................... 30
BIBLIOGRAPHY ............................................................................................................. 31
Page 6
vi
LIST OF TABLES
Table 1 Comparison of old and new catalyst. .......................................................... 11
Table 2 Comparison of reaction kinetics for old and new catalyst. ......................... 13
Table 3 Comparison of original benzene feed with lower grade benzene feed. ...... 13
Page 7
vii
LIST OF FIGURES
Figure 1 Process concept diagram for production of ethylbenzene from benzene and
ethylene. ...................................................................................................... 2
Figure 2 Process flow diagram of the base case design. ............................................ 6
Figure 3 Sensitivity analysis of the base case, showing the variation of net present
value with respect to the percent deviation from the base case value for
ethylbenzene production and raw materials fed.......................................... 8
Figure 4 Sensitivity analysis of the base case, showing the effects of operating
labor, utilities, and equipment costs. ........................................................... 9
Figure 5 Case study results for the effect of temperature on conversion of benzene,
using the new catalyst. .............................................................................. 16
Figure 6 Case study results for the effect of temperature on selectivity of
ethylbenzene over diethylbenzene, using the new catalyst. ...................... 16
Figure 7 Case study results showing the effect of pressure on conversion of
benzene, using the new catalyst. ............................................................... 17
Figure 8 Case study results showing the effect of pressure on selectivity of
ethylbenzene over diethylbenzene, using the new catalyst. ...................... 18
Figure 9 Case study results showing the effect of the ratio of benzene to ethylene in
the first reactor feed on conversion of benzene. ....................................... 19
Figure 10 Case study results showing the effect of the ratio of benzene to ethylene in
the first reactor feed on selectivity. ........................................................... 19
Figure 11 Close-up graph of the rate of diethylbenzene leaving the reactor train as a
function of temperature. ............................................................................ 20
Figure 12 Close-up graph of the rate of diethylbenzene leaving the reactor train as a
function of pressure................................................................................... 21
Figure 13 Individual component flow rates for fuel gas, as determined by the
pressure entering the flash tank. ................................................................ 23
Page 8
viii
Figure 14 Case study results showing the effect of varying the pressure drop across
the flash drum on the flow rates of benzene and ethylbenzene in the fuel
gas leaving the process.............................................................................. 25
Figure 15 Case study results showing the effect of feed tray location on the net duty
of the distillation column. ......................................................................... 26
Figure 16 Case study results showing the fraction of liquid in the recycle stream as a
function of the outlet pressure of the compressor. .................................... 27
Figure 17 Process flow diagram for the final optimized design. ............................... 29
Page 9
1
Introduction
At the beginning of the Fall 2014 semester, my team in Ch E 451 (Plant Design I)
began the task of designing an ethylbenzene plant at the hypothetical Ole Miss
petrochemical facility, which produces a wide range of chemicals derived from
petroleum. The purpose of the plant was to produce ethylbenzene for use in an on-site
styrene facility. Our assignment was to optimize the process from the given base case
design of the ethylbenzene plant, with our main objective to maximize the net present
value (NPV) while keeping within the plant’s specifications. These specifications were to
produce 80,000 tonne/yr of ethylbenzene with a purity of 99.8 mol% and a maximum of
2 ppm diethylbenzene. Another constraint on our design was that we were unable to
perform heat integration, since the utilities produced in the ethylbenzene process were
already integrated into the styrene facility.
The process concept diagram, Figure 1, shows how benzene and ethylene react to
form ethylbenzene. Benzene is purchased at $1.04/kg, ethylene is purchased at $0.72/kg,
and ethylbenzene can be sold for $1.34/kg. Because benzene and ethylene react to form
ethylbenzene in a 1:1:1 stoichiometric ratio, the process has an economic potential of
$0.528/kg benzene. The economic potential is a positive value, indicating that the process
warrants further investigation.
Page 10
2
Figure 1: Process concept diagram for production of ethylbenzene from benzene and
ethylene.
Any of the assumptions made in analysis of this process were based on the
heuristics presented in Chapter 11 of Richard Turton’s Analysis, Synthesis, and Design of
Chemical Processes [1] textbook for Ch E 451, including assumptions on calculating the
sizes of process equipment and evaluating the operating parameters of the equipment. In
addition, Chan Park’s Contemporary Engineering Economics [2] was used as a reference
for all economic analyses.
In addition to the base case, the project presented two possible changes for the
plant, with the option of making one, both, or neither of the changes. The first possible
change was to use a new catalyst, which was more expensive, but would suppress the
reaction of ethylbenzene to form diethylbenzene. The second possible change was to use
a less expensive, lower purity benzene feed. After evaluating these possible changes and
deciding which, if any, we would implement in the plant, we further optimized the
process.
In Turton’s Analysis, optimization is defined as “the process of improving an
existing situation, device, or system such as a chemical process.” In optimization, an
engineer has control over the design variables, which can either be continuous (such as
Page 11
3
temperature) or discrete (such as the number of trays in a distillation column). An
engineer uses an objective function, a mathematical function with minimums or
maximums, to make decisions when optimizing a process. In most optimizations,
including the one described in the following pages, the objective function relates to the
economic outcome of the process. If the objective function describes the costs of the
process, an engineer will search for its minimum; if the function describes profit, the
engineer will search for its maximum. In the case of this optimization, the objective
function is the net present value of the ethylbenzene plant.
The result of the objective function is limited by certain constraints on the process
and on the design variables. For example, a catalyst may have a maximum operating
temperature of 500°C (as is the case in this particular optimization), and therefore the
engineer cannot choose to operate the process above 500°C, no matter how beneficial it
may be to the economic outcome.
Optimization of a process generally begins with analysis of a base case, which is
the starting point for optimization. In this case, the base case is a proposed ethylbenzene
process that is already designed, and the goal is to improve its economic outcome.
Engineers use two types of optimization: topological optimization, which deals with the
arrangement of process equipment, and parametric optimization, which deals with
operating variables such as temperature and pressure. This analysis of the ethylbenzene
plant mainly uses parametric optimization. For each piece of equipment in the process,
our team varied the design variables over a range within the constraints of the process
and observed their effect on the objective function, which was different depending on the
purpose of the equipment. For example, because we desired maximum conversion of raw
Page 12
4
materials and maximum selectivity of the desired product over the undesired product in
the reactor train, we varied the operating temperature and pressure to find the temperature
and pressure that would produce maximum conversion and selectivity.
In the following pages, I will briefly discuss how we decided which of the options
to use in our design, and I will explain how we optimized the process. We used SimSci
PRO/II process simulation software to simulate the ethylbenzene plant and Microsoft
Excel to create the needed figures and tables to present our results. We used the
CAPCOST program in Excel to estimate the costs of all equipment and referred to
Turton’s Analysis when calculating the sizes and operating conditions of the equipment.
Page 13
5
Comparison of Possible Changes
Base Case Analysis
Before we decided which of the proposed changes to make to the ethylbenzene
plant and began to optimize the process, we performed an analysis on the base case
design. We began by simulating the process in PRO/II, referencing the stream tables and
equipment descriptions provided in the original process description. We then used
heuristics to size all of the equipment and calculated the cost of each piece of equipment
in CAPCOST. Heuristics are experience-based rules of thumb or shortcut methods that
practicing engineers use to solve problems. We calculated the costs of manufacturing,
including utility costs, labor, and raw materials, and finally created a cash flow statement
that allowed us to calculate the net present value of the project. With a project length of
12 years and a minimum acceptable rate of return (MARR) of 12%, we calculated the net
present value of the base case to be -$10.7 million. Figure 2 is the process flow diagram
of the base case design.
Page 14
6
Figure 2: Process flow diagram of the base case design.
Page 15
7
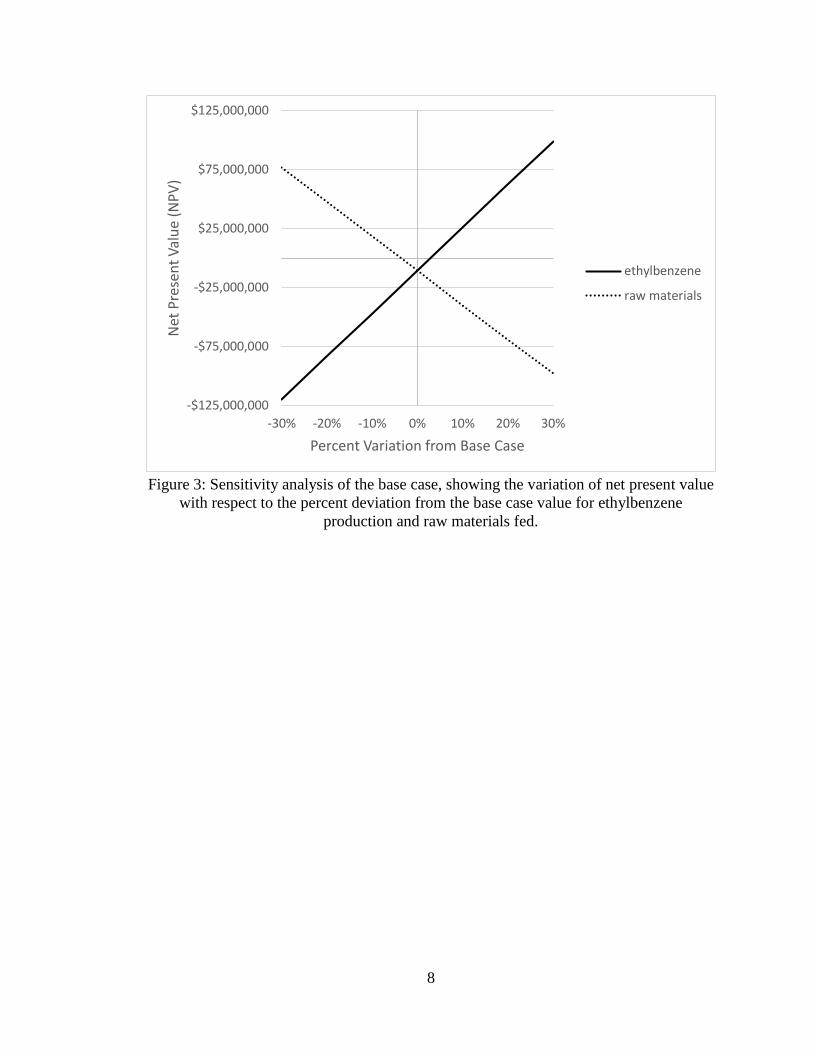
We then began to evaluate which elements in the base case were negatively
affecting the net present value. Sensitivity analysis dictates that the cost of raw materials
and the revenue from the desired product have the greatest effect on net present value. As
shown in Figure 3, the cost of raw materials dramatically impacts the net present value
when the base case value is varied by 30% in either direction. The amount of
ethylbenzene produced impacts the net present value on the same scale as the raw
materials but in the opposite direction. However, because the plant is constrained to a
constant ethylbenzene production of 80,000 tonne/yr, our team could not alter the
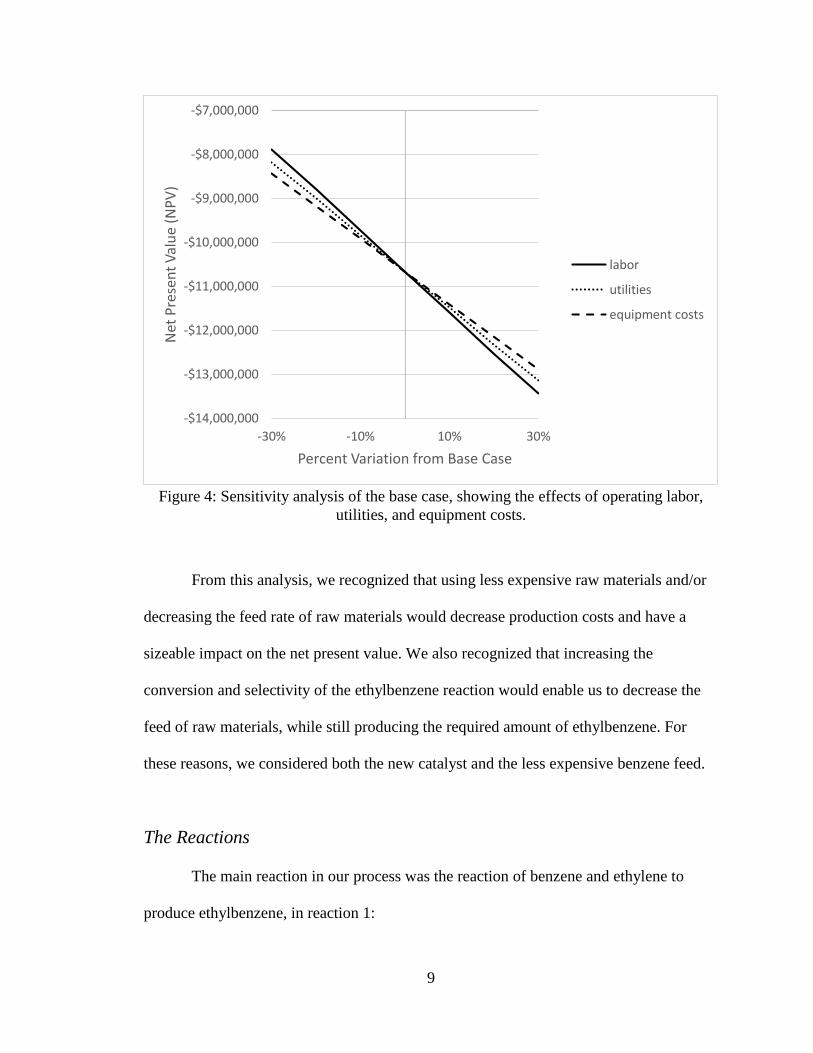
production rate in order to improve the net present value. Figure 4 shows the effect of
utilities, operating labor, and equipment. Both the cost of utilities and the cost of
operating labor have a significant effect on the net present value, since they are
continuous costs over the length of the project, though their effects are not as dramatic as
the effects of revenue and raw materials. One-time capital costs such as equipment costs
have little effect on the net present value.
Page 16
8
Figure 3: Sensitivity analysis of the base case, showing the variation of net present value
with respect to the percent deviation from the base case value for ethylbenzene
production and raw materials fed.
-$125,000,000
-$75,000,000
-$25,000,000
$25,000,000
$75,000,000
$125,000,000
-30% -20% -10% 0% 10% 20% 30%
Net
Pre
sen
t V
alu
e (N
PV
)
Percent Variation from Base Case
ethylbenzene
raw materials
Page 17
9
Figure 4: Sensitivity analysis of the base case, showing the effects of operating labor,
utilities, and equipment costs.
From this analysis, we recognized that using less expensive raw materials and/or
decreasing the feed rate of raw materials would decrease production costs and have a
sizeable impact on the net present value. We also recognized that increasing the
conversion and selectivity of the ethylbenzene reaction would enable us to decrease the
feed of raw materials, while still producing the required amount of ethylbenzene. For
these reasons, we considered both the new catalyst and the less expensive benzene feed.
The Reactions
The main reaction in our process was the reaction of benzene and ethylene to
produce ethylbenzene, in reaction 1:
-$14,000,000
-$13,000,000
-$12,000,000
-$11,000,000
-$10,000,000
-$9,000,000
-$8,000,000
-$7,000,000
-30% -10% 10% 30%
Net
Pre
sen
t V
alu
e (N
PV
)
Percent Variation from Base Case
labor
utilities
equipment costs
Page 18
10
C6H6 + C2H4 → C6H5C2H5 (1)
benzene + ethylene → ethylbenzene
Ethylene can also react with ethylbenzene to form diethylbenzene, in reaction 2:
C6H5C2H5 + C2H4 → C6H4(C2H5)2 (2)
ethylbenzene + ethylene → diethylbenzene
Diethylbenzene is an undesirable product, not only because it consumes some of the
desired ethylbenzene that has been produced, but also because even small amounts of
diethylbenzene can lead to processing problems in the downstream styrene plant. For
these reasons, one of our main objectives in optimizing the design was to suppress the
diethylbenzene reaction and keep the concentration of diethylbenzene in the product
below 2 ppm. However, any diethylbenzene that is produced can also be reacted with
benzene to form ethylbenzene, in reaction 3:
C6H4(C2H5)2 + C6H6 → 2 C6H5C2H5 (3)
diethylbenzene + benzene → ethylbenzene
Finally, because the benzene feed contains a toluene impurity, the toluene can also react
with ethylene to form ethylbenzene and propylene, in reaction 4:
C6H5CH3 + 2 C2H4 → C6H5C2H5 + C3H6 (4)
toluene + ethylene → ethylbenzene + propylene
New Catalyst Analysis
Table 1 shows the differences between the two catalysts. Even though the new
catalyst is significantly more expensive, it has a longer lifespan, and its effect on the
process could have a sizeable impact on the net present value of the project. Additionally,
Page 19
11
we noted that both catalysts had a maximum operating temperature of 500°C, an
important consideration in designing the process.
Table 1: Comparison of old and new catalyst.
Old Catalyst New Catalyst
Price ($/kg) 5 8
Lifespan (yr) 3 4
Density (kg/m3) 1,200 1,250
Void fraction 0.4 0.4
Max Operating Temp (°C) 500 500
Page 20
12
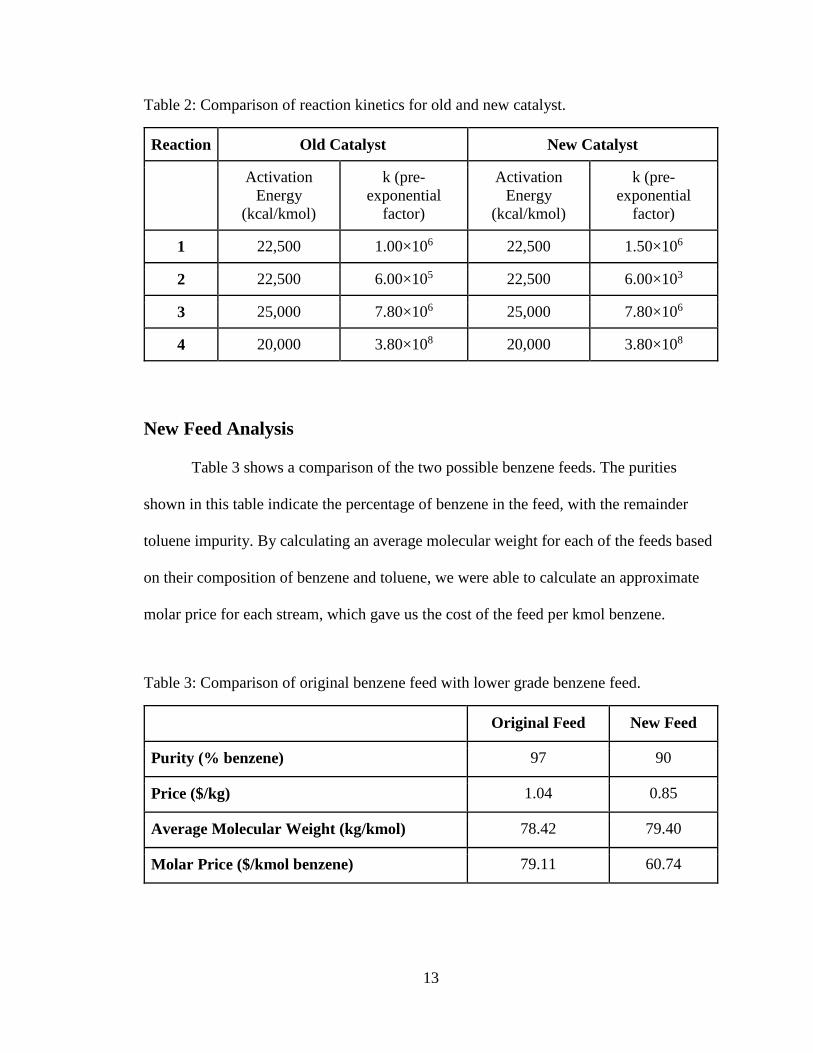
Table 2 shows the differences between the reaction kinetics for the old catalyst
and the new catalyst. This table shows that although there is no difference in activation
energy between the two catalysts, the pre-exponential factors are different for the main
reaction between benzene and ethylene to produce ethylbenzene and for the side reaction
of ethylbenzene with ethylene to produce diethylbenzene. With the new catalyst, the
reaction producing ethylbenzene would have a much faster reaction rate, while the side
reaction producing diethylbenzene would be much slower, so the new catalyst could
significantly improve the selectivity of ethylbenzene over diethylbenzene.
Page 21
13
Table 2: Comparison of reaction kinetics for old and new catalyst.
Reaction Old Catalyst New Catalyst
Activation
Energy
(kcal/kmol)
k (pre-
exponential
factor)
Activation
Energy
(kcal/kmol)
k (pre-
exponential
factor)
1 22,500 1.00×10⁶ 22,500 1.50×10⁶
2 22,500 6.00×10⁵ 22,500 6.00×10³
3 25,000 7.80×10⁶ 25,000 7.80×10⁶
4 20,000 3.80×10⁸ 20,000 3.80×10⁸
New Feed Analysis
Table 3 shows a comparison of the two possible benzene feeds. The purities
shown in this table indicate the percentage of benzene in the feed, with the remainder
toluene impurity. By calculating an average molecular weight for each of the feeds based
on their composition of benzene and toluene, we were able to calculate an approximate
molar price for each stream, which gave us the cost of the feed per kmol benzene.
Table 3: Comparison of original benzene feed with lower grade benzene feed.
Original Feed New Feed
Purity (% benzene) 97 90
Price ($/kg) 1.04 0.85
Average Molecular Weight (kg/kmol) 78.42 79.40
Molar Price ($/kmol benzene) 79.11 60.74
Page 22
14
From this information, we decided to use the lower purity feed. For the same
molar flow rate of benzene for each feed, the lower purity feed would have a much lower
cost than the high purity feed and would have a positive effect on the project’s net present
value.
Page 23
15
Optimization
Reactor Train
After choosing to use both the new catalyst and the less expensive benzene feed,
we began to optimize our design. We started with optimizing the reactors by choosing the
temperature, pressure, and stoichiometric ratio that would maximize conversion and
selectivity. To do this, we used the case study function in PRO/II to vary each of these
three parameters and to calculate both conversion and selectivity at each point within a
defined range.
We first used a case study to determine the optimal reaction temperature for the
reaction with the new catalyst. We varied the reactor inlet temperature between 200°C
and 400°C, because we would need special materials for a temperature above 400°C. The
single-pass conversion of benzene in the reactor train over this temperature range can be
seen in Figure 5, while the selectivity of ethylbenzene over diethylbenzene is shown in
Figure 6.
Page 24
16
Figure 5: Case study results for the effect of temperature on conversion of benzene, using
the new catalyst.
Figure 6: Case study results for the effect of temperature on selectivity of ethylbenzene
over diethylbenzene, using the new catalyst.
0
0.1
0.2
0.3
0.4
0.5
0.6
0.7
0.8
0.9
1
200 220 240 260 280 300 320 340 360 380 400
Sin
gle-
Pass
Co
nve
rsio
n o
f B
enze
ne
Reactor Inlet Temperature (°C)
0
100000
200000
300000
400000
500000
600000
200 220 240 260 280 300 320 340 360 380 400
Sele
ctiv
ity
(mo
l EB
/mo
l DEB
)
Reactor Inlet Temperature (°C)
Page 25
17
The results of these analyses convinced us that the optimal reactor temperature
was 400°C because it would maximize both conversion and selectivity. However,
because the reaction is exothermic, we had to be careful that the effluent temperatures did
not exceed 500°C, a temperature specified by the manufacturers of the new catalyst.
We also wanted to optimize the pressure of the reactor feed to maximize
conversion and selectivity. We once again used a case study to vary the pressure from
200 kPa to 2,000 kPa, calculating conversion and selectivity at each point. We chose a
maximum pressure of 2,000 kPa to avoid needing more expensive materials and higher
pressure ratings on the reactors. Figure 7 and Figure 8 show the effect of varying the
pressure on conversion and selectivity, respectively. These two figures clearly show that
over the examined pressure range, the maximum conversion and selectivity occur at
2,000 kPa, although the conversion appears to level off after 1400 kPa.
Figure 7: Case study results showing the effect of pressure on conversion of benzene,
using the new catalyst.
0
0.1
0.2
0.3
0.4
0.5
0.6
0.7
0.8
0.9
1
200 400 600 800 1000 1200 1400 1600 1800 2000
Co
nve
rsio
n o
f B
enze
ne
Pressure (kPa)
Page 26
18
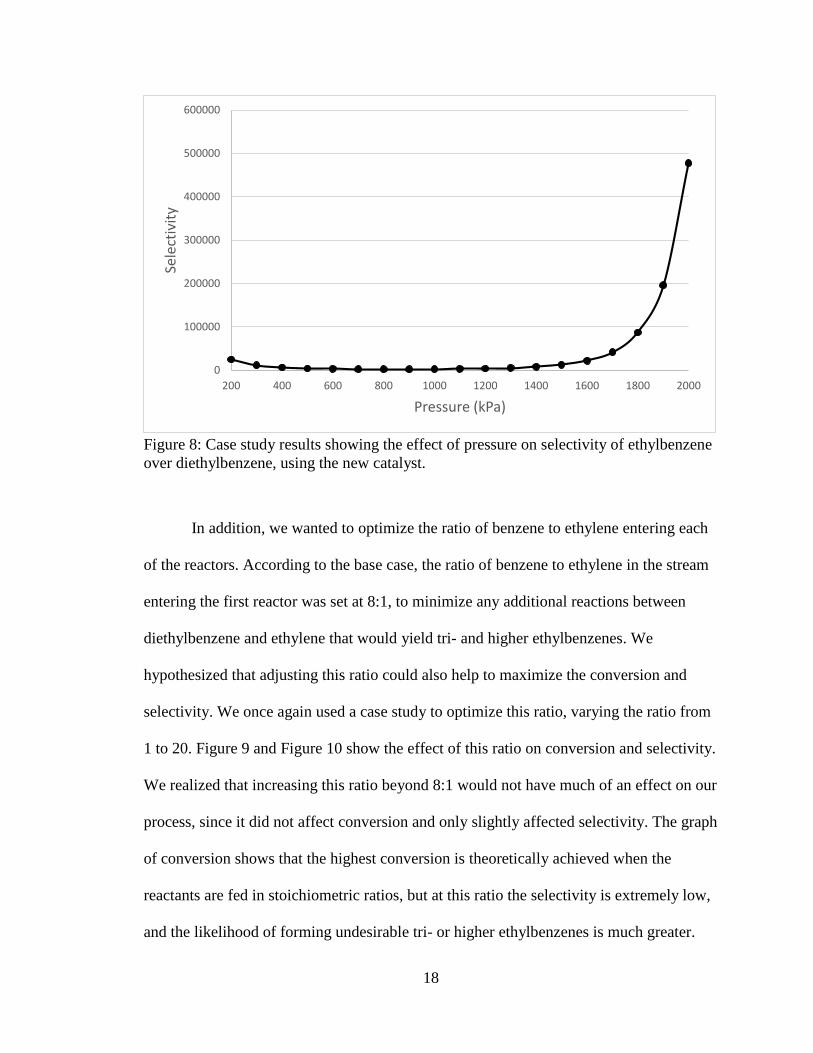
Figure 8: Case study results showing the effect of pressure on selectivity of ethylbenzene
over diethylbenzene, using the new catalyst.
In addition, we wanted to optimize the ratio of benzene to ethylene entering each
of the reactors. According to the base case, the ratio of benzene to ethylene in the stream
entering the first reactor was set at 8:1, to minimize any additional reactions between
diethylbenzene and ethylene that would yield tri- and higher ethylbenzenes. We
hypothesized that adjusting this ratio could also help to maximize the conversion and
selectivity. We once again used a case study to optimize this ratio, varying the ratio from
1 to 20. Figure 9 and Figure 10 show the effect of this ratio on conversion and selectivity.
We realized that increasing this ratio beyond 8:1 would not have much of an effect on our
process, since it did not affect conversion and only slightly affected selectivity. The graph
of conversion shows that the highest conversion is theoretically achieved when the
reactants are fed in stoichiometric ratios, but at this ratio the selectivity is extremely low,
and the likelihood of forming undesirable tri- or higher ethylbenzenes is much greater.
0
100000
200000
300000
400000
500000
600000
200 400 600 800 1000 1200 1400 1600 1800 2000
Sele
ctiv
ity
Pressure (kPa)
Page 27
19
Figure 9: Case study results showing the effect of the ratio of benzene to ethylene in the
first reactor feed on conversion of benzene.
Figure 10: Case study results showing the effect of the ratio of benzene to ethylene in the
first reactor feed on selectivity.
0
0.2
0.4
0.6
0.8
1
1 3 5 7 9 11 13 15 17 19
Co
nve
rsio
n o
f B
enze
ne
Ratio of Benzene to Ethylene in Reactor Feed
0
50000
100000
150000
200000
250000
300000
350000
1 3 5 7 9 11 13 15 17 19
Sele
ctiv
ity
Ratio of Benzene to Ethylene in Reactor Feed
Page 28
20
While we previously proved that using 400°C as the inlet temperature for our
reactors would give us the maximum conversion and selectivity, we also wanted to justify
that we would actually need a temperature of 400°C to achieve the 2 ppm diethylbenzene
specification for our product. We did this with another case study, this time plotting the
flow rate of diethylbenzene leaving the reactor train versus the inlet temperature. In
Figure 11, the dashed line represents the flow rate of diethylbenzene that would result in
a 2 ppm diethylbenzene product, which was 0.000181 kmol/hr, while the solid line
represents the diethylbenzene leaving the reactor train. The rate of diethylbenzene
produced only falls below the 2 ppm limit when the temperature is below 225°C or above
400°C, and since we had already found that the highest conversion and selectivity occur
at higher temperatures, we concluded that we would in fact need to operate at 400°C to
achieve the required product composition of diethylbenzene.
Figure 11: Close-up graph of the rate of diethylbenzene leaving the reactor train
(kmol/hr) as a function of temperature. The dashed line shows the required flow rate of
diethylbenzene to achieve a 2 ppm diethylbenzene product.
0.000
0.001
0.001
0.002
0.002
0.003
0.003
0.004
0.004
200 250 300 350 400
Rat
e o
f D
EB (
kmo
l/h
r)
Temperature (°C)
DEB Produced
DEB Required
Page 29
21
We performed the same analysis on the reactor pressure, to prove that we would
need a pressure of 2000 kPa to achieve a 2 ppm diethylbenzene product. The results of
this case study are in Figure 12. Once again, we were able to prove that we would need
inlet pressures of 2000 kPa to achieve the correct product purity.
Figure 12: Close-up graph of the rate of diethylbenzene leaving the reactor train
(kmol/hr) as a function of pressure. The dashed line shows the required flow rate of
diethylbenzene to achieve a 2 ppm diethylbenzene product.
Because of our extensive analysis of the required inlet temperatures for the
reactors, we decided to position the fired heater so that it would heat the mixed stream of
the benzene feed and the first portion of the ethylene feed. Even though increasing the
flow rate through the fired heater increased the duty on the heater, we decided that this
was an important change to make to ensure that the inlet temperature of the first reactor
would be 400°C.
0
0.0005
0.001
0.0015
0.002
0.0025
0.003
0.0035
0.004
200 700 1200 1700
Rat
e o
f D
EB (
kmo
l/h
r)
Pressure (kPa)
DEB Produced
DEB Required
Page 30
22
Although we had already determined that the ratio of benzene to ethylene in the
feed to the first reactor should be 8:1 and used this ratio in a controller to set the
specification for the first splitter on Stream 2, we needed to determine the best
specification for the second splitter, which determines the flow rate of ethylene feed
entering the second reactor. We added a second controller to the process to control the
second splitter specification by setting the ratio of benzene to ethylene in the feed to the
second reactor at 4:1. We found this value through trial and error, focusing on keeping
the outlet temperature of the reactors below 500°C, while still achieving the desired
product. Because the reactions are exothermic, as more material is converted, more heat
is released, and the high ratios set by these two controllers suppress the conversion and
control the exiting temperatures from the reactors. This allowed us to use a ratio of just
under 1.5:1 for our third reactor, giving us maximum conversion without overheating the
catalyst and without producing too much diethylbenzene. We were able to increase our
overall conversion of benzene from 91.67% in the base case to 97.75% in our optimized
design and therefore save a significant amount of money on raw materials.
Separation Section
In the base case, a control valve decreased the pressure of the process stream
exiting the reactor train from 1,840 kPa to 110 kPa before entering the separation section.
We considered replacing this valve with a turbine in order to produce additional energy to
be consumed in our process, but we found that a turbine at this location would only
produce 19.4 kW of shaft work, which would only generate approximately $6,000 per
year as credit for the cost of utilities. The least expensive turbine we could purchase
Page 31
23
would be $379,000. Therefore, there would be no profit over the length of the project
from switching to the turbine, since the utility credit generated from its use would be
unable to offset its initial capital cost, so we decided to leave the valve in our optimized
design.
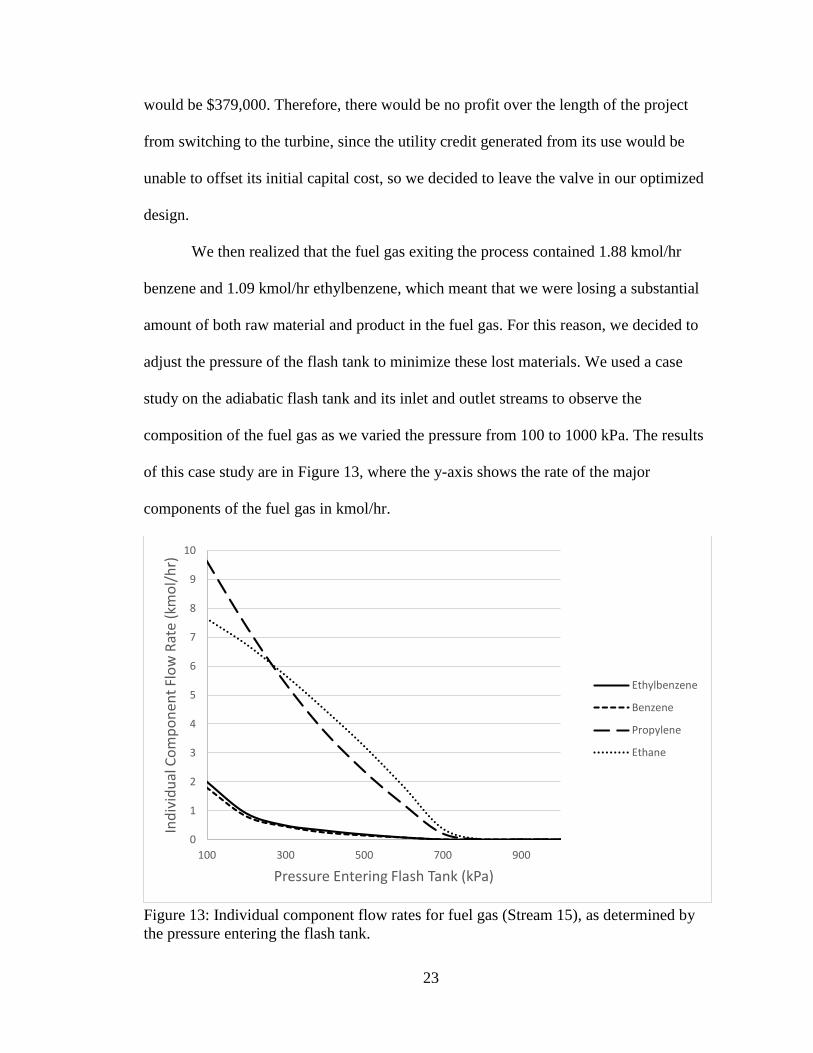
We then realized that the fuel gas exiting the process contained 1.88 kmol/hr
benzene and 1.09 kmol/hr ethylbenzene, which meant that we were losing a substantial
amount of both raw material and product in the fuel gas. For this reason, we decided to
adjust the pressure of the flash tank to minimize these lost materials. We used a case
study on the adiabatic flash tank and its inlet and outlet streams to observe the
composition of the fuel gas as we varied the pressure from 100 to 1000 kPa. The results
of this case study are in Figure 13, where the y-axis shows the rate of the major
components of the fuel gas in kmol/hr.
Figure 13: Individual component flow rates for fuel gas (Stream 15), as determined by
the pressure entering the flash tank.
0
1
2
3
4
5
6
7
8
9
10
100 300 500 700 900
Ind
ivid
ual
Co
mp
on
ent
Flo
w R
ate
(km
ol/
hr)
Pressure Entering Flash Tank (kPa)
Ethylbenzene
Benzene
Propylene
Ethane
Page 32
24
From this graph, we realized that we could increase the pressure in the flash tank
to keep the majority of the benzene and ethylbenzene in the liquid, but doing so would
also keep more of the light gases (propylene and ethane) in the liquid, causing them to
build up in the process. We found that increasing the pressure entering the flash tank to
just 200 kPa actually increased the amount of benzene in the fuel gas above 2 kmol/hr,
due to the additional benzene being recycled to the beginning of the process. Increased
flow rates of benzene and the light gases would also require larger equipment and higher
duties for the entire process, so for these reasons we decided to keep the flash drum’s
inlet pressure at its original 110 kPa.
We also explored the option of increasing the pressure drop across the flash drum
to lower the amount of benzene and ethylbenzene leaving as fuel gas. However, a case
study on the effect of pressure drop on the flow rates of these two components leaving the
flash drum showed that increasing the pressure drop only increased the amount of
benzene and ethylbenzene we were losing. The results of this case study are in Figure 14.
As shown in the graph, our losses were minimized at a pressure drop of 0 kPa. Because
the flash drum is adiabatic and there are no heuristics available for the flash drum, we
kept this pressure drop value.
Page 33
25
Figure 14: Case study results showing the effect of varying the pressure drop across the
flash drum on the flow rates of benzene and ethylbenzene in the fuel gas leaving the
process.
Because of the higher selectivity achieved by using the new catalyst, we were able
to remove the second distillation column from our design, as well as the second recycle
stream. We were also able to eliminate several pieces of equipment associated with this
recycle stream, including the fourth reactor and the second duty on the fired heater, as
well as the pump that was previously used to increase the pressure of the feed to the
fourth reactor. While reducing equipment did not affect the net present value
significantly, since the net present value is not very sensitive to one-time equipment
costs, removing this equipment dramatically improved our utility costs by lessening the
duty needed for the fired heater.
After removing all of the unnecessary equipment, we performed further
optimizations on the remaining distillation column. We used heuristics to resize the
0
2
4
6
8
10
12
14
0 20 40 60 80 100
Co
mp
on
ent
Flo
w R
ate
(km
ol/
hr)
Pressure Drop (kPa)
Ethylbenzene
Benzene
Page 34
26
column and found that for our desired separation, we would theoretically need at least 11
trays. To decide on the feed tray location, we used PRO/II to perform a case study to find
the feed location that would minimize the utility costs for the column, which consisted of
the cost of low pressure steam for the reboiler and the cost of cooling water for the
condenser. From Figure 15, we found that feeding to the condenser minimized the utility
costs for the column. However, the column does not converge until fed at tray 6. Based
on the results from the graph, the difference in utility costs is small between these two
locations, so we concluded that this feed tray location would be beneficial to the process.
Figure 15: Case study results showing the effect of feed tray location on the net duty of
the distillation column.
The distillate stream exiting the column was another point of concern for our
process. The stream exiting the top of the column had to be pure vapor because the
0
200
400
600
800
1000
1200
1400
1600
1800
2000
1 2 3 4 5 6 7 8 9 10 11
Co
st o
f U
tilit
ies
($/h
r)
Feed Tray Location
Page 35
27
temperature would otherwise be lower than the minimum temperature of utilities
available to the plant. In order to send the distillate back to the beginning of the process
as the benzene recycle, we had to add a compressor with an after-cooler to the distillate
that condensed it to a liquid while cooling it to a temperature above the 40°C temperature
limit for cooling water. To minimize the work needed for the compressor, we ran a case
study in PRO/II to determine the lowest outlet pressure that would produce a pure liquid
recycle and found that 220 kPa was the best option. Figure 16 shows the results of this
case study.
Figure 16: Case study results showing the fraction of liquid in the recycle stream as a
function of the outlet pressure of the compressor.
One of our additional constraints was to maintain the temperatures in the reactors
below 500°C, which was difficult because the reaction was exothermic, and we wanted to
have inlet temperatures of 400°C for each reactor. We decided to increase the size of the
second and third reactors to lower their outlet temperatures, which increased our initial
0.955
0.96
0.965
0.97
0.975
0.98
0.985
0.99
0.995
1
1.005
100 120 140 160 180 200 220 240 260 280 300
Liq
uid
Fra
ctio
n
Compressor Outlet Pressure (kPa)
Page 36
28
investment. However, since equipment costs have such a small effect on NPV, we
decided this was the best option for keeping the temperatures below 500°C. We also
decreased the inlet temperature of the third reactor to 315°C since most of our conversion
occurs in this reactor, due to its approximately 1.5:1 benzene to ethylene ratio, and it
causes the highest temperature increase of the three reactors.
Our last optimization was to minimize the flow of raw materials. One of the
advantages of the new catalyst was that improving the reaction kinetics allowed us to
reduce the flow rate of raw materials fed to the plant. Because we also have a cheaper
feed cost by using the lower grade benzene, we were able to significantly impact our cost
of raw materials. We reduced the feed of benzene from 99.8 kmol/hr in the base case to
94 kmol/hr, and even though we had to raise the feed of ethylene from 100.8 kmol/hr to
107 kmol/hr, the lower price of benzene still resulted in an overall decrease for the price
of raw materials. Our purchase cost of raw materials was lowered from $84.7 million/yr
in the base case to $70.9 million/yr, which, as seen in the sensitivity analysis presented in
Figure 3, greatly improves the net present value of the project. Reducing the raw
materials consequently reduces the flow of the process stream through the fired heater,
which in turn reduces the duty on the heater. Our cost of utilities decreased from $1.95
million/yr to a credit of $0.46 million/yr.
Figure 17 is the process flow diagram of the final optimized design for the
ethylbenzene plant.
Page 37
29
Figure 17: Process flow diagram for the final optimized design.
Page 38
30
Conclusions and Recommendations
On the basis of our economic analysis of each process and the process feasibility,
we recommend using both the new catalyst and the lower purity benzene feed to improve
the ethylbenzene plant. Together, these changes raise the net present value of the project
from a loss of $10.7 million to a profit of $50.9 million. The cost of the raw materials
required for the process is reduced from $84.7 million/yr to $70.9 million/yr. Eliminating
several pieces of equipment, including the second distillation column, the second recycle
stream, and the fourth reactor, significantly reduces the utilities cost, from $1.95
million/yr to a credit of $0.46 million/yr. Overall, we estimate that our recommended
changes would improve the value of the base case design by over $60 million, but
because the nature of our analysis produces results that are ±25% of the actual net present
value, we recommend further analysis before taking any action on our design.
Page 39
31
BIBLIOGRAPHY
[1] R. Turton, Analysis, Synthesis, and Design of Chemical Processes, 4th ed., Upper
Saddle River, NJ: Prentice Hall, 2012.
[2] C. S. Park, Contemporary Engineering Economics, 5th ed., Boston: Prentice Hall,
2011.


![5 Styrene and Ethylbenzene Le 2008[1] Edited](https://static.documents.pub/doc/80x56/55cf8d175503462b13920488/5-styrene-and-ethylbenzene-le-20081-edited.jpg)


