90
Appendix P Appendix P Evaluation of Physiologically Based Pharmacokinetic Models of Ethylbenzene for Application in VCCEP Assessment P-1
Appendix P
Appendix P Evaluation of Physiologically Based
Pharmacokinetic Models of Ethylbenzene for Application in VCCEP Assessment
P-1
Appendix P
EXECUTIVE SUMMARY Due to the substantial impact and diversity of the physiologically based pharmacokinetic (PBPK) model applications in the ethylbenzene VCCEP risk assessment, a thorough review and evaluation of the PBPK models for ethylbenzene is provided to delineate their strengths, limitations and range of applicability. For simulations of kinetics in Sprague-Dawley rats, the model of Krishnan and colleagues is preferred over the Dennison model because it more accurately predicts blood levels of ethylbenzene. There are, however, limitations to the circumstances under which the Krishnan rat model can be applied reliably. The Krishnan model can be used with high confidence for adult SD rats at concentrations at or below 200 ppm, moderate-to-high confidence for adult SD rats between 200 and 650 ppm. The oral model can be used with confidence for doses up to 180 mg/kg. The Dennison model produced a superior fit to data sets collected using F344 rats, as compared to the Krishnan model performance. The Dennison model can be used with moderate confidence for F344 rats at low to intermediate concentrations, but cannot be confidently used for high concentrations. However, none of the key studies in the VCCEP risk assessment require simulation of toxicokinetics in F344 rats. Given that there is some evidence for strain differences based on the modeling of F344 and Sprague-Dawley rats, the question of which model to use for other strains of rats needs to be considered. Of greatest relevance to the current effort is consideration of Wistar rats, which were used in the key oral noncancer study (Mellert et al., 2004). Based on the studies of urinary excretion of metabolites and the total amount of metabolism by Wistar rats, the models were equally successful. The Krishnan model, however, performed significantly better in predicting the post exposure exhalation of ethylbenzene. Based on this evaluation, we recommend the use of the Krishnan model for Wistar rats. The mouse model (Nong et al., 2006) adequately describes the blood and tissue kinetics of ethylbenzene in mice exposed to 75 to 750 ppm ethylbenzene in single or repeated exposures. Nong et al. (2006) have noted uncertainty with regard to the precise location of the extensive extrahepatic metabolism that is evident for ethylbenzene-exposed mice. This model can be confidently used to estimate blood and tissue ethylbenzene concentrations, and liver and whole-body metabolism for acute and repeated exposures up to 750 ppm ethylbenzene. The development of alternative descriptions of extrahepatic metabolism allowed for conservative estimation of lung metabolism for acute and repeated exposures up to 750 ppm. The human model assumes a body weight-normalized metabolic rate equivalent to that determined for Sprague-Dawley rats (Tardif et al., 1997). Although this assumption was initially validated only against blood and breath data from a 33-ppm exposure, the model was found to predict data from low level occupational exposures and higher concentration volunteer exposures with acceptable accuracy. Based on the ability of the model to reproduce blood concentrations from the low-level, occupational exposures, the PBPK model can be used with high confidence for humans exposed to ethylbenzene at all exposure levels expected to be relevant to the VCCEP analyses.
P-2
Appendix P
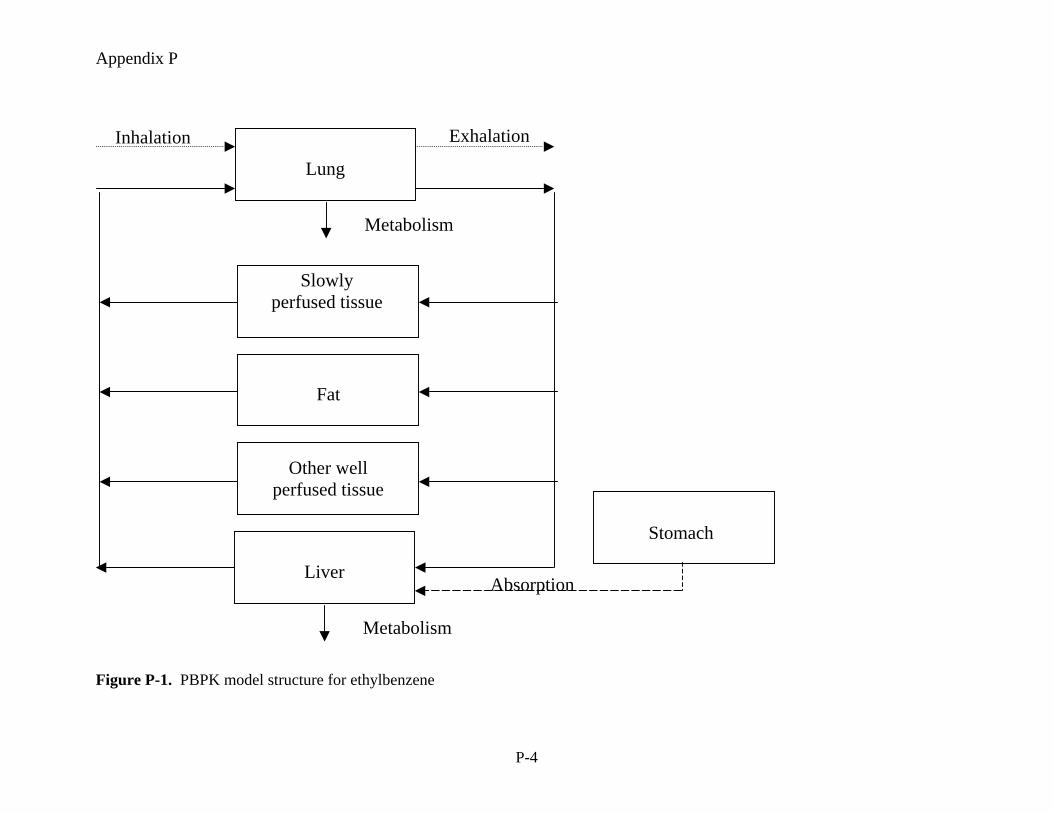
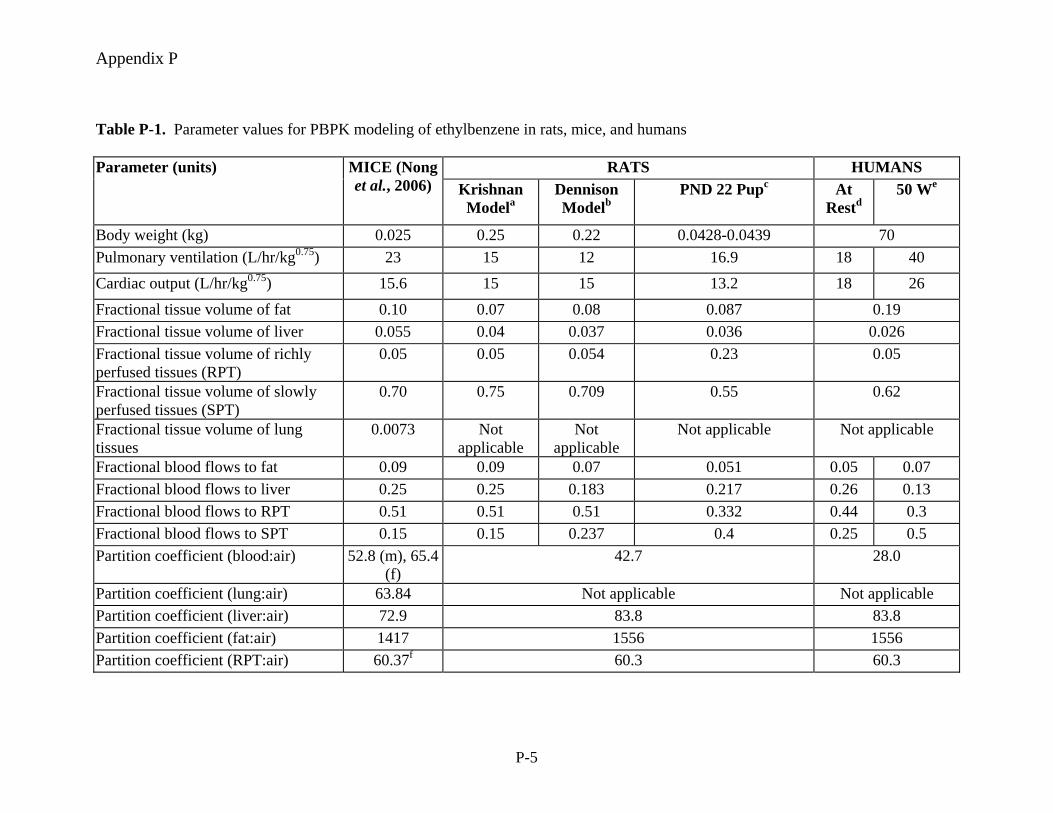
INTRODUCTION Physiologically-based pharmacokinetic (PBPK) models are useful tools that may be applied in a variety of risk assessment contexts (U.S. EPA, 2006). For this VCCEP assessment, PBPK models have been used to estimate the levels of ethylbenzene in human breast milk consumed by infants (Section 6.1.3; Appendix N); for calculation of inputs to rodent dose-response evaluations, interspecies extrapolation, and route-to-route extrapolation in the derivation of human toxicity reference values (Section 8); and as an aid in interpreting ethylbenzene biomonitoring data (Appendix R). Due to the substantial impact and diversity of the PBPK model applications in the ethylbenzene VCCEP risk assessment, a thorough review and evaluation of the PBPK models for ethylbenzene is provided to delineate their strengths, limitations and range of applicability. Two PBPK models for ethylbenzene disposition in rats were identified from the literature. The first was developed at the University of Montreal by Kannan Krishnan and co-workers (Krishnan model; Tardif et al., 1997; Haddad et al., 1999, 2000; Faber et al., 2006 and unpublished data). The second was developed at Colorado State University by Jim Dennison (Dennison model; Dennison et al., 2003). The models have the same structure (i.e., same compartments) (Figure P-1) and used the same blood:air and tissue:air partition coefficient values; physiological parameters (blood flows, ventilation rate, tissue volumes) were slightly different between the models (Table P-1). Both models were developed to describe kinetics of a single exposure to inhaled ethylbenzene as a single chemical or in a mixture with other hydrocarbons, but the models were developed using different types of data. The Krishnan model was initially developed using concentrations of ethylbenzene in blood collected after inhalation exposure of male Sprague-Dawley rats (Tardif et al., 1996). Kinetic parameters for this model were refined based on additional studies of interactions among chemicals in mixtures (Haddad et al., 1999, 2000). The Krishnan model was extended to describe blood ethylbenzene concentrations measured after single and repeated gavage dosing (Faber et al., 2006 and Krishnan, 2002, unpublished data). For this VCCEP assessment, the Krishnan rat model was modified slightly, with the addition of a second, low-affinity metabolism pathway in the liver, to improve simulations of model simulations of blood concentration at higher (>200 ppm) exposure concentrations (described in greater detail below). The Dennison model was developed using closed-chamber gas uptake data for male Fischer 344 (F344) rats (Dennison et al., 2003). The models have similar values for the maximal rate of metabolism, but the Michaelis constants (KMs) are very different (Table P-1). In the course of the ethylbenzene VCCEP assessment, the rat PBPK model was applied to scenarios other than those for which the models were developed. For example it was used to predict kinetics at other exposure concentrations, multi-day exposure, and to estimate dose metrics for which the model had not previously been validated such as metabolite production. For both rat models, we replicated the simulations for ethylbenzene-only exposure that were used to develop the models. We further tested the models against additional published data from the literature and unpublished data.
P-3
Appendix P
Lung
Slowly perfused tissue
Fat
Other well perfused tissue
Liver
Metabolism
Stomach
Inhalation Exhalation
Absorption
Metabolism
Figure P-1. PBPK model structure for ethylbenzene
P-4
Appendix P
Table P-1. Parameter values for PBPK modeling of ethylbenzene in rats, mice, and humans Parameter (units) RATS HUMANS MICE (Nong
et al., 2006) Krishnan Modela
Dennison Modelb
PND 22 Pupc At Restd
50 We
Body weight (kg) 0.025 0.25 0.22 0.0428-0.0439 70 Pulmonary ventilation (L/hr/kg0.75) 23 15 12 16.9 18 40 Cardiac output (L/hr/kg0.75) 15.6 15 15 13.2 18 26 Fractional tissue volume of fat 0.10 0.07 0.08 0.087 0.19 Fractional tissue volume of liver 0.055 0.04 0.037 0.036 0.026 Fractional tissue volume of richly perfused tissues (RPT)
0.05 0.05 0.054 0.23 0.05
Fractional tissue volume of slowly perfused tissues (SPT)
0.70 0.75 0.709 0.55 0.62
Fractional tissue volume of lung tissues
0.0073 Not applicable
Not applicable
Not applicable Not applicable
Fractional blood flows to fat 0.09 0.09 0.07 0.051 0.05 0.07 Fractional blood flows to liver 0.25 0.25 0.183 0.217 0.26 0.13 Fractional blood flows to RPT 0.51 0.51 0.51 0.332 0.44 0.3 Fractional blood flows to SPT 0.15 0.15 0.237 0.4 0.25 0.5 Partition coefficient (blood:air) 52.8 (m), 65.4
(f) 42.7 28.0
Partition coefficient (lung:air) 63.84 Not applicable Not applicable Partition coefficient (liver:air) 72.9 83.8 83.8 Partition coefficient (fat:air) 1417 1556 1556 Partition coefficient (RPT:air) 60.37f 60.3 60.3
P-5
Appendix P
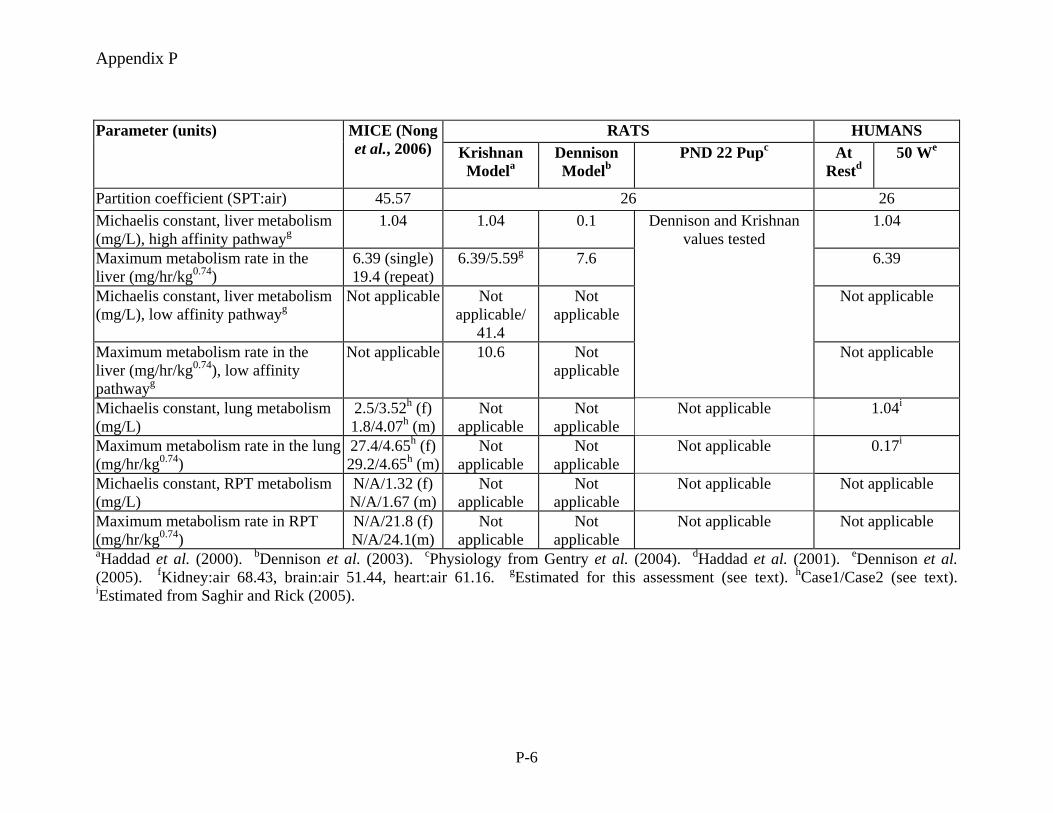
Parameter (units) RATS HUMANS MICE (Nong et al., 2006) Krishnan
Modela Dennison Modelb
PND 22 Pupc At Restd
50 We
Partition coefficient (SPT:air) 45.57 26 26 Michaelis constant, liver metabolism (mg/L), high affinity pathwayg
1.04 1.04 0.1 1.04
Maximum metabolism rate in the liver (mg/hr/kg0.74)
6.39 (single) 19.4 (repeat)
6.39/5.59g 7.6 6.39
Michaelis constant, liver metabolism (mg/L), low affinity pathwayg
Not applicable Not applicable/
41.4
Not applicable
Not applicable
Maximum metabolism rate in the liver (mg/hr/kg0.74), low affinity pathwayg
Not applicable 10.6 Not applicable
Dennison and Krishnan values tested
Not applicable
Michaelis constant, lung metabolism (mg/L)
2.5/3.52h (f) 1.8/4.07h (m)
Not applicable
Not applicable
Not applicable 1.04i
Maximum metabolism rate in the lung (mg/hr/kg0.74)
27.4/4.65h (f)29.2/4.65h (m)
Not applicable
Not applicable
Not applicable 0.17i
Michaelis constant, RPT metabolism (mg/L)
N/A/1.32 (f) N/A/1.67 (m)
Not applicable
Not applicable
Not applicable Not applicable
Maximum metabolism rate in RPT (mg/hr/kg0.74)
N/A/21.8 (f) N/A/24.1(m)
Not applicable
Not applicable
Not applicable Not applicable
aHaddad et al. (2000). bDennison et al. (2003). cPhysiology from Gentry et al. (2004). dHaddad et al. (2001). eDennison et al. (2005). fKidney:air 68.43, brain:air 51.44, heart:air 61.16. gEstimated for this assessment (see text). hCase1/Case2 (see text). iEstimated from Saghir and Rick (2005).
P-6
Appendix P
The mouse PBPK model for ethylbenzene was developed by Nong et al. (2006). Mouse physiological parameters were obtained from the literature and partition coefficients were measured in vitro for blood (male and female) and tissues (male fat, muscle, liver, lung, brain, kidney, and heart) were measured. The maximal rate of hepatic metabolism (normalized by BW0.75) and Michaelis constant in uninduced mice was assumed to be equal to that in rats (Haddad et al., 2000, 2001). Parameter sets were developed for two approaches to estimating extrahepatic metabolism. In case 1, it is assumed that all extrahepatic metabolism takes place in the lung. In case 2, pulmonary metabolism was estimated by scaling the amounts of measured metabolites measured at the highest concentration tested in vitro (Saghir and Rick, 2005) and scaling based on microsomal protein content of the lung (as described under “Methods”) and additional extrahepatic metabolism (VMAXR and KMR) was also assumed in RPT. For case 2, the whole-lung Vmax (normalized to body weight) was estimated using the mouse lung microsomal protein yield of Boogaard et al. (2000) and default adult tissue weight and body weight (Table P-1). By optimizing the fit to the blood time course of ethylbenzene in male and female mice exposed once to 75, 200, 500 or 1000 ppm ethylbenzene for 4 hrs (Charest-Tardif et al., 2006), other metabolic parameters were determined (for case 1, pulmonary Vmax and KM; for case 2, pulmonary KM, and RPT Vmax and KM). These parameters were validated by comparison to additional blood time courses for mice exposed once (Charest-Tardif et al., 2006). For repeated exposure, liver metabolism was increased by 3x based on the fit to blood ethylbenzene concentration time courses for mice repeatedly exposed to 750 ppm ethylbenzene (Charest-Tardif et al., 2006). This adjustment was validated by comparison to the post exposure blood and tissue ethylbenzene concentrations measured by Fuciarelli (2000) in repeatedly-exposed mice. The human PBPK model for ethylbenzene was developed by Tardif et al. (1997) using the same metabolic rates developed for rats with human-specific physiological parameters and a measured human blood:air partition coefficient. As noted above for the rat model, the metabolism parameters were subsequently modified slightly to optimize fit to data sets developed for mixtures (Haddad et al., 2000, 2001). Dennison et al. (2003) applied this same model (with the original values for metabolism parameters) to simulate “resting” conditions and modified alveolar ventilation rate, cardiac output, and blood flow distribution to simulate light work (50 W). Jang et al. (2001) applied the metabolism parameters determined by Tardif et al. (1997) to a seven-compartment PBPK model (lung, muscle and skin, fat, brain, kidneys, liver, and other tissues). The measured blood:air partition coefficient of Sato and Nakajima (1979) was used, but other tissue:air partition coefficients were estimated from the blood:air, olive oil:air and water:air partition coefficients, rather than using measured values. The presentation of the model is confusing because authors provided alveolar ventilation and cardiac output rates for both resting and 50W, but only provided blood flow rates (L/h) for resting, and did not say which activity level was used in the modeling. Because the Jang model was not tested against new data and the partition coefficients were estimated rather than measured, we did not test its performance against the available human data sets. Sweeney and Gargas (2006) made minor adjustments to the human PBPK model for ethylbenzene in order to make predictions of lactational transfer of ethylbenzene to
P-7
Appendix P
children of ethylbenzene-exposed mothers. Details are provided in Appendix N. Due to the interest in the lung as a potential target organ for ethylbenzene toxicity (NTP, 1999; Sections 7 and 8), an estimate of human lung metabolism of ethylbenzene was made by scaling in vitro data (Saghir and Rick, 2005) and incorporated into the PBPK model. This estimate is discussed in greater detail below. The validity of some of the partition coefficients (PC) used in the models was evaluated by comparison to additional data not used in the models. Sensitivity analyses were conducted for key dose metrics used to derive toxicity reference values on the basis of effects observed in rodent studies (Section 8). The sensitivity of these dose metrics to alterations in parameter values for humans exposed to ethylbenzene at the RfC or RfD was also determined. These results were used to evaluate the adequacy of the toxicity reference values (which were derived for adults) for children. METHODS A literature review was conducting using MEDLINE and TOXLINE. Some unpublished data was available from the sponsor and performing laboratory. Numerical data were provided by Kannan Krishnan (Tardif et al., 1996, 1997 data) and Jim Dennison (Dennison et al., 2003). Data from other publications were either taken from tables or estimated using Plot Digitizer. Model simulations were conducting using ACSL Math 11.8.4 (AEgis Technologies, Inc.). Parameters for adult rats were taken from the model publications (Haddad et al., 2000, Dennison et al., 2003), with the exception of study-specific body weights, and the addition of a second, low-affinity metabolism pathway to the Krishnan model. The Michaelis constant (KM) for the low-affinity pathway was assumed equal to the average KM of the low affinity pathway as derived by Sams et al. (2004) for metabolism of ethylbenzene to 1-phenylethanol by human microsomes. The maximal rates of metabolism for the two pathways were determine by optimization of fit of the model to the blood concentrations of ethylbenzene measured in rats exposed to 50, 100, 200 ppm (Tardif et al., 1996) or 500 ppm (unpublished data). Optimization was performed using ACSL Math, using the criterion of maximization of the Log Likelihood Function (LLF) using the relative error model, using the Nelder-Mead approach. Body weight for postnatal day (PND) 22 Sprague-Dawley rat pups were estimated as equal to the PND 21 body weights (Faber et al., 2006). Other anatomical and physiological parameters for PND 22 Sprague-Dawley rats (Table P-1) were estimated from data in Gentry et al. (2004). Fractional liver, and adipose tissue weights were taken from data collected for PND 22 rats. The fractional weight of the “slowly perfused” tissues (SPT) compartment was assumed to be the same as the sum of the fractional weights of the skin and muscles for 60-day old rats. Unperfused tissue was estimated as 9 percent of body weight; the volume of the rapidly-perfused tissues (RPT) compartment was estimated by difference (total body weight = sum of unperfused tissue, RPT, SPT, liver, and fat). Body weight-normalized total cardiac output (QCC) was estimated from
P-8
Appendix P
PND 22 rat data assuming scaling according to BW0.75. Body weight-normalized total pulmonary ventilation rate was derived from PND 22 rat data, again assuming scaling according to BW0.75; alveolar ventilation was estimated as two-thirds of total pulmonary ventilation. Fractional blood flows (liver, adipose, muscle and skin) were taken from data for PND 60 rats; blood flow to the richly perfused tissues was calculated by difference, as the sum of the tissue flows must equal the total cardiac output. Blood:air and tissue:air partition coefficients for PND 22 rats were assumed to be the same as for adult rats. All simulations for humans were conducted using the model parameters of Haddad et al. (2000) with the exception of data specified as having been collected under “light work” conditions and those involving lung dosimetry (i.e., lung cancer toxicity reference values). For the “light work” data set, the alveolar ventilation and blood flows of Dennison et al. (2005) were used with the metabolism parameters of Haddad et al. (2000). In order to develop dosimetry estimates for ethylbenzene metabolites potentially produced in the human lung, the rate of metabolism of ethylbenzene in the human lung was estimated. Saghir and Rick (2005) failed to detect any metabolites of ethylbenzene when human lung microsomes were incubated with 7500 ppm ethylbenzene in incubation vials. We assumed that each metabolite was present at the limit of quantitation. The whole-tissue rate (normalized to body weight) was then estimated using the human lung microsomal protein yield of Boogaard et al. (2000) and default adult tissue weight and body weight (Table P-1). The estimate of 0.17 mg/hr-kg0.74 for the lung is small as compared to the value of 6.39 mg/hr-kg0.74 assigned to the liver (Haddad et al., 2000), consistent with the validity of neglecting human lung metabolism in the context of accurately modeling blood levels of ethylbenzene in humans exposed by inhalation. No additional mouse pharmacokinetic data sets were available. We verified the reproducibility of the simulations of Nong et al. (2006) with the provided model code. Sensitivity analyses were conducted by increasing input parameters by 1 percent and determining the change in the model output of interest. Normalized sensitivity coefficients (SC) were calculated as % change output/% change input. RESULTS Partition coefficients Blood:air partition coefficients appear to have substantial species differences among mice, rats, and humans. Tardif et al. (1997) report a value of 28.0 for humans. The human blood:air partition coefficient of ethylbenzene has also been measured by Sato and Nakajima (1979) as 28.4. The blood air partition coefficient for mature rats (350 g) reported by Kumarathasan et al. (1998) (65) was somewhat higher than the value reported by Tardif et al. (1997) (42.7), but is similar to the female mouse value (65.4) (Nong et al., 2006).
P-9
Appendix P
Kumarathasan et al. (1998) report rat liver:air and muscle:air PCs of 209 and 97 for 350 g rats, values which are 2.5x and 3.7 x higher, respectively, than the Tardif et al. (1997) values. The corresponding mouse tissue:air PCs (Nong et al., 2006) are closer to the Tardif et al. (1997) values, suggesting that the discrepancies may be due to methodological differences rather than an age-related change. Tardif et al (1997) reported a rat RPT:air partition coefficient of 60.3, but did not state the tissue of origin. Kumarathasan et al. (1998) report values of 102 and 115 for brain and kidney, which are both higher that the Tardif et al. (1997) RPT value. Meulenberg et al. (2003) report a brain:air PC of 79.2 for young adult male Wistar rats. Mouse RPT:air PCs range from 51 (brain) to 68 (kidney) (Nong et al., 2006). Tardif et al. (1997), Nong et al. (2006), and Pierce et al. (1996) report very similar adipose:air PCs of 1556, 1417, and 1764 for rats, mice, and human tissues, respectively. Kumarathasan et al. (1998) report a value of 2553. With the exception of some of the Kumarathasan et al. (1998) partition coefficients (liver, muscle, and RPT), the measured partition coefficients are similar (within a factor of 2) among the studies. The values reported by Kumarathasan et al. (1998) are consistently higher than those measured by others. Kumarathasan et al. (1998) also reported tissue:blood partition coefficients for “young” rats (250 g), but in the absence of the blood:air PC, it is difficult to know how to interpret these ratios, in light of the discrepancies already noted between Kumarathasan et al. (1998) and other PC measurements. Jang et al. (2001) used a measured human blood:air (Sato and Nakajima, 1979) and estimated tissue:air PCs. Their values are generally in the range of the experimental data for partition coefficients. Their estimated human muscle and skin:air PC was 52.7, roughly 2x higher than the measure rat muscle value (Tardif et al., 1997), but similar to the measured mouse muscle value (Nong et al., 2006). In summary, the measured partition coefficients used in the models are generally consistent with other values reported in the literature; observed discrepancies may be due to methodological differences. The measured PCs of Tardif et al. (1997) were used in subsequent modeling efforts for humans and rats, and the measured mouse PCs of Nong et al. (2006) were used in modeling of that species. Refinement of the Krishnan Model A second, low-affinity pathway for metabolism of ethylbenzene in the rat liver was added to the Krishnan model. The parameters are presented in Table P-1. The resultant model simulations are discussed below, under “Rat Model Evaluation.”
P-10
Appendix P
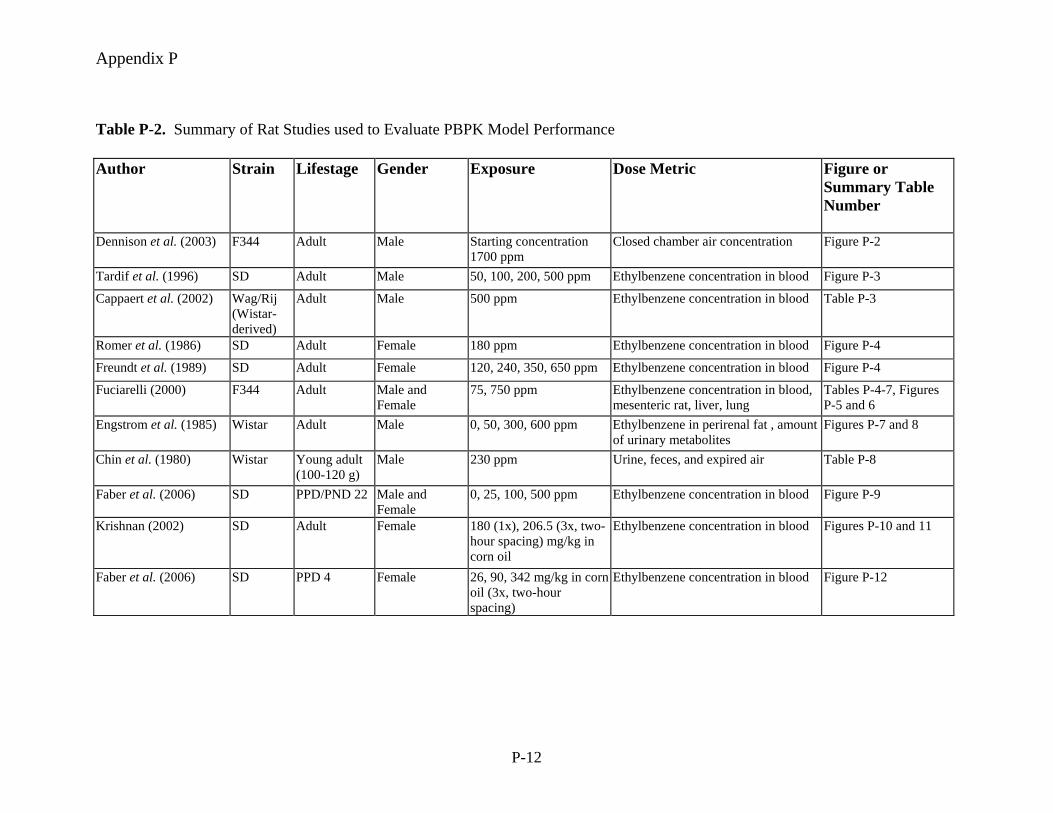
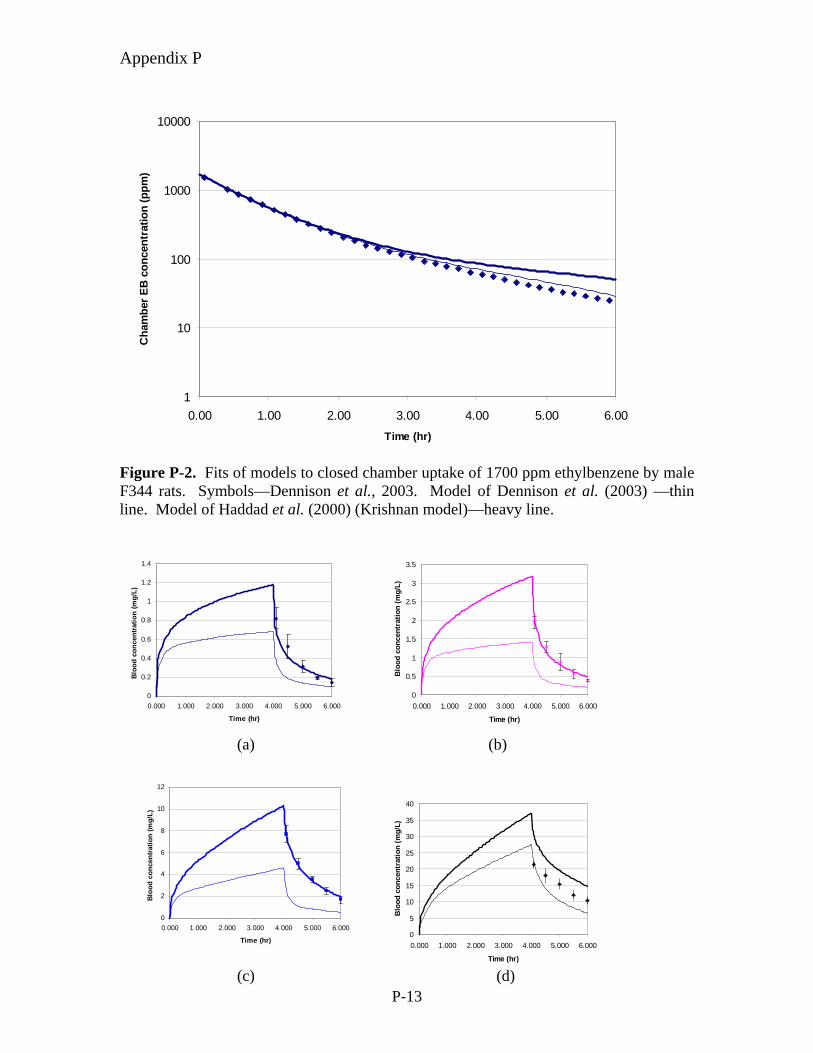
Rat Model Evaluations The rat model simulations of various data sets (summarized in Table P-2) are depicted in Figures P-2-12 and Tables P-3-8. The convention throughout the figures is that the Krishnan model simulations are depicted with heavy lines, the Dennison model predictions with thin lines. The Dennison model was not used for oral dosing predictions because optimization of the oral absorption rate constant by Krishnan and co-workers is necessarily coupled to the values of other parameters in their model. Inhalation studies Dennison et al. (2003) determined the uptake of ethylbenzene by male F344 rats in a closed chamber uptake system. Initial efforts to reproduce this data with an estimated body weight of 0.31 kg were unsuccessful (the paper reported weights of 0.29 to 0.33 kg for 8-9 week old animals). The author provided simulations that matched the published figure, but were produced with a rat body weight of 0.22 kg. When a body weight of 0.22 kg was used with the other parameters as reported by Dennison et al. (2003), we were able to reproduce an accurate simulation. The parameter values of the Krishnan model provided an equivalent fit at higher concentrations, but underpredicted chamber disappearance of ethylbenzene toward the end of the experiment (Figure P-2). Figure P-3, panels a, b, and c show how the two models predict the blood concentrations reported by Tardif et al. (1997) for male Sprague-Dawley rats. Panel d shows the predictions of an unpublished set of 500 ppm data collected by the same laboratory. As expected, the Krishnan model reproduced the data in Figure P-3 a-c accurately—this model was initially calibrated using this data set. The Dennison model consistently underpredicts these blood concentrations. Note that neither model successfully predicted the 500 ppm data. The Krishnan model overpredicted blood concentrations from the 500 ppm exposure at all times. The Dennison model accurately predicted the first post-exposure point, but the blood ethylbenzene concentration predictions then decline more rapidly than indicated by the experimental data. The addition of a second metabolism pathway (Figure P-3e, light lines) improved the fit to the blood data at a higher concentration (500 ppm) without substantially altering the fit at lower concentrations (representative simulation at 200 ppm shown). Cappaert et al. (2002) exposed Wag/Rij (Wistar-derived) rats to 500 ppm ethylbenzene for 8 hrs per day for 1 or 3 days. Measured blood concentrations were significantly different on days 1 and 3 (Table P-3). Both the Krishnan and Dennison models overpredicted the Day 1 concentrations by approximately a factor of 2. The degree of overprediction was much greater on Day 3. It has been determined that exposure to sufficiently high concentrations of ethylbenzene initially induces increased expression of CYP 2E1 and 2B1/2 in male Holtzman rats, leading to more rapid clearance of ethylbenzene. However, this induction is transient, and mRNA expression levels return to approximately baseline levels in approximately 3 days (Bergeron et al., 1999).
P-11
Appendix P
Table P-2. Summary of Rat Studies used to Evaluate PBPK Model Performance Author Strain Lifestage Gender Exposure Dose Metric Figure or
Summary Table Number
Dennison et al. (2003) F344 Adult Male Starting concentration 1700 ppm
Closed chamber air concentration Figure P-2
Tardif et al. (1996) SD Adult Male 50, 100, 200, 500 ppm Ethylbenzene concentration in blood Figure P-3
Cappaert et al. (2002) Wag/Rij (Wistar-derived)
Adult Male 500 ppm Ethylbenzene concentration in blood Table P-3
Romer et al. (1986) SD Adult Female 180 ppm Ethylbenzene concentration in blood Figure P-4
Freundt et al. (1989) SD Adult Female 120, 240, 350, 650 ppm Ethylbenzene concentration in blood Figure P-4
Fuciarelli (2000) F344 Adult Male and Female
75, 750 ppm Ethylbenzene concentration in blood, mesenteric rat, liver, lung
Tables P-4-7, Figures P-5 and 6
Engstrom et al. (1985) Wistar Adult Male 0, 50, 300, 600 ppm Ethylbenzene in perirenal fat , amount of urinary metabolites
Figures P-7 and 8
Chin et al. (1980) Wistar Young adult (100-120 g)
Male 230 ppm Urine, feces, and expired air Table P-8
Faber et al. (2006) SD PPD/PND 22 Male and Female
0, 25, 100, 500 ppm Ethylbenzene concentration in blood Figure P-9
Krishnan (2002) SD Adult Female 180 (1x), 206.5 (3x, two-hour spacing) mg/kg in corn oil
Ethylbenzene concentration in blood Figures P-10 and 11
Faber et al. (2006) SD PPD 4 Female 26, 90, 342 mg/kg in corn oil (3x, two-hour spacing)
Ethylbenzene concentration in blood Figure P-12
P-12
Appendix P
1
10
100
1000
10000
0.00 1.00 2.00 3.00 4.00 5.00 6.00Time (hr)
Cha
mbe
r EB
con
cent
ratio
n (p
pm)
Figure P-2. Fits of models to closed chamber uptake of 1700 ppm ethylbenzene by male F344 rats. Symbols—Dennison et al., 2003. Model of Dennison et al. (2003) —thin line. Model of Haddad et al. (2000) (Krishnan model)—heavy line.
0
0.5
1
1.5
2
2.5
3
3.5
0.000 1.000 2.000 3.000 4.000 5.000 6.000
Time (hr)
Blo
od c
once
ntra
tion
(mg/
L)
0
5
10
15
20
25
30
35
40
0.000 1.000 2.000 3.000 4.000 5.000 6.000
Time (hr)
Blo
od c
once
ntra
tion
(mg/
L)
0
0.2
0.4
0.6
0.8
1
1.2
1.4
0.000 1.000 2.000 3.000 4.000 5.000 6.000
Time (hr)
Blo
od c
once
ntra
tion
(mg/
L)
0
2
4
6
8
10
12
0.000 1.000 2.000 3.000 4.000 5.000 6.000
Time (hr)
Bloo
d co
ncen
tratio
n (m
g/L)
(a) (b)
(c) (d)P-13
Appendix P
0
5
10
15
20
25
30
35
40
0.000 1.000 2.000 3.000 4.000 5.000 6.000
Time (hr)
Bloo
d co
ncen
tratio
n (m
g/L)
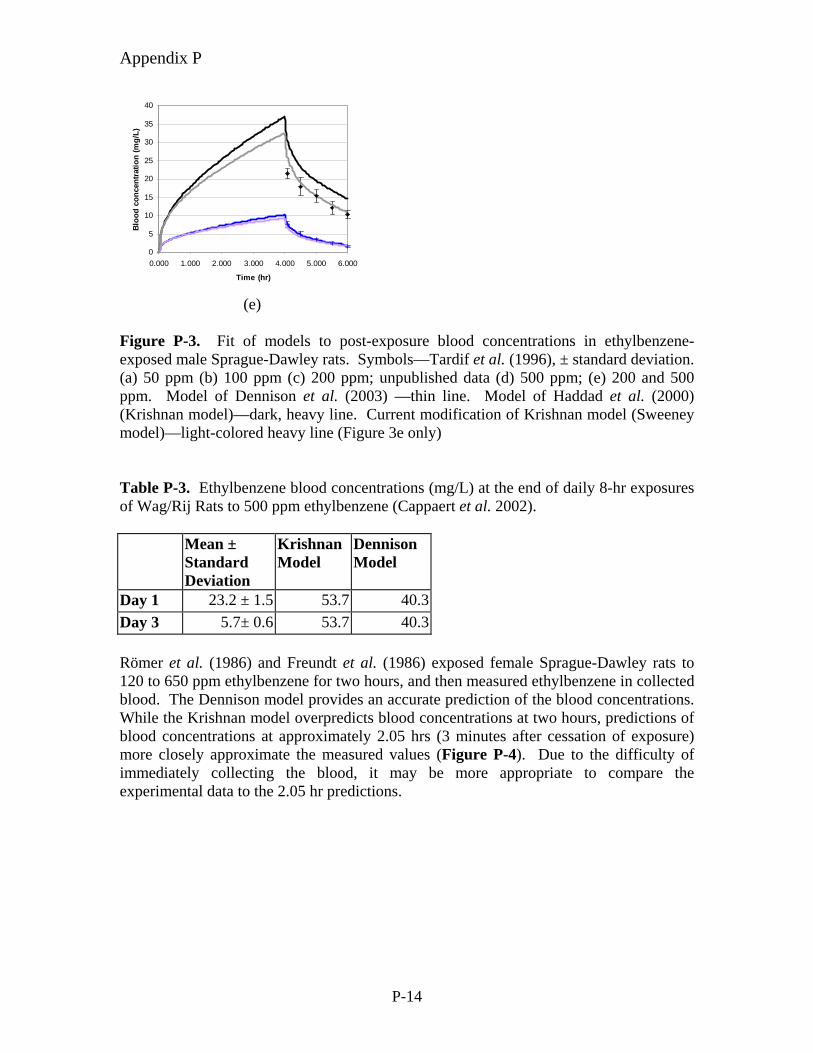
(e) Figure P-3. Fit of models to post-exposure blood concentrations in ethylbenzene-exposed male Sprague-Dawley rats. Symbols—Tardif et al. (1996), ± standard deviation. (a) 50 ppm (b) 100 ppm (c) 200 ppm; unpublished data (d) 500 ppm; (e) 200 and 500 ppm. Model of Dennison et al. (2003) —thin line. Model of Haddad et al. (2000) (Krishnan model)—dark, heavy line. Current modification of Krishnan model (Sweeney model)—light-colored heavy line (Figure 3e only) Table P-3. Ethylbenzene blood concentrations (mg/L) at the end of daily 8-hr exposures of Wag/Rij Rats to 500 ppm ethylbenzene (Cappaert et al. 2002).
Mean ± Standard Deviation
Krishnan Model
Dennison Model
Day 1 23.2 ± 1.5 53.7 40.3Day 3 5.7± 0.6 53.7 40.3 Römer et al. (1986) and Freundt et al. (1986) exposed female Sprague-Dawley rats to 120 to 650 ppm ethylbenzene for two hours, and then measured ethylbenzene in collected blood. The Dennison model provides an accurate prediction of the blood concentrations. While the Krishnan model overpredicts blood concentrations at two hours, predictions of blood concentrations at approximately 2.05 hrs (3 minutes after cessation of exposure) more closely approximate the measured values (Figure P-4). Due to the difficulty of immediately collecting the blood, it may be more appropriate to compare the experimental data to the 2.05 hr predictions.
P-14
Appendix P
0
5
10
15
20
25
30
35
40
0 200 400 600 800
Exposure concentration (ppm)
Blo
od E
B c
once
ntra
tion
(mg/
L)
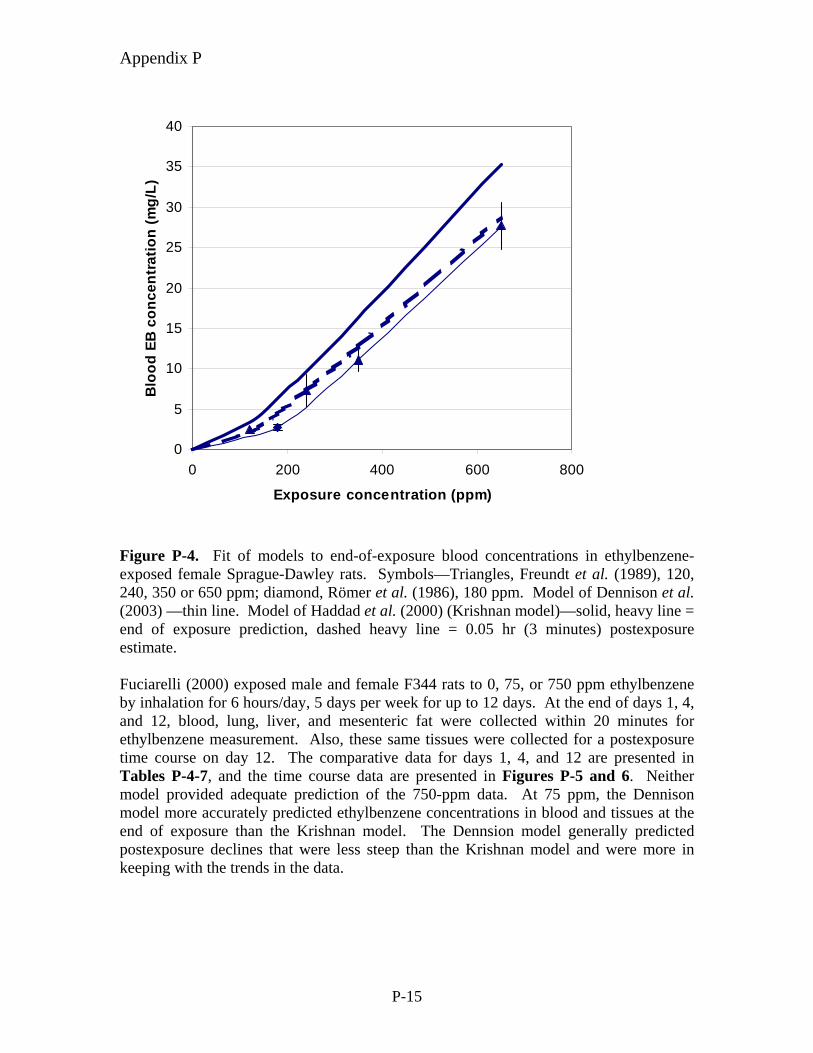
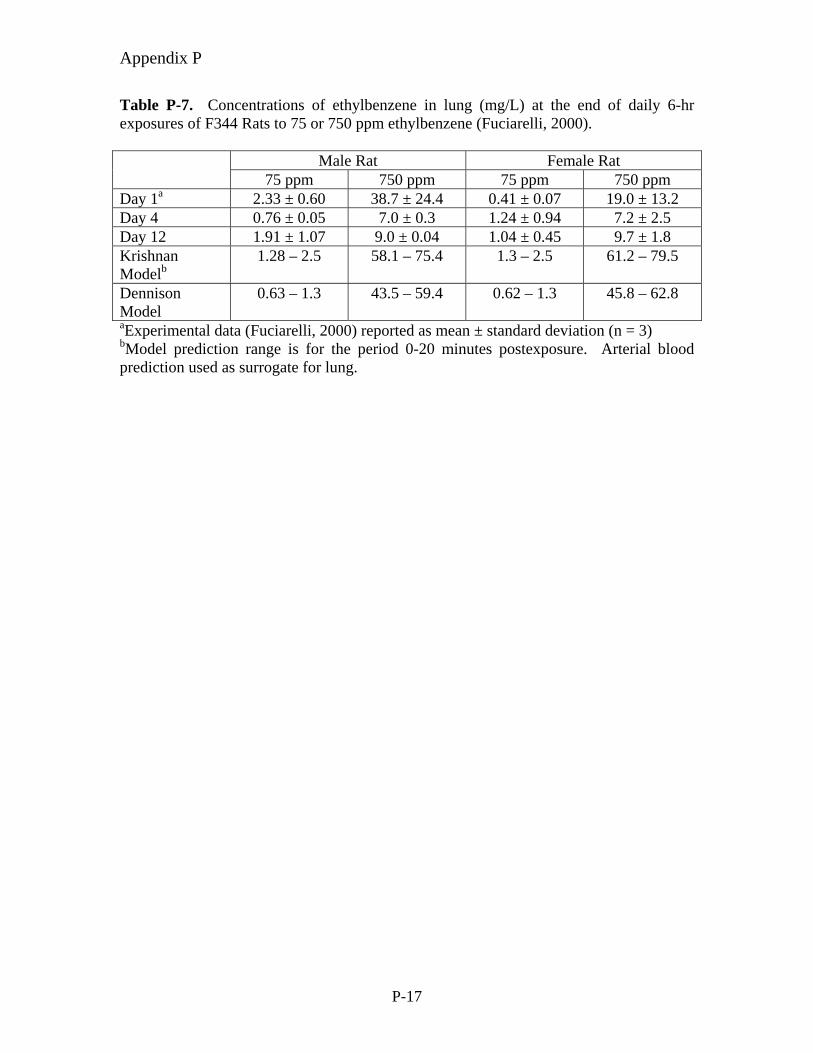
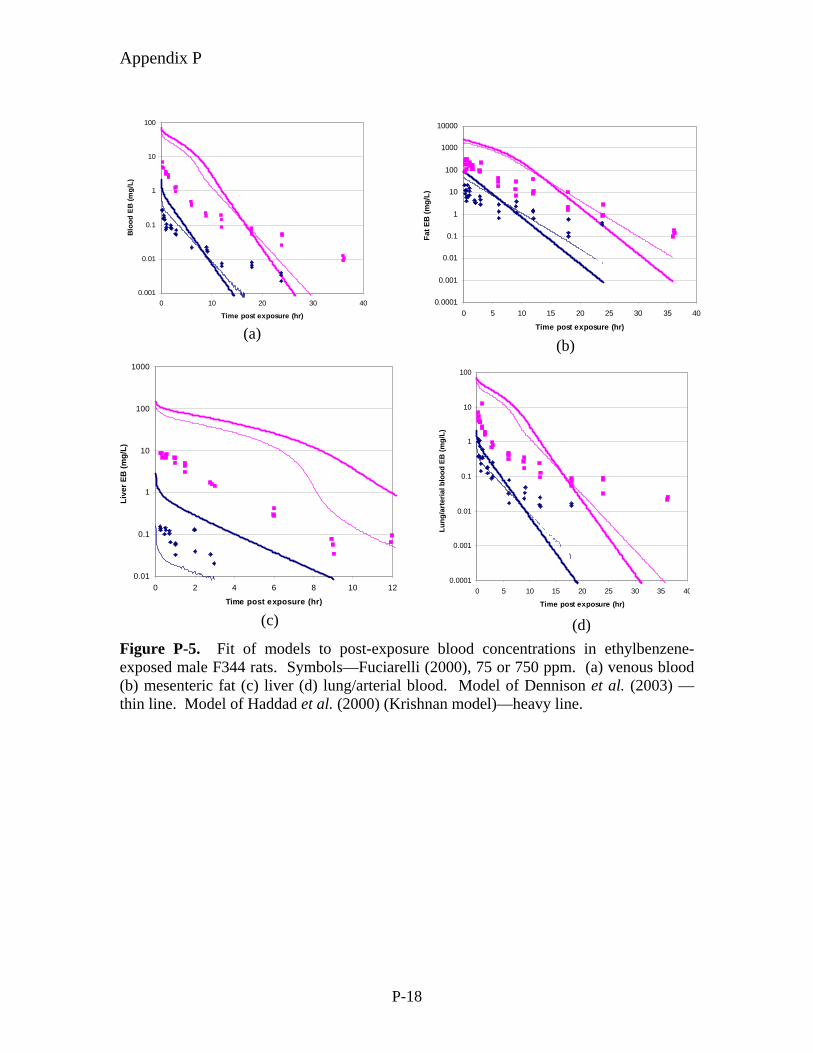
Figure P-4. Fit of models to end-of-exposure blood concentrations in ethylbenzene-exposed female Sprague-Dawley rats. Symbols—Triangles, Freundt et al. (1989), 120, 240, 350 or 650 ppm; diamond, Römer et al. (1986), 180 ppm. Model of Dennison et al. (2003) —thin line. Model of Haddad et al. (2000) (Krishnan model)—solid, heavy line = end of exposure prediction, dashed heavy line = 0.05 hr (3 minutes) postexposure estimate. Fuciarelli (2000) exposed male and female F344 rats to 0, 75, or 750 ppm ethylbenzene by inhalation for 6 hours/day, 5 days per week for up to 12 days. At the end of days 1, 4, and 12, blood, lung, liver, and mesenteric fat were collected within 20 minutes for ethylbenzene measurement. Also, these same tissues were collected for a postexposure time course on day 12. The comparative data for days 1, 4, and 12 are presented in Tables P-4-7, and the time course data are presented in Figures P-5 and 6. Neither model provided adequate prediction of the 750-ppm data. At 75 ppm, the Dennison model more accurately predicted ethylbenzene concentrations in blood and tissues at the end of exposure than the Krishnan model. The Dennsion model generally predicted postexposure declines that were less steep than the Krishnan model and were more in keeping with the trends in the data.
P-15
Appendix P
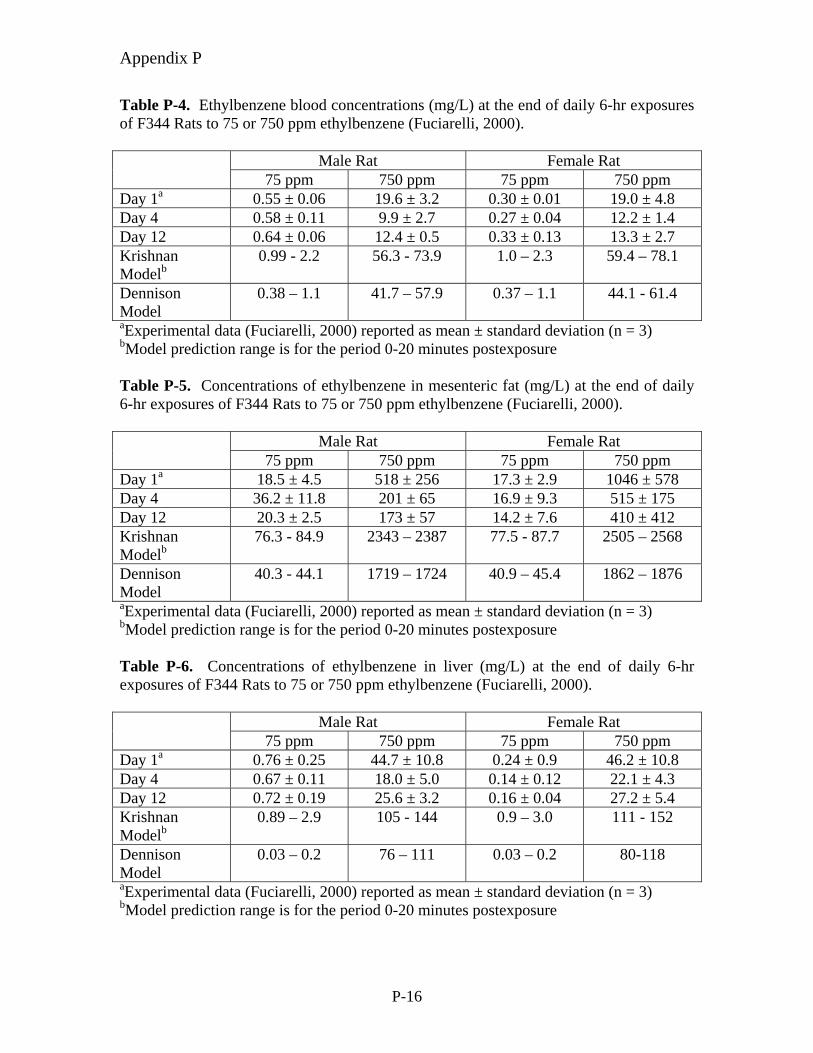
Table P-4. Ethylbenzene blood concentrations (mg/L) at the end of daily 6-hr exposures of F344 Rats to 75 or 750 ppm ethylbenzene (Fuciarelli, 2000).
Male Rat Female Rat 75 ppm 750 ppm 75 ppm 750 ppm
Day 1a 0.55 ± 0.06 19.6 ± 3.2 0.30 ± 0.01 19.0 ± 4.8 Day 4 0.58 ± 0.11 9.9 ± 2.7 0.27 ± 0.04 12.2 ± 1.4 Day 12 0.64 ± 0.06 12.4 ± 0.5 0.33 ± 0.13 13.3 ± 2.7 Krishnan Modelb
0.99 - 2.2 56.3 - 73.9 1.0 – 2.3 59.4 – 78.1
Dennison Model
0.38 – 1.1 41.7 – 57.9 0.37 – 1.1 44.1 - 61.4
aExperimental data (Fuciarelli, 2000) reported as mean ± standard deviation (n = 3) bModel prediction range is for the period 0-20 minutes postexposure Table P-5. Concentrations of ethylbenzene in mesenteric fat (mg/L) at the end of daily 6-hr exposures of F344 Rats to 75 or 750 ppm ethylbenzene (Fuciarelli, 2000).
Male Rat Female Rat 75 ppm 750 ppm 75 ppm 750 ppm
Day 1a 18.5 ± 4.5 518 ± 256 17.3 ± 2.9 1046 ± 578 Day 4 36.2 ± 11.8 201 ± 65 16.9 ± 9.3 515 ± 175 Day 12 20.3 ± 2.5 173 ± 57 14.2 ± 7.6 410 ± 412 Krishnan Modelb
76.3 - 84.9 2343 – 2387 77.5 - 87.7 2505 – 2568
Dennison Model
40.3 - 44.1 1719 – 1724 40.9 – 45.4 1862 – 1876
aExperimental data (Fuciarelli, 2000) reported as mean ± standard deviation (n = 3) bModel prediction range is for the period 0-20 minutes postexposure Table P-6. Concentrations of ethylbenzene in liver (mg/L) at the end of daily 6-hr exposures of F344 Rats to 75 or 750 ppm ethylbenzene (Fuciarelli, 2000).
Male Rat Female Rat 75 ppm 750 ppm 75 ppm 750 ppm
Day 1a 0.76 ± 0.25 44.7 ± 10.8 0.24 ± 0.9 46.2 ± 10.8 Day 4 0.67 ± 0.11 18.0 ± 5.0 0.14 ± 0.12 22.1 ± 4.3 Day 12 0.72 ± 0.19 25.6 ± 3.2 0.16 ± 0.04 27.2 ± 5.4 Krishnan Modelb
0.89 – 2.9 105 - 144 0.9 – 3.0 111 - 152
Dennison Model
0.03 – 0.2 76 – 111 0.03 – 0.2 80-118
aExperimental data (Fuciarelli, 2000) reported as mean ± standard deviation (n = 3) bModel prediction range is for the period 0-20 minutes postexposure
P-16
Appendix P
Table P-7. Concentrations of ethylbenzene in lung (mg/L) at the end of daily 6-hr exposures of F344 Rats to 75 or 750 ppm ethylbenzene (Fuciarelli, 2000).
Male Rat Female Rat 75 ppm 750 ppm 75 ppm 750 ppm
Day 1a 2.33 ± 0.60 38.7 ± 24.4 0.41 ± 0.07 19.0 ± 13.2 Day 4 0.76 ± 0.05 7.0 ± 0.3 1.24 ± 0.94 7.2 ± 2.5 Day 12 1.91 ± 1.07 9.0 ± 0.04 1.04 ± 0.45 9.7 ± 1.8 Krishnan Modelb
1.28 – 2.5 58.1 – 75.4 1.3 – 2.5 61.2 – 79.5
Dennison Model
0.63 – 1.3 43.5 – 59.4 0.62 – 1.3 45.8 – 62.8
aExperimental data (Fuciarelli, 2000) reported as mean ± standard deviation (n = 3) bModel prediction range is for the period 0-20 minutes postexposure. Arterial blood prediction used as surrogate for lung.
P-17
Appendix P
0.0001
0.001
0.01
0.1
1
10
100
1000
10000
0 5 10 15 20 25 30 35 40
Time post exposure (hr)
Fat E
B (m
g/L)
0.01
0.1
1
10
100
1000
0 2 4 6 8 10 12
Time post exposure (hr)
Live
r EB
(mg/
L)
0.0001
0.001
0.01
0.1
1
10
100
0 5 10 15 20 25 30 35 40
Time post exposure (hr)
Lung
/art
eria
l blo
od E
B (m
g/L)
0.001
0.01
0.1
1
10
100
0 10 20 30 40
Time post exposure (hr)
Blo
od E
B (m
g/L)
(a) (b)
(c) (d)Figure P-5. Fit of models to post-exposure blood concentrations in ethylbenzene-exposed male F344 rats. Symbols—Fuciarelli (2000), 75 or 750 ppm. (a) venous blood (b) mesenteric fat (c) liver (d) lung/arterial blood. Model of Dennison et al. (2003) —thin line. Model of Haddad et al. (2000) (Krishnan model)—heavy line.
P-18
Appendix P
0.000001
0.00001
0.0001
0.001
0.01
0.1
1
10
100
0 10 20 30 40
Time post exposure (hr)
Blo
od E
B (m
g/L)
0.01
0.1
1
10
100
1000
10000
0 10 20 30 40
Time post exposure (hr)
FatE
B (m
g/L)
0.01
0.1
1
10
100
1000
0 5 10 15
Time post exposure (hr)
Live
r EB
(mg/
L)
0.000001
0.00001
0.0001
0.001
0.01
0.1
1
10
100
0 5 10 15 20 25 30 35 40
Time post exposure (hr)
Lung
/Art
eria
l Blo
od E
B (m
g/L)
(a) (b)
(c)
0.000001
0.00001
0.0001
0.001
0.01
0.1
1
10
100
0 10 20 30 40
Time post exposure (hr)
Blo
od E
B (m
g/L)
0.01
0.1
1
10
100
1000
10000
0 10 20 30 40
Time post exposure (hr)
FatE
B (m
g/L)
0.01
0.1
1
10
100
1000
0 5 10 15
Time post exposure (hr)
Live
r EB
(mg/
L)
0.000001
0.00001
0.0001
0.001
0.01
0.1
1
10
100
0 5 10 15 20 25 30 35 40
Time post exposure (hr)
Lung
/Art
eria
l Blo
od E
B (m
g/L)
(a) (b)
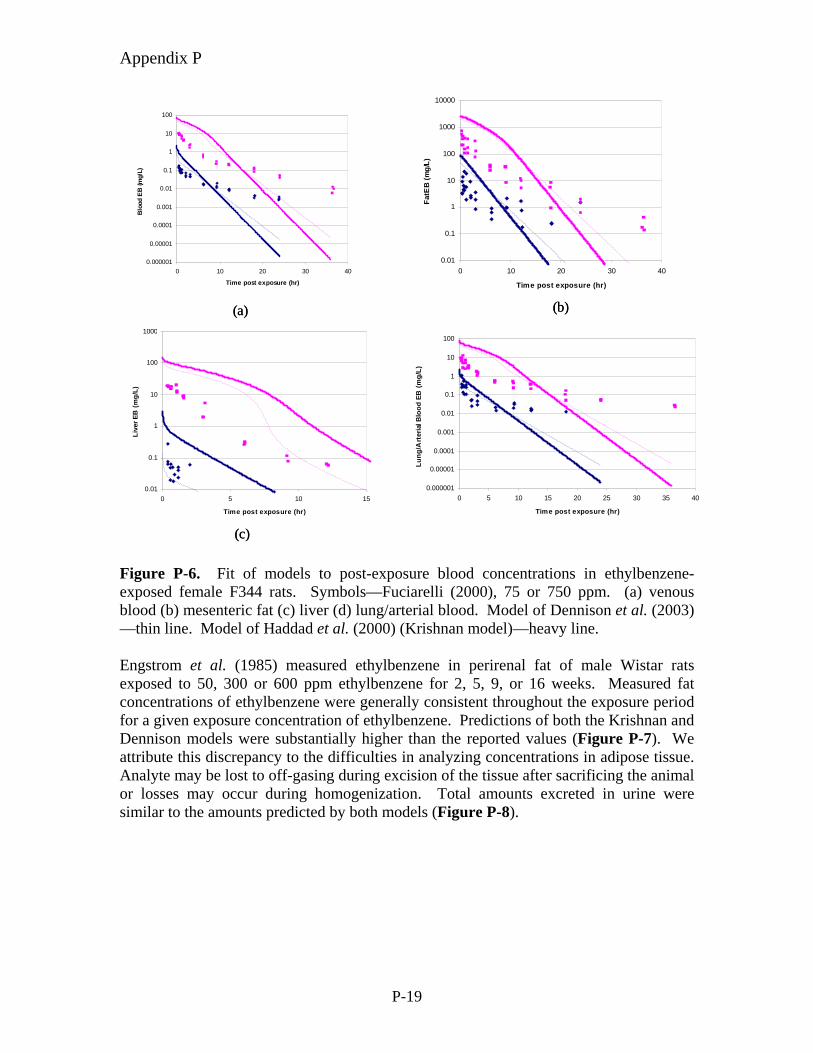
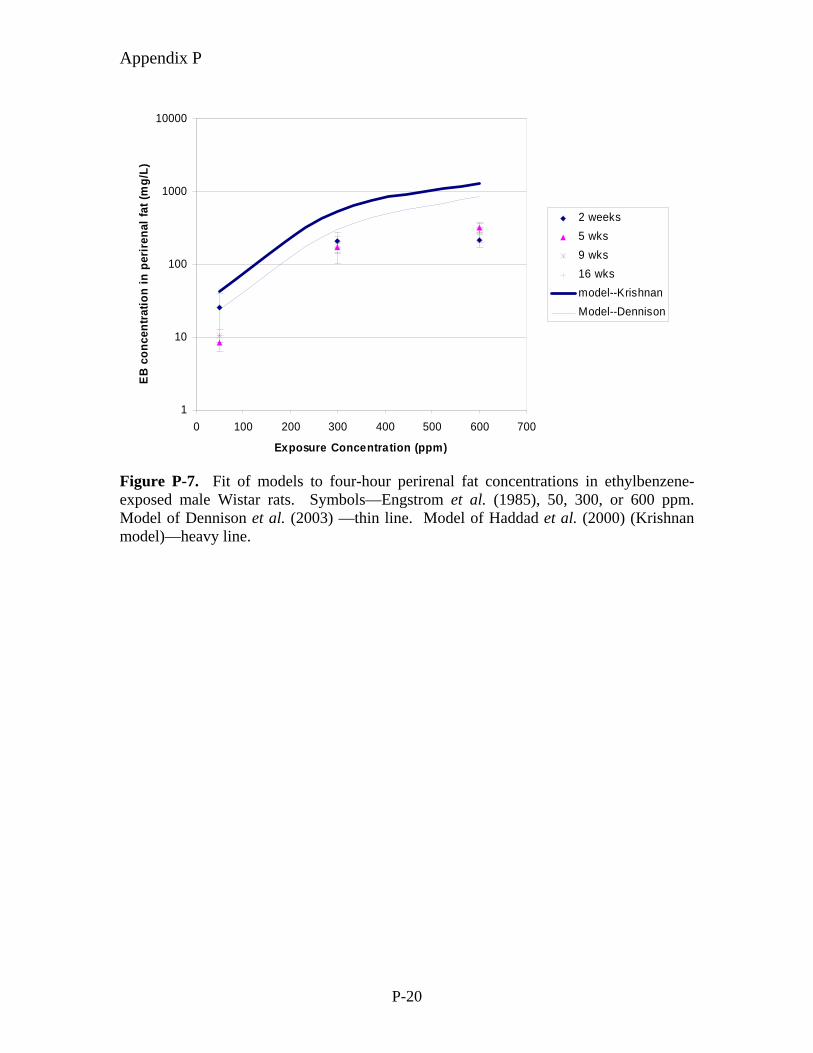
(c) Figure P-6. Fit of models to post-exposure blood concentrations in ethylbenzene-exposed female F344 rats. Symbols—Fuciarelli (2000), 75 or 750 ppm. (a) venous blood (b) mesenteric fat (c) liver (d) lung/arterial blood. Model of Dennison et al. (2003) —thin line. Model of Haddad et al. (2000) (Krishnan model)—heavy line. Engstrom et al. (1985) measured ethylbenzene in perirenal fat of male Wistar rats exposed to 50, 300 or 600 ppm ethylbenzene for 2, 5, 9, or 16 weeks. Measured fat concentrations of ethylbenzene were generally consistent throughout the exposure period for a given exposure concentration of ethylbenzene. Predictions of both the Krishnan and Dennison models were substantially higher than the reported values (Figure P-7). We attribute this discrepancy to the difficulties in analyzing concentrations in adipose tissue. Analyte may be lost to off-gasing during excision of the tissue after sacrificing the animal or losses may occur during homogenization. Total amounts excreted in urine were similar to the amounts predicted by both models (Figure P-8).
P-19
Appendix P
1
10
100
1000
10000
0 100 200 300 400 500 600 700
Exposure Concentration (ppm)
EB c
once
ntra
tion
in p
erir
enal
fat (
mg/
L)
2 weeks5 wks9 wks16 wksmodel--KrishnanModel--Dennison
Figure P-7. Fit of models to four-hour perirenal fat concentrations in ethylbenzene-exposed male Wistar rats. Symbols—Engstrom et al. (1985), 50, 300, or 600 ppm. Model of Dennison et al. (2003) —thin line. Model of Haddad et al. (2000) (Krishnan model)—heavy line.
P-20
Appendix P
0
10
20
30
40
50
60
0 100 200 300 400 500 600 700
Exposure Concentration (ppm)
Am
ount
of u
rinar
y m
etab
olite
s(m
g EB
-equ
ival
ents
)/24
hr
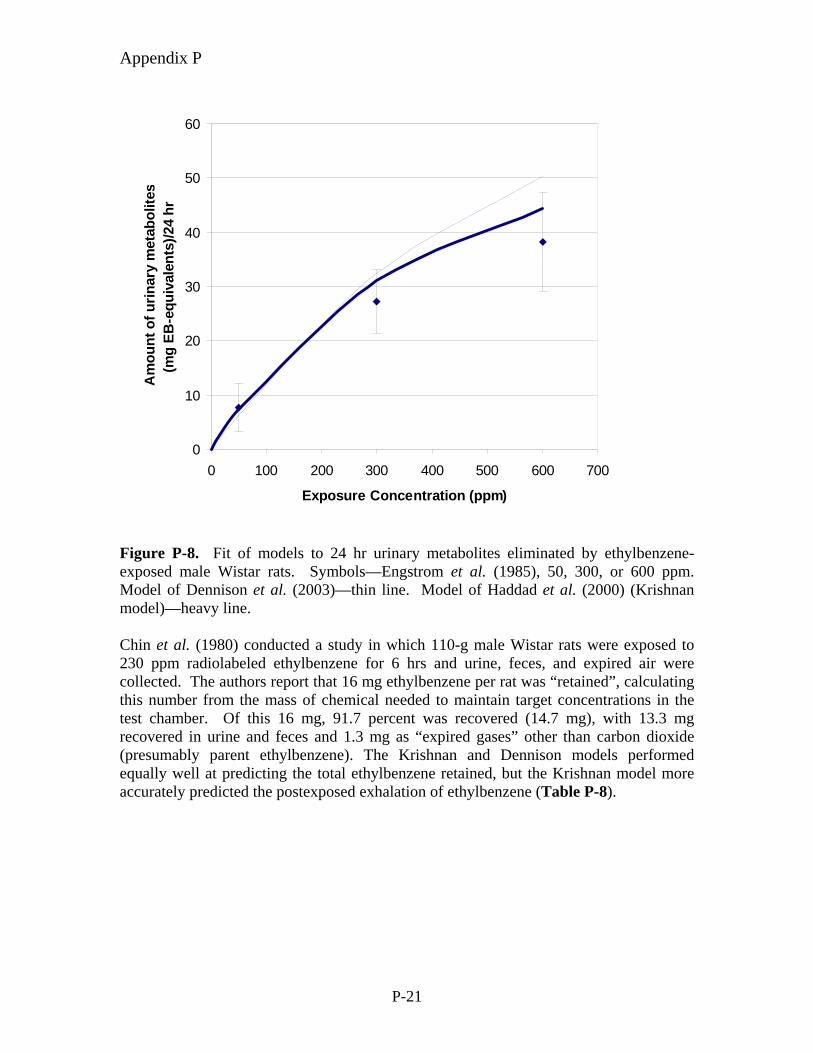
Figure P-8. Fit of models to 24 hr urinary metabolites eliminated by ethylbenzene-exposed male Wistar rats. Symbols—Engstrom et al. (1985), 50, 300, or 600 ppm. Model of Dennison et al. (2003)—thin line. Model of Haddad et al. (2000) (Krishnan model)—heavy line. Chin et al. (1980) conducted a study in which 110-g male Wistar rats were exposed to 230 ppm radiolabeled ethylbenzene for 6 hrs and urine, feces, and expired air were collected. The authors report that 16 mg ethylbenzene per rat was “retained”, calculating this number from the mass of chemical needed to maintain target concentrations in the test chamber. Of this 16 mg, 91.7 percent was recovered (14.7 mg), with 13.3 mg recovered in urine and feces and 1.3 mg as “expired gases” other than carbon dioxide (presumably parent ethylbenzene). The Krishnan and Dennison models performed equally well at predicting the total ethylbenzene retained, but the Krishnan model more accurately predicted the postexposed exhalation of ethylbenzene (Table P-8).
P-21
Appendix P
Table P-8. Disposition of 230 ppm ethylbenzene in Wistar rats (Chin et al., 1980) Experimental Data Chin et al. (1980) Krishnan Model Dennison Model
Retained (mg) 16 12.2 11.6 Post Exposure Exhalation (mg)
1.3 1.5 0.4
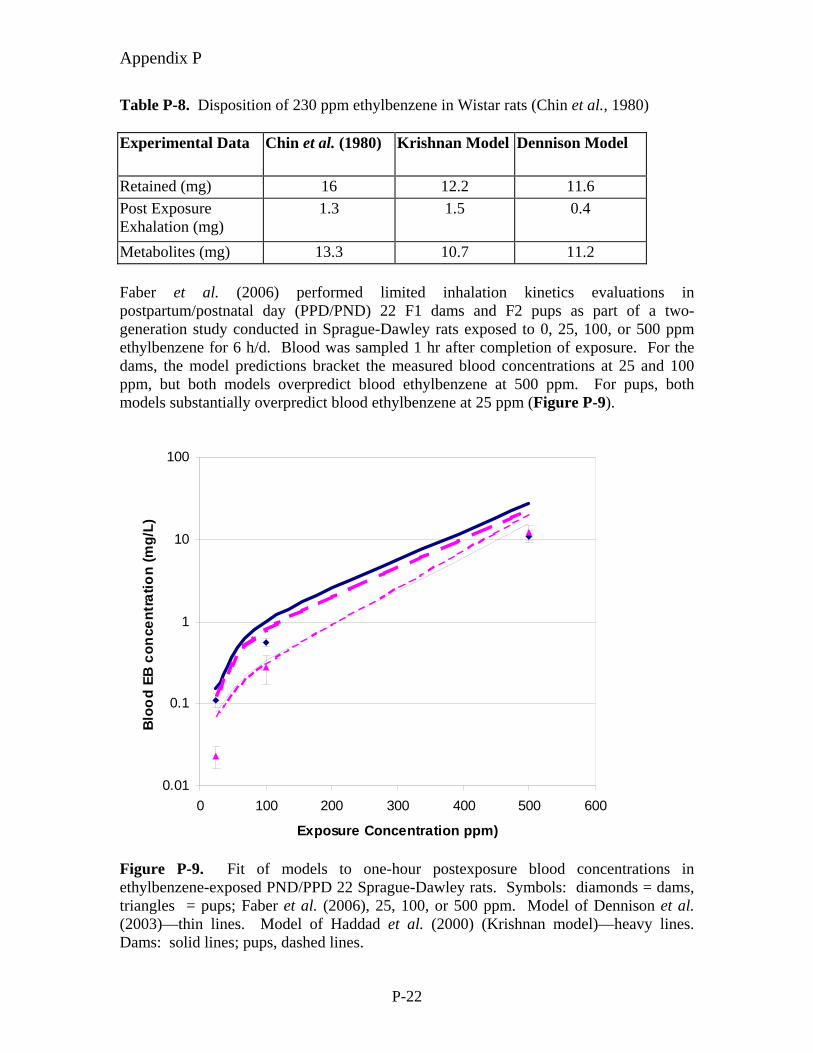
Metabolites (mg) 13.3 10.7 11.2 Faber et al. (2006) performed limited inhalation kinetics evaluations in postpartum/postnatal day (PPD/PND) 22 F1 dams and F2 pups as part of a two-generation study conducted in Sprague-Dawley rats exposed to 0, 25, 100, or 500 ppm ethylbenzene for 6 h/d. Blood was sampled 1 hr after completion of exposure. For the dams, the model predictions bracket the measured blood concentrations at 25 and 100 ppm, but both models overpredict blood ethylbenzene at 500 ppm. For pups, both models substantially overpredict blood ethylbenzene at 25 ppm (Figure P-9).
0.01
0.1
1
10
100
0 100 200 300 400 500 600
Exposure Concentration ppm)
Blo
od
EB c
once
ntra
tion
(mg/
L)
Figure P-9. Fit of models to one-hour postexposure blood concentrations in ethylbenzene-exposed PND/PPD 22 Sprague-Dawley rats. Symbols: diamonds = dams, triangles = pups; Faber et al. (2006), 25, 100, or 500 ppm. Model of Dennison et al. (2003)—thin lines. Model of Haddad et al. (2000) (Krishnan model)—heavy lines. Dams: solid lines; pups, dashed lines.
P-22
Appendix P
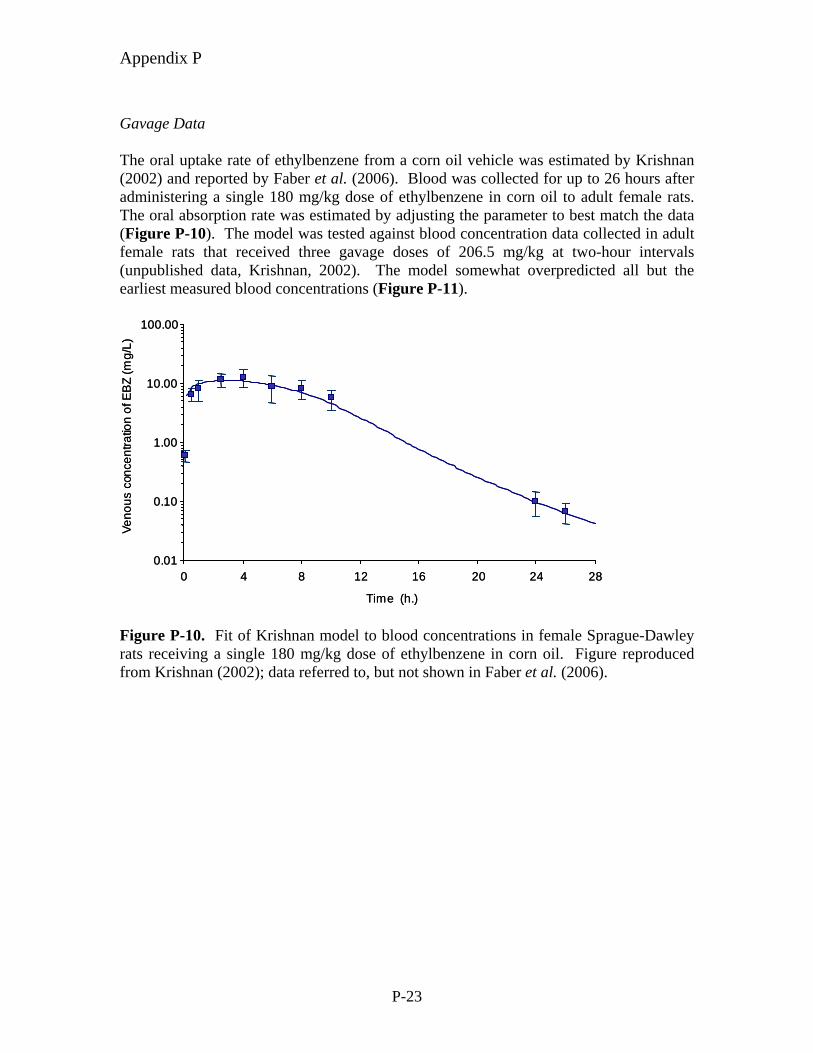
Gavage Data The oral uptake rate of ethylbenzene from a corn oil vehicle was estimated by Krishnan (2002) and reported by Faber et al. (2006). Blood was collected for up to 26 hours after administering a single 180 mg/kg dose of ethylbenzene in corn oil to adult female rats. The oral absorption rate was estimated by adjusting the parameter to best match the data (Figure P-10). The model was tested against blood concentration data collected in adult female rats that received three gavage doses of 206.5 mg/kg at two-hour intervals (unpublished data, Krishnan, 2002). The model somewhat overpredicted all but the earliest measured blood concentrations (Figure P-11).
0.01
0.10
1.00
10.00
100.00
0 4 8 12 16 20 24
Time (h.)
Veno
us c
once
ntra
tion
of E
BZ
(mg/
L)
280.01
0.10
1.00
10.00
100.00
0 4 8 12 16 20 24
Time (h.)
Veno
us c
once
ntra
tion
of E
BZ
(mg/
L)
28
Figure P-10. Fit of Krishnan model to blood concentrations in female Sprague-Dawley rats receiving a single 180 mg/kg dose of ethylbenzene in corn oil. Figure reproduced from Krishnan (2002); data referred to, but not shown in Faber et al. (2006).
P-23
Appendix P
0.01
0.10
1.00
10.00
100.00
0 4 8 12 16 20 24 2
Time (h.)
Veno
us c
once
ntra
tion
of E
BZ
(mg/
L)
80.01
0.10
1.00
10.00
100.00
0 4 8 12 16 20 24 2
Time (h.)
Veno
us c
once
ntra
tion
of E
BZ
(mg/
L)
8
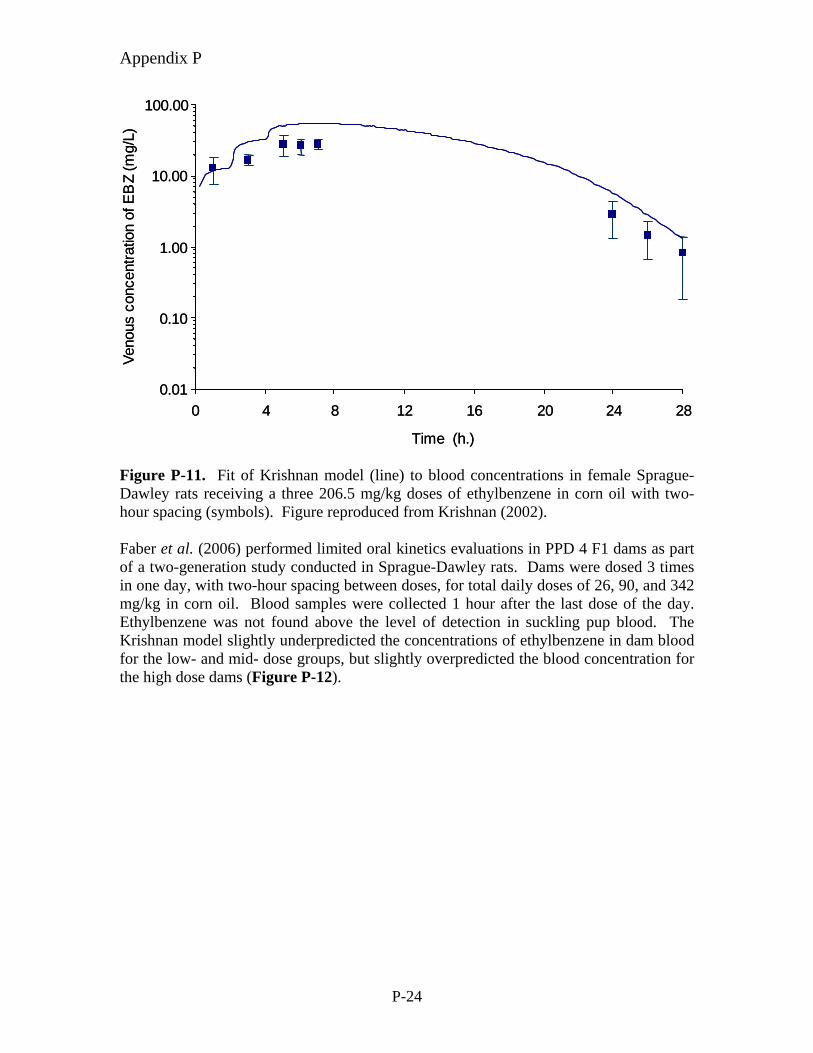
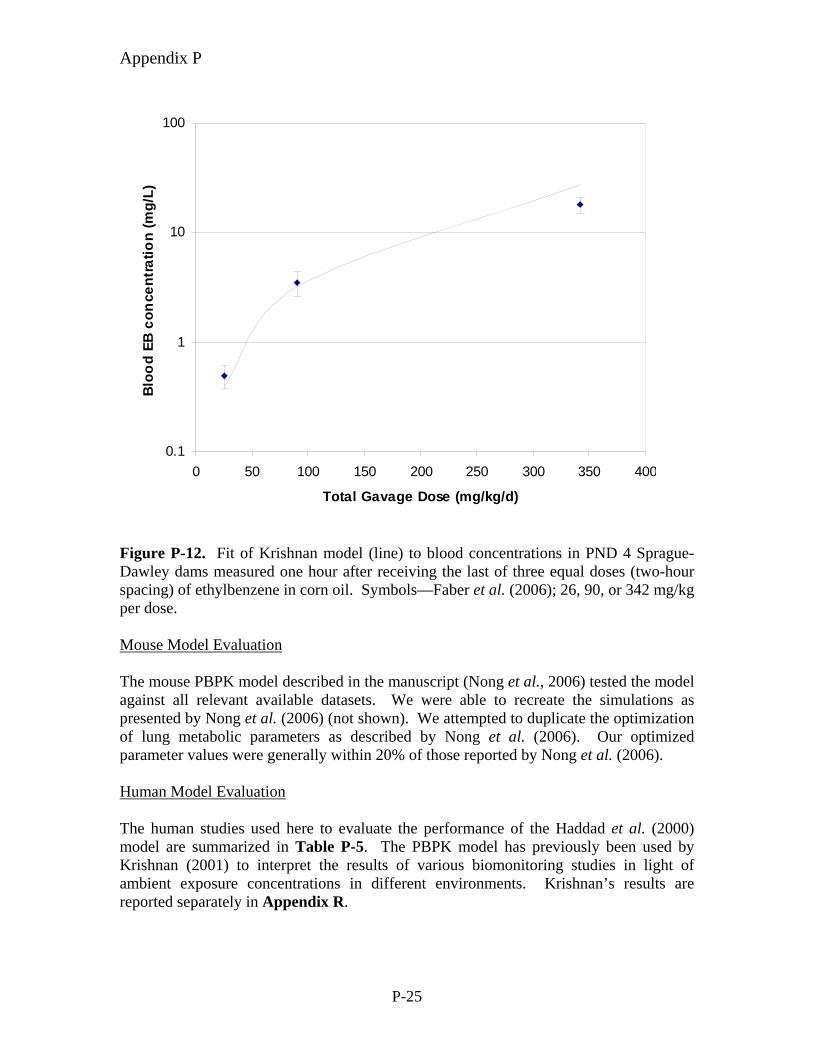
Figure P-11. Fit of Krishnan model (line) to blood concentrations in female Sprague-Dawley rats receiving a three 206.5 mg/kg doses of ethylbenzene in corn oil with two-hour spacing (symbols). Figure reproduced from Krishnan (2002). Faber et al. (2006) performed limited oral kinetics evaluations in PPD 4 F1 dams as part of a two-generation study conducted in Sprague-Dawley rats. Dams were dosed 3 times in one day, with two-hour spacing between doses, for total daily doses of 26, 90, and 342 mg/kg in corn oil. Blood samples were collected 1 hour after the last dose of the day. Ethylbenzene was not found above the level of detection in suckling pup blood. The Krishnan model slightly underpredicted the concentrations of ethylbenzene in dam blood for the low- and mid- dose groups, but slightly overpredicted the blood concentration for the high dose dams (Figure P-12).
P-24
Appendix P
0.1
1
10
100
0 50 100 150 200 250 300 350 400
Total Gavage Dose (mg/kg/d)
Blo
od
EB c
once
ntra
tion
(mg/
L)
Figure P-12. Fit of Krishnan model (line) to blood concentrations in PND 4 Sprague-Dawley dams measured one hour after receiving the last of three equal doses (two-hour spacing) of ethylbenzene in corn oil. Symbols—Faber et al. (2006); 26, 90, or 342 mg/kg per dose. Mouse Model Evaluation The mouse PBPK model described in the manuscript (Nong et al., 2006) tested the model against all relevant available datasets. We were able to recreate the simulations as presented by Nong et al. (2006) (not shown). We attempted to duplicate the optimization of lung metabolic parameters as described by Nong et al. (2006). Our optimized parameter values were generally within 20% of those reported by Nong et al. (2006). Human Model Evaluation The human studies used here to evaluate the performance of the Haddad et al. (2000) model are summarized in Table P-5. The PBPK model has previously been used by Krishnan (2001) to interpret the results of various biomonitoring studies in light of ambient exposure concentrations in different environments. Krishnan’s results are reported separately in Appendix R.
P-25
Appendix P
Table P-5. Summary of Studies Used to Evaluate Human PBPK Model Performance Author Exposure Dose Metric Figure
Number Tardif et al. (1997) 33 ppm Ethylbenzene concentration in blood
and alveolar air P-13
Knecht et al. (2000) 25 ppm (rest), 100 ppm (rest and 50 W)
Ethylbenzene concentration in blood P-14
Kawai et al. (1992) 1.28-5.7 ppm 8-hr TWA Ethylbenzene concentration in blood P-15
Engstrom et al. (1984) 150 ppm Amount of urinary metabolites None
Gromiec and Piotrowski (1984)
4.1, 7.8, 18, or 46 ppm Fractional retention, amount exhaled P-16
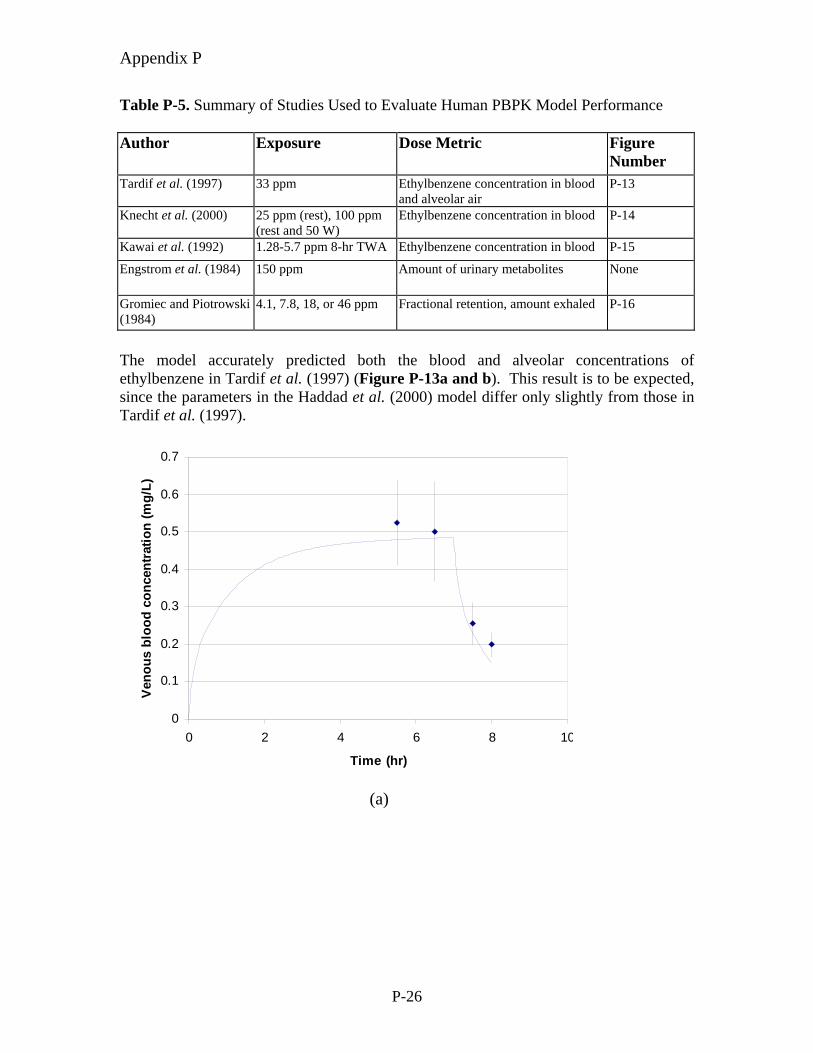
The model accurately predicted both the blood and alveolar concentrations of ethylbenzene in Tardif et al. (1997) (Figure P-13a and b). This result is to be expected, since the parameters in the Haddad et al. (2000) model differ only slightly from those in Tardif et al. (1997).
0
0.1
0.2
0.3
0.4
0.5
0.6
0.7
0 2 4 6 8 10
Time (hr)
Ven
ous
bloo
d co
ncen
trat
ion
(mg/
L)
(a)
P-26
Appendix P
0
1
2
3
4
5
6
7
0 2 4 6 8
Time (hr)
Conc
entra
tion
in a
lveo
lar
air
(ppm
)
10
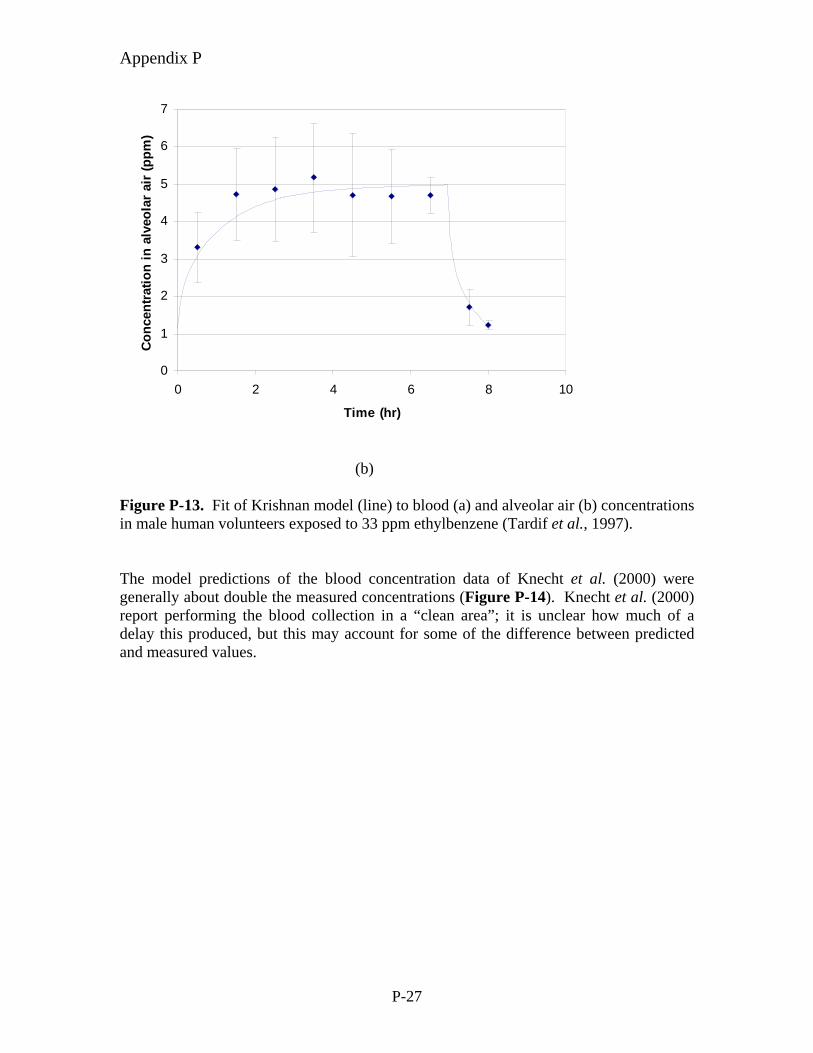
(b) Figure P-13. Fit of Krishnan model (line) to blood (a) and alveolar air (b) concentrations in male human volunteers exposed to 33 ppm ethylbenzene (Tardif et al., 1997). The model predictions of the blood concentration data of Knecht et al. (2000) were generally about double the measured concentrations (Figure P-14). Knecht et al. (2000) report performing the blood collection in a “clean area”; it is unclear how much of a delay this produced, but this may account for some of the difference between predicted and measured values.
P-27
Appendix P
0.01
0.1
1
10
0 2 4 6 8
Time (hr)
Blo
od c
once
ntra
tion
(mg/
L)
10
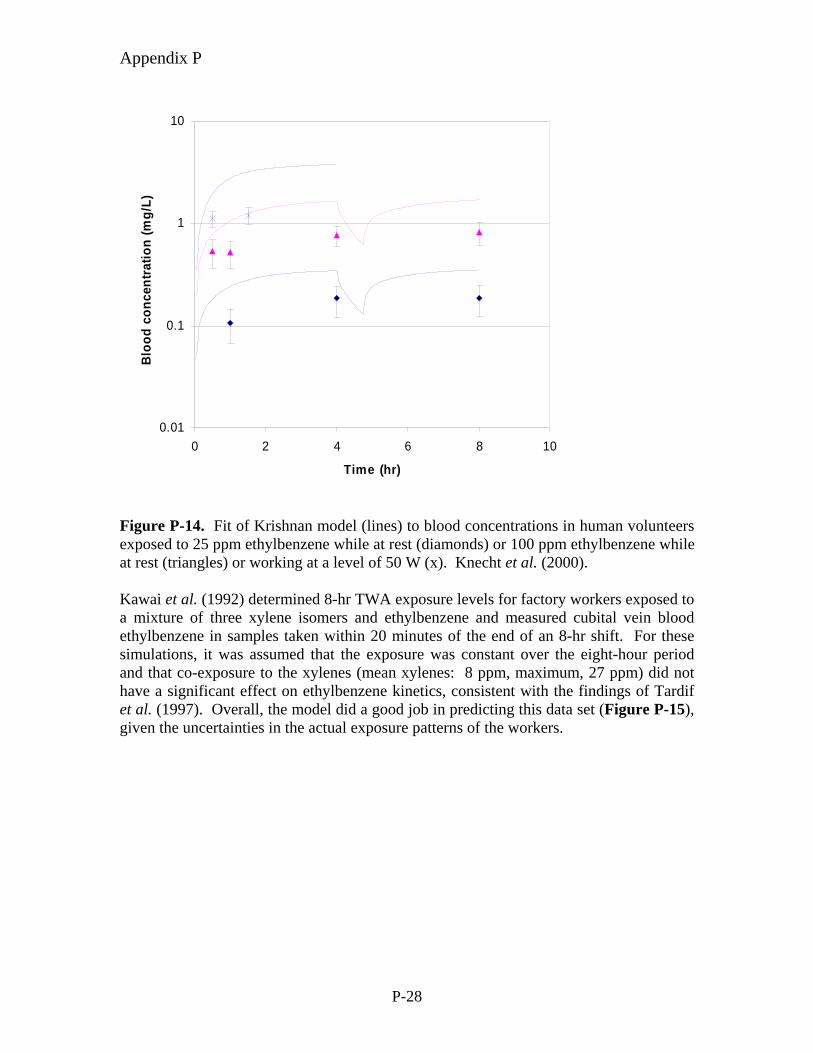
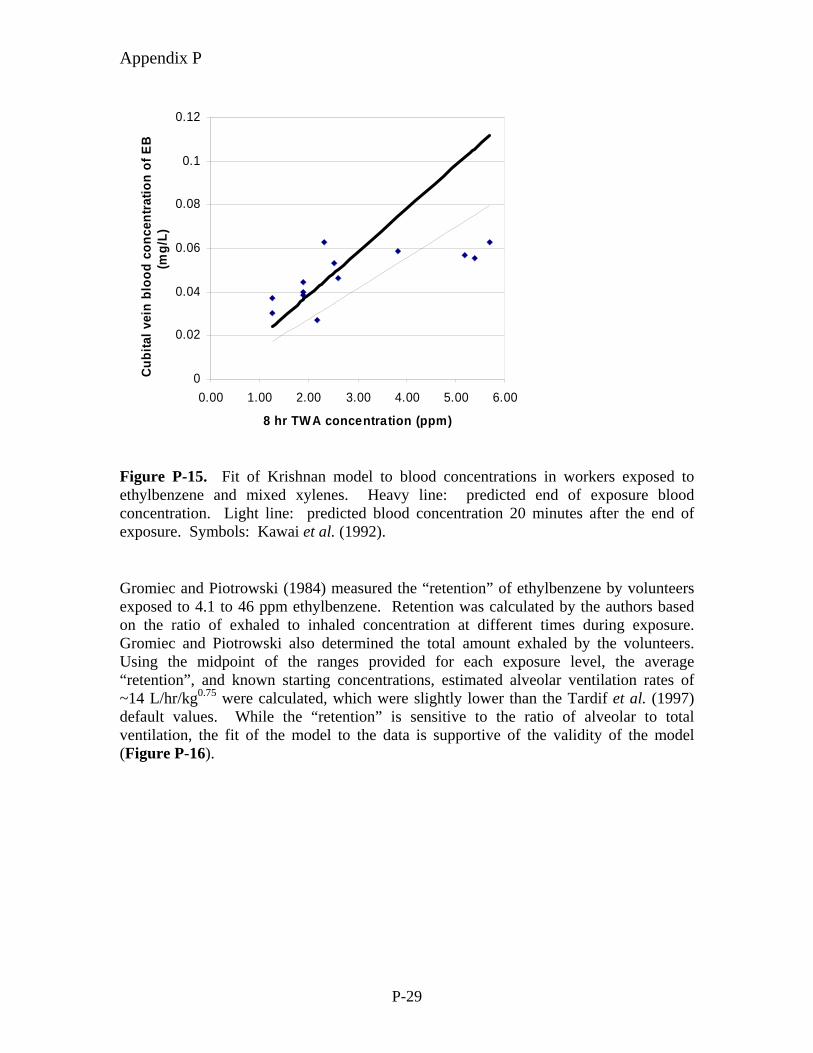
Figure P-14. Fit of Krishnan model (lines) to blood concentrations in human volunteers exposed to 25 ppm ethylbenzene while at rest (diamonds) or 100 ppm ethylbenzene while at rest (triangles) or working at a level of 50 W (x). Knecht et al. (2000). Kawai et al. (1992) determined 8-hr TWA exposure levels for factory workers exposed to a mixture of three xylene isomers and ethylbenzene and measured cubital vein blood ethylbenzene in samples taken within 20 minutes of the end of an 8-hr shift. For these simulations, it was assumed that the exposure was constant over the eight-hour period and that co-exposure to the xylenes (mean xylenes: 8 ppm, maximum, 27 ppm) did not have a significant effect on ethylbenzene kinetics, consistent with the findings of Tardif et al. (1997). Overall, the model did a good job in predicting this data set (Figure P-15), given the uncertainties in the actual exposure patterns of the workers.
P-28
Appendix P
0
0.02
0.04
0.06
0.08
0.1
0.12
0.00 1.00 2.00 3.00 4.00 5.00 6.00
8 hr TWA concentration (ppm)
Cub
ital v
ein
bloo
d co
ncen
tratio
n of
EB
(m
g/L)
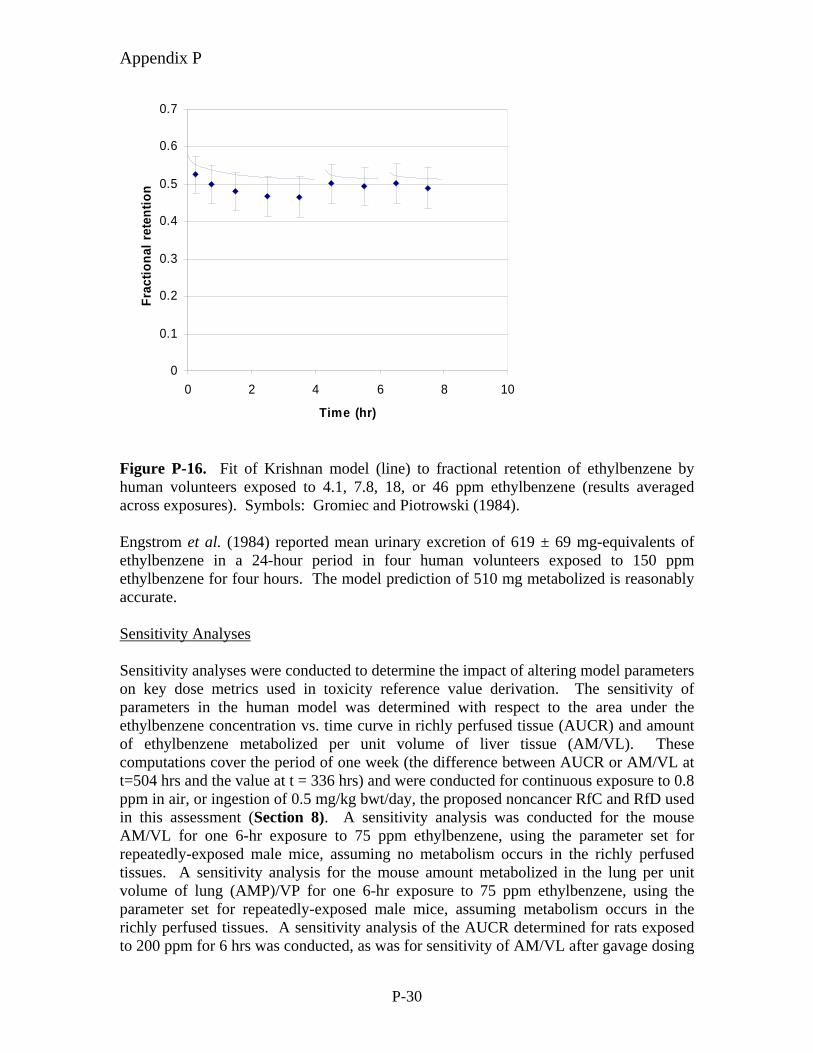
Figure P-15. Fit of Krishnan model to blood concentrations in workers exposed to ethylbenzene and mixed xylenes. Heavy line: predicted end of exposure blood concentration. Light line: predicted blood concentration 20 minutes after the end of exposure. Symbols: Kawai et al. (1992). Gromiec and Piotrowski (1984) measured the “retention” of ethylbenzene by volunteers exposed to 4.1 to 46 ppm ethylbenzene. Retention was calculated by the authors based on the ratio of exhaled to inhaled concentration at different times during exposure. Gromiec and Piotrowski also determined the total amount exhaled by the volunteers. Using the midpoint of the ranges provided for each exposure level, the average “retention”, and known starting concentrations, estimated alveolar ventilation rates of ~14 L/hr/kg0.75 were calculated, which were slightly lower than the Tardif et al. (1997) default values. While the “retention” is sensitive to the ratio of alveolar to total ventilation, the fit of the model to the data is supportive of the validity of the model (Figure P-16).
P-29
Appendix P
0
0.1
0.2
0.3
0.4
0.5
0.6
0.7
0 2 4 6 8
Time (hr)
Frac
tiona
l ret
entio
n
10
Figure P-16. Fit of Krishnan model (line) to fractional retention of ethylbenzene by human volunteers exposed to 4.1, 7.8, 18, or 46 ppm ethylbenzene (results averaged across exposures). Symbols: Gromiec and Piotrowski (1984). Engstrom et al. (1984) reported mean urinary excretion of 619 ± 69 mg-equivalents of ethylbenzene in a 24-hour period in four human volunteers exposed to 150 ppm ethylbenzene for four hours. The model prediction of 510 mg metabolized is reasonably accurate. Sensitivity Analyses Sensitivity analyses were conducted to determine the impact of altering model parameters on key dose metrics used in toxicity reference value derivation. The sensitivity of parameters in the human model was determined with respect to the area under the ethylbenzene concentration vs. time curve in richly perfused tissue (AUCR) and amount of ethylbenzene metabolized per unit volume of liver tissue (AM/VL). These computations cover the period of one week (the difference between AUCR or AM/VL at t=504 hrs and the value at t = 336 hrs) and were conducted for continuous exposure to 0.8 ppm in air, or ingestion of 0.5 mg/kg bwt/day, the proposed noncancer RfC and RfD used in this assessment (Section 8). A sensitivity analysis was conducted for the mouse AM/VL for one 6-hr exposure to 75 ppm ethylbenzene, using the parameter set for repeatedly-exposed male mice, assuming no metabolism occurs in the richly perfused tissues. A sensitivity analysis for the mouse amount metabolized in the lung per unit volume of lung (AMP)/VP for one 6-hr exposure to 75 ppm ethylbenzene, using the parameter set for repeatedly-exposed male mice, assuming metabolism occurs in the richly perfused tissues. A sensitivity analysis of the AUCR determined for rats exposed to 200 ppm for 6 hrs was conducted, as was for sensitivity of AM/VL after gavage dosing
P-30
Appendix P
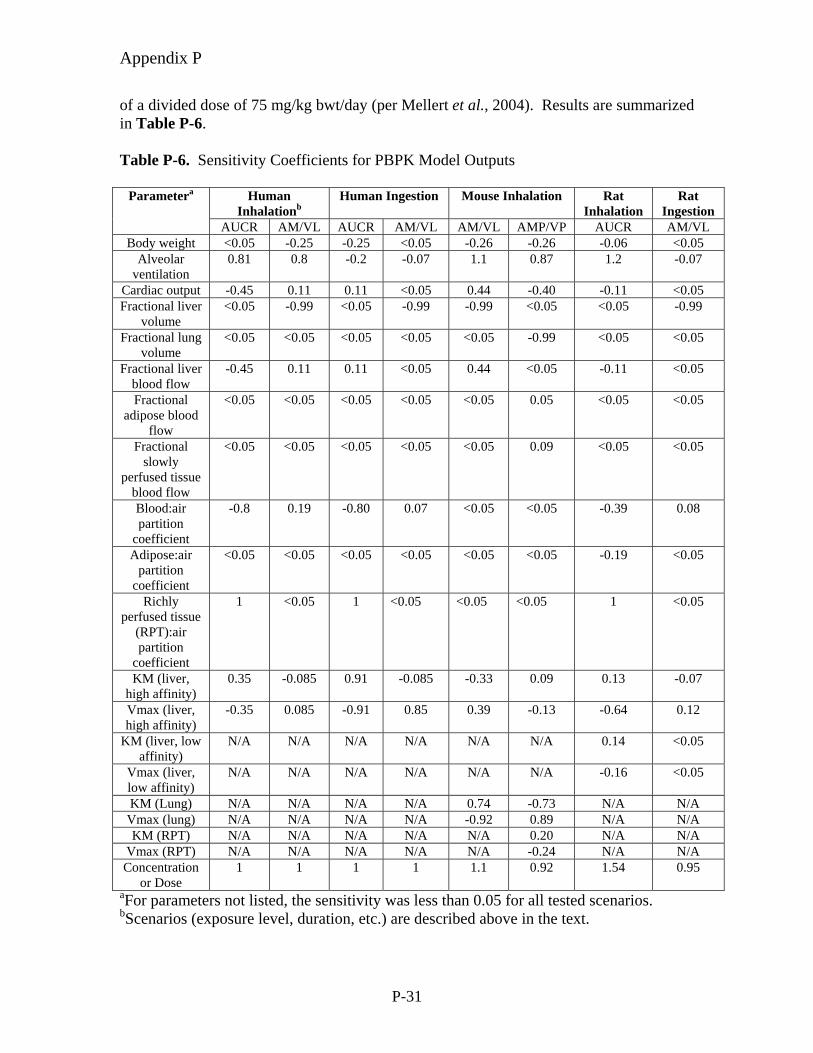
of a divided dose of 75 mg/kg bwt/day (per Mellert et al., 2004). Results are summarized in Table P-6. Table P-6. Sensitivity Coefficients for PBPK Model Outputs
Human Inhalationb
Human Ingestion Mouse Inhalation Rat Inhalation
Rat Ingestion
Parametera
AUCR AM/VL AUCR AM/VL AM/VL AMP/VP AUCR AM/VL Body weight <0.05 -0.25 -0.25 <0.05 -0.26 -0.26 -0.06 <0.05
Alveolar ventilation
0.81 0.8 -0.2 -0.07 1.1 0.87 1.2 -0.07
Cardiac output -0.45 0.11 0.11 <0.05 0.44 -0.40 -0.11 <0.05 Fractional liver
volume <0.05 -0.99 <0.05 -0.99 -0.99 <0.05 <0.05 -0.99
Fractional lung volume
<0.05 <0.05 <0.05 <0.05 <0.05 -0.99 <0.05 <0.05
Fractional liver blood flow
-0.45 0.11 0.11 <0.05 0.44 <0.05 -0.11 <0.05
Fractional adipose blood
flow
<0.05 <0.05 <0.05 <0.05 <0.05 0.05 <0.05 <0.05
Fractional slowly
perfused tissue blood flow
<0.05 <0.05 <0.05 <0.05 <0.05 0.09 <0.05 <0.05
Blood:air partition
coefficient
-0.8 0.19 -0.80 0.07 <0.05 <0.05 -0.39 0.08
Adipose:air partition
coefficient
<0.05 <0.05 <0.05 <0.05 <0.05 <0.05 -0.19 <0.05
Richly perfused tissue
(RPT):air partition
coefficient
1 <0.05 1 <0.05 <0.05 <0.05 1 <0.05
KM (liver, high affinity)
0.35 -0.085 0.91 -0.085 -0.33 0.09 0.13 -0.07
Vmax (liver, high affinity)
-0.35 0.085 -0.91 0.85 0.39 -0.13 -0.64 0.12
KM (liver, low affinity)
N/A N/A N/A N/A N/A N/A 0.14 <0.05
Vmax (liver, low affinity)
N/A N/A N/A N/A N/A N/A -0.16 <0.05
KM (Lung) N/A N/A N/A N/A 0.74 -0.73 N/A N/A Vmax (lung) N/A N/A N/A N/A -0.92 0.89 N/A N/A KM (RPT) N/A N/A N/A N/A N/A 0.20 N/A N/A
Vmax (RPT) N/A N/A N/A N/A N/A -0.24 N/A N/A Concentration
or Dose 1 1 1 1 1.1 0.92 1.54 0.95
aFor parameters not listed, the sensitivity was less than 0.05 for all tested scenarios. bScenarios (exposure level, duration, etc.) are described above in the text.
P-31
Appendix P
The value of AUCR for rats inhaling 200 ppm ethylbenzene has a linear relationship to the RPT partition coefficient (Table P-6) and blood concentration. The confidence in AUCR calculations is thus essentially the same as confidence in the fit of the model to the blood concentration. Since the model parameterization is based on the fit to rat blood concentrations, the reliability of AUCR predictions, and their use in dose-response relationship evaluation, is thus high. The AM/VL values for rats ingesting ethylbenzene have minimal sensitivity to any optimized parameters at the test dose (75 mg/kg), because any portion of the dose that is not exhaled will eventually be metabolized in the liver. AM/VL values in mice, however, were sensitive to optimized parameters (lung metabolism), and do not have such a direct relationship to a quantity used for model optimization as the rat AUCR values. The parameter set used for the derivation of the RfC based on male mouse liver effects conservatively assumes that all extrahepatic metabolism occurs in the lung. With respect to liver dosimetry, the placement of extrahepatic metabolism in the lung (rather than richly perfused tissues) modestly reduces delivery of ethylbenzene to the liver via a first-pass effect of removal in the lung. Estimated ethylbenzene delivery to the liver was greater when some RPT metabolism was incorporated because some extrahepatic metabolism is parallel to the liver metabolism, rather than occurring entirely in the “first pass” through the lung. The human sensitivity analyses were aimed at evaluating the adequacy of selected uncertainty factor for human variability (UFH), specifically the total value of 10, which may be subdivided into equal pharmacokinetic (UFHPK) and pharmacodynamic portions of 3.2 (3.2 x 3.2 = ~10). Considering that the toxicity reference values were derived using the adult human parameter set (Table P-1) but applied to both children and adults (Section 8), interest lies primarily with sensitive parameters known or anticipated to differ between adults and children, with the focus on infants, who differ the most from adults. Clearly, body weight differs between adults and infants, as does bodyweight-normalized inhalation rate (Section 6). Alveolar ventilation was estimated as 60% of total ventilation reported in Section 6. The bodyweight-normalized cardiac output rate estimate was derived from data for newborns of Heymann et al. (1981). Liver volume of children age 0-12 months, as reported by ICRP (1975), was found to be essentially identical to that in adults, when normalized to bodyweight. No information is available on age-related changes in liver blood flow, the ethylbenzene blood:air and RPT:air partition coefficients, and rate of ethylbenzene metabolism. Fractional liver blood flow and partition coefficients were considered age- and bodyweight-independent. Expression of CYP 2E1, which is believed to contribute to human liver metabolism of ethylbenzene (Sams et al., 2004), is lower in children than adults (Johnsrud et al., 2003), but the ontogeny of other enzymes that contribute to human liver ethylbenzene metabolism is not as well known. The sublinear bodyweight-dependence of human liver ethylbenzene metabolism is assumed to sufficiently represent the potentially lower capacity of the infant liver to metabolize ethylbenzene. Using the infant-specific bodyweight, inhalation rate, and cardiac output, the same exposure scenarios and dose metrics used for the sensitivity analysis (Table P-6) were used to calculate-infant-specific dose metrics and child/adult dose ratios. For AUCR, the child/adult dose ratios were both less than 1 (0.60 and 0.93 for ingestion and inhalation, respectively); likewise, the child/adult ratio for AM/VL predictions by the ingestion route is 0.97, indicating that the UFHPK of 3.2 is
P-32
Appendix P
clearly adequate to protect children in these cases. The child/adult ratio for AM/VL predictions by the inhalation route is 2.2. Dividing the total UFHPK of 3.2 by the child/adult ratio of 2.2 leaves a residual value of 1.5 as the acceptable pharmacokinetic variability/uncertainty in children, beyond that accounted for by the use of child specific parameters (bodyweight, ventilation, and cardiac output) and bodyweight-normalized liver metabolism. Given the low sensitivity of the remaining parameters (0.11 for liver blood flow, 0.19 for blood:air partition coefficient), the total UFHPK of 3.2 appears adequate. DISCUSSION For simulations of kinetics in Sprague-Dawley rats, the model of Krishnan and colleagues is preferred over the Dennison model because it more accurately predicts blood levels of ethylbenzene than does the Dennison model, particularly the Tardif et al. (1997) data set that was originally used to parameterize the Krishnan model. There are, however, limitations to the circumstances under which the Krishnan rat model can be applied reliably. The model does not account for transient induction of mRNA of ethylbenzene metabolizing enzymes in rats (return to baseline after 3 days) (Bergeron et al., 1999), so kinetics in rats that have been exposed to ethylbenzene for 2-3 days may not be accurately represented by the model. The model also generally underestimated metabolism at higher concentrations of ethylbenzene, producing overestimates in blood concentrations (generally <2-fold differences between measured and predicted blood concentrations under 650 ppm). The addition of a second, low affinity pathway improved predictions of blood concentrations at higher exposures. Also, the model predictions for PND 22 rat pups are not within the desired range of accuracy (~within a factor of 2). The Krishnan model can be used with high confidence for adult SD rats at concentrations at or below 200 ppm, moderate-to-high confidence for adult SD rats between 200 and 650 ppm. The oral model can be used with confidence for doses up to 180 mg/kg. The Dennison model produced a superior fit to data sets collected using F344 rats, as compared to the Krishnan model performance. The F344 rat data sets were the closed chamber data (used to derive the Dennison metabolic parameters) and the Fuciarelli (2000) toxicokinetic data. Similar to the results for SD rats, the fit to the blood and tissue concentration data at high concentration (750 ppm) was poor. The Dennison model can be used with moderate confidence for F344 rats at low to intermediate concentrations, but cannot be confidently used for high concentrations. However, none of the key studies in the VCCEP risk assessment (Section 8) require simulation of toxicokinetics in F344 rats. The lack of comparable toxicokinetic data sets preclude direct comparisons between F344 and Sprague-Dawley rats, but the general lack of success in applying the F344-derived model to the Sprague-Dawley data and vice versa suggest that there may be strain differences with respect to the disposition of ethylbenzene. Given that there is some evidence for strain differences based on the modeling of F344 and Sprague-Dawley rats, and toxicity testing has been done in other strains as well, the question of which model to use for other strains of rats needs to be considered. Of greatest relevance to the current
P-33
Appendix P
effort is consideration of Wistar rats, which were used in the key oral noncancer study (Mellert et al., 2004). Based on the study urinary excretion of metabolites by Wistar rats, as reported by Engstrom et al. (1985), the models Krishnan and Dennison models are essentially equally successful at reproducing the data. Likewise, the two models are equally successful at predicting the amount of metabolism by Wistar rats in Chin et al. (1980). The Krishnan model, however, performed significantly better in predicting the post exposure exhalation of ethylbenzene measured in Chin et al. (1980). Based on this evaluation, we recommend the use of the Krishnan model for Wistar rats. The mouse model (Nong et al., 2006) adequately describes the blood and tissue kinetics of ethylbenzene in mice exposed to 75 to 750 ppm ethylbenzene in single or repeated exposures. Nong et al. (2006) have noted uncertainty with regard to the precise location of the extensive extrahepatic metabolism that is evident for ethylbenzene-exposed mice. This model can be confidently used to estimate blood and tissue ethylbenzene concentrations, and liver and whole-body metabolism for acute and repeated exposures up to 750 ppm ethylbenzene. The development of alternative descriptions of extrahepatic metabolism allowed for conservative estimation of lung metabolism for acute and repeated exposures up to 750 ppm. The human model assumes a body weight-normalized metabolic rate equivalent to that determined for rats (Tardif et al., 1997). Although this assumption was initially validated only against blood and breath data from a 33-ppm exposure, the model was found to predict data from low level occupational exposures (blood concentrations after 1.3-5.7 ppm, 8 hr-TWA exposures) and higher concentration volunteer exposures (excretion of urinary metabolites after 150 ppm exposure) with acceptable accuracy. Based on the ability of the model to reproduce blood concentrations from the low-level, occupational exposures, the PBPK model can be used with high confidence for humans exposed to ethylbenzene at all exposure levels expected to be relevant to the VCCEP analyses.
P-34
Appendix P
REFERENCES Bergeron, R.M., Desai, K., Serron, S.C., Cawley, G.F., Eyer, C.S., and Backes, W.L. (1999). Changes in the expression of cytochrome P450s 2B1, 2B2, 2E1, and 2C11 in response to daily aromatic hydrocarbon treatment. Toxicol. Appl. Pharmacol. 157:1-8. Boogaard, P.J., de Kloe, K.P., Bierau, J., Kuiken, G., Borkulo, P.E., Watson, W.P., and van Sittert, N.J. (2000). Metabolic inactivation of five glycidyl ethers in lung and liver of humans, rats and mice in vitro. Xenobiotica 30:485-502. Cappaert, N.L., Klis, S.F., Muijser, H., Kulig, B.M., Ravensberg, L.C., and Smoorenburg, G.F. (2002). Differential susceptibility of rats and guinea pigs to the ototoxic effects of ethyl benzene. Neurotoxicol. Teratol. 24:503-10. Charest-Tardif, G., Tardif, R., and Krishnan, K. (2006). Inhalation pharmacokinetics of ethylbenzene in B6C3F1 mice. Toxicol. Appl. Pharmacol. 210:63-9. Chin, B.H., McKevley, J.A., Tyler, T.R., Calisti, L.J., Kozbelt, S.J., and Sullivan, L.J. (1980). Absorption, distribution, and excretion of ethylbenzene, ethylcyclohexane, and methylethylbenzene isomers in rats. Bull. Environ. Contam. Toxicol. 24, 477-483. Dennison, J.E., Bigelow, P.L., Mumtaz, M.M., Andersen, M.E., Dobrev, I.D., and Yang R.S. (2005). Evaluation of potential toxicity from co-exposure to three CNS depressants (toluene, ethylbenzene, and xylene) under resting and working conditions using PBPK modeling. J. Occup. Environ. Hyg. 2:127-35. Dennison, J.E., Andersen, M.E., and Yang, R.S. (2003). Characterization of the pharmacokinetics of gasoline using PBPK modeling with a complex mixtures chemical lumping approach. Inhal. Toxicol. 15:961-86. Engstrom, K., Elovaara, E., and Aitio, A. (1985). Metabolism of ethylbenzene in the rat during long-term intermittent inhalation exposure. Xenobiotica 15:281-6. Engstrom, K., Riihimaki, V., and Laine, A. (1984). Urinary disposition of ethylbenzene and m-xylene in man following separate and combined exposure. Int. Arch. Occup. Environ. Health. 54:355-63. Faber, W.D., Roberts, L.S., Stump, D.G., Tardif, R., Krishnan, K., Tort, M., Dimond, S., Dutton, D., Moran, E., and Lawrence, W. (2006). Two generation reproduction study of ethylbenzene by inhalation in Crl-CD rats. Birth Defects Res. B Dev. Reprod. Toxicol. 77:10-21. Freundt, K.J., Römer, K.G., and Federsel, R.J. (1989). Decrease of inhaled toluene, ethyl benzene, m-xylene, or mesitylene in rat blood after combined exposure to ethyl acetate. Bull. Environ. Contam. Toxicol. 42:495-8.
P-35
Appendix P
Fuciarelli, A.F. (2000). Ethylbenzene two-week repeated-dose inhalation toxicokinetic study report. NTP Task Number CHEM.2477. Battelle, Richland, Washington. January 2000. Gentry, P.R., Haber, L.T., McDonald, T.B., Zhao, Q., Covington, T., Nance, P., Clewell, H.J. III, Lipscomb, J.C., and Barton, H.A. (2004). Data for physiologically based pharmacokinetic modeling in neonatal animals: physiological parameters in mice and Sprague-Dawley rats. J. Child. Health 2:363-411. Gromiec, J.P. and Piotrowski, J.K. (1984). Urinary mandelic acid as an exposure test for ethylbenzene. Int. Arch. Occup. Environ. Health 55:61-72. Haddad, S., Beliveau, M., Tardif, R., and Krishnan, K. (2001). A PBPK modeling-based approach to account for interactions in the health risk assessment of chemical mixtures. Toxicol. Sci. 63:125-31. Haddad, S., Charest-Tardif, G., Tardif, R., and Krishnan, K. (2000). Validation of a physiological modeling framework for simulating the toxicokinetics of chemicals in mixtures. Toxicol. Appl. Pharmacol. 167:199-209. Haddad, S., Tardif, R., Charest-Tardif, G., and Krishnan, K. (1999). Physiological modeling of the toxicokinetic interactions in a quaternary mixture of aromatic hydrocarbons. Toxicol. Appl. Pharmacol. 161:249-57. Heymann, M.A., Iwamoto, H.S., and Rudolph, A.M. (1981). Factors affecting changes in the neonatal systemic circulation. Ann. Rev. Physiol. 43:371-383. International Commission on Radiological Protection (ICRP) (1975). Report of the Task Group on Reference Man. ICRP No. 23. Pergamon Press, Inc. Elmsford, New York. Jang, J.Y., Droz, P.O., and Kim, S. (2001). Biological monitoring of workers exposed to ethylbenzene and co-exposed to xylene. Int. Arch. Occup. Environ. Health 74:31-7. Johnsrud, E.K., Koukouritaki, S.B., Divakaran, K., Brunengraber, L.L., Hines, R.N., and McCarver, D.G. (2003). Human hepatic CYP2E1 expression during development. J. Pharmacol. Exp. Ther. 307:402-7. Kawai, T., Yasugi, T., Mizunuma, K., Horiguchi, S., Iguchi, H., Uchida, Y., Iwami, O., and Ikeda, M. (1992). Comparative evaluation of urinalysis and blood analysis as means of detecting exposure to organic solvents at low concentrations. Int. Arch. Occup. Environ. Health 64:223-34. Knecht, U., Reske, A., and Woitowitz, H.J. (2000). Biological monitoring of standardized exposure to ethylbenzene: evaluation of a biological tolerance (BAT) value. Arch. Toxicol. 73:632-40.
P-36
Appendix P
Krishnan, K. 2002. Estimation of oral doses for use in a preliminary reproduction study of ethylbenzene in the rat. September 13, 2002. University of Montreal. Kumarathasan, P., Otson, R., and Chu, I. (1998). Application of an automated HS-GC method in partition coefficient determination for xylenes and ethylbenzene in rat tissues. Chemosphere 37:159-78. Meulenberg, C.J., Wijnker, A.G., and Vijverberg, H.P. (2003). Relationship between olive oil:air, saline:air, and rat brain:air partition coefficients of organic solvents in vitro. J. Toxicol. Environ. Health A. 66:1985-98. Nong, A., Charest-Tardif, G., Tardif, R., Lewis, D.F.V., Sweeney, L.M., Gargas, M.L., and Krishnan, K. (2006). Physiologically-based modeling of the inhalation pharmacokinetics of ethylbenzene in B6C3F1 mice. Submitted. Pierce, C.H., Dills, R.L., Silvey, G.W., and Kalman, D.A. (1996). Partition coefficients between human blood or adipose tissue and air for aromatic solvents. Scand. J. Work Environ. Health 22:112-8. Romer, K.G., Federsel, R.J., and Freundt, K.J. (1986). Rise of inhaled toluene, ethyl benzene, m-xylene, or mesitylene in rat blood after treatment with ethanol. Bull. Environ. Contam. Toxicol. 37:874-6. Saghir, S.A. and Rick, D.L. (2005). Ethylbenzene: in vitro metabolism in rat, mouse, and human liver and lung microsomes. The Dow Chemical Company, Midland, Michigan. December 8, 2005. Sams, C., Loizou, G.D., Cocker, J., and Lennard, M.S. (2004). Metabolism of ethylbenzene by human liver microsomes and recombinant human cytochrome P450s (CYP). Toxicol. Lett. 147:253-60. Sato, A. and Nakajima, T. (1979). Partition coefficients of some aromatic hydrocarbons and ketones in water, blood and oil. Br. J. Ind. Med. 36:231-4. Sweeney, L.M. and Gargas, M.L. (2006). PBPK Modeling of Ethylbenzene Exposure of Infants Via Breastmilk. The Sapphire Group, Dayton, Ohio. February 15, 2006. (Appendix N.) Tardif, R., Charest-Tardif, G., Brodeur J, Krishnan K. (1997). Physiologically based pharmacokinetic modeling of a ternary mixture of alkyl benzenes in rats and humans. Toxicol. Appl. Pharmacol. 144:120-34. Tardif, R., Charest-Tardif, G., and Brodeur, J. (1996). Comparison of the influence of binary mixtures versus a ternary mixture of inhaled aromatic hydrocarbons on their blood kinetics in the rat. Arch. Toxicol. 70:405-13.
P-37

Appendix P
U.S. EPA. (2006). Approaches for the Application of Physiologically Based Pharmacokinetic (PBPK) Models and Supporting Data in Risk Assessment (Final Report). U.S. Environmental Protection Agency, Washington, D.C., EPA/600/R-05/043F.
P-38
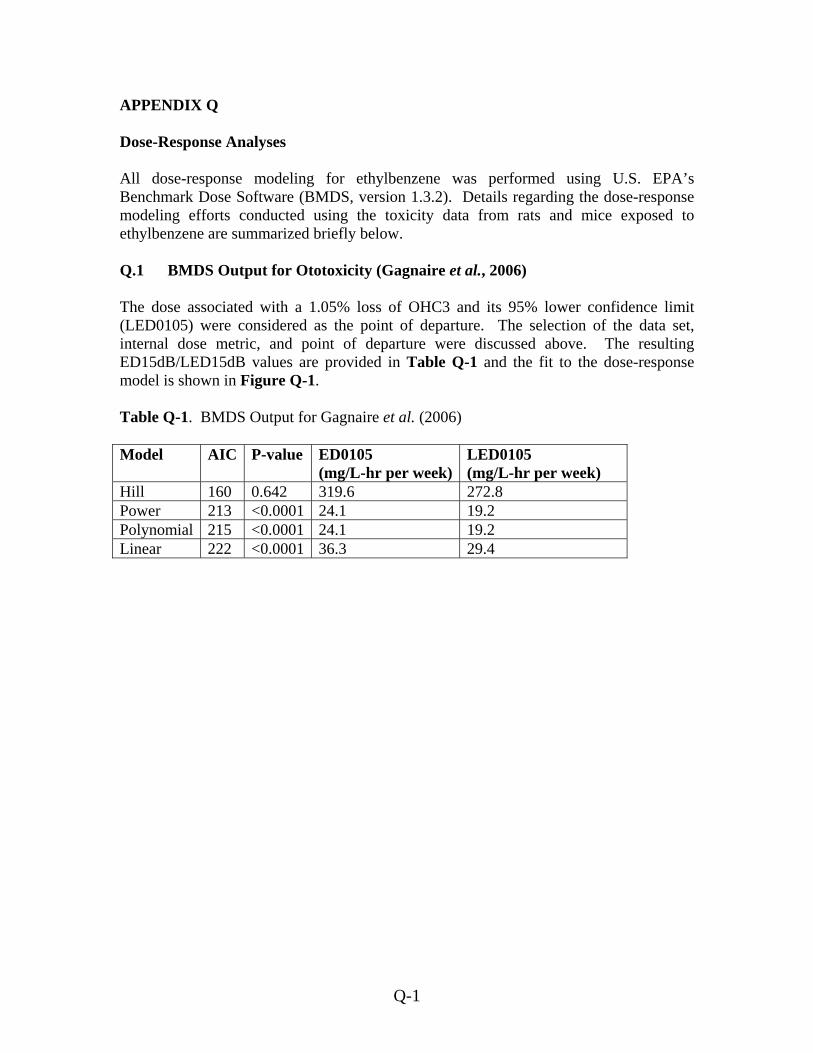
APPENDIX Q Dose-Response Analyses All dose-response modeling for ethylbenzene was performed using U.S. EPA’s Benchmark Dose Software (BMDS, version 1.3.2). Details regarding the dose-response modeling efforts conducted using the toxicity data from rats and mice exposed to ethylbenzene are summarized briefly below. Q.1 BMDS Output for Ototoxicity (Gagnaire et al., 2006) The dose associated with a 1.05% loss of OHC3 and its 95% lower confidence limit (LED0105) were considered as the point of departure. The selection of the data set, internal dose metric, and point of departure were discussed above. The resulting ED15dB/LED15dB values are provided in Table Q-1 and the fit to the dose-response model is shown in Figure Q-1. Table Q-1. BMDS Output for Gagnaire et al. (2006) Model AIC P-value ED0105
(mg/L-hr per week)LED0105 (mg/L-hr per week)
Hill 160 0.642 319.6 272.8 Power 213 <0.0001 24.1 19.2 Polynomial 215 <0.0001 24.1 19.2 Linear 222 <0.0001 36.3 29.4
Q-1
0
20
40
60
80
100
0 500 1000 1500 2000 2500 3000 3500 4000
Mea
n R
espo
nse
dose
Hill Model with 0.95 Confidence Level
BMDBMDL
Hill
0
20
40
60
80
100
0 500 1000
0
20
40
60
80
100
0 500 1000 1500 2000 2500 3000 3500 4000
Mea
n R
espo
nse
dose
Hill Model with 0.95 Confidence Level
BMDBMDL
Hill
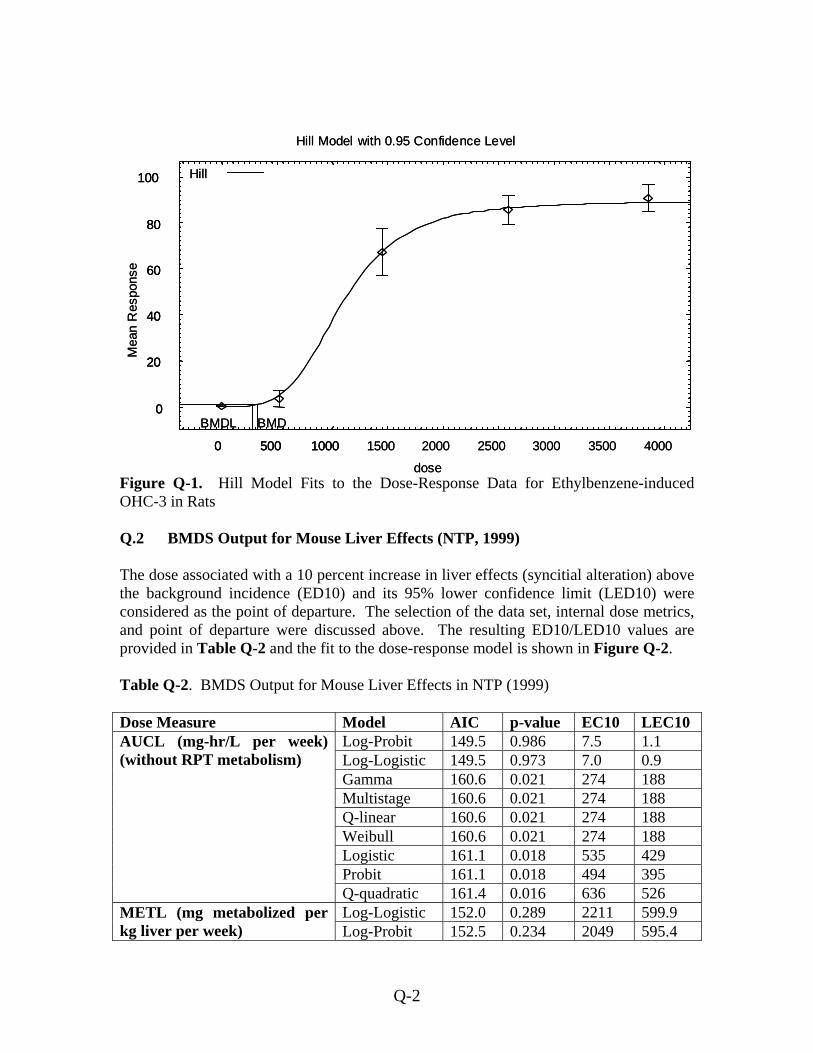
Figure Q-1. Hill Model Fits to the Dose-Response Data for Ethylbenzene-induced OHC-3 in Rats Q.2 BMDS Output for Mouse Liver Effects (NTP, 1999) The dose associated with a 10 percent increase in liver effects (syncitial alteration) above the background incidence (ED10) and its 95% lower confidence limit (LED10) were considered as the point of departure. The selection of the data set, internal dose metrics, and point of departure were discussed above. The resulting ED10/LED10 values are provided in Table Q-2 and the fit to the dose-response model is shown in Figure Q-2. Table Q-2. BMDS Output for Mouse Liver Effects in NTP (1999) Dose Measure Model AIC p-value EC10 LEC10
Log-Probit 149.5 0.986 7.5 1.1 Log-Logistic 149.5 0.973 7.0 0.9 Gamma 160.6 0.021 274 188 Multistage 160.6 0.021 274 188 Q-linear 160.6 0.021 274 188 Weibull 160.6 0.021 274 188 Logistic 161.1 0.018 535 429 Probit 161.1 0.018 494 395
AUCL (mg-hr/L per week) (without RPT metabolism)
Q-quadratic 161.4 0.016 636 526 Log-Logistic 152.0 0.289 2211 599.9 METL (mg metabolized per
kg liver per week) Log-Probit 152.5 0.234 2049 595.4
Q-2
Dose Measure Model AIC p-value EC10 LEC10 Gamma 154 0.109 4888 3535 Multistage 154 0.109 4888 3535 Q-linear 154 0.109 4888 3535 Weibull 154 0.109 4888 3535 Probit 156.5 0.105 10327 8480 Logistic 156.9 0.096 11247 9232
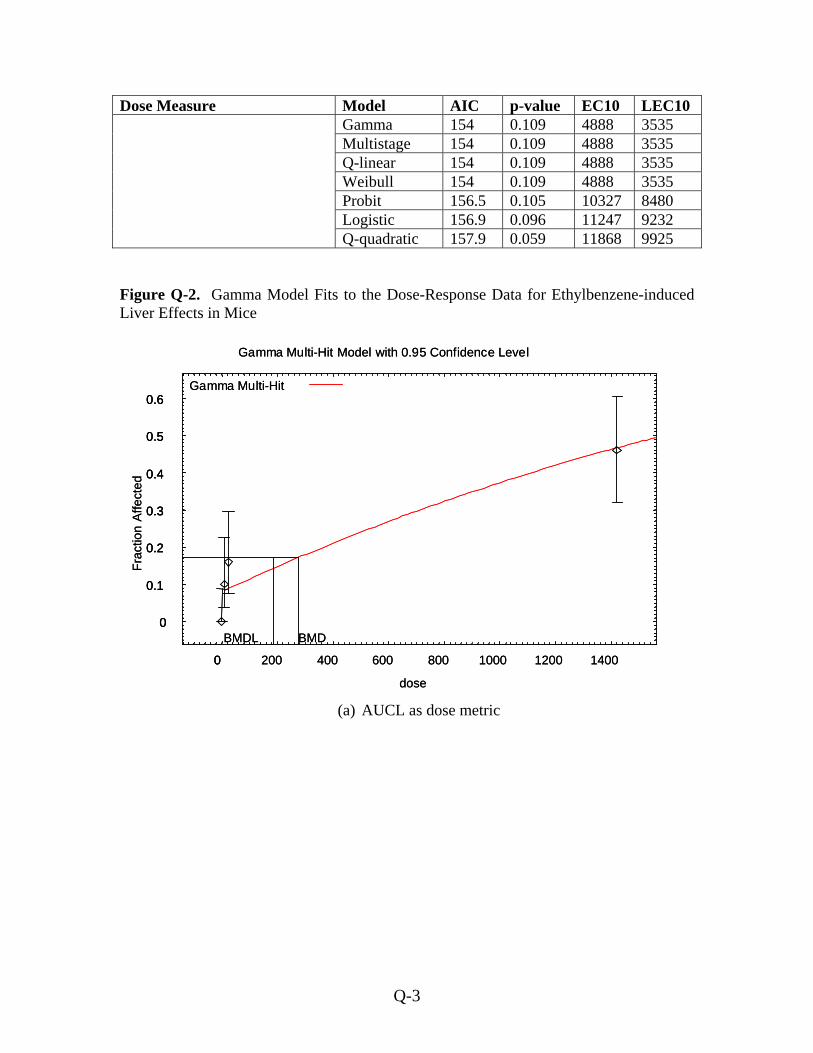
Q-quadratic 157.9 0.059 11868 9925 Figure Q-2. Gamma Model Fits to the Dose-Response Data for Ethylbenzene-induced Liver Effects in Mice
0
0.1
0.2
0.3
0.4
0.5
0.6
0 200 400 600 800 1000 1200 1400
Frac
tion
Affe
cted
dose
Gamma Multi-Hit Model with 0.95 Confidence Level
BMDL BMD
Gamma Multi-Hit
0
0.1
0.2
0.3
0.4
0.5
0.6
0
0
0.1
0.2
0.3
0.4
0.5
0.6
0 200 400 600 800 1000 1200 1400
Frac
tion
Affe
cted
dose
Gamma Multi-Hit Model with 0.95 Confidence Level
BMDL BMD
Gamma Multi-Hit
(a) AUCL as dose metric
Q-3
0
0.1
0.2
0.3
0.4
0.5
0.6
0 5000 10000 15000 20000 25000 30000
Frac
tion
Affe
cted
dose
Gamma Multi-Hit Model with 0.95 Confidence Level
BMDL BMD
Gamma Multi-Hit
0
0.1
0.2
0.3
0.4
0.5
0.6
0
0
0.1
0.2
0.3
0.4
0.5
0.6
0 5000 10000 15000 20000 25000 30000
Frac
tion
Affe
cted
dose
Gamma Multi-Hit Model with 0.95 Confidence Level
BMDL BMD
Gamma Multi-Hit
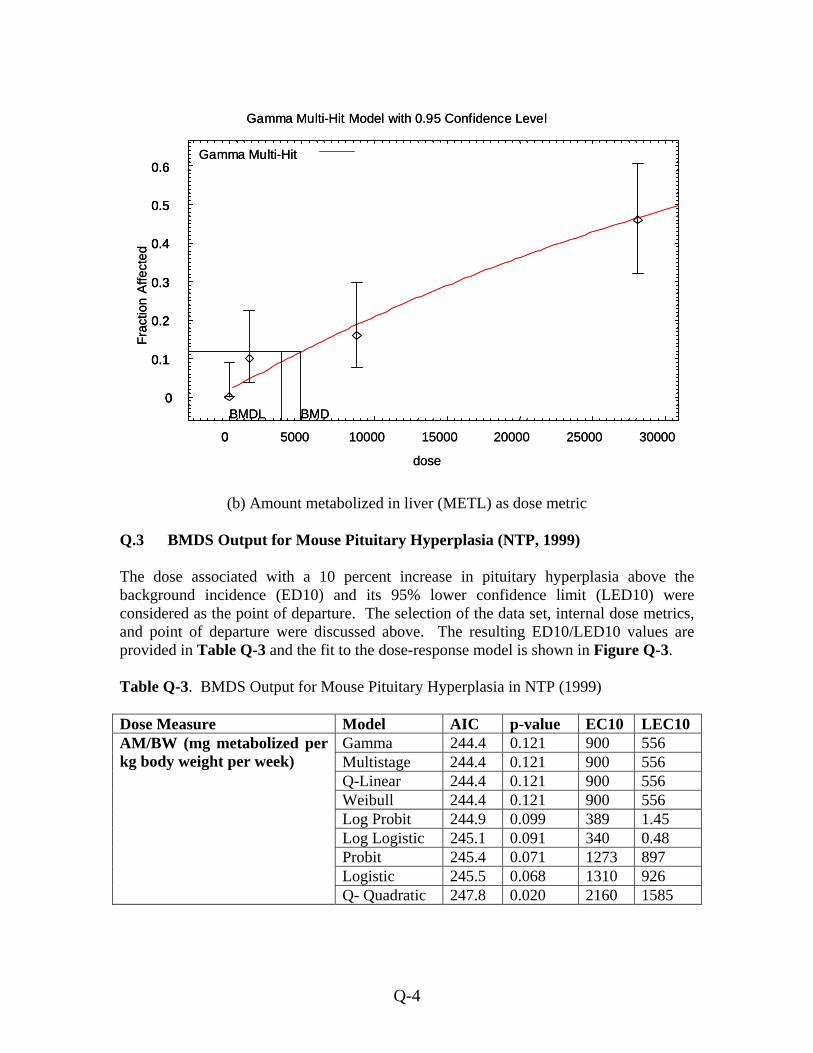
(b) Amount metabolized in liver (METL) as dose metric Q.3 BMDS Output for Mouse Pituitary Hyperplasia (NTP, 1999) The dose associated with a 10 percent increase in pituitary hyperplasia above the background incidence (ED10) and its 95% lower confidence limit (LED10) were considered as the point of departure. The selection of the data set, internal dose metrics, and point of departure were discussed above. The resulting ED10/LED10 values are provided in Table Q-3 and the fit to the dose-response model is shown in Figure Q-3. Table Q-3. BMDS Output for Mouse Pituitary Hyperplasia in NTP (1999) Dose Measure Model AIC p-value EC10 LEC10
Gamma 244.4 0.121 900 556 Multistage 244.4 0.121 900 556 Q-Linear 244.4 0.121 900 556 Weibull 244.4 0.121 900 556 Log Probit 244.9 0.099 389 1.45 Log Logistic 245.1 0.091 340 0.48 Probit 245.4 0.071 1273 897 Logistic 245.5 0.068 1310 926
AM/BW (mg metabolized per kg body weight per week)
Q- Quadratic 247.8 0.020 2160 1585
Q-4
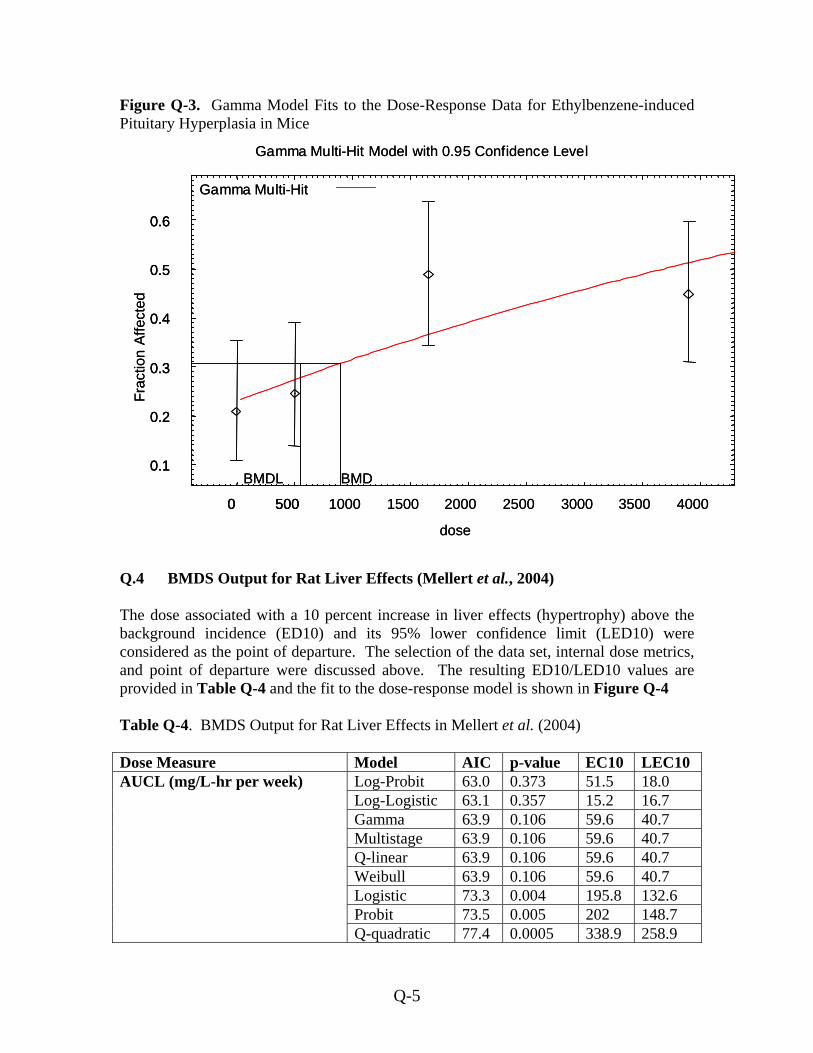
Figure Q-3. Gamma Model Fits to the Dose-Response Data for Ethylbenzene-induced Pituitary Hyperplasia in Mice
0.1
0.2
0.3
0.4
0.5
0.6
0 500 1000 1500 2000 2500 3000 3500 4000
Frac
tion
Affe
cted
dose
Gamma Multi-Hit Model with 0.95 Confidence Level
BMDL BMD
Gamma Multi-Hit
0.1
0.2
0.3
0.4
0.5
0.6
0 500
0.1
0.2
0.3
0.4
0.5
0.6
0 500 1000 1500 2000 2500 3000 3500 4000
Frac
tion
Affe
cted
dose
Gamma Multi-Hit Model with 0.95 Confidence Level
BMDL BMD
Gamma Multi-Hit
Q.4 BMDS Output for Rat Liver Effects (Mellert et al., 2004) The dose associated with a 10 percent increase in liver effects (hypertrophy) above the background incidence (ED10) and its 95% lower confidence limit (LED10) were considered as the point of departure. The selection of the data set, internal dose metrics, and point of departure were discussed above. The resulting ED10/LED10 values are provided in Table Q-4 and the fit to the dose-response model is shown in Figure Q-4 Table Q-4. BMDS Output for Rat Liver Effects in Mellert et al. (2004) Dose Measure Model AIC p-value EC10 LEC10
Log-Probit 63.0 0.373 51.5 18.0 Log-Logistic 63.1 0.357 15.2 16.7 Gamma 63.9 0.106 59.6 40.7 Multistage 63.9 0.106 59.6 40.7 Q-linear 63.9 0.106 59.6 40.7 Weibull 63.9 0.106 59.6 40.7 Logistic 73.3 0.004 195.8 132.6 Probit 73.5 0.005 202 148.7
AUCL (mg/L-hr per week)
Q-quadratic 77.4 0.0005 338.9 258.9
Q-5
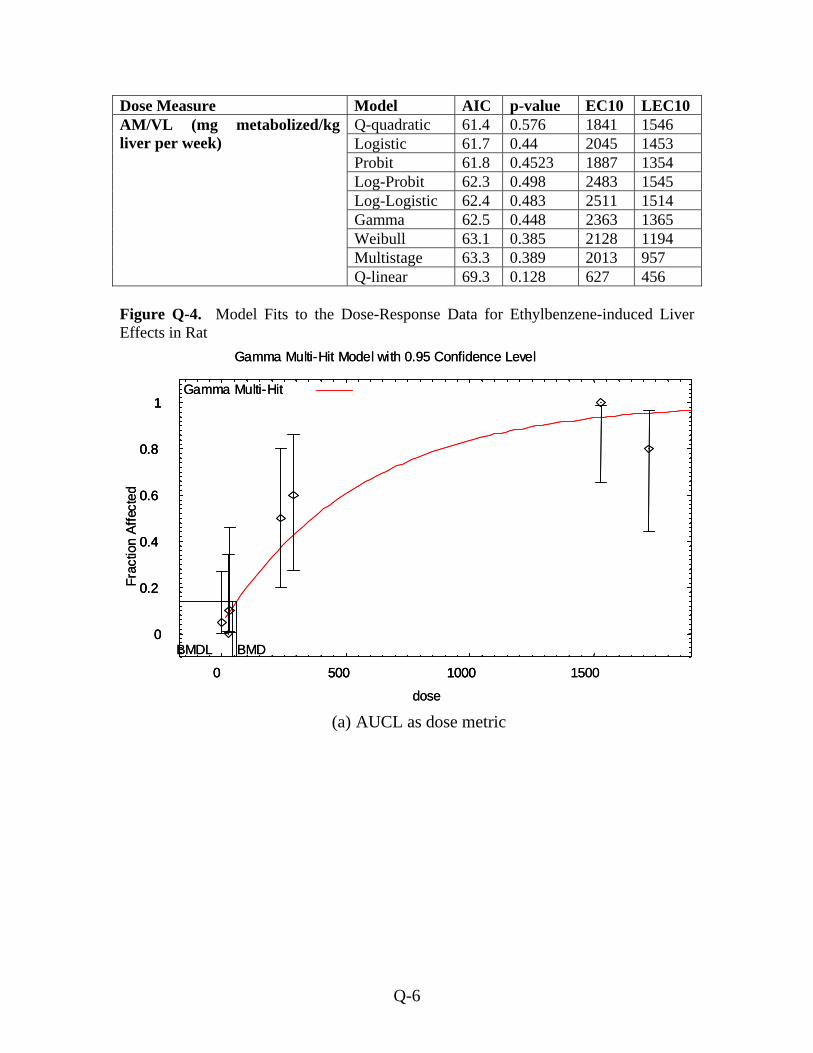
Dose Measure Model AIC p-value EC10 LEC10 Q-quadratic 61.4 0.576 1841 1546 Logistic 61.7 0.44 2045 1453 Probit 61.8 0.4523 1887 1354 Log-Probit 62.3 0.498 2483 1545 Log-Logistic 62.4 0.483 2511 1514 Gamma 62.5 0.448 2363 1365 Weibull 63.1 0.385 2128 1194 Multistage 63.3 0.389 2013 957
AM/VL (mg metabolized/kg liver per week)
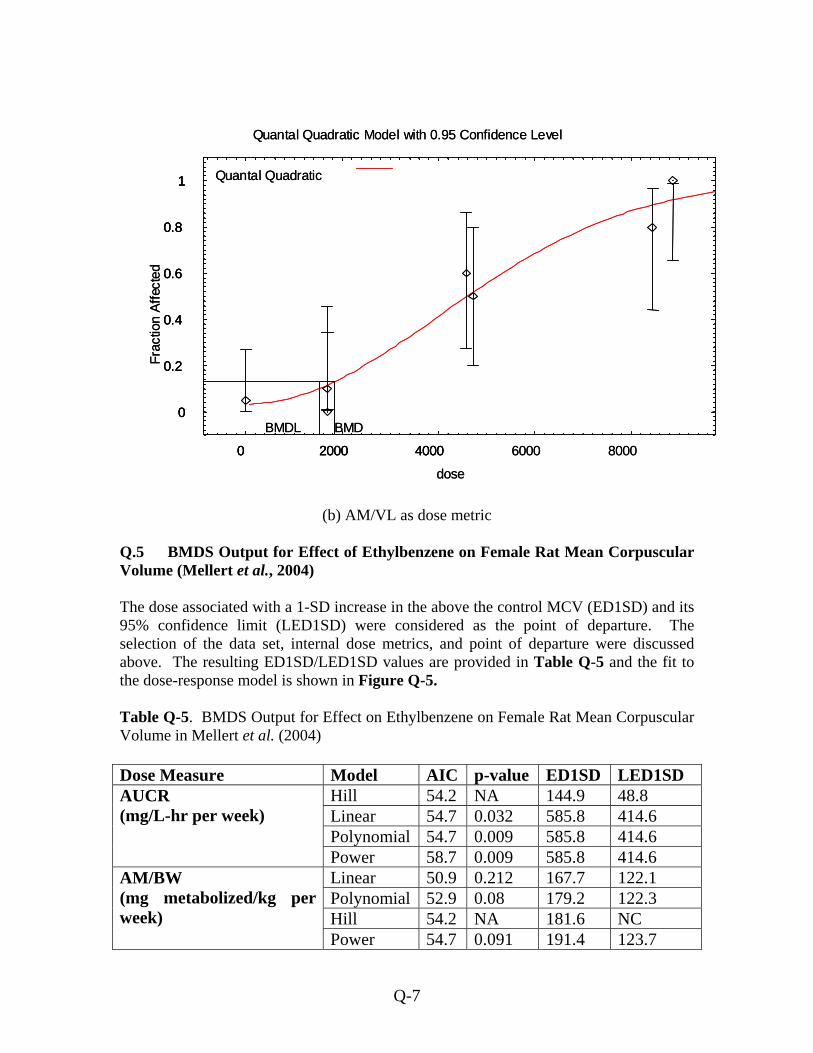
Q-linear 69.3 0.128 627 456 Figure Q-4. Model Fits to the Dose-Response Data for Ethylbenzene-induced Liver Effects in Rat
0
0.2
0.4
0.6
0.8
1
0 500 1000 1500
Frac
tion
Affe
cted
dose
Gamma Multi-Hit Model with 0.95 Confidence Level
BMDL BMD
Gamma Multi-Hit
0
0.2
0.4
0.6
0.8
1
0 500 1000
0
0.2
0.4
0.6
0.8
1
0 500 1000 1500
Frac
tion
Affe
cted
dose
Gamma Multi-Hit Model with 0.95 Confidence Level
BMDL BMD
Gamma Multi-Hit
(a) AUCL as dose metric
Q-6
0
0.2
0.4
0.6
0.8
1
0 2000 4000 6000 8000
Frac
tion
Affe
cted
dose
Quantal Quadratic Model with 0.95 Confidence Level
BMDL BMD
Quantal Quadratic
0
0.2
0.4
0.6
0.8
1
0 2000 4000
0
0.2
0.4
0.6
0.8
1
0 2000 4000 6000 8000
Frac
tion
Affe
cted
dose
Quantal Quadratic Model with 0.95 Confidence Level
BMDL BMD
Quantal Quadratic
(b) AM/VL as dose metric
Q.5 BMDS Output for Effect of Ethylbenzene on Female Rat Mean Corpuscular Volume (Mellert et al., 2004) The dose associated with a 1-SD increase in the above the control MCV (ED1SD) and its 95% confidence limit (LED1SD) were considered as the point of departure. The selection of the data set, internal dose metrics, and point of departure were discussed above. The resulting ED1SD/LED1SD values are provided in Table Q-5 and the fit to the dose-response model is shown in Figure Q-5. Table Q-5. BMDS Output for Effect on Ethylbenzene on Female Rat Mean Corpuscular Volume in Mellert et al. (2004) Dose Measure Model AIC p-value ED1SD LED1SD
Hill 54.2 NA 144.9 48.8 Linear 54.7 0.032 585.8 414.6 Polynomial 54.7 0.009 585.8 414.6
AUCR (mg/L-hr per week)
Power 58.7 0.009 585.8 414.6 Linear 50.9 0.212 167.7 122.1 Polynomial 52.9 0.08 179.2 122.3 Hill 54.2 NA 181.6 NC
AM/BW (mg metabolized/kg per week)
Power 54.7 0.091 191.4 123.7
Q-7
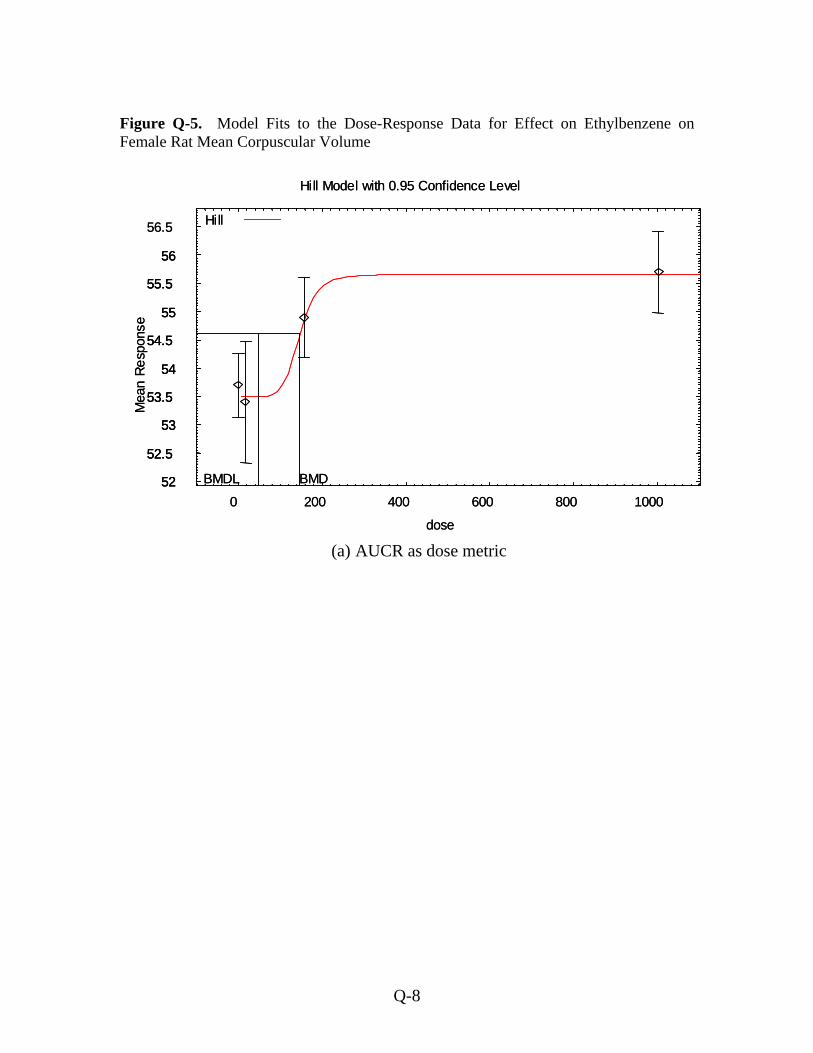
Figure Q-5. Model Fits to the Dose-Response Data for Effect on Ethylbenzene on Female Rat Mean Corpuscular Volume
52
52.5
53
53.5
54
54.5
55
55.5
56
56.5
0 200 400 600 800 1000
Mea
n Re
spon
se
dose
Hill Model with 0.95 Confidence Level
BMDBMDL
Hill
52
52.5
53
53.5
54
54.5
55
55.5
56
52
52.5
53
53.5
54
54.5
55
55.5
56
56.5
0 200 400 600 800 1000
Mea
n Re
spon
se
dose
Hill Model with 0.95 Confidence Level
BMDBMDL
Hill
(a) AUCR as dose metric
Q-8
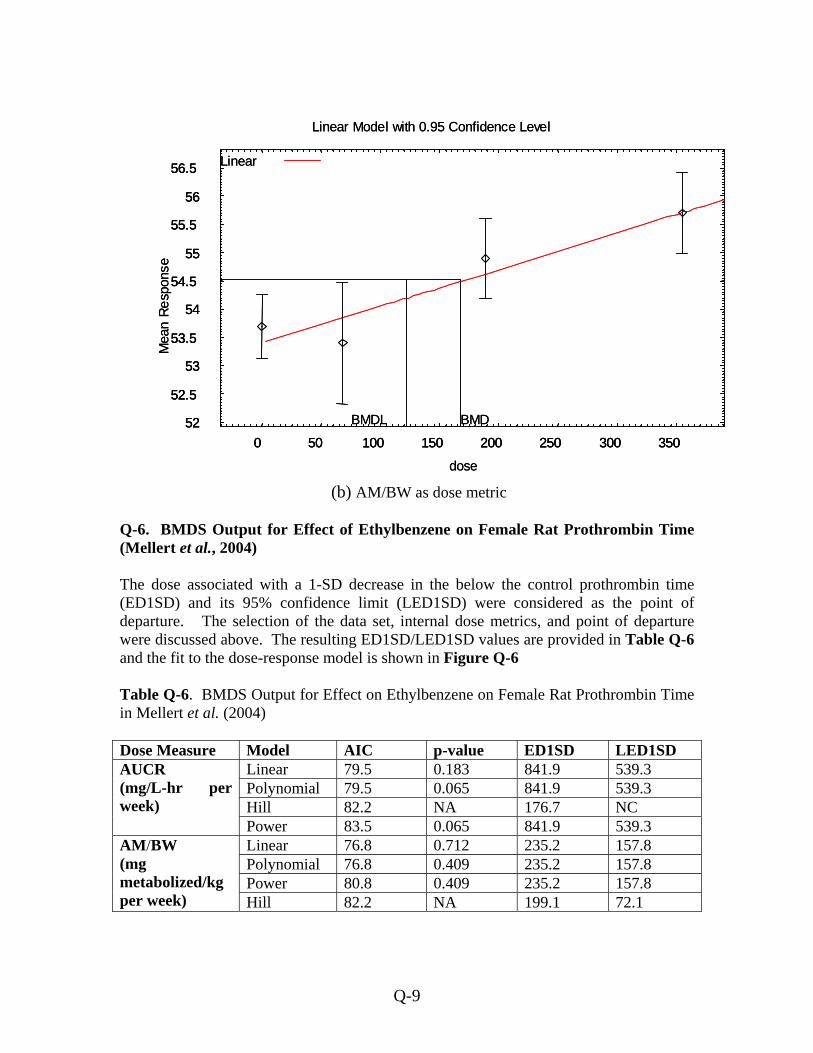
52
52.5
53
53.5
54
54.5
55
55.5
56
56.5
0 50 100 150 200 250 300 350
Mea
n Re
spon
se
dose
Linear Model with 0.95 Confidence Level
BMDBMDL
Linear
52
52.5
53
53.5
54
54.5
55
55.5
56
52
52.5
53
53.5
54
54.5
55
55.5
56
56.5
0 50 100 150 200 250 300 350
56.5
0 50 100 150 200 250 300 350
Mea
n Re
spon
se
dose
Linear Model with 0.95 Confidence Level
BMDBMDL
Linear
(b) AM/BW as dose metric
Q-6. BMDS Output for Effect of Ethylbenzene on Female Rat Prothrombin Time (Mellert et al., 2004) The dose associated with a 1-SD decrease in the below the control prothrombin time (ED1SD) and its 95% confidence limit (LED1SD) were considered as the point of departure. The selection of the data set, internal dose metrics, and point of departure were discussed above. The resulting ED1SD/LED1SD values are provided in Table Q-6 and the fit to the dose-response model is shown in Figure Q-6 Table Q-6. BMDS Output for Effect on Ethylbenzene on Female Rat Prothrombin Time in Mellert et al. (2004) Dose Measure Model AIC p-value ED1SD LED1SD
Linear 79.5 0.183 841.9 539.3 Polynomial 79.5 0.065 841.9 539.3 Hill 82.2 NA 176.7 NC
AUCR (mg/L-hr per week)
Power 83.5 0.065 841.9 539.3 Linear 76.8 0.712 235.2 157.8 Polynomial 76.8 0.409 235.2 157.8 Power 80.8 0.409 235.2 157.8
AM/BW (mg metabolized/kg per week) Hill 82.2 NA 199.1 72.1
Q-9
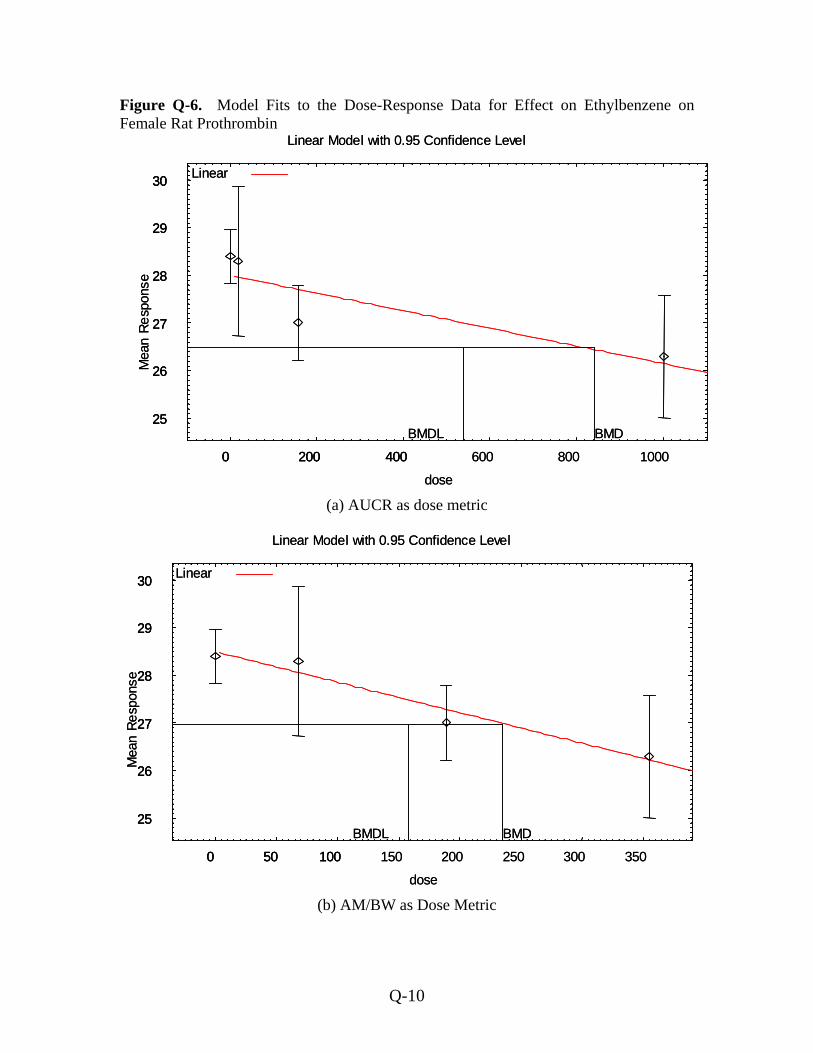
Figure Q-6. Model Fits to the Dose-Response Data for Effect on Ethylbenzene on Female Rat Prothrombin
25
26
27
28
29
30
0 200 400 600 800 1000
Mea
n Re
spon
se
dose
Linear Model with 0.95 Confidence Level
BMDBMDL
Linear
25
26
27
28
29
30
0 200 400
25
26
27
28
29
30
0 200 400 600 800 1000
Mea
n Re
spon
se
dose
Linear Model with 0.95 Confidence Level
BMDBMDL
Linear
(a) AUCR as dose metric
25
26
27
28
29
30
0 50 100 150 200 250 300 350
Mea
n Re
spon
se
dose
Linear Model with 0.95 Confidence Level
BMDBMDL
Linear
25
26
27
28
29
30
0 50 100
25
26
27
28
29
30
0 50 100 150 200 250 300 350
Mea
n Re
spon
se
dose
Linear Model with 0.95 Confidence Level
BMDBMDL
Linear
(b) AM/BW as Dose Metric
Q-10
Appendix R
PBPK modeling for the interpretation of biomonitoring data on
ethylbenzene in humans
Kannan Krishnan, Ph.D. (2001)
A written report of the work performed under ACC Agreement No. EB-9.0-CONS-Krishnan
(Minor revisions made for public release under VCCEP by Lisa M. Sweeney, Ph.D.,
DABT, 2006)
Page R-1

Page R-2
1. Description of Report Content 1.1 Overview The work will facilitate the interpretation of the human biomonitoring data for ethylbenzene (EBZ) based on pharmacokinetic principles. Physiologically-based pharmacokinetic (PBPK) model will be used for interpreting the biomonitoring data (e.g., blood EBZ concentration). The initial phase involved the reconstruction of the rat and human PBPK models for EBZ (in Microsoft EXCEL) and the successful reproduction of previously published simulations of EBZ kinetics. The PBPK model was used to simulate the kinetics of EBZ in human volunteers exposed to 33 ppm for 7 hr and in rats exposed for 100 or 200 ppm for 4 hr in inhalation chambers (original data published in Toxicology and Applied Pharmacology 144: 120-134, 1997). 1.2 Algorithms for EBZ dose reconstruction The steady-state equations of EBZ kinetics in humans were established and validated by comparing to human PBPK models. These equations, derived from PBPK models, give essentially the same results as the complete PBPK models for repeated exposure situations. These equations require only the blood concentrations as input to provide exposure concentrations as output, i.e., they facilitate dose reconstruction. 1.3. Interpretation of EBZ biomarker data The deliverables identified in the preceding paras (i.e., PBPK model and steady-state algorithm) can be used for interpreting the blood concentration data collected in human population. Published data on the blood concentrations of EBZ reported in human populations in the literature (probably two studies, to be identified) will be used for the reconstruction of exposure doses at steady-state condition. During this phase, the exposure duration and the exposure scenario that characterize the steady-state condition in normal human populations will be defined. 2. Results 2.1 Codes for rat and human PBPK models for EBZ This initial phase involved the reconstruction of the rat and human PBPK models for EBZ (in Microsoft EXCEL) and the successful reproduction of previously published simulations of EBZ kinetics. The PBPK model was used to simulate the kinetics of EBZ in human volunteers exposed to 33 ppm for 7 hr and in rats exposed for 100 or 200 ppm for 4 hr in inhalation chambers (original experimental data published in Toxicology and Applied Pharmacology 144: 120-134, 1997, were retrieved and used in the present study).
Page R-3
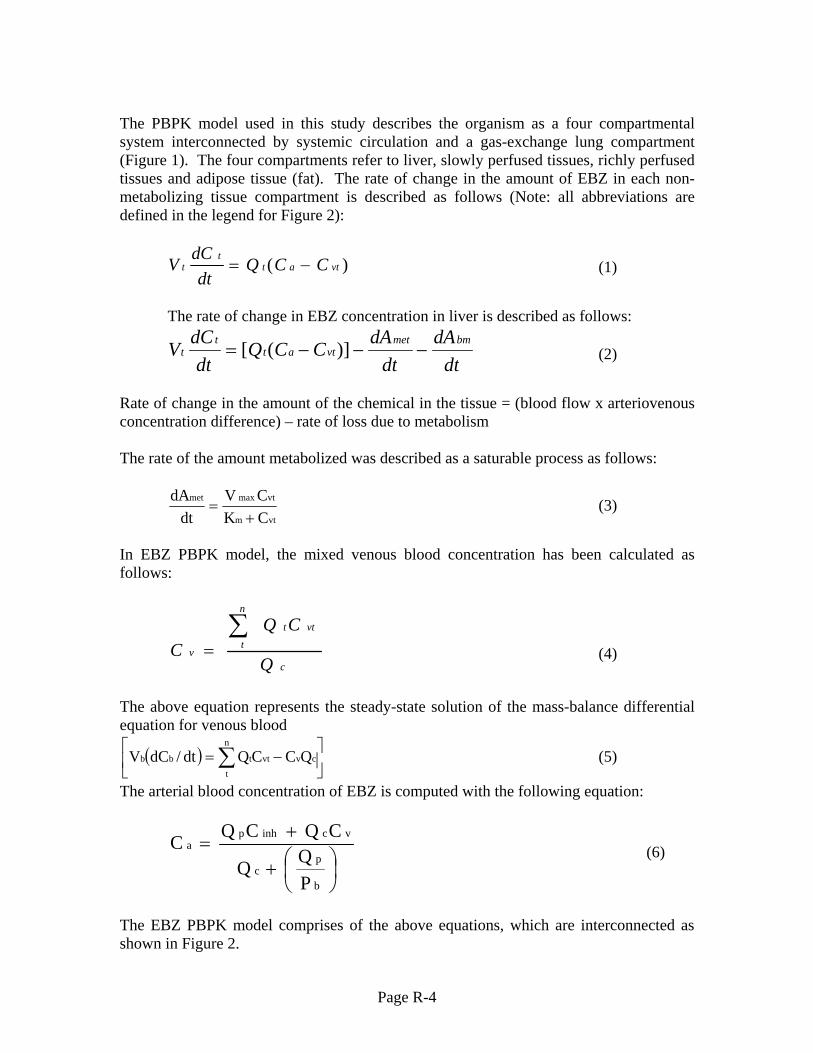
The PBPK model used in this study describes the organism as a four compartmental system interconnected by systemic circulation and a gas-exchange lung compartment (Figure 1). The four compartments refer to liver, slowly perfused tissues, richly perfused tissues and adipose tissue (fat). The rate of change in the amount of EBZ in each non-metabolizing tissue compartment is described as follows (Note: all abbreviations are defined in the legend for Figure 2):
)( vtatt
t CCQdt
dCV −= (1)
The rate of change in EBZ concentration in liver is described as follows:
dtdA
dtdACCQ
dtdCV bmmet
vtatt
t −−−= )]([ (2)
Rate of change in the amount of the chemical in the tissue = (blood flow x arteriovenous concentration difference) – rate of loss due to metabolism The rate of the amount metabolized was described as a saturable process as follows:
vtm
vtmaxmet
CKCV
dtdA
+= (3)
In EBZ PBPK model, the mixed venous blood concentration has been calculated as follows:
c
n
tvtt
vQ
CQC
∑= (4)
The above equation represents the steady-state solution of the mass-balance differential equation for venous blood
( ) ⎥⎦
⎤⎢⎣
⎡−= ∑
n
tcvvttbb QCCQdt/dCV (5)
The arterial blood concentration of EBZ is computed with the following equation:
⎟⎠⎞
⎜⎝⎛+
+=
b
pc
vcinhpa
PQQ
CQCQC (6)
The EBZ PBPK model comprises of the above equations, which are interconnected as shown in Figure 2.
Page R-4
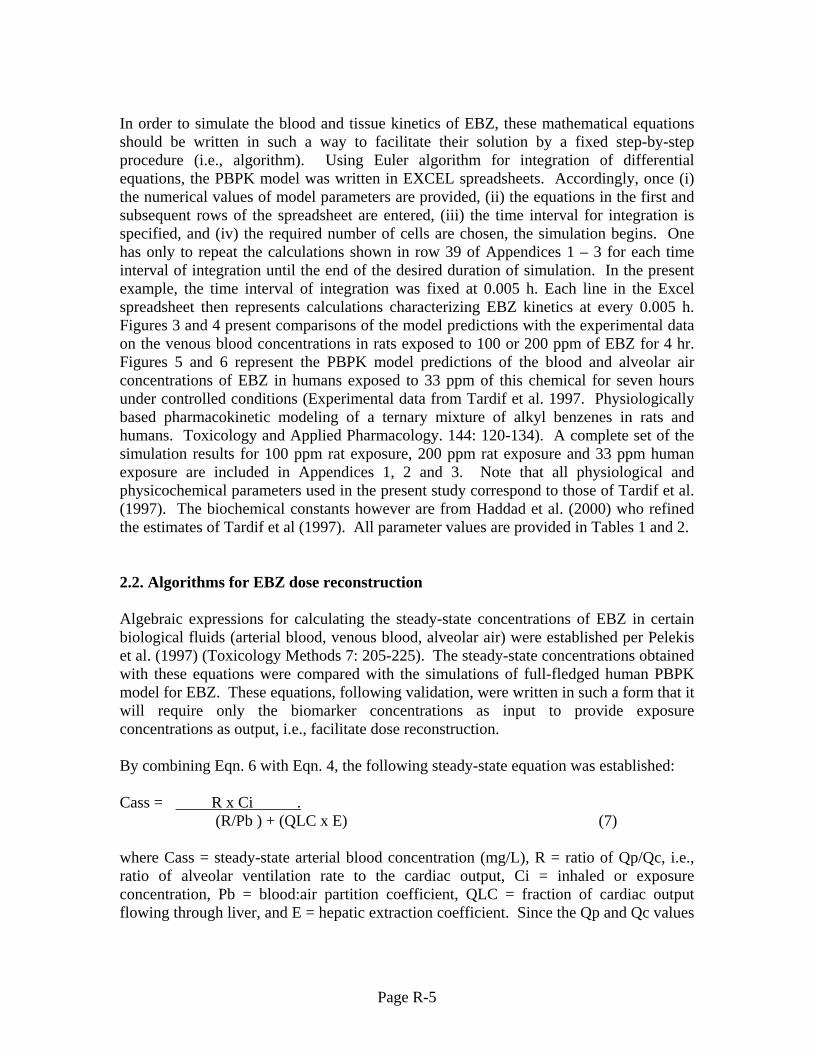
In order to simulate the blood and tissue kinetics of EBZ, these mathematical equations should be written in such a way to facilitate their solution by a fixed step-by-step procedure (i.e., algorithm). Using Euler algorithm for integration of differential equations, the PBPK model was written in EXCEL spreadsheets. Accordingly, once (i) the numerical values of model parameters are provided, (ii) the equations in the first and subsequent rows of the spreadsheet are entered, (iii) the time interval for integration is specified, and (iv) the required number of cells are chosen, the simulation begins. One has only to repeat the calculations shown in row 39 of Appendices 1 – 3 for each time interval of integration until the end of the desired duration of simulation. In the present example, the time interval of integration was fixed at 0.005 h. Each line in the Excel spreadsheet then represents calculations characterizing EBZ kinetics at every 0.005 h. Figures 3 and 4 present comparisons of the model predictions with the experimental data on the venous blood concentrations in rats exposed to 100 or 200 ppm of EBZ for 4 hr. Figures 5 and 6 represent the PBPK model predictions of the blood and alveolar air concentrations of EBZ in humans exposed to 33 ppm of this chemical for seven hours under controlled conditions (Experimental data from Tardif et al. 1997. Physiologically based pharmacokinetic modeling of a ternary mixture of alkyl benzenes in rats and humans. Toxicology and Applied Pharmacology. 144: 120-134). A complete set of the simulation results for 100 ppm rat exposure, 200 ppm rat exposure and 33 ppm human exposure are included in Appendices 1, 2 and 3. Note that all physiological and physicochemical parameters used in the present study correspond to those of Tardif et al. (1997). The biochemical constants however are from Haddad et al. (2000) who refined the estimates of Tardif et al (1997). All parameter values are provided in Tables 1 and 2. 2.2. Algorithms for EBZ dose reconstruction Algebraic expressions for calculating the steady-state concentrations of EBZ in certain biological fluids (arterial blood, venous blood, alveolar air) were established per Pelekis et al. (1997) (Toxicology Methods 7: 205-225). The steady-state concentrations obtained with these equations were compared with the simulations of full-fledged human PBPK model for EBZ. These equations, following validation, were written in such a form that it will require only the biomarker concentrations as input to provide exposure concentrations as output, i.e., facilitate dose reconstruction. By combining Eqn. 6 with Eqn. 4, the following steady-state equation was established: Cass = R x Ci . (R/Pb ) + (QLC x E) (7) where Cass = steady-state arterial blood concentration (mg/L), R = ratio of Qp/Qc, i.e., ratio of alveolar ventilation rate to the cardiac output, Ci = inhaled or exposure concentration, Pb = blood:air partition coefficient, QLC = fraction of cardiac output flowing through liver, and E = hepatic extraction coefficient. Since the Qp and Qc values
Page R-5
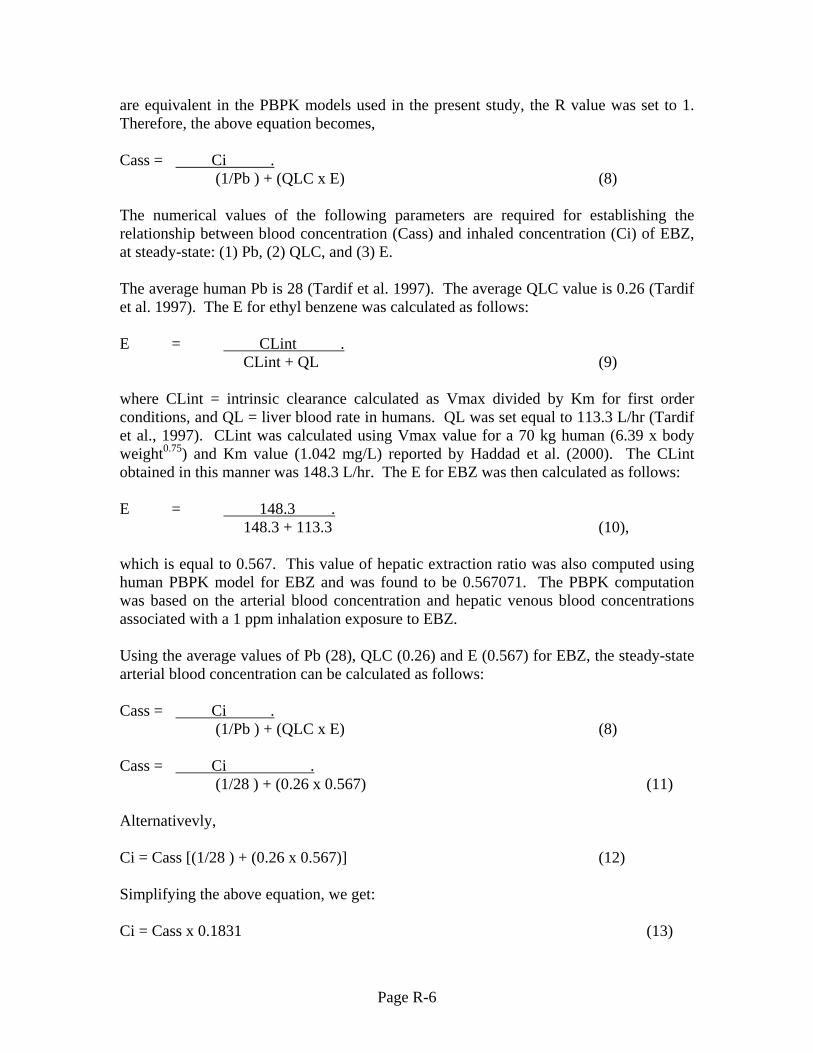
are equivalent in the PBPK models used in the present study, the R value was set to 1. Therefore, the above equation becomes, Cass = Ci . (1/Pb ) + (QLC x E) (8) The numerical values of the following parameters are required for establishing the relationship between blood concentration (Cass) and inhaled concentration (Ci) of EBZ, at steady-state: (1) Pb, (2) QLC, and (3) E. The average human Pb is 28 (Tardif et al. 1997). The average QLC value is 0.26 (Tardif et al. 1997). The E for ethyl benzene was calculated as follows: E = CLint . CLint + QL (9) where CLint = intrinsic clearance calculated as Vmax divided by Km for first order conditions, and QL = liver blood rate in humans. QL was set equal to 113.3 L/hr (Tardif et al., 1997). CLint was calculated using Vmax value for a 70 kg human (6.39 x body weight0.75) and Km value (1.042 mg/L) reported by Haddad et al. (2000). The CLint obtained in this manner was 148.3 L/hr. The E for EBZ was then calculated as follows: E = 148.3 . 148.3 + 113.3 (10), which is equal to 0.567. This value of hepatic extraction ratio was also computed using human PBPK model for EBZ and was found to be 0.567071. The PBPK computation was based on the arterial blood concentration and hepatic venous blood concentrations associated with a 1 ppm inhalation exposure to EBZ. Using the average values of Pb (28), QLC (0.26) and E (0.567) for EBZ, the steady-state arterial blood concentration can be calculated as follows: Cass = Ci . (1/Pb ) + (QLC x E) (8) Cass = Ci . (1/28 ) + (0.26 x 0.567) (11) Alternativevly, Ci = Cass [(1/28 ) + (0.26 x 0.567)] (12) Simplifying the above equation, we get: Ci = Cass x 0.1831 (13)
Page R-6
Using the above equation, the inhalation or exposure concentration of EBZ can be back-calculated with information on the steady-state blood concentration. For validating the above relationship, the calculated Cass value was compared with that simulated by a full-fledged human PBPK model, for a 1 ppm EBZ inhalation exposure. With the above Eqn, the Cass associated with 1 ppm or 0.004335 mg/L EBZ exposure will be equal to: Cass = 0.004335 which equals 0.02368 mg/L. 0.1831 The Cass simulated by the validated human PBPK model, for a continuous inhalation exposure to 1 ppm, was 0.0233 mg/L. The above two values compare well and are within about 2% of each other. The small difference is likely to be due to the rounding off differences between the computer program vs manual calculations. Table 3 presents the relationship between exposure concentration and steady-state blood concentrations of EBZ. The arterial and venous blood concentrations at steady-state are related by the following equation: Cass (1 – QLC x E) = Cv (14) In Table 3, the Cass values associated with any exposure level can be multiplied with 0.8526 to obtain the venous blood concentrations. The value of 0.8526 was derived as (1-QLC x E) or (1 – 0.26 x 0.567), and this is valid only for low exposure concentrations (i.e., those that give blood concentrations that are very low compared to the Km value). This is likely to be true for upto 10 ppm EBZ. The back-calculation algorithm relating the exposure concentration to the venous blood concentration then is as follows: Ci = Cv (1/Pb + QLC x E) (15) (1 – QLC x E) The steady-state alveolar concentrations are related to the arterial blood concentration by the blood:air partition coefficient. The back-calculation algorithm, based on Eqn. 8, is as follows: Ci = Calv (1 + QLC x E x Pb) (16)
Page R-7
In summary, the back-calculation algorithms established in the present study for EBZ are listed in the following table: Table 4. Back-calculation algorithms for EBZ. Input parameter Algebraic equation Simplified form Arterial blood conc. (Ca) Ca (1/Pb + QLC x E) Ca x 0.1831 Venous blood conc. (Cv) Cv (1/Pb+ QLC x E)
(1 – QLC x E) Cv x 0.2148
Alveolar air conc. (Calv) Calv (!+ QLC x E x Pb) Calv x 5.13 The equations in columns 2 and 3 above give exposure concentrations or inhaled concentrations as output. The simplified forms presented in Column 3 were derived using the numerical values of parameters for an average individual (Pb = 28, QLC = 0.26, E =0.567), as specified in the PBPK models of Tardif et al. (1997) and Haddad et al. (2000). The above equations provide the same results of back-calculations as full-fledged PBPK models, for steady-state conditions. 2.3. Interpretation of EBZ biomarker data The results from sections 2.1 and 2.2 (i.e., PBPK model and steady-state algorithms) can be used for interpreting the blood concentration data collected in human population. For steady-state conditions or repeated exposures during lifetime (which are typically considered in risk assessment practices), the algebraic equations developed in this study provide results that are identical to that of the validated human PBPK model for EBZ. Therefore, the steady-state algorithms in their simplified form were used in this phase for dose reconstruction purposes. Published data on the blood concentrations of EBZ reported in human populations in the literature were used for the reconstruction of exposure concentrations at steady-state condition. The human studies useful for this purpose were identified following considerable review and careful examination of the relevant literature in the area of biomonitoring of volatile organic chemicals. The following studies were reviewed: Ashley DL,Bonin MA, Cardinali FL, McCraw JM and Wooten JV. Blood concentrations of volatile organic compounds in a nonoccpationally exposed US population and in groups with suspected exposure. Clinical Chemistry 40(7) (1994) 1401-1404. Ashley DL, Bonin MA, Cardinali FL, McCraw JM and Wooten JV. Measurement of volatile organic compoundsin human blood. Environmental Health Perspectives 104, Suppl 5 (1996) 871-877. Ashley DL and Prah JD. Time dependence of blood concentrations during and after exposure to a misture of volatile organic compounds. Archives of Environmental Health 52 (11) (1997) 26-33
Page R-8
Heinrich-Ramm R, Jakubowski M, Heinzow B, Molin Christensen J, Olsen E and Hertel O. Biological monitoring for exposure to volatile organic compounds (VOCs). Pure and Applied Chemistry 72 (3) (2000) 385-436. Mannino DM, Schreiber J, Aldous K, Ashley D, Moolenaar R and Almaguer D. Human exposure to volatile organic compounds : a comparison of organic vapor monitoring badge levels with blood levels. International Archives in Occupational Environmental Health 67 (1995) 59-64. Needham LL, Hill RH, Ashley Jr DL, Pirkle JL and Sampson EJ. The priority toxicant reference range study interim report. Environmental Health Perspectives 103, Suppl 3 (1995) 89-94. Raymer JH, Pellizzari ED, Thomas KW, Kizakevich P and Cooper SD. Kinetics of low-level volatile organic compounds in breath-II : relationship between concentrations measured in exposure air and alveolar air. Journal of Exposure Analysis and Environmental Epidemiology 2 (2) (1992) 67-83. Romieu I, Ramirez M, Meneses F, Ashley D, Lemire S, Colome S, Fung K and Hernandez-Avila M.Environmental Health Perspectives 107 (7) (1999) 511-515. Environmental exposure to volatile organic compounds among workers in Mexico City as assessment by personnal monitors and blood concentrations. Environmental Health Perspectives 107 (7) (1999) 511-515. Tang W , Hemm I and Eisenbrand G. Estimation of human exposure to styrene and ethylbenzene. Toxicology 144 (2000) 39-50. Wallace L, Pellizzari E,Hartwell, TD, Perritt R and RZiegenfus R. Exposures to benzene and other volatile compounds from active and passive smoking. Archives of Environmental Health 42 (5) (1987) 272-279. Wallace L, Nelson W, Ziegenfus R, Pellizzari E, Michael L, Whiymore R, Zelon H, Hartwell T, Perritt R and Westerdahl D. The Los Angeles team study :personal exposures, indoor-outdoor air concentrations of 25 volatile organic compounds. Journal of Exposure Analysis and Environmental Epidemiology 1 (2) (1991) 157-192. Wallace LA and Pellizzari ED. Recent advances in Measuring exhaled breath and estimating exposure and body burden for volatile organic compounds. (VOCs). Environmental Health Perspectives 103 (3) (1995) 95-98. Wallace L, Buckley T, Pellizzari E and Gordon S. Breath measurements as volatile organic compound biomarkers. Environmental Health Perspectives 104 (5) (1996) 861-869.
Page R-9
Wallace L, Pellizzari E and Gordon S. A linear model relating breath concentrations to environmental exposures : application to a chamber study of four volunteers exposed to volatile organic chemicals. Journal of Exposure Analysis and Environmental Epidemiology 3 (1) (1993) 75-102. Yang JY, Droz PO and Kim S. Biological monitoring of workers exposed to ethylbenzene and co-exposed to xylene. International Archives in Occupational Health 74 (2001) 31-37. Example 1 The back-calculations were initially done using blood concentration data reported by Mannino et al. (1995). These authors reported the median EBZ blood concentration to be 0.23 µg/L in people exposed to gasoline fumes and automobile exhaust in Albany, NY. (They also reported that the median exposure concentration was 54 µg/m3, which was determined using vapor badges). According to the steady-state equations developed in the present study and validated using the human PBPK model for EBZ, the exposure concentration of EBZ can be predicted or back-calculated as follows: Ci (µg/L) = Ca (µg/L) x (1/Pb + QLC x E) or simply, Ci (µg/L) = Ca (µg/L) x 0.1831 For the Cass of 0.23 µg/L reported by Mannino et al. (1985), the back-calculated Ci is 0.042 µg/L or 42 µg/m3. The actual, median exposure concentration determined using vapor badges was 54 µg/m3. Even though the back-calculation was performed using the parameter values for an average individual, the predicted exposure concentration compares reasonably well with the field measurement data (42 vs 54 as median values). The same result is obtained using the simulations of human PBPK model for EBZ. In this case, a graph between the simulated steady-state blood concentration and exposure concentration is established, and then one can be calculated by knowing the other. The relationships established using EBZ PBPK model in this study are plotted in Figures 7 and 8. Example 2 Another set of back-calculations were done using, not just the median value but using the minimum and maximum values reported by Mannino et al. (1995). These authors reported EBZ concentrations varying from 0.04 to 3.03 µg/L in individuals exposed to gasoline fumes and automobile exhaust in Albany, NY. (The authors also reported that the atmospheric concentrations varied from the limit of detection (8 µg/m3) to 780 µg/m3, which was determined using vapor badges).
Page R-10
According to the steady-state equations developed in the present study and validated using human PBPK model for EBZ, the exposure concentration of EBZ can be predicted or back-calculated as follows: Ci (µg/L) = Ca (µg/L) x (1/Pb + QLC x E) or simply, Ci (µg/L) = Ca (µg/L) x 0.1831 For the lowest Cass of 0.04 µg/L reported by Mannino et al. (1985), the back-calculated Ci obtained in the present study is 0.00732 µg/L or 7.32 µg/m3. The authors’ reported lowest exposure concentration corresponding to the limit of detection of the method used was in fact 8 µg/m3. For the highest Cass of 3.03 µg/L reported by Mannino et al. (1985), the back-calculated Ci obtained in the present study is 0.5548 µg/L or 554.8 µg/m3. The authors’ reported highest exposure concentration was 780 µg/m3 as determined by vapor badges. Even though the back-calculation was performed using the parameter values for an average individual, the predicted exposure concentration is reasonably close to the field measurement data (555 vs 780 as maximal values). Example 3 Ashley et al. (1994) reported the blood concentrations of EBZ in nonoccupationally exposed US population and in groups of people suspected of exposure, as a part of NHANES III. Their survey indicated that the mean, median, 5th percentile and 95th percentile values of EBZ blood concentration in a group of 631 people were 0.11 ppb, 0.06 ppb, 0.02 ppb (LOD of method) and 0.25 ppb, respectively. These values can be interpreted in terms of exposure concentrations of EBZ, on the basis of pharmacokinetic principles and steady-state algorithms established in this study. Accordingly, Ci,mean = 0.11 µg/L x 0.1831 = 0.020 µg/L or 20 µg/m3
Ci, median = 0.06 µg/L x 0.1831 = 0.011 µg/L or 11 µg/m3
Ci, 5th percentile = 0.02 µg/L x 0.1831 = 0.0037 µg/L or 3.7 µg/m3
Ci, 95th percentile = 0.25 µg/L x 0.1831 = 0.04578 µg/L or 46 µg/m3
These back-calculated exposure concentrations of EBZ are well within the reported outdoor and indoor concentrations in US reported by Wallace and co-workers. Example 4 Another study that reported blood concentrations without any interpretations (relating back to exposure concentrations) is that of Needham and co-workers of CDC in 1995. Based on a survey of about 600 samples, these authors reported the following data for EBZ:
Page R-11
Median: 50 ppt or 0.05 ppb or 0.05 µg/L Mean: 100 ppt or 0.1 ppb or 0.1 µg/L 95%UCL: 300 ppt or 0.3 ppb or 0.3 µg/L The following are the back-calculations of Ci from the above blood concentration data:
Ci, median = 0.05 µg/L x 0.1831 = 0.009155 µg/L or 9.2 µg/m3
Ci, mean = 0.1 µg/L x 0.1831 = 0.01831 µg/L or 18 µg/m3
Ci, 95%UCL = 0.3 µg/L x 0.1831 = 0.05493 µg/L or 55 µg/m3
These back-calculated values compare well with those obtained for the study of Ashley et al. reported above. The back-calculated EBZ values are all within the exposure concentrations (outdoor, indoor, personal) reported by Wallace et al. (1991) of the US EPA, based on the results of a TEAM study. Additional work relating to breath concentrations of EBZ Two types of data are produced from biomonitoring studies in which breath concentrations are measured. The first one relates to the calculation of the ratio of breath concentration to ambient air concentration, whereas the other one relates to the reporting of the raw numbers of alveolar air concentrations. Since Ci = Calv (1 + QLC x E x Pb) (16) Ci = 1 . Calv 1+QLC x E x Pb (17) Accordingly, in the typical individual considered in the present study, the Ci/Calv is equal to 0.195. The corresponding value derived by Wallace et al. based on a population study is 0.10 + 0.03. The average breath concentration of EBZ determined in 322 non-smokers varied from 0.3 to 2 µg/m3 in various populations. Using these data, the back-calculated exposure concentrations were 1.54 to 10.26 µg/m3 whereas the field measurements indicate 2.1 to 8 µg/m3. The appropriateness of the use of the developed algorithms depends on the existence of steadystate condition. The time constant which is useful in determining the taken to the attainment of steadystate was calculated for all PBPK model compartments. The time constants indicate the time taken to attain 50% of the steadystate concentration. And these values are determined by the magnitude of the tissue:blood partition coefficients, tissue volumes and tissue blood flow rates in addition to the intrinsic clearance in the metabolizing tissues. The time constants of EBZ in adipose tissue, slowly perfused tissues, richly perfused tissues and liver correspond to 33.9 hr, 0.21 hr, 0.08 hr and 0.02
Page R-12
hr, respectively. The Figures 9 - 13 indicate the attainment of steadystate as a function of EBZ exposure time. These results suggest that exposure durations of about 100 hr would well approximate steady-state in all compartments. Any exposure duration greater than 4 hr is likely to generate blood concentration data comparable to steady-state values expressed with error ranges or individual variabilities. 3. Conclusions The results of this study are: (1) steady-state algorithms for back-calculating exposure concentrations from biomarker data for EBZ, and (2) sample interpretations of EBZ biomarker data based on pharmacokinetic principles. The results of (1) are presented in the form of simple equations in Table 4. Few examples of back-calculations of exposure concentrations from blood and breath concentrations are provided in Section 2.3. The ground-work performed in the present study should facilitate more sophisticated back-calculations and interpretations of EBZ biomarker data, not only in individuals but also in populations (using probability distributions of parameter values) and specific sub-populations (e.g., children). Further studies are also essential to establish the reference concentration of EBZ in terms of biomarker concentrations in humans.
Page R-13
FIGURE LEGENDS Figure 1. Conceptual representation of the PBPK model for EBZ. Figure 2. Conceptual and fundamental representations of the PBPK model for EBZ. Cinh and Calv refer to inhaled and exhaled EBZ concentrations. Cv and Ca refer to venous and arterial blood concentrations. Pb refers to blood:air partition coefficient. Qp and Qc refer to alveolar ventilation and cardiac output. Cvi, Vi, Pi, Ai and Qi refer to venous blood concentrations leaving tissue compartments, tissue volumes, tissue:blood partition coefficients, amount in tissues and blood flow to tissues (i.e., f: adipose tissue, s: slowly perfused tissues, r: richly perfused tissues, and l: liver). Vmax, Km and Amet refer to the maximal velocity of metabolism, Michaëlis affinity constant, and amount metabolized. dt refers to integration interaval.
Figure 3. Comparison of PBPK model simulations of venous blood concentrations of ethylbenzene with experimental data (symbols) obtained in rats exposed for 4 hr to 100 ppm of this solvent.
Figure 4. Comparison of PBPK model simulations of venous blood concentrations of ethylbenzene with experimental data (symbols) obtained in rats exposed for 4 hr to 200 ppm of this solvent.
Figure 5. Comparison of PBPK model simulations of venous blood concentrations of ethylbenzene with experimental data (symbols) obtained in human volunteers exposed for 7 hr to 33 ppm of this solvent.
Figure 6. Comparison of PBPK model simulations of alveolar air concentrations of ethylbenzene with experimental data (symbols) obtained in humans exposed for 7 hr to 33 ppm of this solvent.
Figure 7. Relationship between exposure concentration of EBZ (0.0001 – 50 ppm) and PBPK model simulations of venous blood concentrations at steady-state.
Figure 8. Relationship between exposure concentration of EBZ (0.0001 – 1 ppm) and PBPK model simulations of venous blood concentrations at steady-state.
Figure 9. PBPK model simulation of the time-course of the fraction of steady-state adipose tissue concentration attained during continuous exposure of humans to 1 ppm EBZ.
Figure 10. PBPK model simulation of the time-course of the fraction of steady-state liver concentration attained during continuous exposure of humans to 1 ppm EBZ.
Figure 11. PBPK model simulation of the time-course of the fraction of steady-state slowly perfused tissue concentration attained during continuous exposure of humans to 1 ppm EBZ.
Page R-14
Figure 12. PBPK model simulation of the time-course of the fraction of steady-state richly perfused tissue concentration attained during continuous exposure of humans to 1 ppm EBZ.
Figure 13. PBPK model simulation of the time-course of the fraction of steady-state blood concentration attained during continuous exposure of humans to 1 ppm EBZ.
Page R-15
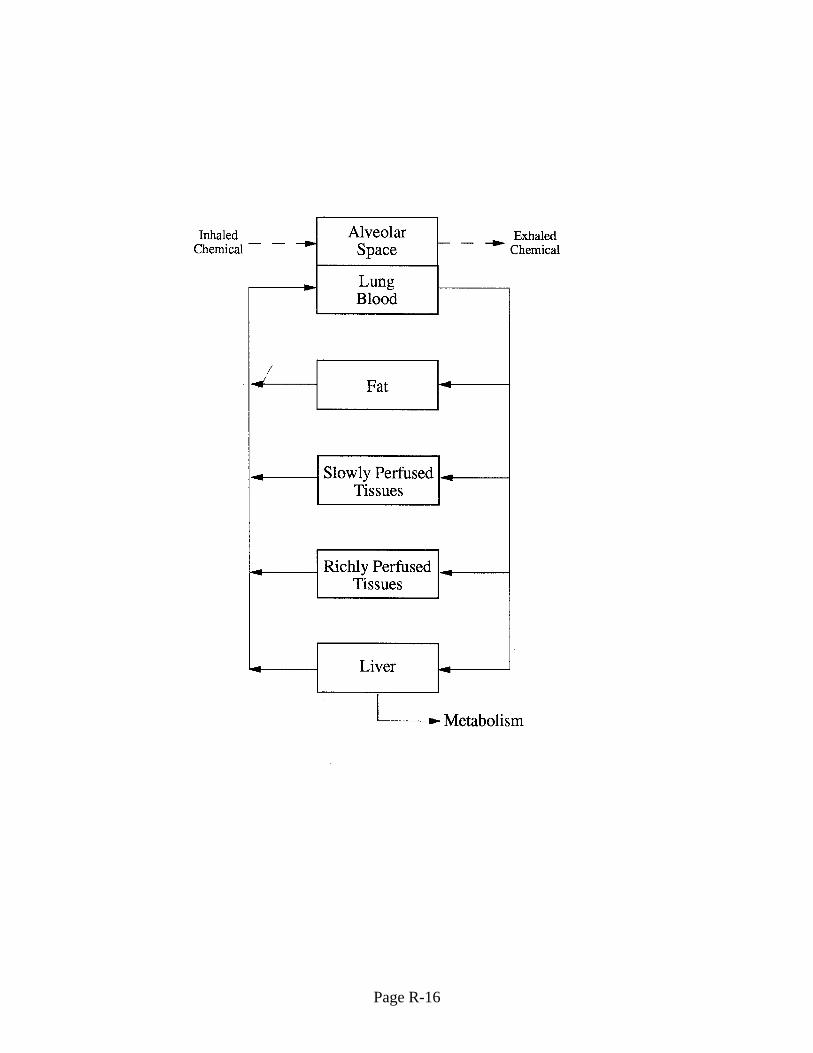
Page R-16
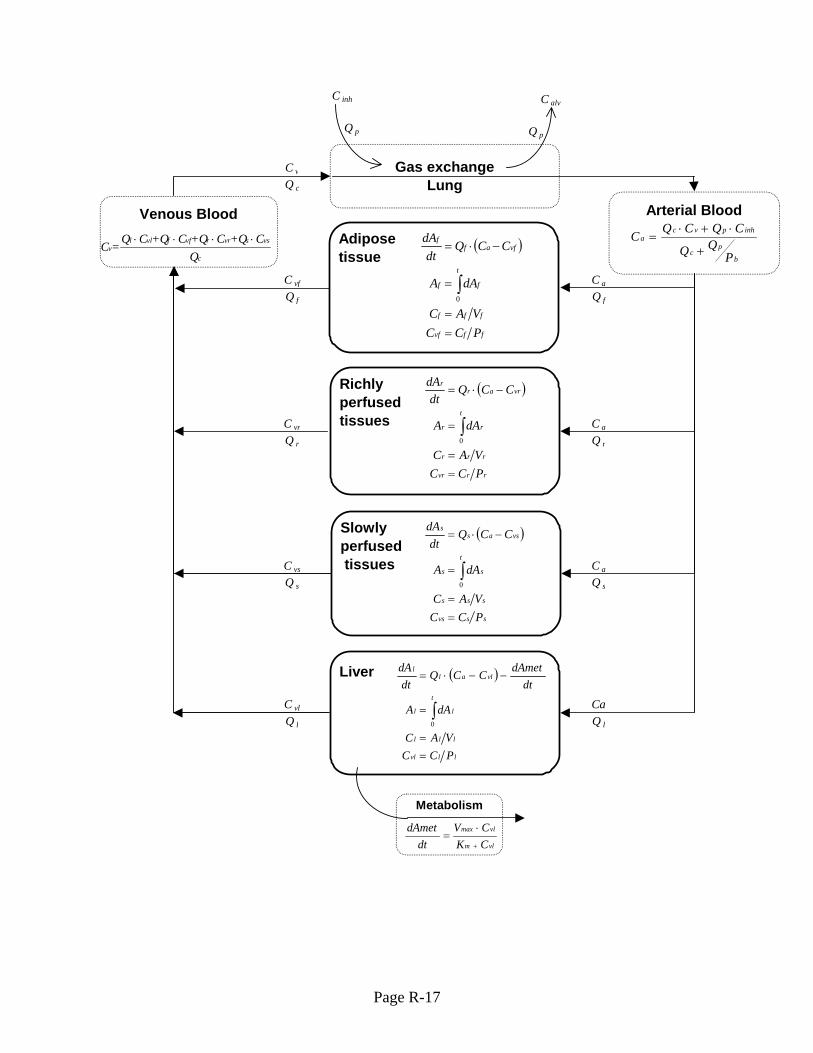
C v
Q c
C vf C a
Q f Q f
C vr C a
Q r Q r
C vs C a
Q s Q s
C vl CaQ l Q l
Metabolism
Gas exchangeLung
Liver
Adipose tissue
C inh
Q p
C alv
Q p
Richly perfused tissues
Slowly perfused tissues
Venous Blood Arterial Blood
( )
ssvs
sss
t
ss
vsass
PCCVAC
dAA
CCQdt
dA
==
=
−⋅=
∫0
( )
ffvf
fff
t
ff
vfaff
PCCVAC
dAA
CCQdt
dA
==
=
−⋅=
∫0
( )
rrvr
rrr
t
rr
vrarr
PCCVAC
dAA
CCQdt
dA
==
=
−⋅=
∫0
c
vssvrrvffvllv
QC+QC+QC+QCQ=C ⋅⋅⋅⋅
b
pc
inhpvca
PQQ
CQCQC+
⋅+⋅=
( )
llvl
lll
t
ll
vlall
PCCVAC
dAA
dtdAmetCCQ
dtdA
==
=
−−⋅=
∫0
vlm
vlmax
CKCV
dtdAmet
+
⋅=
Page R-17
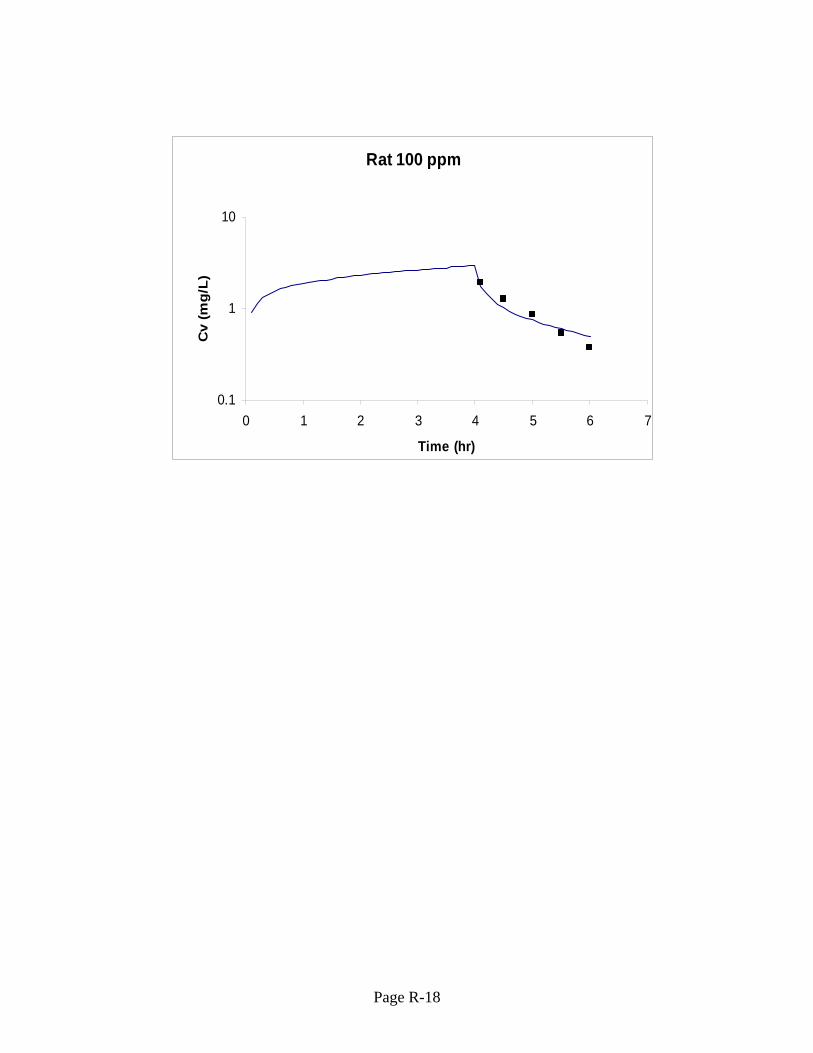
Rat 100 ppm
0.1
1
10
0 1 2 3 4 5 6
Time (hr)
Cv
(mg/
L)
7
Page R-18
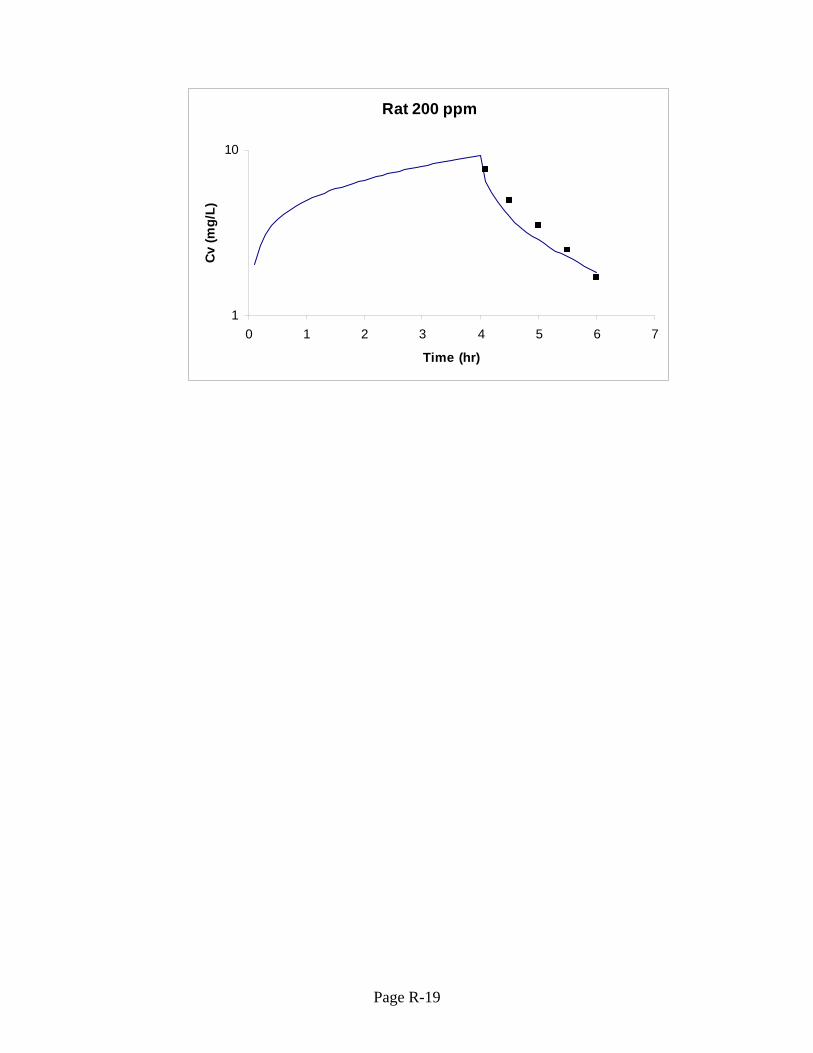
Rat 200 ppm
1
10
0 1 2 3 4 5 6 7
Time (hr)
Cv (m
g/L)
Page R-19
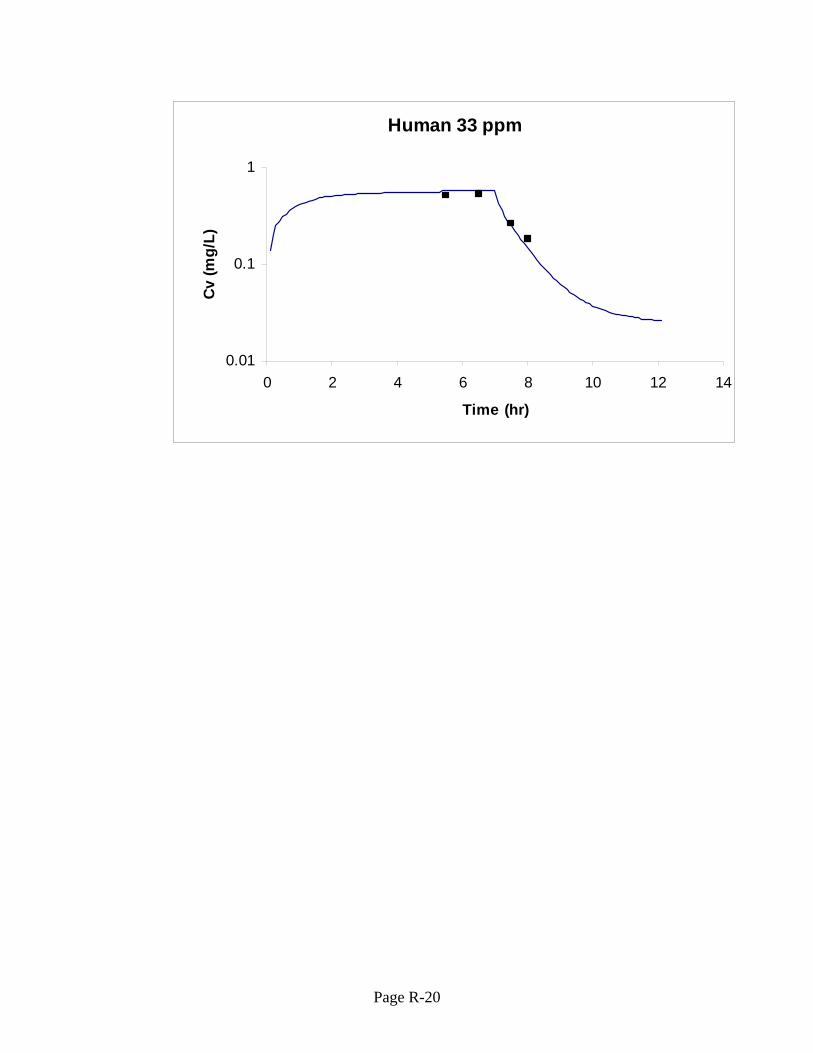
Human 33 ppm
0.01
0.1
1
0 2 4 6 8 10 12
Time (hr)
Cv
(mg/
L)
14
Page R-20
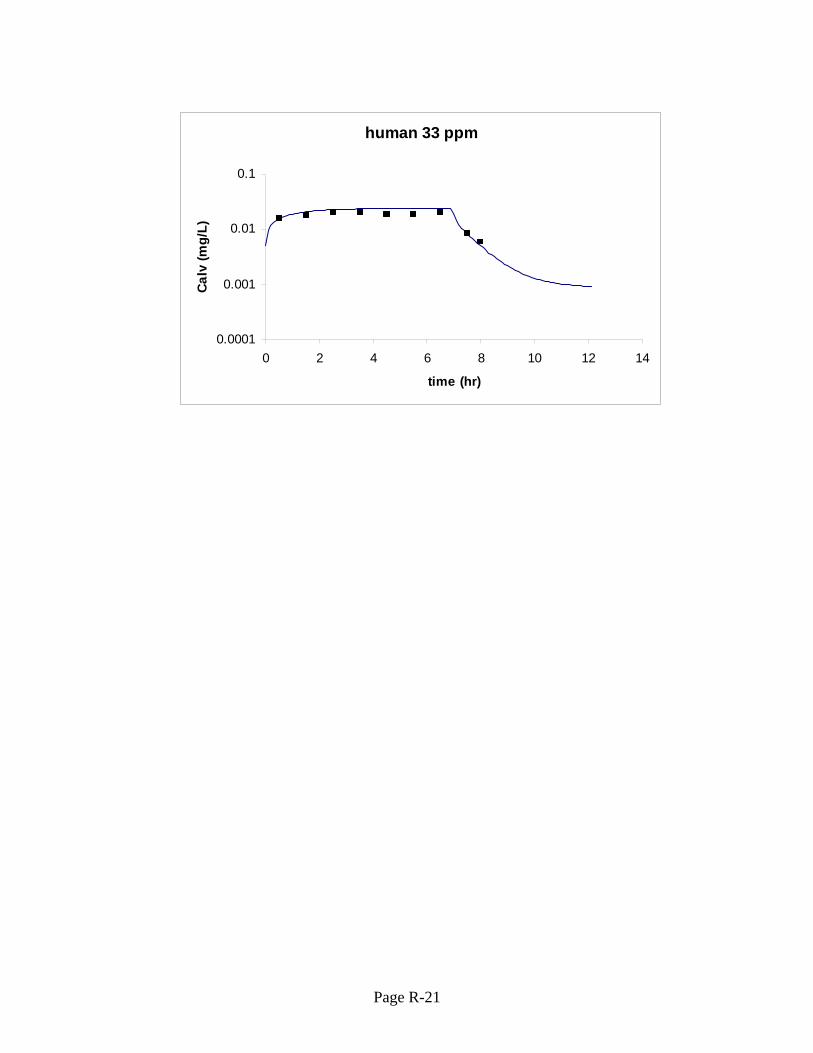
human 33 ppm
0.0001
0.001
0.01
0.1
0 2 4 6 8 10 12 14
time (hr)
Calv
(mg/
L)
Page R-21
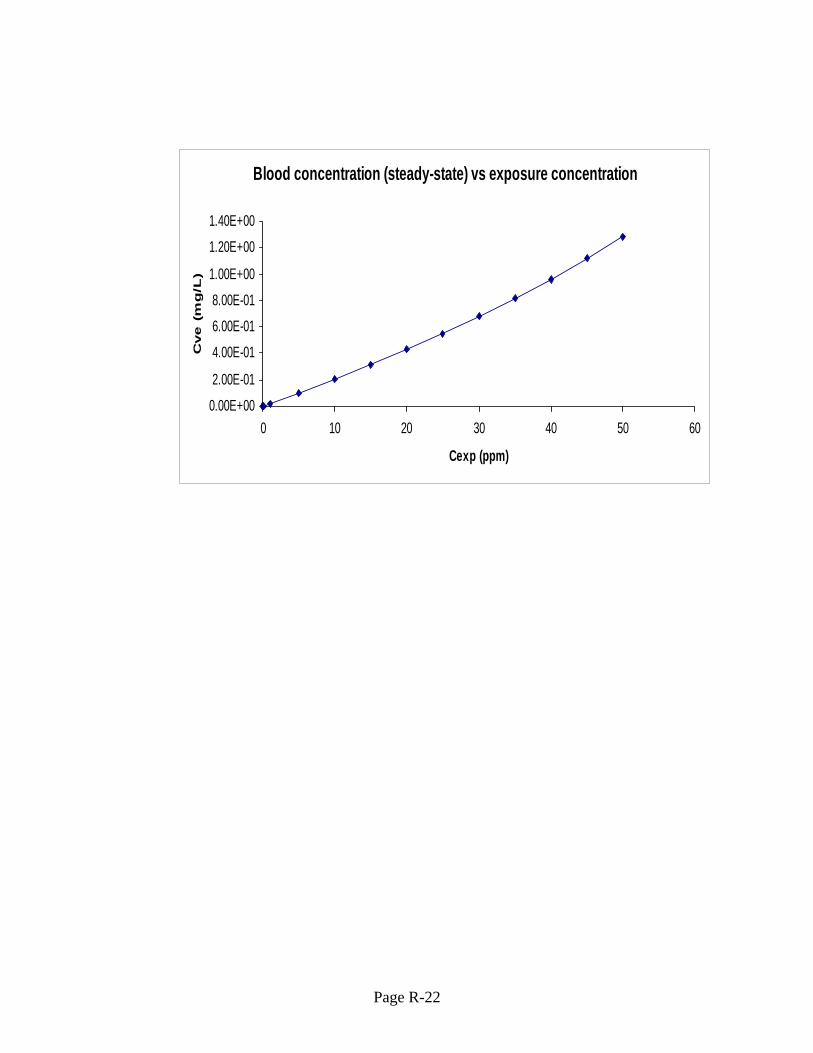
Blood concentration (steady-state) vs exposure concentration
0.00E+00
2.00E-01
4.00E-01
6.00E-01
8.00E-01
1.00E+00
1.20E+00
1.40E+00
0 10 20 30 40 50 6
Cexp (ppm)
Cve
(m
g/L
)
0
Page R-22
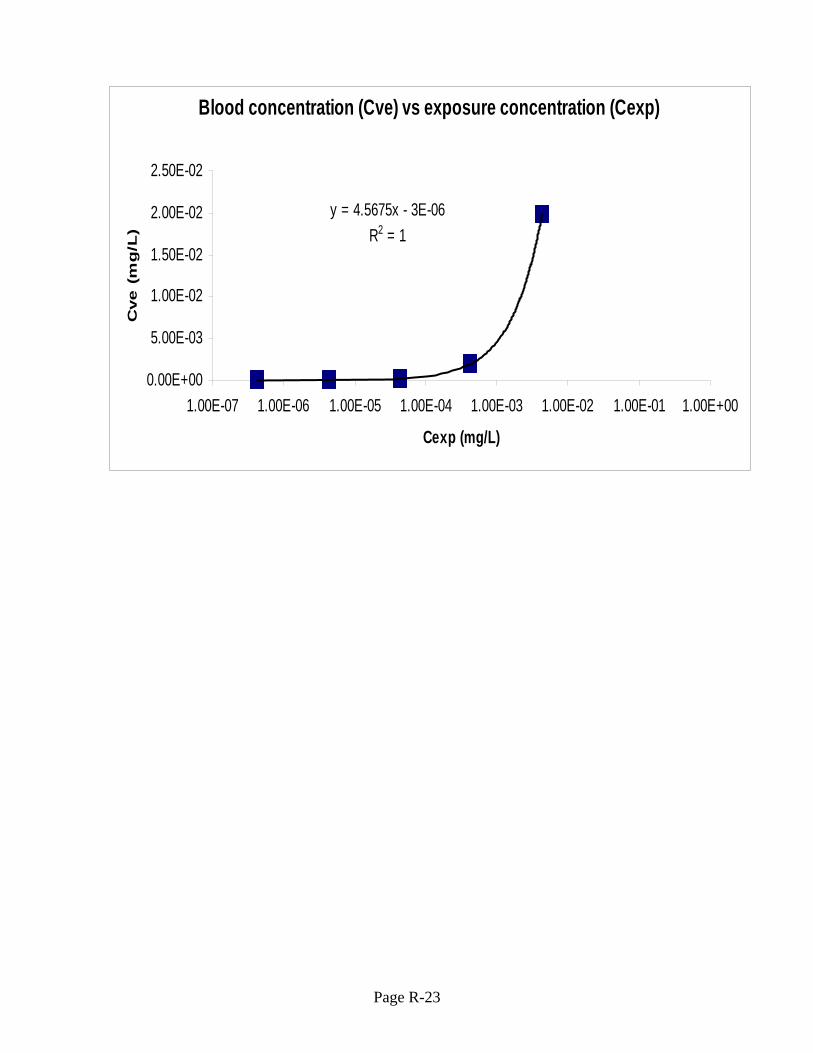
Blood concentration (Cve) vs exposure concentration (Cexp)
y = 4.5675x - 3E-06R2 = 1
0.00E+00
5.00E-03
1.00E-02
1.50E-02
2.00E-02
2.50E-02
1.00E-07 1.00E-06 1.00E-05 1.00E-04 1.00E-03 1.00E-02 1.00E-01 1.00E+00
Cexp (mg/L)
g/
(m
Cve
L)
Page R-23
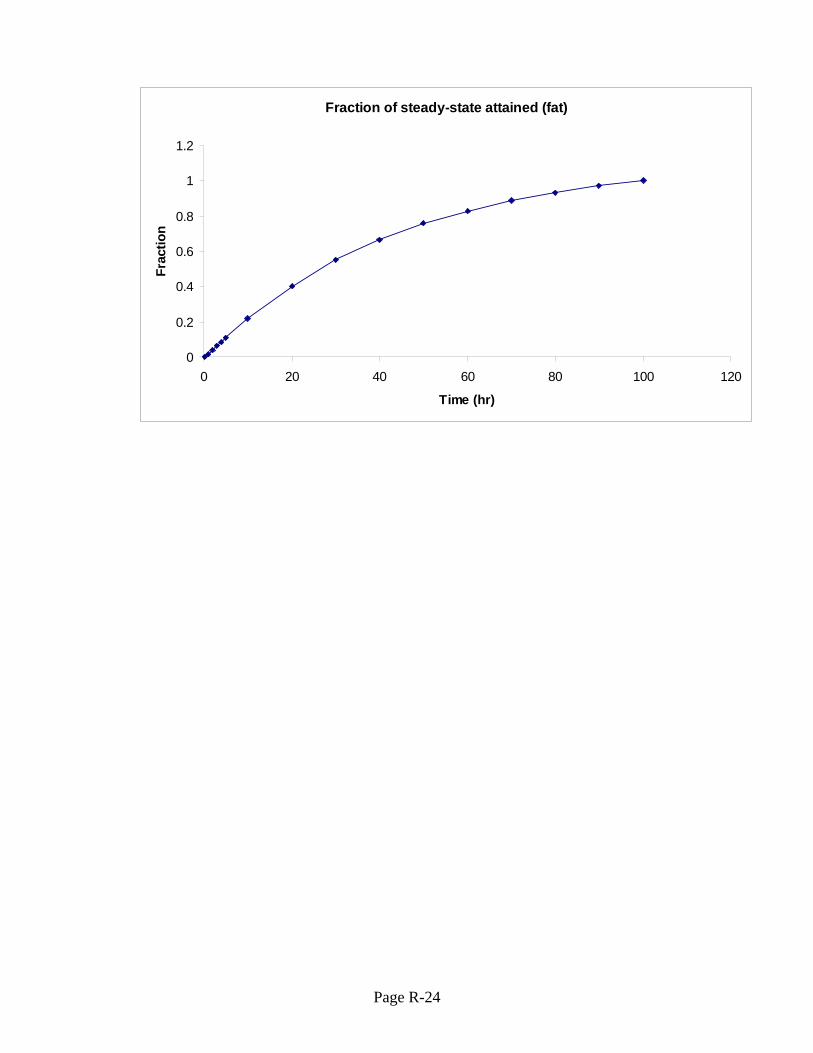
Fraction of steady-state attained (fat)
0
0.2
0.4
0.6
0.8
1
1.2
0 20 40 60 80 100 120
Time (hr)
Frac
tion
Page R-24
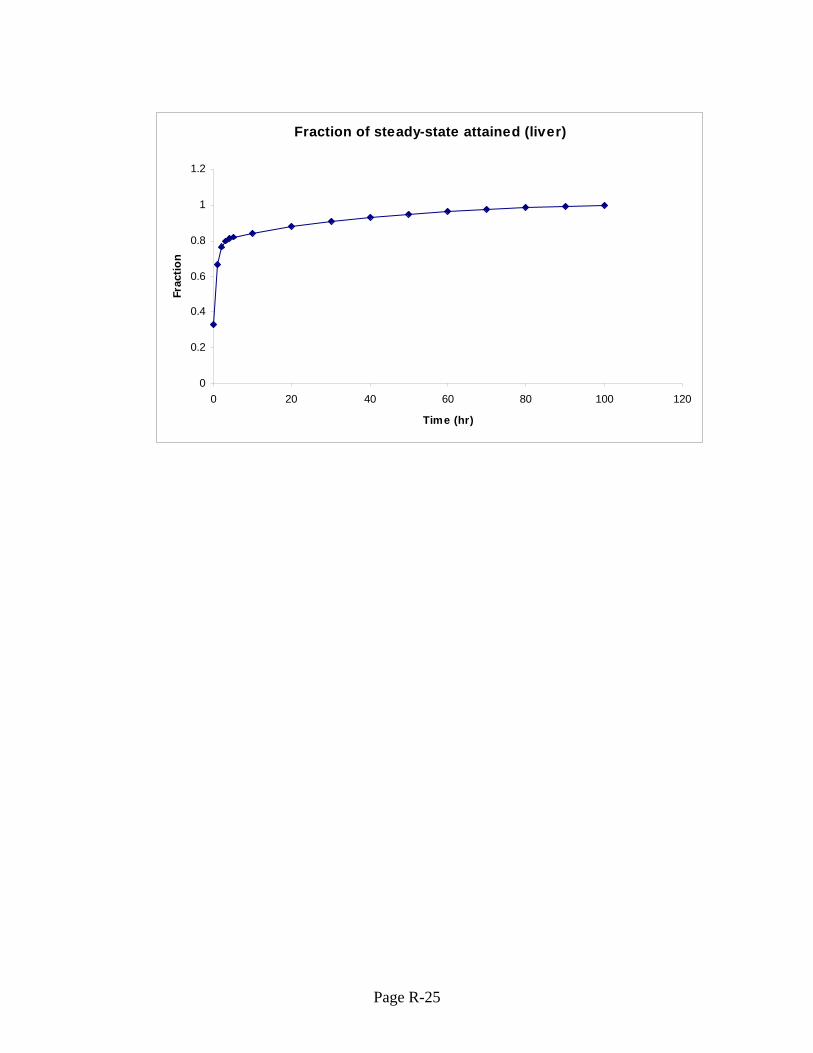
Fraction of steady-state attained (liver)
0
0.2
0.4
0.6
0.8
1
1.2
0 20 40 60 80 100 120
Time (hr)
Frac
tion
Page R-25
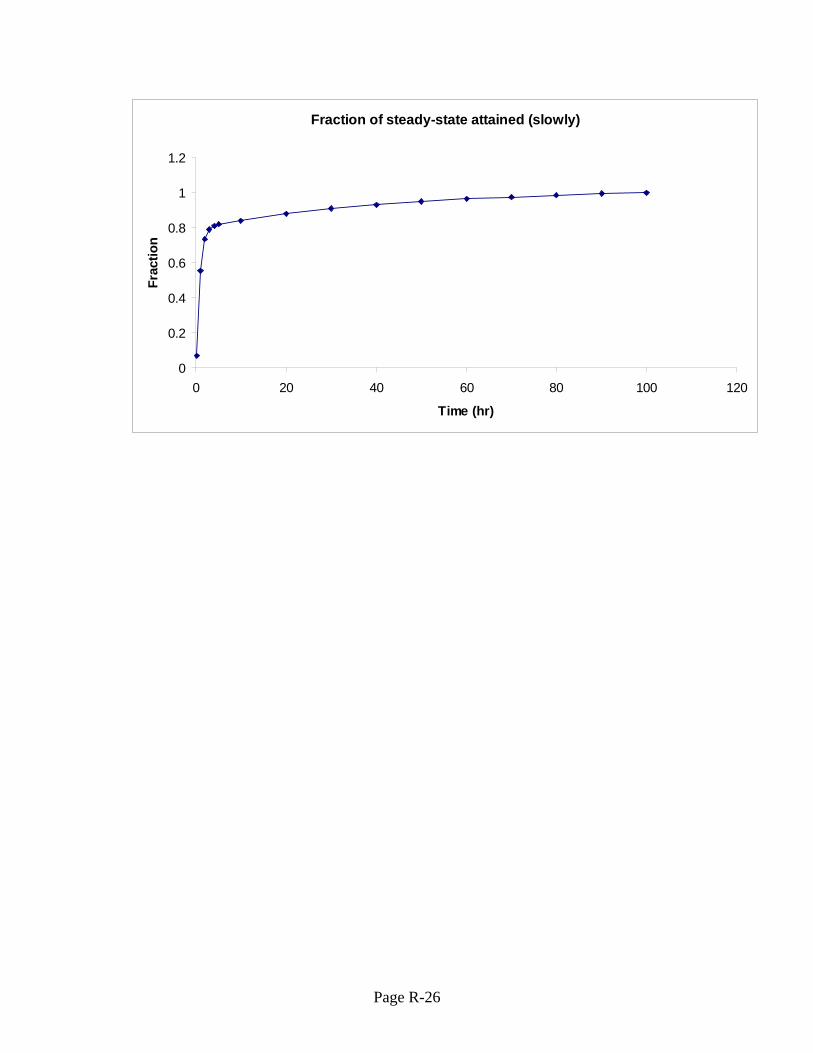
Fraction of steady-state attained (slowly)
0
0.2
0.4
0.6
0.8
1
1.2
0 20 40 60 80 100 120
Time (hr)
Frac
tion
Page R-26
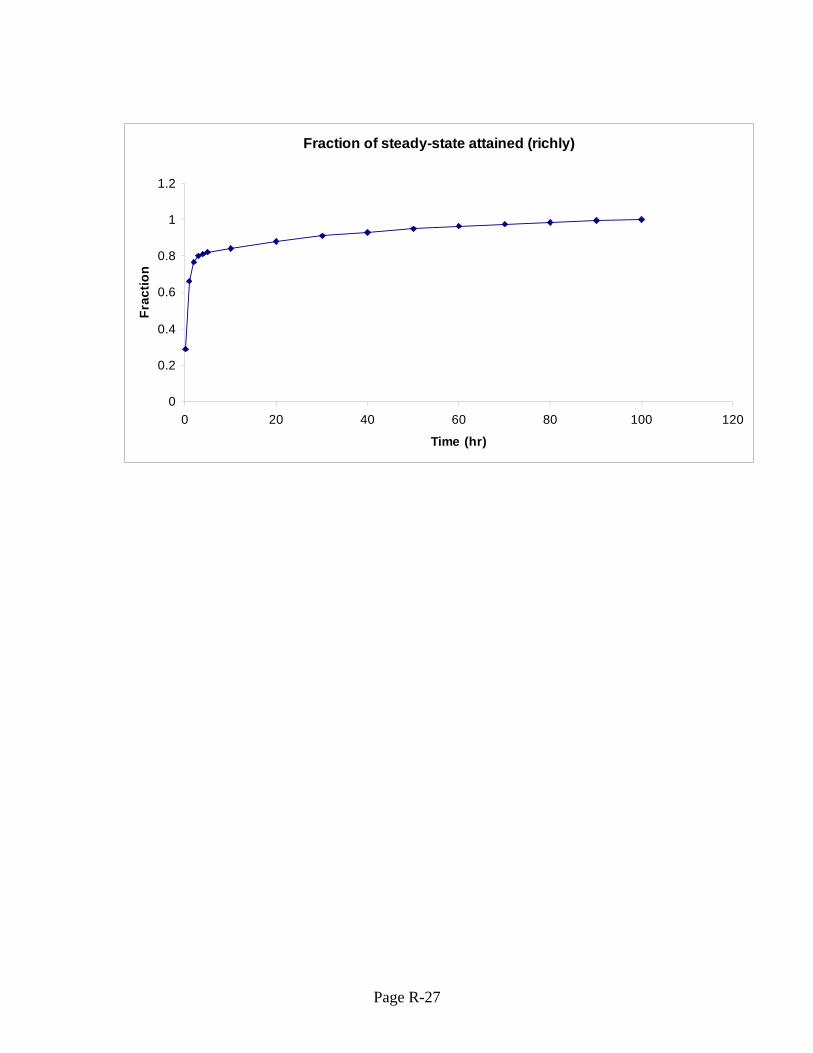
Fraction of steady-state attained (richly)
0
0.2
0.4
0.6
0.8
1
1.2
0 20 40 60 80 100 1
Time (hr)
Frac
tion
20
Page R-27
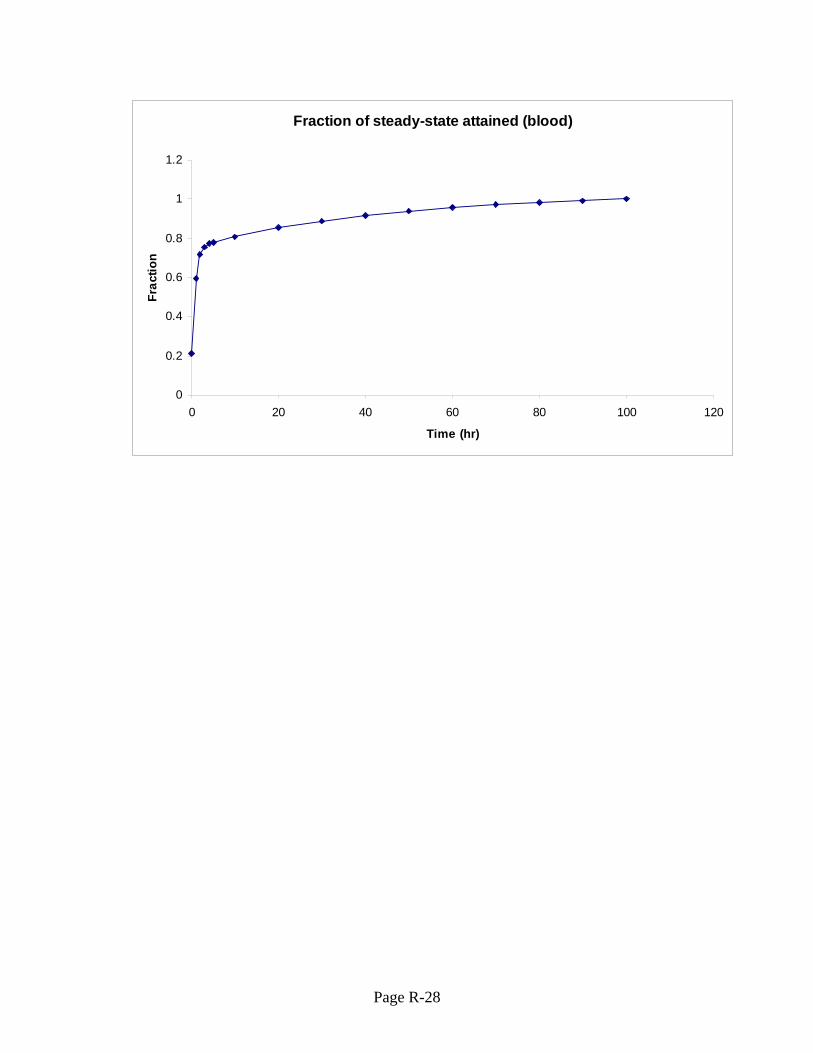
Fraction of steady-state attained (blood)
0
0.2
0.4
0.6
0.8
1
1.2
0 20 40 60 80 100
Time (hr)
Frac
tion
120
Page R-28
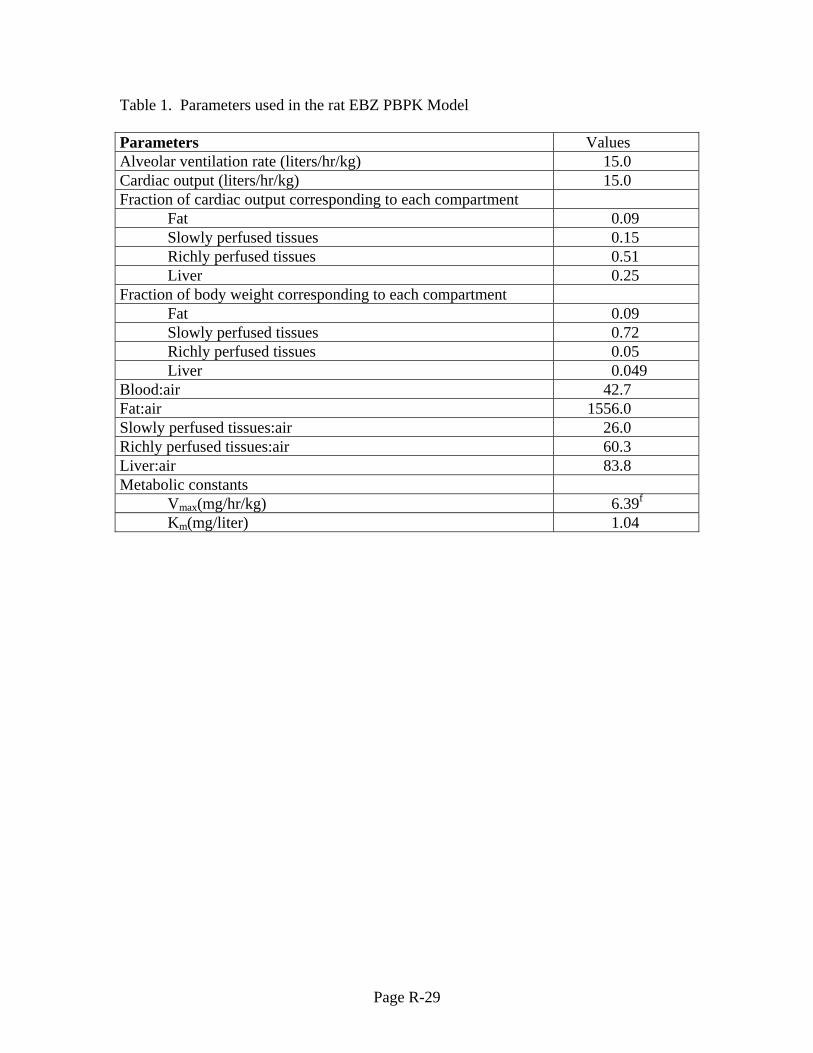
Table 1. Parameters used in the rat EBZ PBPK Model Parameters Values Alveolar ventilation rate (liters/hr/kg) 15.0 Cardiac output (liters/hr/kg) 15.0 Fraction of cardiac output corresponding to each compartment Fat 0.09 Slowly perfused tissues 0.15 Richly perfused tissues 0.51 Liver 0.25 Fraction of body weight corresponding to each compartment Fat 0.09 Slowly perfused tissues 0.72 Richly perfused tissues 0.05 Liver 0.049 Blood:air 42.7 Fat:air 1556.0 Slowly perfused tissues:air 26.0 Richly perfused tissues:air 60.3 Liver:air 83.8 Metabolic constants Vmax(mg/hr/kg) 6.39f
Km(mg/liter) 1.04
Page R-29
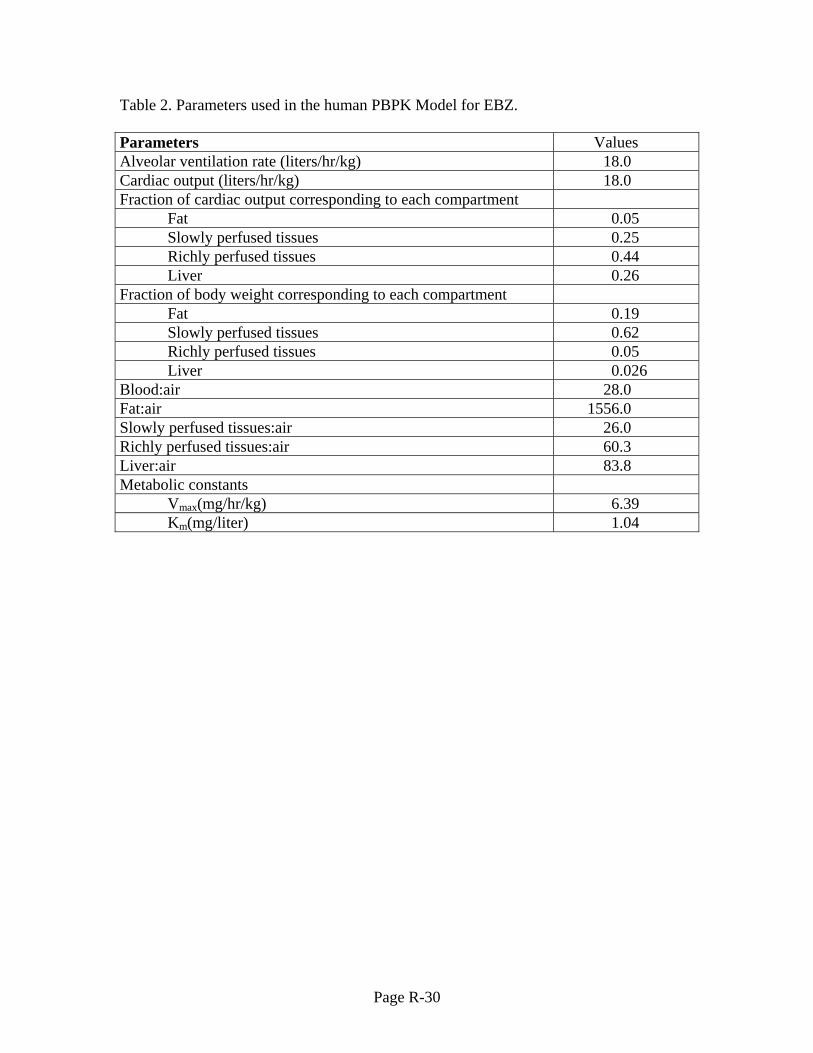
Table 2. Parameters used in the human PBPK Model for EBZ. Parameters Values Alveolar ventilation rate (liters/hr/kg) 18.0 Cardiac output (liters/hr/kg) 18.0 Fraction of cardiac output corresponding to each compartment Fat 0.05 Slowly perfused tissues 0.25 Richly perfused tissues 0.44 Liver 0.26 Fraction of body weight corresponding to each compartment Fat 0.19 Slowly perfused tissues 0.62 Richly perfused tissues 0.05 Liver 0.026 Blood:air 28.0 Fat:air 1556.0 Slowly perfused tissues:air 26.0 Richly perfused tissues:air 60.3 Liver:air 83.8 Metabolic constants Vmax(mg/hr/kg) 6.39 Km(mg/liter) 1.04
Page R-30
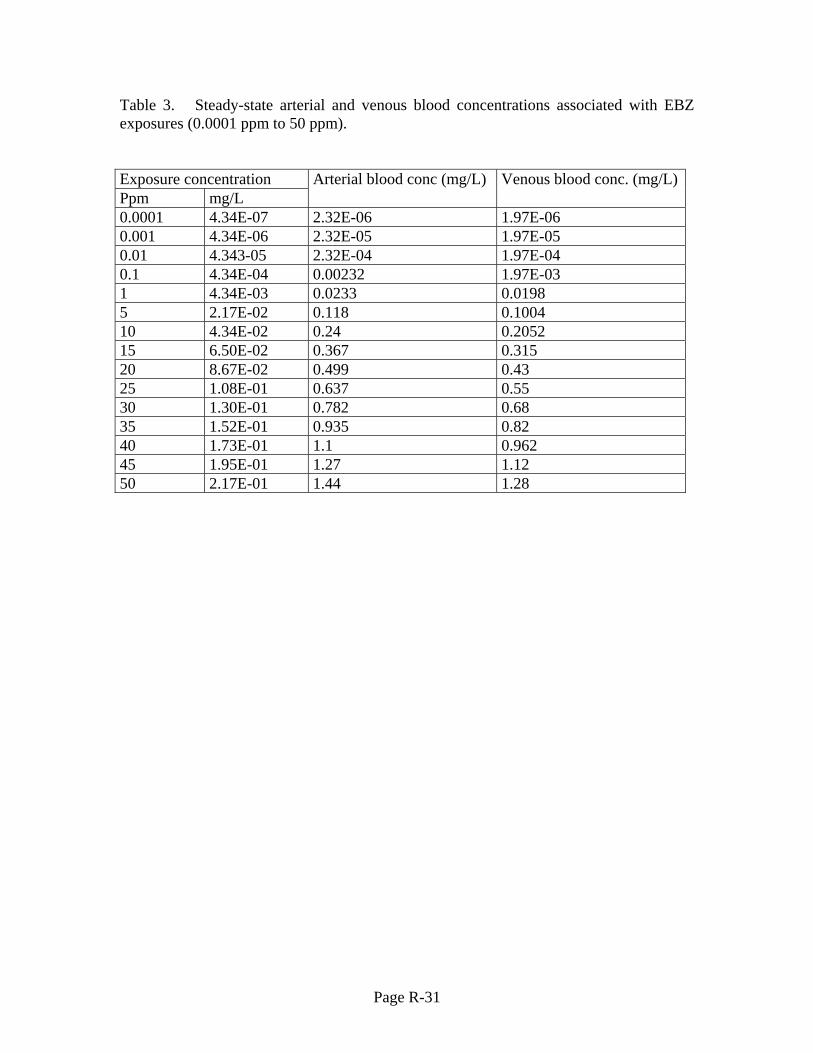
Table 3. Steady-state arterial and venous blood concentrations associated with EBZ exposures (0.0001 ppm to 50 ppm). Exposure concentration Ppm mg/L
Arterial blood conc (mg/L) Venous blood conc. (mg/L)
0.0001 4.34E-07 2.32E-06 1.97E-06 0.001 4.34E-06 2.32E-05 1.97E-05 0.01 4.343-05 2.32E-04 1.97E-04 0.1 4.34E-04 0.00232 1.97E-03 1 4.34E-03 0.0233 0.0198 5 2.17E-02 0.118 0.1004 10 4.34E-02 0.24 0.2052 15 6.50E-02 0.367 0.315 20 8.67E-02 0.499 0.43 25 1.08E-01 0.637 0.55 30 1.30E-01 0.782 0.68 35 1.52E-01 0.935 0.82 40 1.73E-01 1.1 0.962 45 1.95E-01 1.27 1.12 50 2.17E-01 1.44 1.28
Page R-31
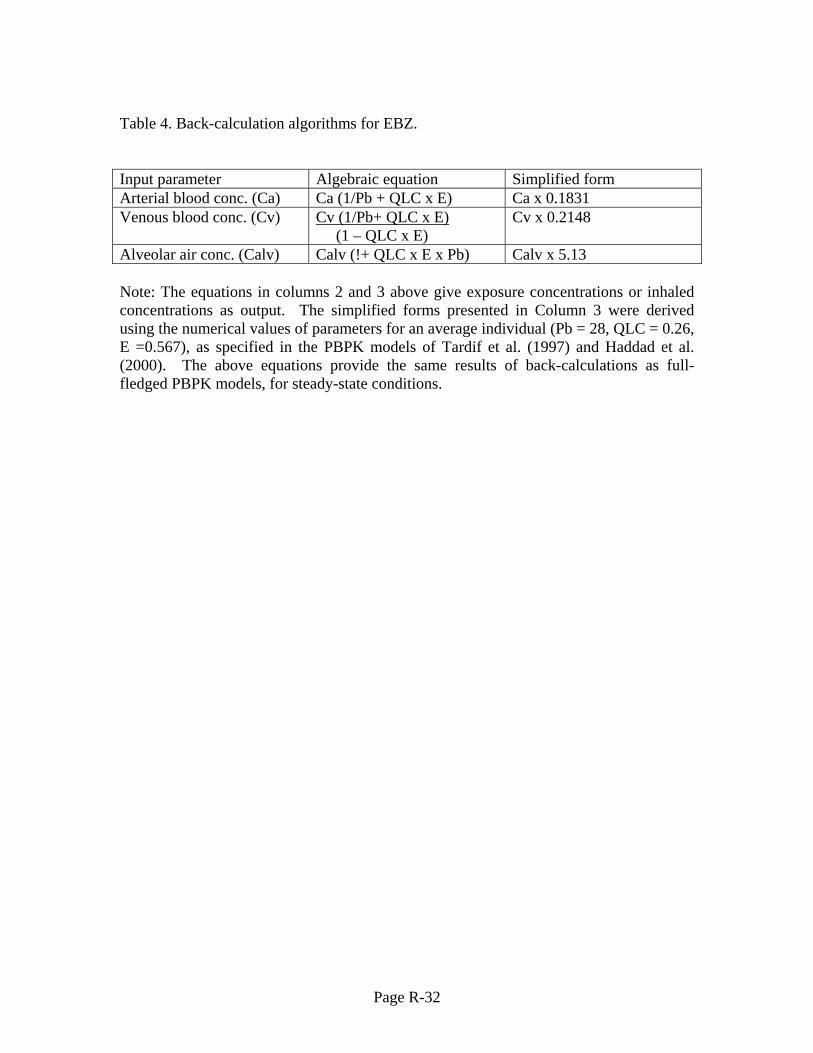
Table 4. Back-calculation algorithms for EBZ. Input parameter Algebraic equation Simplified form Arterial blood conc. (Ca) Ca (1/Pb + QLC x E) Ca x 0.1831 Venous blood conc. (Cv) Cv (1/Pb+ QLC x E)
(1 – QLC x E) Cv x 0.2148
Alveolar air conc. (Calv) Calv (!+ QLC x E x Pb) Calv x 5.13 Note: The equations in columns 2 and 3 above give exposure concentrations or inhaled concentrations as output. The simplified forms presented in Column 3 were derived using the numerical values of parameters for an average individual (Pb = 28, QLC = 0.26, E =0.567), as specified in the PBPK models of Tardif et al. (1997) and Haddad et al. (2000). The above equations provide the same results of back-calculations as full-fledged PBPK models, for steady-state conditions.
Page R-32
Appendix S Comparative In Vitro Metabolism of Ethylbenzene in Mouse, Rat and Human Liver and Lung Microsomes: Study Summary and Implications for the Ethylbenzene VCCEP Assessment S.1 Study Summary The mode of action for mouse-specific lung toxicity and carcinogenicity of ethylbenzene is hypothesized to be mediated through preferential mouse lung metabolism to cytotoxic ring-oxidized metabolites. Consistent with this hypothesis, preliminary in vitro studies confirmed ethylbenzene was extensively metabolized by mouse lung microsomes, and was approximately 2X greater than rat and significantly greater than human (Saghir et.al., 2006). Although these data indicated lung alkyl-oxidation of ethylbenzene primarily to 1-phenylethanol and acetophenone, very little aromatic-oxidation to either 2- or 4-ethylphenol was detected. However, the limited detection of aromatic oxidation was attributed to limitations in the experimental approach used in the preliminary study, in that the preliminary study employed analytical methods likely to identify only mono-hydroxylated aromatic metabolites. If such metabolites were rapidly oxidized to di-hydroxylated catechol and quinone metabolite(s), they likely would not have been detected since these metabolites would also be expected to undergo further oxidation to tissue reactive quinone metabolites. Trapping by nucleophiles such as reduced glutathione (GSH) would be necessary to assure detection and quantitation of quinone metabolites. The possibility that such additional ring oxidative metabolism was indeed likely was supported by the observation that mouse lung microsomes were capable of rapidly metabolizing both 2- and 4-ethylphenol (as measured by disappearance of these substrates). A follow-up set of comparative in vitro mouse, rat and human metabolism studies were conducted to further examine and quantify potential formation of di-hydroxylated ring-oxidized metabolites, using GSH to specifically trap quinone metabolites of catechol and/or hydroquinone (The Dow Chemical Company, 2005). In addition, this protocol was designed to evaluate the comparative rates of metabolism of ethylbenzene to both alkyl- and ring-oxidized metabolites in order to provide data for future refinements to a published ethylbenzene PBPK model. The results of the Phase II mouse, rat and human liver and lung comparative metabolism experiments (The Dow Chemical Company, 2006) are summarized in Tables S-1 to S-4. These studies confirmed that ethylbenzene, over a range of in vitro concentrations of 0.22-7.0 mM, was metabolized to the alkyl-metabolites 1-phenylethanol and acetophenone in liver microsomes from all species (mouse > rat ~ human). At the lower incubation concentrations examined alkyl-oxidation was greater in mouse lung microsomes relative to both mouse liver and rat lung and liver, suggesting that lung metabolism may be a significant contributor to the overall in vivo metabolism of ethylbenzene in mice. Although significant alkyl-oxidation was observed in human liver, it was not detected in human lung microsomes. An examination of the mass balance of
S-1
alkyl-metabolite generation indicated this route of metabolism represented the major pathway of overall ethylbenzene oxidation in that such metabolites accounted for the majority of the ethylbenzene lost in the microsomal incubations. Use of GSH-trapping to detect catechol and hydroquinone metabolites (Figure S-1) confirmed the in vitro formation of these metabolites in mouse, rat and human liver microsomes, and in mouse and rat, but not human, lung microsomes. Similar to the generation of alkyl-oxidized metabolites, mouse lung microsomes exhibited the substantially higher metabolic activity (mouse lung GSH-derived metabolites approximately 10X > rat lung; human lung not detectable; mouse lung GSH metabolites approximately 2X > mouse liver; mouse liver approximately 10X > rat and human liver). Although ring-oxidized metabolites accounted for a relatively small fraction of overall ethylbenzene metabolism, its selective elevation in mouse lung microsomes is nonetheless consistent with the hypothesized mode of action attributing preferential formation of lung-derived cytotoxic, ring-oxidized metabolites as driving the mouse lung specific toxicity of ethylbenzene. Interestingly, both mouse and rat lung microsomes exhibited decreasing amounts of ring-oxidized metabolite formation with increasing concentrations of ethylbenzene, suggesting the possibility of cytochrome P450 suicide inhibition by reactive ring-oxidized metabolite(s). This observation would also be consistent with the hypothesis of the preferential formation of reactive cytotoxic metabolites in mouse lung. S.2 Implications for Ethylbenzene VCCEP Risk Assessment A complete, final report on the foregoing experiments was not available at the time of the preparation of this VCCEP assessment (The Dow Chemical Company, 2006), and thus could not be incorporated into the toxicity value derivation and risk assessment (Sections 8 and 9). However, sufficient preliminary data are available to further evaluate an important estimate used in the toxicity reference value derivation—the maximal rate of pulmonary ethylbenzene metabolism in the mouse (Tables 8-9 and P-6). Impact on Lung Cancer Toxicity Reference Value In developing a toxicity reference value based on male mouse lung cancer (Section 8), a mouse PBPK model with a pulmonary Vmax of 4.65 mg/hr/kg0.75 (derived from the in vitro data of Saghir and Rick, 2005) was used. Based on the production of 1-phenylethanol and acetophenone during incubations of mouse lung microsomes with 7 mM ethylbenzene (Table S-4), a preliminary, revised pulmonary Vmax estimate of 10.4 mg/hr/kg0.75 is obtained, using the scaling procedures previously described in Appendix P. This preliminary revised value is >2X higher than the previous estimate of pulmonary metabolism, indicating greater metabolism in mouse lung than was used to derive the lung cancer toxicity reference value. However, the simulated amount of lung metabolism at 75 ppm, the low dose in the cancer bioassay, was also highly dependent on the Michaelis constant (KM) for lung metabolism (Table P-6), which was derived through optimization of fit to blood ethylbenzene concentrations for mice exposed to 75, 200, 500, and 1000 ppm ethylbenzene (Charest-Tardiff et al., 2006). If the lung metabolism
S-2
KM is not substantially increased in optimization, the toxicity reference value for lung cancer is likely to increase; if it increases in parallel with the increase in Vmax, the lung cancer toxicity reference value would be expected to be unchanged. Impact on Toxicity Reference Values for Liver-Related Endpoints The dose metric used to derive toxicity reference values based on mouse liver effects is altered by changing the rate of pulmonary metabolism in isolation from other parameter changes (Table P-6). However, when estimate of the rate of metabolism in richly perfused is adjusted as well, in order to fit observed blood ethylbenzene concentrations (Charest-Tardif et al., 2006), the compensatory adjustment results in predictions of liver metabolism that are virtually unchanged (Table 8-9). Thus a change in the estimated rate of pulmonary metabolism of ethylbenzene in mice is unlikely to have a significant impact on internal dosimetry estimates for non-pulmonary tissues. Impact on Risk Characterization Based on review of these preliminary data, consideration of the final report (if unchanged) would be likely to leave the toxicity reference values unaltered or increased. The key toxicity reference values, those related to mouse liver toxicity (noncancer and cancer), are likely to be unaltered. Thus the risk estimates provided in Section 9 would be likely to be unaltered based on a full consideration of the final data. S.3 References Charest-Tardif G., Tardif, R., and Krishnan, K. (2006). Inhalation pharmacokinetics of
ethylbenzene in B6C3F1 mice. Toxicol. Appl. Pharmacol. 210:63-69.
Saghir, S.A. and Rick, D.L. (2005). Ethylbenzene: in vitro metabolism in rat, mouse,
and human liver and lung microsomes. The Dow Chemical Company, Midland, Michigan. December 8, 2005.
Saghir, S.A., Rick, D.L., Bartels, M.J., and Bus, J.S. (2006). In vitro metabolism of
ethylbenzene by rat, mouse and human liver and lung microsomes. The Toxicologist. 90:141.
The Dow Chemical Company (2005). Protocol: Ethylbenzene: In Vitro Metabolism
With Rat, Mouse And Human Liver And Lung Microsomes – Phase II Study. Study ID 051189.
The Dow Chemical Company (2006). Personal communication from James S. Bus to
Lisa Sweeney and Michael Gargas. December 4, 2006.
S-3
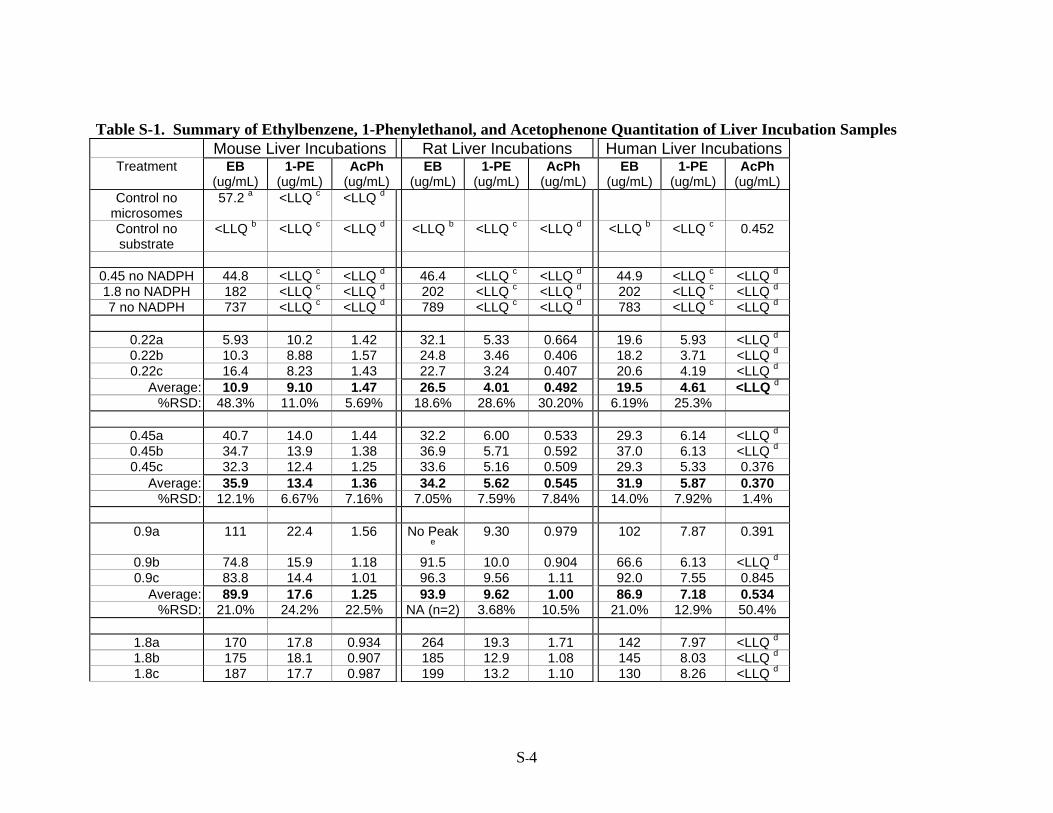
Table S-1. Summary of Ethylbenzene, 1-Phenylethanol, and Acetophenone Quantitation of Liver Incubation Samples Mouse Liver Incubations Rat Liver Incubations Human Liver Incubations
Treatment EB (ug/mL)
1-PE (ug/mL)
AcPh (ug/mL)
EB (ug/mL)
1-PE (ug/mL)
AcPh (ug/mL)
EB (ug/mL)
1-PE (ug/mL)
AcPh (ug/mL)
Control no microsomes
57.2 a <LLQ c <LLQ d
Control no substrate
<LLQ b <LLQ c <LLQ d <LLQ b <LLQ c <LLQ d <LLQ b <LLQ c 0.452
0.45 no NADPH 44.8 <LLQ c <LLQ d 46.4 <LLQ c <LLQ d 44.9 <LLQ c <LLQ d
1.8 no NADPH 182 <LLQ c <LLQ d 202 <LLQ c <LLQ d 202 <LLQ c <LLQ d
7 no NADPH 737 <LLQ c <LLQ d 789 <LLQ c <LLQ d 783 <LLQ c <LLQ d
0.22a 5.93 10.2 1.42 32.1 5.33 0.664 19.6 5.93 <LLQ d
0.22b 10.3 8.88 1.57 24.8 3.46 0.406 18.2 3.71 <LLQ d
0.22c 16.4 8.23 1.43 22.7 3.24 0.407 20.6 4.19 <LLQ d
Average: 10.9 9.10 1.47 26.5 4.01 0.492 19.5 4.61 <LLQ d
%RSD: 48.3% 11.0% 5.69% 18.6% 28.6% 30.20% 6.19% 25.3%
0.45a 40.7 14.0 1.44 32.2 6.00 0.533 29.3 6.14 <LLQ d
0.45b 34.7 13.9 1.38 36.9 5.71 0.592 37.0 6.13 <LLQ d
0.45c 32.3 12.4 1.25 33.6 5.16 0.509 29.3 5.33 0.376 Average: 35.9 13.4 1.36 34.2 5.62 0.545 31.9 5.87 0.370
%RSD: 12.1% 6.67% 7.16% 7.05% 7.59% 7.84% 14.0% 7.92% 1.4%
0.9a 111 22.4 1.56 No Peak e
9.30 0.979 102 7.87 0.391
0.9b 74.8 15.9 1.18 91.5 10.0 0.904 66.6 6.13 <LLQ d
0.9c 83.8 14.4 1.01 96.3 9.56 1.11 92.0 7.55 0.845 Average: 89.9 17.6 1.25 93.9 9.62 1.00 86.9 7.18 0.534
%RSD: 21.0% 24.2% 22.5% NA (n=2) 3.68% 10.5% 21.0% 12.9% 50.4%
1.8a 170 17.8 0.934 264 19.3 1.71 142 7.97 <LLQ d
1.8b 175 18.1 0.907 185 12.9 1.08 145 8.03 <LLQ d
1.8c 187 17.7 0.987 199 13.2 1.10 130 8.26 <LLQ d
S-4
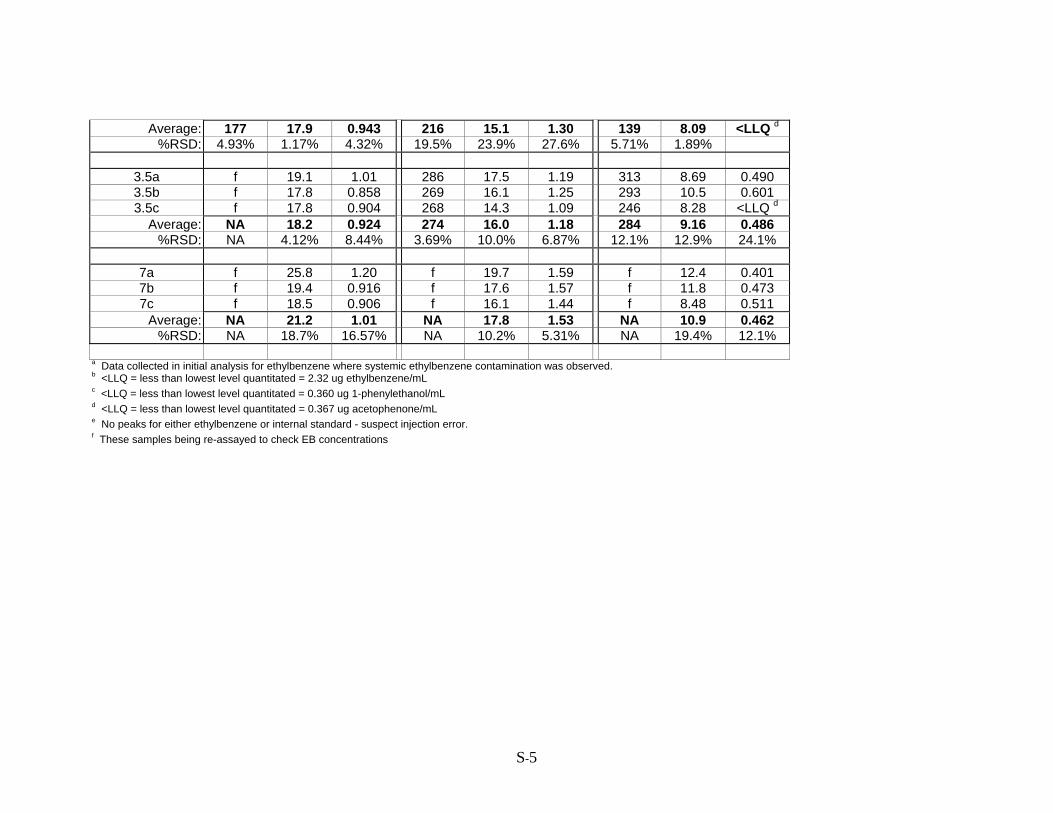
Average: 177 17.9 0.943 216 15.1 1.30 139 8.09 <LLQ d
%RSD: 4.93% 1.17% 4.32% 19.5% 23.9% 27.6% 5.71% 1.89%
3.5a f 19.1 1.01 286 17.5 1.19 313 8.69 0.490 3.5b f 17.8 0.858 269 16.1 1.25 293 10.5 0.601 3.5c f 17.8 0.904 268 14.3 1.09 246 8.28 <LLQ d
Average: NA 18.2 0.924 274 16.0 1.18 284 9.16 0.486 %RSD: NA 4.12% 8.44% 3.69% 10.0% 6.87% 12.1% 12.9% 24.1%
7a f 25.8 1.20 f 19.7 1.59 f 12.4 0.401 7b f 19.4 0.916 f 17.6 1.57 f 11.8 0.473 7c f 18.5 0.906 f 16.1 1.44 f 8.48 0.511
Average: NA 21.2 1.01 NA 17.8 1.53 NA 10.9 0.462 %RSD: NA 18.7% 16.57% NA 10.2% 5.31% NA 19.4% 12.1%
a Data collected in initial analysis for ethylbenzene where systemic ethylbenzene contamination was observed. b <LLQ = less than lowest level quantitated = 2.32 ug ethylbenzene/mL c <LLQ = less than lowest level quantitated = 0.360 ug 1-phenylethanol/mL d <LLQ = less than lowest level quantitated = 0.367 ug acetophenone/mL e No peaks for either ethylbenzene or internal standard - suspect injection error. f These samples being re-assayed to check EB concentrations
S-5
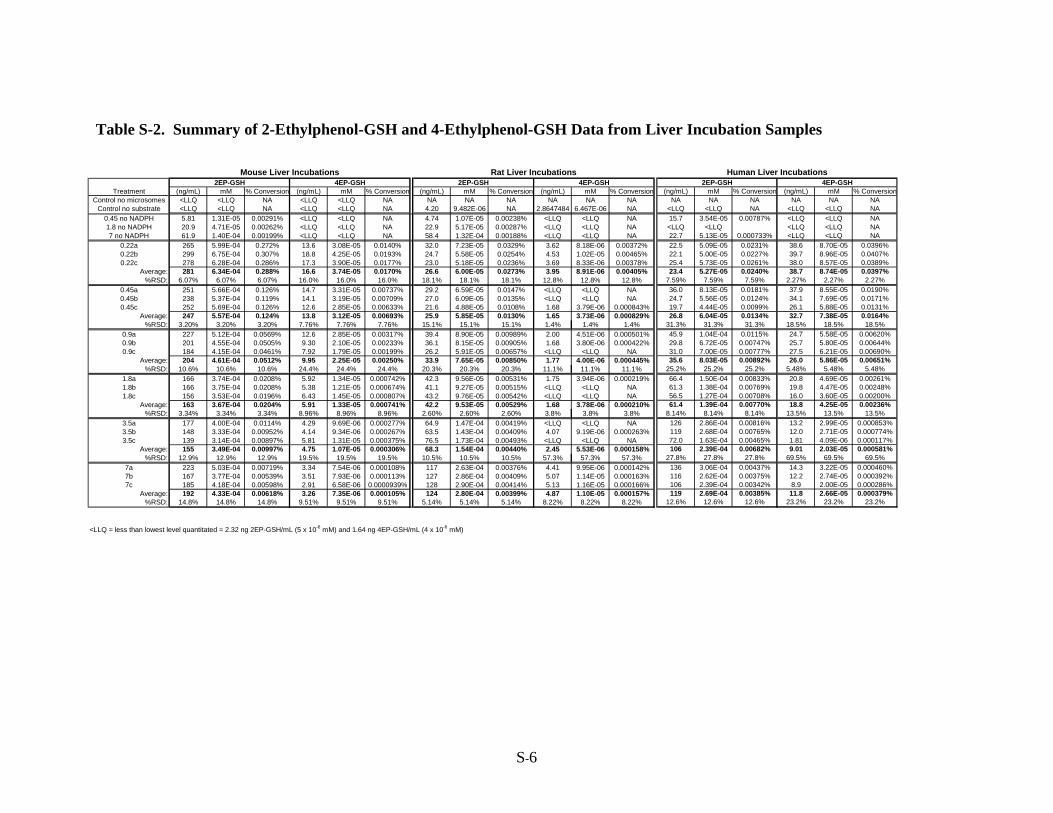
Table S-2. Summary of 2-Ethylphenol-GSH and 4-Ethylphenol-GSH Data from Liver Incubation Samples
Treatment (ng/mL) mM % Conversion (ng/mL) mM % Conversion (ng/mL) mM % Conversion (ng/mL) mM % ConversionControl no microsomes <LLQ <LLQ NA <LLQ <LLQ NA NA NA NA NA NA NA
Control no substrate <LLQ <LLQ NA <LLQ <LLQ NA 4.20 9.482E-06 NA 2.8647484 6.467E-06 NA0.45 no NADPH 5.81 1.31E-05 0.00291% <LLQ <LLQ NA 4.74 1.07E-05 0.00238% <LLQ <LLQ NA1.8 no NADPH 20.9 4.71E-05 0.00262% <LLQ <LLQ NA 22.9 5.17E-05 0.00287% <LLQ <LLQ NA7 no NADPH 61.9 1.40E-04 0.00199% <LLQ <LLQ NA 58.4 1.32E-04 0.00188% <LLQ <LLQ NA
0.22a 265 5.99E-04 0.272% 13.6 3.08E-05 0.0140% 32.0 7.23E-05 0.0329% 3.62 8.18E-06 0.00372%0.22b 299 6.75E-04 0.307% 18.8 4.25E-05 0.0193% 24.7 5.58E-05 0.0254% 4.53 1.02E-05 0.00465%0.22c 278 6.28E-04 0.286% 17.3 3.90E-05 0.0177% 23.0 5.18E-05 0.0236% 3.69 8.33E-06 0.00378%
Average: 281 6.34E-04 0.288% 16.6 3.74E-05 0.0170% 26.6 6.00E-05 0.0273% 3.95 8.91E-06 0.00405%%RSD: 6.07% 6.07% 6.07% 16.0% 16.0% 16.0% 18.1% 18.1% 18.1% 12.8% 12.8% 12.8%
0.45a 251 5.66E-04 0.126% 14.7 3.31E-05 0.00737% 29.2 6.59E-05 0.0147% <LLQ <LLQ NA0.45b 238 5.37E-04 0.119% 14.1 3.19E-05 0.00709% 27.0 6.09E-05 0.0135% <LLQ <LLQ NA0.45c 252 5.69E-04 0.126% 12.6 2.85E-05 0.00633% 21.6 4.88E-05 0.0108% 1.68 3.79E-06 0.000843%
Average: 247 5.57E-04 0.124% 13.8 3.12E-05 0.00693% 25.9 5.85E-05 0.0130% 1.65 3.73E-06 0.000829%%RSD: 3.20% 3.20% 3.20% 7.76% 7.76% 7.76% 15.1% 15.1% 15.1% 1.4% 1.4% 1.4%
0.9a 227 5.12E-04 0.0569% 12.6 2.85E-05 0.00317% 39.4 8.90E-05 0.00989% 2.00 4.51E-06 0.000501%0.9b 201 4.55E-04 0.0505% 9.30 2.10E-05 0.00233% 36.1 8.15E-05 0.00905% 1.68 3.80E-06 0.000422%0.9c 184 4.15E-04 0.0461% 7.92 1.79E-05 0.00199% 26.2 5.91E-05 0.00657% <LLQ <LLQ NA
Average: 204 4.61E-04 0.0512% 9.95 2.25E-05 0.00250% 33.9 7.65E-05 0.00850% 1.77 4.00E-06 0.000445%%RSD: 10.6% 10.6% 10.6% 24.4% 24.4% 24.4% 20.3% 20.3% 20.3% 11.1% 11.1% 11.1%
1.8a 166 3.74E-04 0.0208% 5.92 1.34E-05 0.000742% 42.3 9.56E-05 0.00531% 1.75 3.94E-06 0.000219%1.8b 166 3.75E-04 0.0208% 5.38 1.21E-05 0.000674% 41.1 9.27E-05 0.00515% <LLQ <LLQ NA1.8c 156 3.53E-04 0.0196% 6.43 1.45E-05 0.000807% 43.2 9.76E-05 0.00542% <LLQ <LLQ NA
Average: 163 3.67E-04 0.0204% 5.91 1.33E-05 0.000741% 42.2 9.53E-05 0.00529% 1.68 3.78E-06 0.000210%%RSD: 3.34% 3.34% 3.34% 8.96% 8.96% 8.96% 2.60% 2.60% 2.60% 3.8% 3.8% 3.8%
3.5a 177 4.00E-04 0.0114% 4.29 9.69E-06 0.000277% 64.9 1.47E-04 0.00419% <LLQ <LLQ NA3.5b 148 3.33E-04 0.00952% 4.14 9.34E-06 0.000267% 63.5 1.43E-04 0.00409% 4.07 9.19E-06 0.000263%3.5c 139 3.14E-04 0.00897% 5.81 1.31E-05 0.000375% 76.5 1.73E-04 0.00493% <LLQ <LLQ NA
Average: 155 3.49E-04 0.00997% 4.75 1.07E-05 0.000306% 68.3 1.54E-04 0.00440% 2.45 5.53E-06 0.000158%%RSD: 12.9% 12.9% 12.9% 19.5% 19.5% 19.5% 10.5% 10.5% 10.5% 57.3% 57.3% 57.3%
7a 223 5.03E-04 0.00719% 3.34 7.54E-06 0.000108% 117 2.63E-04 0.00376% 4.41 9.95E-06 0.000142%7b 167 3.77E-04 0.00539% 3.51 7.93E-06 0.000113% 127 2.86E-04 0.00409% 5.07 1.14E-05 0.000163%7c 185 4.18E-04 0.00598% 2.91 6.58E-06 0.0000939% 128 2.90E-04 0.00414% 5.13 1.16E-05 0.000166%
Average: 192 4.33E-04 0.00618% 3.26 7.35E-06 0.000105% 124 2.80E-04 0.00399% 4.87 1.10E-05 0.000157%%RSD: 14.8% 14.8% 14.8% 9.51% 9.51% 9.51% 5.14% 5.14% 5.14% 8.22% 8.22% 8.22%
<LLQ = less than lowest level quantitated = 2.32 ng 2EP-GSH/mL (5 x 10⁻⁶ mM) and 1.64 ng 4EP-GSH/mL (4 x 10⁻⁶ mM)
Mouse Liver Incubations Rat Liver Incubations2EP-GSH 4EP-GSH 2EP-GSH 4EP-GSH
(ng/mL) mM % Conversion (ng/mL) mM % ConversionNA NA NA NA NA NA
<LLQ <LLQ NA <LLQ <LLQ NA15.7 3.54E-05 0.00787% <LLQ <LLQ NA<LLQ <LLQ <LLQ <LLQ NA22.7 5.13E-05 0.000733% <LLQ <LLQ NA22.5 5.09E-05 0.0231% 38.6 8.70E-05 0.0396%22.1 5.00E-05 0.0227% 39.7 8.96E-05 0.0407%25.4 5.73E-05 0.0261% 38.0 8.57E-05 0.0389%23.4 5.27E-05 0.0240% 38.7 8.74E-05 0.0397%
7.59% 7.59% 7.59% 2.27% 2.27% 2.27%36.0 8.13E-05 0.0181% 37.9 8.55E-05 0.0190%24.7 5.56E-05 0.0124% 34.1 7.69E-05 0.0171%19.7 4.44E-05 0.0099% 26.1 5.88E-05 0.0131%26.8 6.04E-05 0.0134% 32.7 7.38E-05 0.0164%
31.3% 31.3% 31.3% 18.5% 18.5% 18.5%45.9 1.04E-04 0.0115% 24.7 5.58E-05 0.00620%29.8 6.72E-05 0.00747% 25.7 5.80E-05 0.00644%31.0 7.00E-05 0.00777% 27.5 6.21E-05 0.00690%35.6 8.03E-05 0.00892% 26.0 5.86E-05 0.00651%
25.2% 25.2% 25.2% 5.48% 5.48% 5.48%66.4 1.50E-04 0.00833% 20.8 4.69E-05 0.00261%61.3 1.38E-04 0.00769% 19.8 4.47E-05 0.00248%56.5 1.27E-04 0.00708% 16.0 3.60E-05 0.00200%61.4 1.39E-04 0.00770% 18.8 4.25E-05 0.00236%
8.14% 8.14% 8.14% 13.5% 13.5% 13.5%126 2.86E-04 0.00816% 13.2 2.99E-05 0.000853%119 2.68E-04 0.00765% 12.0 2.71E-05 0.000774%72.0 1.63E-04 0.00465% 1.81 4.09E-06 0.000117%106 2.39E-04 0.00682% 9.01 2.03E-05 0.000581%
27.8% 27.8% 27.8% 69.5% 69.5% 69.5%136 3.06E-04 0.00437% 14.3 3.22E-05 0.000460%116 2.62E-04 0.00375% 12.2 2.74E-05 0.000392%106 2.39E-04 0.00342% 8.9 2.00E-05 0.000286%119 2.69E-04 0.00385% 11.8 2.66E-05 0.000379%
12.6% 12.6% 12.6% 23.2% 23.2% 23.2%
Human Liver Incubations2EP-GSH 4EP-GSH
S-6
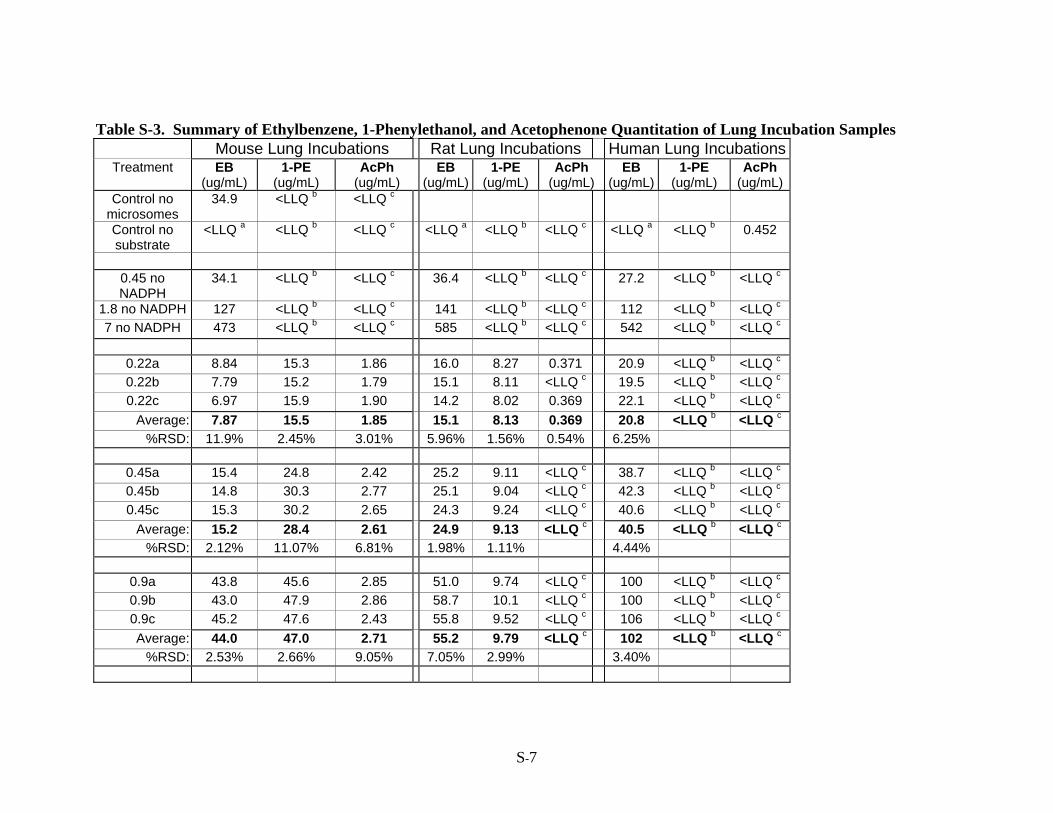
Table S-3. Summary of Ethylbenzene, 1-Phenylethanol, and Acetophenone Quantitation of Lung Incubation Samples Mouse Lung Incubations Rat Lung Incubations Human Lung Incubations
Treatment EB (ug/mL)
1-PE (ug/mL)
AcPh (ug/mL)
EB (ug/mL)
1-PE (ug/mL)
AcPh (ug/mL)
EB (ug/mL)
1-PE (ug/mL)
AcPh (ug/mL)
Control no microsomes
34.9 <LLQ b <LLQ c
Control no substrate
<LLQ a <LLQ b <LLQ c <LLQ a <LLQ b <LLQ c <LLQ a <LLQ b 0.452
0.45 no NADPH
34.1 <LLQ b <LLQ c 36.4 <LLQ b <LLQ c 27.2 <LLQ b <LLQ c
1.8 no NADPH 127 <LLQ b <LLQ c 141 <LLQ b <LLQ c 112 <LLQ b <LLQ c
7 no NADPH 473 <LLQ b <LLQ c 585 <LLQ b <LLQ c 542 <LLQ b <LLQ c
0.22a 8.84 15.3 1.86 16.0 8.27 0.371 20.9 <LLQ b <LLQ c
0.22b 7.79 15.2 1.79 15.1 8.11 <LLQ c 19.5 <LLQ b <LLQ c
0.22c 6.97 15.9 1.90 14.2 8.02 0.369 22.1 <LLQ b <LLQ c
Average: 7.87 15.5 1.85 15.1 8.13 0.369 20.8 <LLQ b <LLQ c
%RSD: 11.9% 2.45% 3.01% 5.96% 1.56% 0.54% 6.25%
0.45a 15.4 24.8 2.42 25.2 9.11 <LLQ c 38.7 <LLQ b <LLQ c
0.45b 14.8 30.3 2.77 25.1 9.04 <LLQ c 42.3 <LLQ b <LLQ c
0.45c 15.3 30.2 2.65 24.3 9.24 <LLQ c 40.6 <LLQ b <LLQ c
Average: 15.2 28.4 2.61 24.9 9.13 <LLQ c 40.5 <LLQ b <LLQ c
%RSD: 2.12% 11.07% 6.81% 1.98% 1.11% 4.44%
0.9a 43.8 45.6 2.85 51.0 9.74 <LLQ c 100 <LLQ b <LLQ c
0.9b 43.0 47.9 2.86 58.7 10.1 <LLQ c 100 <LLQ b <LLQ c
0.9c 45.2 47.6 2.43 55.8 9.52 <LLQ c 106 <LLQ b <LLQ c
Average: 44.0 47.0 2.71 55.2 9.79 <LLQ c 102 <LLQ b <LLQ c
%RSD: 2.53% 2.66% 9.05% 7.05% 2.99% 3.40%
S-7
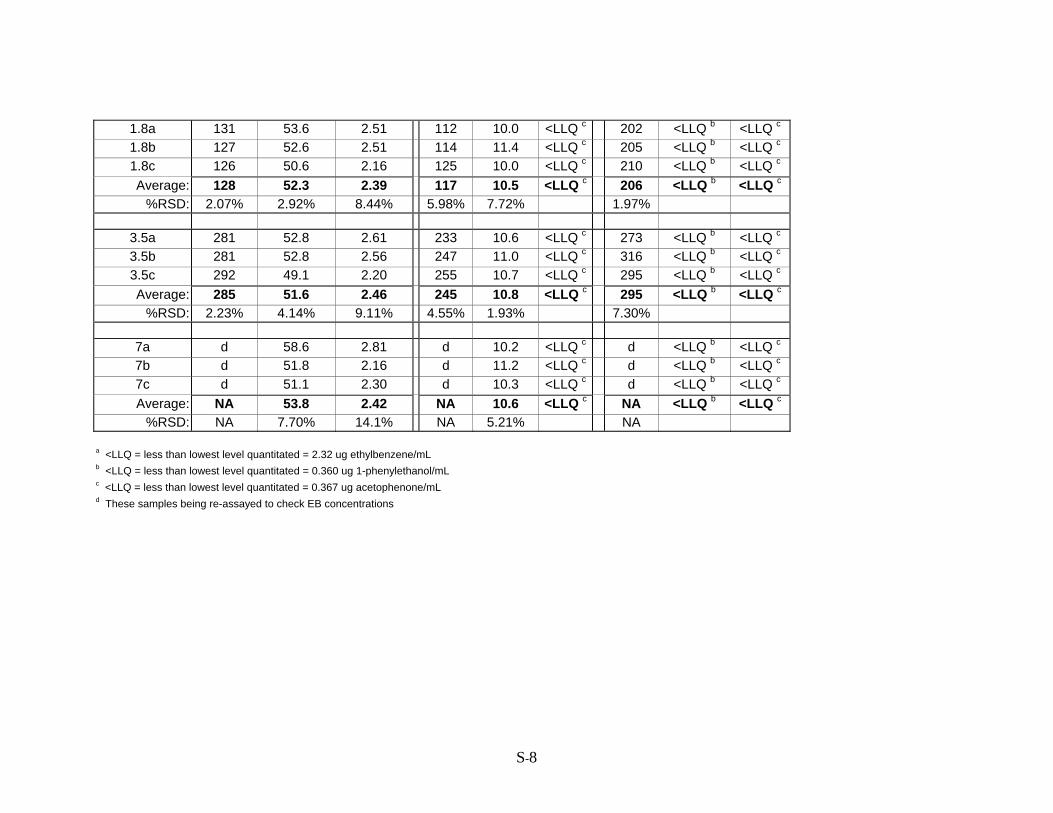
1.8a 131 53.6 2.51 112 10.0 <LLQ c 202 <LLQ b <LLQ c
1.8b 127 52.6 2.51 114 11.4 <LLQ c 205 <LLQ b <LLQ c
1.8c 126 50.6 2.16 125 10.0 <LLQ c 210 <LLQ b <LLQ c
Average: 128 52.3 2.39 117 10.5 <LLQ c 206 <LLQ b <LLQ c
%RSD: 2.07% 2.92% 8.44% 5.98% 7.72% 1.97%
3.5a 281 52.8 2.61 233 10.6 <LLQ c 273 <LLQ b <LLQ c
3.5b 281 52.8 2.56 247 11.0 <LLQ c 316 <LLQ b <LLQ c
3.5c 292 49.1 2.20 255 10.7 <LLQ c 295 <LLQ b <LLQ c
Average: 285 51.6 2.46 245 10.8 <LLQ c 295 <LLQ b <LLQ c
%RSD: 2.23% 4.14% 9.11% 4.55% 1.93% 7.30%
7a d 58.6 2.81 d 10.2 <LLQ c d <LLQ b <LLQ c
7b d 51.8 2.16 d 11.2 <LLQ c d <LLQ b <LLQ c
7c d 51.1 2.30 d 10.3 <LLQ c d <LLQ b <LLQ c
Average: NA 53.8 2.42 NA 10.6 <LLQ c NA <LLQ b <LLQ c
%RSD: NA 7.70% 14.1% NA 5.21% NA
a <LLQ = less than lowest level quantitated = 2.32 ug ethylbenzene/mL b <LLQ = less than lowest level quantitated = 0.360 ug 1-phenylethanol/mL c <LLQ = less than lowest level quantitated = 0.367 ug acetophenone/mL d These samples being re-assayed to check EB concentrations
S-8
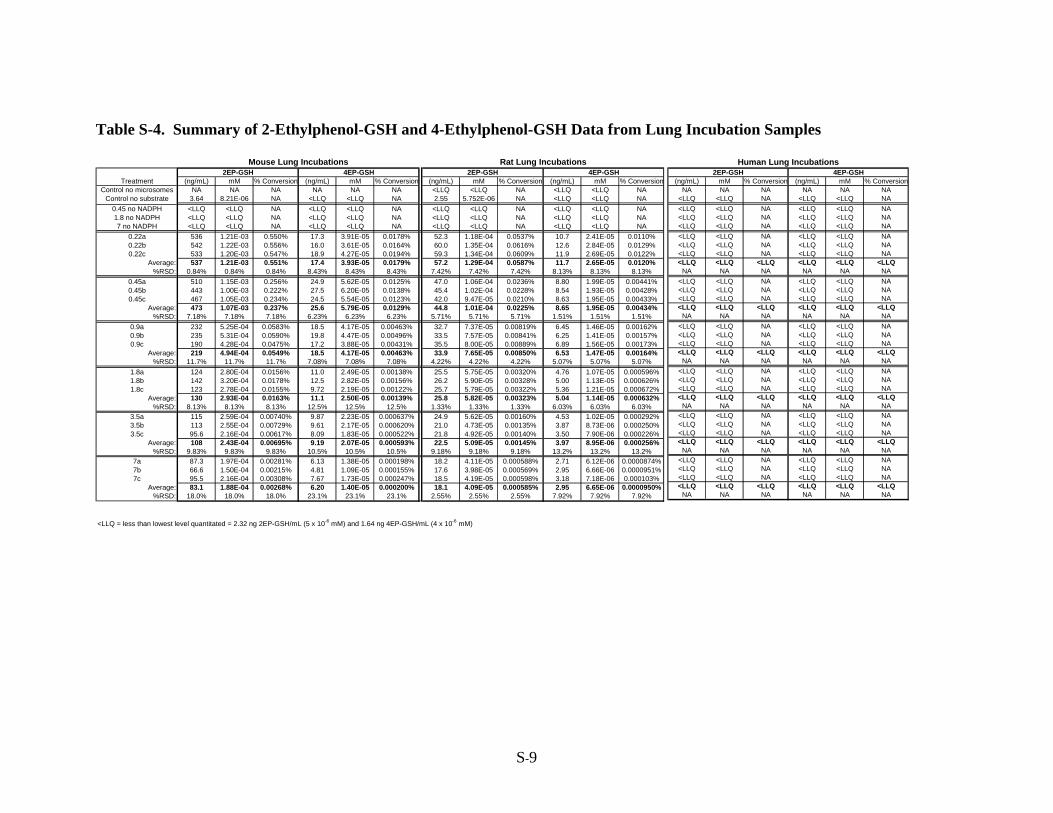
Table S-4. Summary of 2-Ethylphenol-GSH and 4-Ethylphenol-GSH Data from Lung Incubation Samples
Treatment (ng/mL) mM % Conversion (ng/mL) mM % Conversion (ng/mL) mM % Conversion (ng/mL) mM % ConversionControl no microsomes NA NA NA NA NA NA <LLQ <LLQ NA <LLQ <LLQ NA
Control no substrate 3.64 8.21E-06 NA <LLQ <LLQ NA 2.55 5.752E-06 NA <LLQ <LLQ NA0.45 no NADPH <LLQ <LLQ NA <LLQ <LLQ NA <LLQ <LLQ NA <LLQ <LLQ NA1.8 no NADPH <LLQ <LLQ NA <LLQ <LLQ NA <LLQ <LLQ NA <LLQ <LLQ NA7 no NADPH <LLQ <LLQ NA <LLQ <LLQ NA <LLQ <LLQ NA <LLQ <LLQ NA
0.22a 536 1.21E-03 0.550% 17.3 3.91E-05 0.0178% 52.3 1.18E-04 0.0537% 10.7 2.41E-05 0.0110%0.22b 542 1.22E-03 0.556% 16.0 3.61E-05 0.0164% 60.0 1.35E-04 0.0616% 12.6 2.84E-05 0.0129%0.22c 533 1.20E-03 0.547% 18.9 4.27E-05 0.0194% 59.3 1.34E-04 0.0609% 11.9 2.69E-05 0.0122%
Average: 537 1.21E-03 0.551% 17.4 3.93E-05 0.0179% 57.2 1.29E-04 0.0587% 11.7 2.65E-05 0.0120%%RSD: 0.84% 0.84% 0.84% 8.43% 8.43% 8.43% 7.42% 7.42% 7.42% 8.13% 8.13% 8.13%
0.45a 510 1.15E-03 0.256% 24.9 5.62E-05 0.0125% 47.0 1.06E-04 0.0236% 8.80 1.99E-05 0.00441%0.45b 443 1.00E-03 0.222% 27.5 6.20E-05 0.0138% 45.4 1.02E-04 0.0228% 8.54 1.93E-05 0.00428%0.45c 467 1.05E-03 0.234% 24.5 5.54E-05 0.0123% 42.0 9.47E-05 0.0210% 8.63 1.95E-05 0.00433%
Average: 473 1.07E-03 0.237% 25.6 5.79E-05 0.0129% 44.8 1.01E-04 0.0225% 8.65 1.95E-05 0.00434%%RSD: 7.18% 7.18% 7.18% 6.23% 6.23% 6.23% 5.71% 5.71% 5.71% 1.51% 1.51% 1.51%
0.9a 232 5.25E-04 0.0583% 18.5 4.17E-05 0.00463% 32.7 7.37E-05 0.00819% 6.45 1.46E-05 0.00162%0.9b 235 5.31E-04 0.0590% 19.8 4.47E-05 0.00496% 33.5 7.57E-05 0.00841% 6.25 1.41E-05 0.00157%0.9c 190 4.28E-04 0.0475% 17.2 3.88E-05 0.00431% 35.5 8.00E-05 0.00889% 6.89 1.56E-05 0.00173%
Average: 219 4.94E-04 0.0549% 18.5 4.17E-05 0.00463% 33.9 7.65E-05 0.00850% 6.53 1.47E-05 0.00164%%RSD: 11.7% 11.7% 11.7% 7.08% 7.08% 7.08% 4.22% 4.22% 4.22% 5.07% 5.07% 5.07%
1.8a 124 2.80E-04 0.0156% 11.0 2.49E-05 0.00138% 25.5 5.75E-05 0.00320% 4.76 1.07E-05 0.000596%1.8b 142 3.20E-04 0.0178% 12.5 2.82E-05 0.00156% 26.2 5.90E-05 0.00328% 5.00 1.13E-05 0.000626%1.8c 123 2.78E-04 0.0155% 9.72 2.19E-05 0.00122% 25.7 5.79E-05 0.00322% 5.36 1.21E-05 0.000672%
Average: 130 2.93E-04 0.0163% 11.1 2.50E-05 0.00139% 25.8 5.82E-05 0.00323% 5.04 1.14E-05 0.000632%%RSD: 8.13% 8.13% 8.13% 12.5% 12.5% 12.5% 1.33% 1.33% 1.33% 6.03% 6.03% 6.03%
3.5a 115 2.59E-04 0.00740% 9.87 2.23E-05 0.000637% 24.9 5.62E-05 0.00160% 4.53 1.02E-05 0.000292%3.5b 113 2.55E-04 0.00729% 9.61 2.17E-05 0.000620% 21.0 4.73E-05 0.00135% 3.87 8.73E-06 0.000250%3.5c 95.6 2.16E-04 0.00617% 8.09 1.83E-05 0.000522% 21.8 4.92E-05 0.00140% 3.50 7.90E-06 0.000226%
Average: 108 2.43E-04 0.00695% 9.19 2.07E-05 0.000593% 22.5 5.09E-05 0.00145% 3.97 8.95E-06 0.000256%%RSD: 9.83% 9.83% 9.83% 10.5% 10.5% 10.5% 9.18% 9.18% 9.18% 13.2% 13.2% 13.2%
7a 87.3 1.97E-04 0.00281% 6.13 1.38E-05 0.000198% 18.2 4.11E-05 0.000588% 2.71 6.12E-06 0.0000874%7b 66.6 1.50E-04 0.00215% 4.81 1.09E-05 0.000155% 17.6 3.98E-05 0.000569% 2.95 6.66E-06 0.0000951%7c 95.5 2.16E-04 0.00308% 7.67 1.73E-05 0.000247% 18.5 4.19E-05 0.000598% 3.18 7.18E-06 0.000103%
Average: 83.1 1.88E-04 0.00268% 6.20 1.40E-05 0.000200% 18.1 4.09E-05 0.000585% 2.95 6.65E-06 0.0000950%%RSD: 18.0% 18.0% 18.0% 23.1% 23.1% 23.1% 2.55% 2.55% 2.55% 7.92% 7.92% 7.92%
<LLQ = less than lowest level quantitated = 2.32 ng 2EP-GSH/mL (5 x 10⁻⁶ mM) and 1.64 ng 4EP-GSH/mL (4 x 10⁻⁶ mM)
Mouse Lung Incubations Rat Lung Incubations2EP-GSH 4EP-GSH 2EP-GSH 4EP-GSH
(ng/mL) mM % Conversion (ng/mL) mM % ConversionNA NA NA NA NA NA
<LLQ <LLQ NA <LLQ <LLQ NA<LLQ <LLQ NA <LLQ <LLQ NA<LLQ <LLQ NA <LLQ <LLQ NA<LLQ <LLQ NA <LLQ <LLQ NA<LLQ <LLQ NA <LLQ <LLQ NA<LLQ <LLQ NA <LLQ <LLQ NA<LLQ <LLQ NA <LLQ <LLQ NA<LLQ <LLQ <LLQ <LLQ <LLQ <LLQ
NA NA NA NA NA NA<LLQ <LLQ NA <LLQ <LLQ NA<LLQ <LLQ NA <LLQ <LLQ NA<LLQ <LLQ NA <LLQ <LLQ NA<LLQ <LLQ <LLQ <LLQ <LLQ <LLQ
NA NA NA NA NA NA<LLQ <LLQ NA <LLQ <LLQ NA<LLQ <LLQ NA <LLQ <LLQ NA<LLQ <LLQ NA <LLQ <LLQ NA<LLQ <LLQ <LLQ <LLQ <LLQ <LLQ
NA NA NA NA NA NA<LLQ <LLQ NA <LLQ <LLQ NA<LLQ <LLQ NA <LLQ <LLQ NA<LLQ <LLQ NA <LLQ <LLQ NA<LLQ <LLQ <LLQ <LLQ <LLQ <LLQ
NA NA NA NA NA NA<LLQ <LLQ NA <LLQ <LLQ NA<LLQ <LLQ NA <LLQ <LLQ NA<LLQ <LLQ NA <LLQ <LLQ NA<LLQ <LLQ <LLQ <LLQ <LLQ <LLQ
NA NA NA NA NA NA<LLQ <LLQ NA <LLQ <LLQ NA<LLQ <LLQ NA <LLQ <LLQ NA<LLQ <LLQ NA <LLQ <LLQ NA<LLQ <LLQ <LLQ <LLQ <LLQ <LLQ
NA NA NA NA NA NA
Human Lung Incubations2EP-GSH 4EP-GSH
S-9
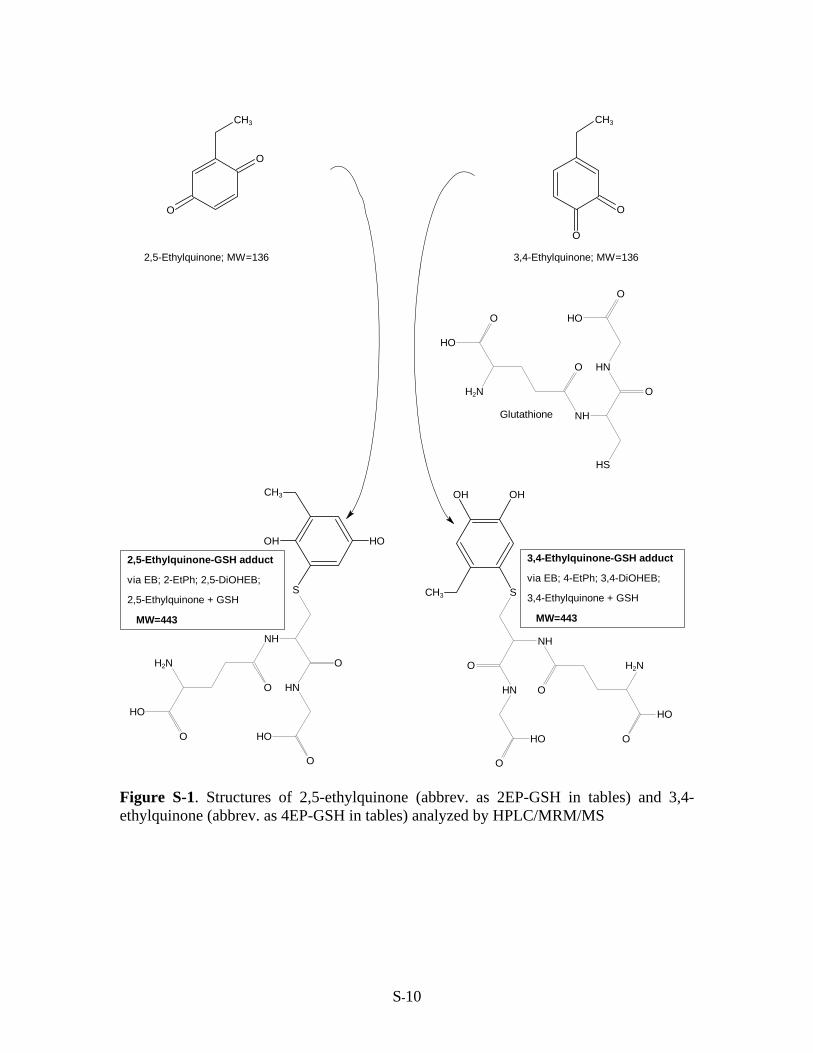
O
O
OH
NH2 O
NH
SH
O
NH
OH
Glutathione
CH3
O
O
CH3
O
O
CH3
OH OH
O
O
OH
NH2 O
NH
S
O
NH
OH
O
O
OH
NH2O
NH
S
O
NH
OH
CH3
OHOH
2,5-Ethylquinone-GSH adduct
via EB; 2-EtPh; 2,5-DiOHEB;
2,5-Ethylquinone + GSH
MW=443
3,4-Ethylquinone-GSH adduct
via EB; 4-EtPh; 3,4-DiOHEB;
3,4-Ethylquinone + GSH
MW=443
2,5-Ethylquinone; MW=136 3,4-Ethylquinone; MW=136
Figure S-1. Structures of 2,5-ethylquinone (abbrev. as 2EP-GSH in tables) and 3,4-ethylquinone (abbrev. as 4EP-GSH in tables) analyzed by HPLC/MRM/MS
S-10


