Page 1
ECONOMIC POLICY UNCERTAINTY AND FINANCIAL MARKET
PARTICIPATION: EMPIRICAL EVIDENCE FROM MUTUAL FUND
FLOW DATA
Abstract: The paper studies the impact of economic policy uncertainty on financial market
participation. Theoretical results show that economic policy uncertainty could affect investor financial
decisions through market risk and ambiguity. With equity fund flow data from 2004 to 2016 in China,
the paper finds that the increase of economic policy uncertainty could significantly decrease fund flows.
Furthermore, there are heterogeneous effects of economic policy uncertainty: mutual funds with active
investment strategy and high yield target are affected more than those with low-risk and stable revenue;
mutual funds mainly invested by retail investors suffer more than those mainly invested by institutional
investors. With new stock accounts and household survey data, the paper further shows that economic
policy uncertainty has negative impact on investor financial market participation. As a result, the
government should pay more attention to the negative effects of the economic policy uncertainty, and
maintain policy stability to maximize policy effectiveness.
Key words: Economic Policy Uncertainty; Fund Flows; Financial Market Participation; Ambiguity
JEL Classification: E22, E61, G11
1. Introduction
Economic policy is an important government intervention in economic
development and shaping market environment. Uncertain factors, such as contents,
implementation timing, and expected effects of economic policy would cause
economic policy uncertainty (Gulen and Ion, 2016; Julio and Yook, 2012). Concerns
about economic policy uncertainty have intensified with the global financial crises,
the British retreat to Europe, and the US general election, etc., in recent years.
According to Stock and Watson (2012) and Baker et al. (2016), economic policy
uncertainty could decrease investment and GDP, and even contribute to slow
recoveries after the global financial crisis. Current literature more focuses on the
impact of economic policy uncertainty on corporate investment and asset prices
(Pastor and Veronesi, 2012; Wang et al., 2014) but pays less attention to the impact
on investors. As a systematic uncertainty, whether and how could economic policy
uncertainty affect investors? The paper combines economic policy in macro-level and
investor behavior in micro-level to test the impact of economic policy uncertainty.
To study the impacts of economic policy uncertainty, we should clarify its
mechanism on investors. According to the literature, economic policy uncertainty
could affect investor behavior through increasing financial market risk and ambiguity.
As for market risk, economic policy uncertainty could increase stock market price
volatility and decrease investors’ financial market participation (Pastor and Veronesi,
2012). Investors encounter ambiguity when they could not know exact distribution of
financial assets’ future return (Chen and Epstein, 2002; Epstein and Schneider, 2008).
Due to aversion to ambiguity (Bossaert et al., 2010), investors attend to maximize
Page 2
their profits in the worst cases (Cao et al., 2005; Gilboa and Schneider, 1988). When
market ambiguity increases with economic policy uncertainty, investors are less likely
to participate in financial market.
Furthermore, economic policy uncertainty could have heterogeneous impacts on
different kinds of assets and investors. Due to different degree of investment
irreversibility, economic policy uncertainty has heterogeneous impacts on different
kinds of financial assets (Gulen and Ion, 2016). Considering differences of risk
aversion, ambiguity aversion and cognitive ability, different kinds of investors would
also be affected heterogeneously (Guiso and Paiella, 2008; Potamites and Zhang,
2012). Specially, in financial markets, retail investors and institutional investors
follow different behavioral patterns (Barber and Odean, 2008). Since retail investors
and institutional investors are both crucial in financial markets, the paper studies
heterogeneous impacts of economic policy uncertainty on them.
Based on that, the paper follows model set-up in Cao et al. (2005), and solve
investors’ optimized asset allocation under assumption of risk aversion and ambiguity
aversion. Theoretical results show that, economic policy uncertainty decrease
investors’ proportion of risky asset allocation by increasing market risk and ambiguity,
and the larger degree of risk aversion or ambiguity aversion, the larger is the impact.
Particularly, when market ambiguity exceeds specific degree, investors would hold no
risky asset and stay out of financial market.
For empirical analyses, the paper uses index of economic policy uncertainty
(EPU) for China (Baker et al., 2013) to measure the Chinese economic policy
uncertainty, and uses fund flows to measure investors’ financial market investment, to
explore how economic policy uncertainty affects investor behavior. Baker et al. (2013)
develop the index of economic policy uncertainty for China by key words search and
context analyses and the index has been largely used for policy uncertainty research
(Rao et al., 2017; Wang et al., 2014). Considering data availability, the paper uses
mutual fund flow to measure investor behavior referring to Antoniou et al. (2015) and
Li et al. (2016). Mutual fund is one of the most important parts of financial market,
and size of open mutual fund reaches 8.75 trillion RMB in China in 2016. Besides,
mutual fund data provides available heterogeneity for our research.
The remainder of the paper is organized as follows. Section 2 reviews related
studies. Section 3 introduces theoretical model and research hypotheses. Section 4
Page 3
describes data and methodology. Section 5 reports empirical results and robustness
check. Section 6 discusses the findings and concludes the paper.
2 Literature Review
Uncertain factors including what kinds of policy government will take, when
policy will be implemented and what expected results are would lead to economic
policy uncertainty (Gulen and Ion, 2016; Julio and Yook, 2012). To deal with
economic fluctuation, governments around the world implement multiple economic
policies, and policy uncertainty has been increasing steadily in recent years, which
causes wide concern. Existing literature focuses on impacts of economic policy on
economic growth (Yang et al., 2014), corporate investment and cash holding (Julio
and Yook, 2012; Wang et al.,2014), but pays less attention to potential impacts on
investors. Uncertainty, including return uncertainty (Campell, 2006) and income
uncertainty (Kochar, 1995) could significantly affect investor asset allocation decision.
While these research focuses on idiosyncratic uncertainty, as a systematic uncertainty
in financial market, economic policy uncertainty could also affect investor behavior.
One of research questions of the paper is to explore relationship between economic
policy uncertainty and investor financial market participation.
Economic policy uncertainty could affect investor behavior through financial
market risk and ambiguity. As for the market risk, Pastor and Veronesi (2012) both
find that economic policy uncertainty could increase stock price volatility, which
increases the market risk. According to the classical asset allocation theory, when the
market risk increases, investors would allocate less income into risky assets due to
risk aversion (Campell, 2006; Dow and da Costa Werlang, 1992). Economic policy
uncertainty could also affect investor behavior through market ambiguity, where
ambiguity means that investors do not know exact distribution of future asset return
(Chen and Epstein, 2002; Epstein and Schneider, 2008). Ellsberg (1961), Bossaert et
al. (2010) find that individuals are generally ambiguity averse. Under ambiguity
aversion, Cao et al. (2005) and Epstein and Schneider (2010) show that ambiguity
would decrease investors’ financial market participation, and Antoniou et al. (2015)
and Li et al. (2016) verify this with mutual fund data. Uncertain about government
policy making would cause market ambiguity and hence affect investor financial
market participation. The paper sets up a theoretical model and verify the model with
empirical analyses, which contributes to the current literature about policy uncertainty.
Page 4
Due to differences in asset types and investor preferences, economic policy
uncertainty could have heterogeneous impacts. As for asset heterogeneity, Gulen and
Ion (2016) find that corporates with more irreversible assets suffer more from
economic policy uncertainty; Rao et al. (2014) find that state-owned companies are
more affected than private companies. For mutual fund investment, degree of
sensibility should be different for funds with different investment styles (Anderson et
al., 2009; Antoniou et al., 2015). As for investor preferences heterogeneity, financial
market participants include retail investors and institutional investors. Due to
differences in risk aversion and ambiguity aversion, the two types of investors have
different investment behaviors (Barber and Odean, 2008). Specially, proportion of
retail investors is more than institutional investors in China, which makes it as an
interesting question to explore different behaviors between two types of investors.
Moreover, with vibrant literature studying low household participation in financial
market (Basak and Cuoco, 1998; Mankiw and Zeldes, 1991), analyses for retail
investors could also contribute to counterpart research in household finance.
The paper also contributes to literature studying determinants of fund flows.
Froot et al. (2001) and Sirri and Tufano (1998) find that historical performance and
ability of fund manager affect fund flows. Del Guercio and Tkac (2008) find that fund
rating information could increase fund flows by decreasing fund search cost and star
funds could further attract more fund flows. Ivkovich and Weisbenner (2009), Jain
and Wu (2000) and Nanda et al. (2004) find that fees and advertising costs of mutual
fund affect fund flows. The paper contributes to this literature by exploring the
impacts of economic policy uncertainty, and finds that economic policy uncertainty
could significantly affect fund flows.
3 Theoretical Model and Hypotheses
To explore the impacts of economic policy uncertainty, the paper sets up a
theoretical model based on Cao et al. (2005). Suppose in one-period endowment
economy, a representative CARA (Constant Absolute Risk Aversion) agent has initial
endowment as W0 and absolute risk aversion coefficient as a > 0 . The economy has
two kinds of assets: risk-free asset and risky asset, and to simplify, risk-free interest
rate is set as 0. Risky asset has price as p and rate of return as r. The rate of return
follows normal distribution with mean r and variance s 2 . The paper relaxes
assumption that investors know the distribution of return of risky asset, and assumes
Page 5
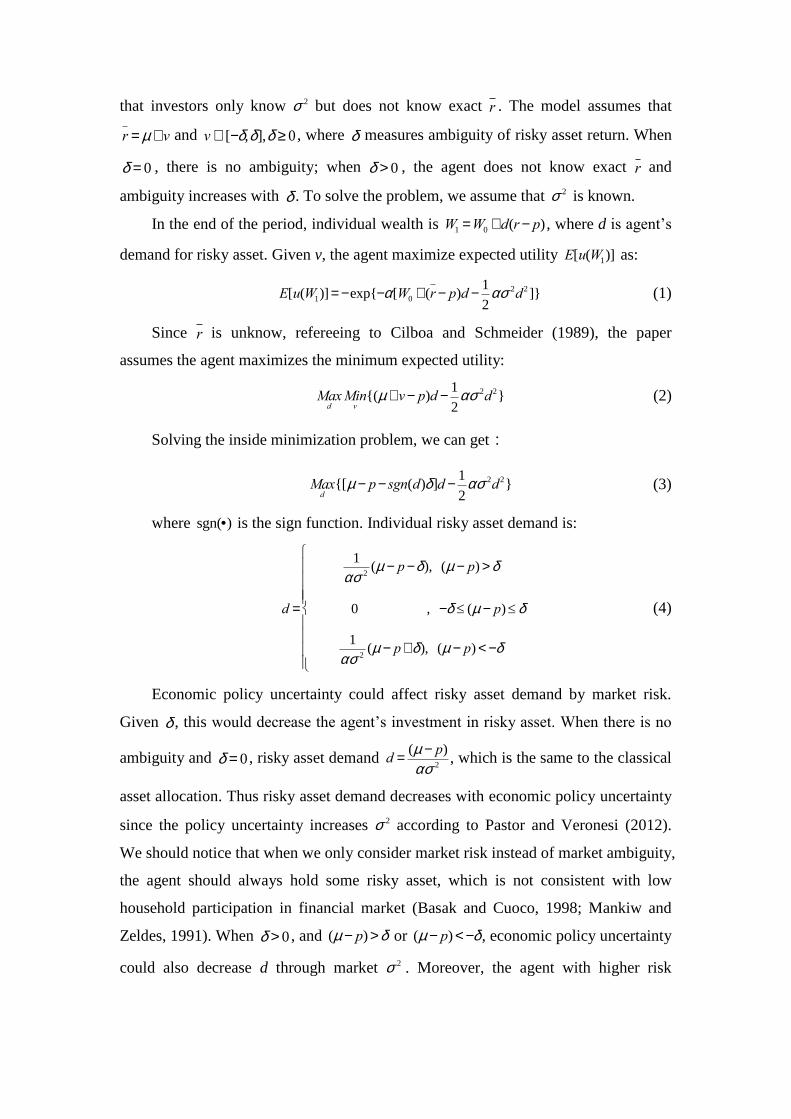
that investors only know s 2
but does not know exact r . The model assumes that
r = m +v and vÎ [-d,d],d ³ 0 , where d measures ambiguity of risky asset return. When
d = 0 , there is no ambiguity; when d > 0 , the agent does not know exact r and
ambiguity increases with d . To solve the problem, we assume that s 2
is known.
In the end of the period, individual wealth is W1 =W0 +d(r- p) , where d is agent’s
demand for risky asset. Given v, the agent maximize expected utility E[u(W1)] as:
E[u(W1)]= -exp{-a[W0 + (r- p)d -1
2as 2d2 ]} (1)
Since r is unknow, refereeing to Cilboa and Schmeider (1989), the paper
assumes the agent maximizes the minimum expected utility:
MaxdMinv
{(m + v- p)d -1
2as 2d2} (2)
Solving the inside minimization problem, we can get:
Maxd
{[m - p- sgn(d)d]d -1
2as 2d2} (3)
where sgn(·) is the sign function. Individual risky asset demand is:
d =
1
as 2(m - p-d), (m - p) > d
0 , -d £ (m - p)£ d
1
as 2(m - p+d), (m - p) < -d
ì
í
ïïïï
î
ïïïï
(4)
Economic policy uncertainty could affect risky asset demand by market risk.
Given d , this would decrease the agent’s investment in risky asset. When there is no
ambiguity and d = 0 , risky asset demand d =(m - p)
as 2, which is the same to the classical
asset allocation. Thus risky asset demand decreases with economic policy uncertainty
since the policy uncertainty increases s 2 according to Pastor and Veronesi (2012).
We should notice that when we only consider market risk instead of market ambiguity,
the agent should always hold some risky asset, which is not consistent with low
household participation in financial market (Basak and Cuoco, 1998; Mankiw and
Zeldes, 1991). When d > 0 , and (m - p) >d or (m - p) < -d , economic policy uncertainty
could also decrease d through market s 2 . Moreover, the agent with higher risk
Page 6
aversion a is affected more severely, which implies heterogeneous impacts from
economic policy uncertainty.
Economic policy uncertainty could also decrease risky asset demand through
market ambiguity. As shown in Equation (4), the agent expects the lowest premium
when long and expects the highest premium when short. When m > p+d ( m < p-d ),
the agent is long (short) and d decreases risky asset demand. Specifically, in the case
of -d £ (m - p) £d , the agent will not hold any risky asset, which is a “no-trade zone”
initially showed by Dow and da Costa Werlang (1992). That means, the agent will not
participate in financial market if d is large enough. When the agent is uncertain about
economic policy, it is reasonable to assume that the distribution of return of risky
asset is not fully known. Thus, the more uncertain about economic policy, the larger is
market ambiguity, which indicates that economic policy uncertainty could affect risky
asset demand through market ambiguity.
In summary, economic policy uncertainty could affect investors’ financial
market participation through market risk and market ambiguity. Equation (4) implies
two hypotheses in the paper: (1) an increase in economic policy uncertainty will
decrease investment amount in financial market when all else equal; (2) an increase in
economic policy uncertainty will decrease investors’ participation in financial market
when all else equal. Moreover, due to heterogeneity of investment irreversibility and
investors, economic policy uncertainty should have heterogeneous impacts: assets that
are more sensitive to policy change should be affected more, and retail investors
should be affected more than institutional investors.
4 Data and Methodology
To explore relationship between economic policy uncertainty and investors’
financial market participation, the paper uses the index of economic policy
uncertainty for China (Baker et al., 2013) to measure degree of economic policy
uncertainty, and equity fund flows to measure financial market participation. Sample
selection and methodology are as follows.
4.1 Sample selection and data sources
Referring to Li et al. (2016) and Sirri and Tufano (1998), the paper focuses on
equity funds excluding QDII. Mutual fund and stock market data are all from the
China Stock Market & Accounting Research (CSMAR) database system, including
fund flows and performance data. Economic policy uncertainty is from Baker et al.
Page 7
(2013). Final sample is unbalanced panel data consisted of 743 funds from the second
quarter in 2004 to the fourth quarter in 2016.
4.2 Empirical methodology
The paper analyzes the relationship between fund flows and economic policy
uncertainty when controlling various other factors. Referring to Antoniou et al. (2015)
and Ben-Rephael et al. (2012), the paper estimates the flowing regression model:
flowit = b0 +b1Dput +b2 flowit-1 +Zitg +a j +eit (5)
where flowit indicates fund i’s fund flows in quarter t; put is economic policy
uncertainty in quarter t and Dput is economic policy uncertainty change between
quarter t and t-1. In the regression model (5), the paper uses the change instead of the
level of economic policy uncertainty. In theoretical model, we find that financial
market investment, as measured by net assets held by mutual funds, is determined by
the level of economic policy uncertainty and thus fund flows, which measure the
change in net assets, should be affected by the change in economic policy uncertainty.
Due to possible autocorrelation in fund flows, the regression model (5) also controls
fund flows in t-1. Zit represents control variables including return of the fund, rank of
the fund and fund size, etc. To control other unobservable fund characteristics, the
paper controls fund fixed effect a j. Since economic policy uncertainty is macro-level
variable, the paper cannot control time fixed effect but we add control variables to test
robustness of the model results. eit is random error terms. b1 measures the impact of
economic policy uncertainty to fund flows and we predict that it should be
significantly negative.
4.2.1 Fund flows
Referring to Ben-Rephael et al. (2012) and Li et al. (2016), the paper defines
quarterly fund flows as:
flowit =TNAit - (1+ rfit )TNAit-1
TNAit-1
(6)
where TNAit is fund i’s total net asset value in the end of t; rfit is the fund’s return
rate in quarter t. Considering increasing fund size, the paper uses fund size in the
beginning of period t to standardize fund flows, and so flowit represents percentage
changes of flow data. This definition assumes that all funds enter in the end of quarter
t and ignores fund net value increases or dividends, which is a conservative index. To
further avoid extreme value, fund flows are winsorized in 1% level.
Page 8
4.2.2 Economic policy uncertainty
The paper uses the index of economic policy uncertainty for China (Baker et al.,
2013) to measure the degree of economic policy uncertainty.①
The index is based on
Internet search and context analyses and it analyses press release about the Chinese
economic policy uncertainty from South China Morning Post released in Hong Kong,
China. Generally, the index equals the number of press release about economic policy
uncertainty divided by the number of total reports. The index is monthly data updated
from January 1995, in which the index is standardized as 100. More details about the
index construction could be found in Baker et al. (2013). The index has been widely
used in studies about economic policy uncertainty in China (Feng and Yang, 2015;
Rao et al., 2017). Since fund flows are quarterly data, the paper uses quarterly average
economic policy uncertainty data. In robustness check, the paper also uses weighted
average index following Gulen and Ion (2016).
4.2.3 Control variables
Besides economic policy uncertainty, the paper adds control variables such as
fund size and return rate following in the literature. Fund size (fsize), the age of fund
(fage) and rate of fund fee (fee) are important factors for fund flows (Froot et al., 2001;
Nanda et al., 2004). The paper uses natural logarithm of total net fund value in the end
of quarter to measure fsize, number of years since established to measure fage, and
rate of management fee to measure fee. To avoid reverse causality, the model controls
lagged fsizet-1, faget-1, and feet-1. Fund return rate (rf) affects investors’ fund holding
(Ippolito, 1992; Sirri and Tufano, 1998) and the paper uses quarterly average return
rate to measure rf. The regression model controls lagged return rate rft-1. Due to
ambiguity aversion, Li et al. (2016) find that investors are sensitive to fund’s worst
performance so the regression model also controls minimum return rate in the last
four quarters (rfmint-4,t-1). To control fund’s idiosyncratic risk, we also control
variance of return rate in the last four quarters (rfvolt-4,t-1). According to Del Guercio
and Tkac (2008), rank of fund (frk) affects fund flow, and since number of funds
changes in each quarter, we use rank percentile to measure rank of fund and the lower
the percentile, the higher is the rank. We control lagged rank of fund (frkt-1) in the
regression model.
① http://www.policyuncertainty.com/china_monthly.html
Page 9
Table 1. Summary Statistics
Mean Std Median 75th percentile Minimum Maximum
pu 211.143 117.654 167.077 295.334 50.195 461.494
Δpu 19.171 73.812 11.705 65.660 -128.257 176.596
flow (%) 3.597 64.849 -4.101 6.052 -86.487 959.686
rf 0.007 0.128 -0.001 0.037 -1.994 0.810
rfmin -0.092 0.241 -0.034 -0.004 -4.127 2.093
rfvol 0.029 0.181 0.003 0.014 0.000 8.265
frkp 0.506 0.207 0.506 0.662 0.010 0.997
fsize 20.104 1.886 20.188 21.503 6.913 24.749
fage 3.469 2.899 2.500 5.000 0.000 15.250
fee (%) 1.247 0.541 1.220 1.750 0.300 4.300
Note. This table reports the summary statistics for the various variables from the
second quarter in 2004 to the fourth quarter in 2016.
Table 1 reports summary statistics for fund flows, economic policy uncertainty
and various control variables. The average of economic policy uncertainty in China is
211.143 and its change is 19.171, which means that economic policy uncertainty
increases in the sample period. Specifically, before 2008 financial crises, the average
economic uncertainty is 75.889 but it quickly increases to 178.244 after 2008, which
implies that governments are more likely to make policies in recession time (Pastor
and Veronesi, 2012). The average and median of fund flows are 3.597% and -4.101%.
The average and median of return rate are 0.700% and -0.100%, which indicate that
the level of return rate for mutual fund is still low in China. The average fund age is
3.469 years, implying many funds are established in recent years.
5 Results
To study the relationship between economic policy uncertainty and financial
market participation, we empirically analyze fund flows from the second quarter in
2004 to the fourth quarter in 2016. We quantify the average impact of economic
policy uncertainty on fund flows and also explore the heterogeneous impacts. To
verify the theoretical assumptions, the regression model further considers impacts
from market risk and market ambiguity. Finally, the paper test robustness of the
results by changing regression estimation methods, adjusting economic policy
uncertainty calculation and testing with stock open data and household financial
survey data.
Page 10
5.1 Economic policy uncertainty and fund flows
Table 2 reports regression results for economic policy uncertainty on fund flows,
where the dependent variable is fund flows and main explanatory variable is
economic policy uncertainty.
Table 2. Regression of Economic Policy Uncertainty on Fund Flows
(1) (2) (3) (4)
Δput -0.055*** -0.039*** -0.042*** -0.042***
(0.008) (0.007) (0.009) (0.009)
flowt-1 0.075*** 0.074*** 0.028
(0.019) (0.019) (0.019)
rft-1 -4.616 -4.268
(7.514) (7.516)
rfmint-4,t-1 -6.066 -7.065
(4.505) (6.210)
rfvolt-4,t-1 1.230 -4.449
(4.727) (4.651)
frkt-1 -23.584*** -23.004***
(3.298) (3.583)
fsizet-1 -3.220*** -21.164***
(0.479) (1.802)
faget-1 -0.285 -2.483***
(0.194) (0.422)
feet-1 1.901*
(1.141)
Fund FE NO NO NO YES
Constant 4.654*** 3.478*** 78.550*** 449.096***
(0.717) (0.607) (9.801) (35.372)
Observations 9,980 9,179 9,095 9,095
R2 0.004 0.008 0.026 0.175
Note. Robust standard errors clustered in funds reported in parenthesis.
***p<0.01, **p<0.05, and *p<0.1, respectively. Since the rate of fee
does not change in time, the regression controlling fund fixed effect does
not have that variable.
Columns (1) to (4) add control variables such as fund return rate and rank step by
step to control influences from other variables. From Table 2, we can find that the
increase of economic policy uncertainty changes could significantly decrease fund
flows and the results remain consistent after adding various variables. Specifically,
the coefficient estimates of Δpu in Columns (1) to (4) are -0.055, -0.039, -0.042 and -
Page 11
0.042 separately, and all coefficients are significant at the 1% level. Take Column (4)
as an example, every 10 units increase in economic policy uncertainty changes will
lead to 0.420% decrease in fund flows, which equals 11.676% of average fund flows
data (3.597%), which is significant both statistically and economically. The results
show that economic policy uncertainty could decrease fund flows and the relationship
remains robust after adding various control variables.
About the other control variables, the paper finds consistent results with the
literature. The coefficient estimation of lagged fund flows is positive, which is
consistent with Antoniou (2015). Interestingly, return rate is negatively correlated
with fund flows but this is “reverse selection” behavior (that investors sell funds with
high return rate) in China (Lu et al., 2007). The worst performance decreases fund
flows and its impact exceeds return rate, which is consistent with ambiguity aversion
found in Li et al. (2016). The volatility of fund return decreases fund flows, which
coincides with theoretical predication. Consistent with Sirri and Tufano (1998), the
higher the rank of return rate, the higher is the fund flows. Higher rate of fund fee
leads to higher fund flows, and possible explanation is that the rate of fee could be a
signal as mutual fund managers’ ability (Golec, 1996). However, since the paper only
has cross-sectional rate of fee, the results need further exploration.
5.2 Heterogeneous impacts of economic policy uncertainty
Due to different sensitivity of invested assets, economic policy uncertainty could
have heterogeneous impacts for equity funds with different investment styles. The
investment styles of equity funds include sixteen types such as “aggressive growth”,
“growth and income” and “income” in China. Following Anderson et al. (2009) and
Antoniou et al. (2012), the paper classifies equity funds into four investment styles:
“aggressive growth”, “growth”, “growth and income” and “income”. According to
CSMAR, “aggressive growth” and “growth” funds mainly invest in potential high-
growth stocks to get capital gains, which is both risky and high-yield; “growth and
income” and “income” funds are relatively conservative and mainly invest in stocks
with stable values and dividends. High-growth stocks are usually risky and easy to be
affected by economic policy so “aggressive growth” and “growth” funds are more
likely to be affected by economic policy uncertainty. Stable and high dividend stocks
are less sensitive to policy changes so “growth and income” and “income” funds
should be affected relatively less severe.
Page 12
Table 3. Regression of economic policy uncertainty on equity funds with different
investment styles
“Aggressive growth” “Growth” “Growth and Income” “Income”
(1) (2) (3) (4)
Δput -0.077** -0.043*** -0.027 -0.013
(0.028) (0.010) (0.017) (0.059)
flowt-1 -0.041 0.008 0.154** 0.081
(0.036) (0.021) (0.060) (0.052)
rft-1 68.966 -8.093 -11.503 -8.945
(53.472) (8.262) (15.342) (24.603)
rfmint-4,t-1 -8.493 -7.356 10.929 46.932
(27.205) (6.710) (18.441) (29.914)
rfvolt-4,t-1 113.269 -7.968 115.723** 101.086**
(78.138) (4.880) (51.833) (39.717)
frkt-1 1.983 -22.300*** -32.202*** -44.411*
(17.167) (3.769) (9.340) (23.574)
fsizet-1 -25.042*** -21.853*** -15.029*** -43.604***
(5.777) (2.372) (2.657) (8.986)
faget-1 -3.933** -2.903*** -1.048 -4.018***
(1.401) (0.554) (0.773) (1.473)
Fund FE YES YES YES YES
Constant 868.609*** 463.615*** 278.293*** 992.950***
(88.987) (46.637) (50.197) (202.395)
Observations 572 6,576 1,573 374
R2 0.169 0.197 0.122 0.240
Note. The same with Table 2.
Table 3 reports heterogeneous impacts of economic policy uncertainty for four
types of equity funds. In general, economic policy uncertainty changes decrease fund
flows for all four kinds of equity funds, and the impacts are more severe for
“aggregate growth” and “growth” equity funds. Specifically, the coefficient estimates
for Δpu are -0.077, -0.043, -0.027 and -0.013 separately. While the former two
estimates for “aggressive growth” and “growth” equity funds are negatively
significant at the 5% level, the latter two estimates for “growth and income” and
“income” mutual funds are not significant. These results show that “aggregate
growth” and “growth” equity funds with more aggressive investment styles suffer
more when economic policy uncertainty increases. Therefore, in the period when
policy uncertainty quickly increases, fund manger should invest more stable stocks to
avoid negative fund flows.
Due to differences in information acquisition, risk aversion and ambiguity
aversion, economic policy uncertainty should have heterogeneous impacts on retail
investors and institutional investors. Unlike financial market in developed countries,
Page 13
there are more retail investors than institutional investors in China so it is important to
explore behavioral differences between two types of investors. In our sample, the
median of proportion of retail investors is 78.242% so the paper defines “retail funds”
as the proportion of retail investors exceeds 80% and all other funds as “institutional
funds”. Columns (1) and (2) in Table 4 reports regression results for the two types of
equity funds. The regression follows model (5) and does not report coefficient results
for control variables for simplicity. From the Table 4, we can find that retail and
institutional fund flows are both negatively affected by economic policy uncertainty,
and more importantly, the coefficient estimation of Δput is about twice of retail funds
than institutional funds. This implies that, when facing policy uncertainty, retail
investors are more likely to reduce investment in equity funds and lead to negative
fund flows.
Table 4. Regression results for investor heterogeneity and cyclical differences
Retail Funds Institutional Funds 2004~2007 2008~2016
(1) (2) (3) (4)
Δput -0.060*** -0.030** 0.252 -0.032***
(0.011) (0.012) (0.214) (0.008)
Control YES YES YES YES
Fund FE YES YES YES YES
Constant 428.419*** 531.221*** 282.521 504.853***
(44.147) (52.925) (174.538) (45.438)
Observations 4,199 4,896 460 8,635
R2 0.211 0.159 0.207 0.213
Notes. Control variables include flowt-1, rft-1, rfmint-4,t-1, rfvolt-4,t-1, frkt-1, fsizet-1 and
faget-1. Robust standard errors clustered in funds reported in parenthesis. ***p<0.01,
**p<0.05, and *p<0.1, respectively.
According to Pastor and Veronesi (2012), governments are more likely to make
policies to stable economic growth in recession period, which increases policy
uncertainty. After financial crises in 2018, the Chinese government implements
multiple economic policies, including four-trillion economic stimulus plan and
economic policy uncertainty increases from 75.889 before 2008 to 178.244 thereafter.
To test cyclical differences of economic policy uncertainty, Columns (3) and (4)
report regression results in sub-samples 2004 to 2007 and 2008 to 2016. We can find
that before 2008, economic policy uncertainty has no significant impact on fund flows,
but after 2008, economic policy uncertainty significantly decreases fund flows. In
recession period, economic policy uncertainty increases quickly and investors may be
Page 14
more sensitive to policy changes. The results imply that governments should take
negative impacts on investors into consideration during policy making.
5.3 Economic policy uncertainty and structural shift in asset allocation
Economic policy uncertainty could affect investors’ choices among different
kinds of assets, and the paper studies fund flows in non-equity funds to test investors’
structural shift in asset allocation. The paper explores the impacts of economic policy
uncertainty on hybrid, bond and money market funds. Bond and money market funds
mainly invest in Treasury and financial debts, which are low-risk and have stable
returns, while hybrid funds invest both in stocks, bonds and money markets. Hence
the sensitivity to economic policy uncertainty should be ranked as equity, hybrid,
bond and money market funds.
Table 5. Economic policy uncertainty and structural changes of asset allocation
Hybrid Bond Money Market
(1) (2) (3)
Δput -0.023** 0.070*** 0.047*
(0.007) (0.016) (0.022)
Control YES YES YES
Fund FE YES YES YES
Constant 502.242*** 486.774*** 792.236***
(29.809) (30.717) (73.886)
Observations 18,534 12,203 5,117
R2 0.189 0.152 0.178
Notes. Control variables include flowt-1, rft-1, rfmint-4,t-1, rfvolt-4,t-1, frkt-1, fsizet-1 and
faget-1. Robust standard errors clustered in funds reported in parenthesis. ***p<0.01,
**p<0.05, and *p<0.1, respectively.
Table 5 reports regression results for latter three types of non-equity funds. The
coefficient estimations for Δpu is -0.023, 0.070 and 0.047 separately, and the former
two are significant at the 5% level, while the last one is significant at the 10% level.
From the regression results, we can find that economic policy uncertainty could
significantly decrease fund flows into equity and hybrid funds, but increase flows into
bond and money market funds. The paper studies possible structural changes of
investors’ asset allocation in aggregate level and it would be interesting to explore this
question in more detailed data.
5.4 Economic policy uncertainty, market risk and market ambiguity
In theoretical model, the paper assumes that economic policy uncertainty could
affect investors’ behavior by financial market risk and market ambiguity. To verify
the mechanism, we at first test the relationship between economic policy uncertainty
Page 15
and market risk and ambiguity, and then control these two factors in the regression.
For the market risk (mrisk), we use standard deviation of stock market returns as
measurement following Antoniou (2015). For the market ambiguity (mamb),
according to Ellsberg (1961), one possible method is to measure degree of opinion
differences in the financial market and we use degree of equity analysts’ ranking
differences to measure ambiguity. Equity analysts would publish stock ranks regularly
and the standardized ranks include: buy, overweight, neutral, underweight, and sell.
We normalize the ranks as 2, 1, 0, -1 and -2. Following Anderson et al. (2009), we use
beta-weighted dispersion to measure ambiguity for a single stock (amb) and get
market ambiguity with cap-weighted ambiguity (mamb).
In quarter t, fit represents the number of ranks from equity analysts, xijt is analyst
i’s rank for stock i. After sorting stock i’s ranks from high to low, the weight for kth
rank is:
Wijt (v) =kv-1( fit +1- k)v-1
k v-1( fit +1-m)v-1
m=1
fit
å (7)
where v describes the shape of the weighted function. When v=1, the ranks are
equally weighted and when v increases, less weight is given to extreme ranks.
According to Anderson et al. (2009), we choose v=15.346. Ambiguity for single stock
i is:
ambit = Wijt
j=1
fit
å [xijt+1|t - Wimt (v)ximt+1|t
m=1
fit
å ]2 (8)
After calculating ambit for each stock, we get market ambiguity mambt with cap-
weighted average stock ambiguity in quarter t.
Columns (1) and (2) in Table 6 report time series regression for economic policy
uncertainty and market risk and ambiguity. To keep consistency, we use changes
instead of levels. From the regression results, we can find that when economic policy
increases, both market risk and market ambiguity significantly increase, which
verifies our assumption in theoretical model. Columns (3) and (4) report regression
results after controlling market risk and market ambiguity. Regression results show
that both market risk and market ambiguity could significantly decrease fund flows,
and more importantly, the coefficient estimation of Δput decreases after adding the
two variables. The results show that economic policy uncertainty could affect fund
flows by market risk and market ambiguity. Moreover, even after controlling these
two variables, economic policy uncertainty still affects fund flows. Our conjecture is
Page 16
that economic might affect investors in many other channels, such as sentiment. The
mechanism is worth of further study.
Table 6. Economic policy, market risk and market ambiguity
Δmriskt Δmambt
flowt flowt flowt
(1) (2)
(3) (4) (5)
Δput 0.004** 0.022**
-0.034*** -0.028*** -0.023**
(0.002) (0.009)
(0.011) (0.007) (0.010)
Δmriskt -1.648*
-0.920
(0.967)
(1.090)
Δmambt -1.172*** -1.028***
(0.267) (0.309)
Control NO NO YES YES YES
Fund FE NO NO YES YES YES
Constant -0.292** -0.175 443.075*** 427.806*** 424.615***
(0.110) (0.434)
(36.880) (34.747) (36.639)
Observations 51 51
9,095 9,095 9,095
R2 0.088 0.702
0.176 0.185 0.185
Notes. Time series regressions in Column (1) and (2). Control variables include flowt-1,
rft-1, rfmint-4,t-1, rfvolt-4,t-1, frkt-1, fsizet-1 and faget-1. Robust standard errors clustered in
funds reported in parenthesis. ***p<0.01, **p<0.05, and *p<0.1, respectively.
5.5 Robustness check
To verify robustness of our results, the paper firstly uses System GMM (GMM-
SYS) to re-estimate the regression model (5). Besides, the paper also re-analyzes the
results by adjusting calculation method of economic policy uncertainty. Finally, to
further verify the relationship between economic policy uncertainty and investors’
financial market participation, the paper also explores the impacts of economic policy
uncertainty on new stock accounts and household stock market participation.
Considering influences of endogeneity and error term autocorrelation for panel
data, we firstly re-estimate our results by GMM-SYS. Table 7 reports regression
results from GMM-SYS. Column (1) reports full sample results, and Columns (2) to
(4) report regression results for subsamples with four investment styles. At the 5%
level of significance, AR test shows that model is of first-order autocorrelation but not
second-order autocorrelation. Sargen tests show that the moment conditions hold.
From coefficient estimation of Δput, we can find that economic policy changes could
significantly decrease fund flows and the negative impacts are more severe to
“aggressive growth” and “growth” funds than to “growth and income” and “income”
funds. These results are consistent with our previous findings.
Table 7. Economic policy uncertainty and fund flows: GMM-SYS estimation
Page 17
Full Sample “Aggressive growth” “Growth” “Growth and Income” “Income”
(1) (2) (3) (4) (5)
Δput -0.048*** -0.063* -0.050*** -0.046 -0.047
(0.000) (0.034) (0.000) (0.109) (0.046)
Control YES YES YES YES YES
Fund FE YES YES YES YES YES
Constant 0.533** 425.485 68.293*** 530.615 542.872**
(0.269) (485.598) (0.596) (528.068) (218.300)
Observations 9,095 572 6,576 1,573 374
Sargen test 39.694 14.101 359.488 68.122 39.694
(1.000) (1.000) (0.994) (1.000) (1.000)
AR(1) test -1.737 -1.921 -6.624 -1.899 -1.709
(0.082) (0.055) (0.000) (0.058) (0.087)
AR(2) test -0.076 -1.557 -0.558 -0.388 -0.064
(0.940) (0.119) (0.577) (0.698) (0.949)
Notes. P-values in parenthesis for Sargen test and AR test. Control variables include
flowt-1, rft-1, rfmint-4,t-1, rfvolt-4,t-1, frkt-1, fsizet-1 and faget-1. Robust standard errors
clustered in funds reported in parenthesis. ***p<0.01, **p<0.05, and *p<0.1,
respectively.
Secondly, referring to Gulen and Ion (2016), we adjust the calculation of
quarterly economic policy uncertainty and set weight of each month with the quarter
as 1/6, 1/3 and 1/2, and calculate the weighted economic policy uncertainty wtpu.
Table 8 reports the regression results and Δwtput is the weighted economic policy
changes. The estimation results in Table 7 are also consistent with our main
conclusions, which again verifies our results’ robustness.
Table 7. Regression of weighted economic policy uncertainty and fund flows
Full Sample “Aggressive growth” “Growth” “Growth and income” “Income”
(1) (2) (3) (4) (5)
Δwtput -0.048*** -0.078*** -0.049*** -0.035** -0.016
(0.007) (0.022) (0.008) (0.014) (0.044)
Control YES YES YES YES YES
Fund FE YES YES YES YES YES
Constant 448.090*** 874.431*** 462.624*** 277.487*** 990.595***
(35.231) (89.636) (46.435) (50.029) (200.440)
Observations 9,095 572 6,576 1,573 374
R2 0.177 0.170 0.199 0.123 0.241
Notes. Control variables include flowt-1, rft-1, rfmint-4,t-1, rfvolt-4,t-1, frkt-1, fsizet-1 and
faget-1. Robust standard errors clustered in funds reported in parenthesis. ***p<0.01,
**p<0.05, and *p<0.1, respectively.
Finally, to further verify the impacts of economic policy uncertainty on
investors’ financial market participation, the paper explores its impacts on new stock
accounts and household stock market participation. Stock new account data is from
CSMAR and the data stops to update after the second quarter in 2015. Column (1) in
Page 18
Table 8 reports the regression results. The control variables in Column (1) include
lagged new stock accounts, stock market risk and return rate. The result shows that
economic policy could decrease new stock accounts. However, the coefficient
estimate is not significant. Household stock market participation data comes from
Chinese Family Panel data in 2010, 2011, 2012 and 2014. Since stock participation is
a dummy variable, we use level of economic uncertainty instead of changes in the
regression. Column (2) in Table 8 reports Probit regression result. The control
variables include household income, household size, household head’s gender, age
and education. The result shows that economic policy uncertainty could significantly
decrease the household likelihood to participate in stock market. These results further
verify the robustness of our results.
Table 8. Regression of economic policy and new stock account and household stock
market participation
New Stock Account Household Stock Market Participation
(1) (2)
Δput -1.119
(1.359)
put
-0.001***
(0.000)
Control YES YES
Constant 270.450 -7.269***
(256.974) (0.217)
Observations 44 21,771
(Pseudo) R2 0.503 0.171
Note. (1) is OLS regression and (2) is Probit regression. Robustness errors
reported in parenthesis. ***p<0.01, **p<0.05, and *p<0.1, respectively.
6 Conclusion
The paper studies the impacts of economic policy uncertainty on investor
financial market participation. Theoretical results show that economic policy
uncertainty could affect investor behaviors by financial market risk and ambiguity.
With fund flow data, empirical analyses show that economic policy uncertainty could
significantly decrease fund flows and the result is robust after adding various controls.
Besides, economic policy uncertainty has heterogenous impacts: “aggressive growth”
and “growth” funds suffer more than “growth and income” and “income funds”; retail
funds suffer more than institutional funds. And interestingly, investors will shift to
invest in low-risk and stable assets such as bond and money market funds when
economic policy uncertainty increases. Moreover, the paper further verifies the main
Page 19
results using new stock account and household financial survey data. Policy
uncertainty could restrain financial market participation and even leads to
systematically market risk. For governments, these results imply that when making
policies, the government should fully consider the negative effects of policy
uncertainty and stabilize policy implementation. The results also have implication for
fund managers: when economic policy uncertainty increases, fund managers should
adjust investment strategy to avoid massive negative fund flows.
References:
Anderson E. W., Ghysels, E. and Juergens, J. L. (2009). The Impact of Risk and
Uncertainty on Expected Returns. Journal of Financial Economics, 94(2), 233-263.
Antoniou C., Harris, R. D. and Zhang, R. (2015). Ambiguity Aversion and Stock
Market Participation: An Empirical Analysis. Journal of Banking & Finance, 58,
57-70.
Baker S. R., Bloom, N., and Davis, S. J. (2016). Measuring Economic Policy
Uncertainty. The Quarterly Journal of Economics, 131(4), 1593-1636.
Baker, S. R., Bloom, N., Davis S. J. and Wang X. (2013). A Measure of Economic
Policy Uncertainty for China. Working Paper.
Barber, B. M. and Odean, T. (2008). All That Glitters: The Effect of Attention and
News on the Buying Behavior of Individual and Institutional Investors. Review of
Financial Studies, 21(2), 785-818.
Basak, S. and Cuoco, D. (1998). An Equilibrium Model with Restricted Stock Market
Participation. Review of Financial Studies, 11(2), 309-341.
Ben-Rephael, A., Kandel, S. and Wohl, A. (2012). Measuring Investor Sentiment with
Mutual Fund Flows. Journal of Financial Economics, 104(2), 363-382.
Bossaerts, P., Ghirardato, P., Guarnaschelli, S., and Zame, W. R. (2010). Ambiguity
in Asset Markets: Theory and Experiment. Review of Financial Studies, 23(4),
1325-1359.
Campbell, J. Y. (2006). Household Finance. The Journal of Finance, 61(4), 1553-
1604.
Cao, H. H., Wang, T. and Zhang H. H. (2005). Model Uncertainty, Limited Market
Participation, and Asset Prices. Review of Financial Studies, 18(4), 1219-1251.
Chen, Z. and Epstein, L. (2002). Ambiguity, Risk, and Asset Returns in Continuous
Time. Econometrica, 70(4), 1403-1443.
Del Guercio, D. and Tkac, P. A. (2008). Star Power: The Effect of Monrningstar
Ratings on Mutual Fund Flow. Journal of Financial and Quantitative
Analysis, 43(4), 907-936.
Dow, J. and da Costa Werlang, S. R. (1992). Uncertainty Aversion, Risk Aversion,
and the Optimal Choice of Portfolio. Econometrica, 197-204.
Ellsberg, D. (1961). Risk, Ambiguity, and the Savage Axioms. The Quarterly Journal
of Economics, 643-669.
Epstein, L. G. and Schneider, M. (2008). Ambiguity, Information Quality, and Asset
Pricing. The Journal of Finance, 63(1), 197-228.
Page 20
Froot, K. A., O’connell P. G. and Seasholes, M. S. (2001). The Portfolio Flows of
International Investors. Journal of Financial Economics, 59(2), 151-193.
Gilboa, I. and Schmeidler, D. (1989). Maxmin Expected Utility with Non-unique
prior. Journal of Mathematical Economics, 18(2), 141-153.
Golec, J. H. (1996). The Effects of Mutual Fund Managers’ Characteristics on Their
Portfolio Performance, Risk and Fees. Financial Services Review, 5(2), 133-147.
Guiso, L. and Paiella, M. (2008). Risk Aversion, Wealth, and Background Risk.
Journal of the European Economic Association, 6(6), 1109-1150.
Gulen, H. and Ion, M. (2016). Policy Uncertainty and Corporate Investment. Review
of Financial Studies, 29(3), 523-564.
Ippolito, R. A. (1992). Consumer Reaction to Measures of Poor Quality: Evidence
from the Mutual Fund Industry. The Journal of Law and Economics, 35(1), 45-70.
Ivkovic, Z. and Weisbenner, S. (2009). Individual Investor Mutual Fund Flows.
Journal of Financial Economics, 92(2), 223-237.
Jain, P. C. and Wu, J. S. (2000). Truth in Mutual Fund Advertising: Evidence on
Future Performance and Fund Flows. The Journal of Finance, 55(2), 937-958.
Julio, B. and Yook, Y. (2012). Political Uncertainty and Corporate Investment Cycles.
The Journal of Finance, 67(1), 45-83.
Kochar, A. (1995). Explaining Household Vulnerability to Idiosyncratic Income
Shocks. The American Economic Review, 85(2), 159-164.
Li, C. W., Tiwari A., and Tong, L. (2016). Investment Decisions Under Ambiguity:
Evidence from Mutual Fund Investor Behavior. Management Science, Forthcoming.
Lu, R., Chen, B. Z., Xu, L. B., and Xie, X. H. (2007). Fund Performance and Investor
Choices. Economic Research Journal, (6), 39-50. (In Chinese)
Mankiw, N. G. and Zeldes, S. P. (1991). The Consumption of Stockholders and
Nonstockholders. Journal of financial Economics, 29(1), 97-112.
Nanda, V., Wang, Z. J. and Zheng, L. (2004). Family Values and the Star
Phenomenon: Strategies of Mutual Fund Families. Review of Financial Studies,
667-698.
Pastor, L. and Veronesi, P. (2012). Uncertainty about Government Policy and Stock
Prices. The Journal of Finance, 67(4), 1219-1264.
Potamites, E. and Zhang, B. (2012). Heterogeneous Ambiguity Attitudes: A Field
Experiment among Small-scale Stock Investors in China. Review of Economic
Design, 1-21.
Rao, P. G., Yue, H., and Jiang, G. H. (2017). Economic Policy Uncertainty and
Firm’s Investment. The Journal of World Economy, (2), 27-51. (In Chinese)
Sirri, E. R. and Tufano, P. (1998). Costly Search and Mutual Fund Flows. The Journal
of Finance, 53(5), 1589-1622.
Stock, J. H. and Watson, M. W. (2012). Disentangling the Channels of the 2007-2009
Recession. NBER Working Paper, No. 18094.
Wang, Y., Chen C. R. and Huang, Y. S. (2014). Economic Policy Uncertainty and
Corporate Investment: Evidence from China. Pacific-Basin Finance Journal, 26,
227-243.
Yang, H. S., Chen, S. L., Luo, D. L., and She, G. M. (2014) Between the Policy
Instability and the Economic Growth: The Empirical Evidence from China’s
Change in her Local Officers. Management World, (9), 13-28. (In Chinese)