Economics 125 -,Economics of Population Growth, Spring 2005 Time, Location Instructor Office Location Office Hours Email Teaching Assistant TuTh 5:00 pm - 6:20 pm, Petersen Hall, Room 103 Jeff Tayman Economics Building, Room 11OA TuTh 6:30 pm - 7:30pm [email protected]Jason Shafrin Course Purpose: This course is designed to teach you the foundations of demographic analysis and fo~ecasting. You will learn the terminology, analytical tools, major forecasting methods (trend extrapolation, cohort-component, and economic-demographic models), and practical guidance needed to create, evaluate, interpret, and use forecasts. We will also cover fundamental demographic concepts such as population size, distribution, composition, and components of change (fertility, mortality, and migration), relationships between economic and demographic processes, and conclude with some new directions in forecasting. Prerequisites: Economics 120 A-B-C. Economics 178 is recommended,. Required Reading: Stanley K. Smith, Jeff Tayman, & David A. Swanson (2001). State and Local Population Projections: Methodology and Analysis. New York, Kluwer AcademiclPlenum Publishers, and articles/Internet links on electronic reserve. You are expected to read the assigned material prior to lecture and bring the book to class. This is an upper division course, which means you have greater responsibility for thinking beyond the assigned material and asking meaningful questions, as oppose to copying notes. Assignments: You are required to complete 8 assignments. Assignments are to be handed in at the beginning of class. I will not accept late assignments. All assignments should be done with an electronic spreadsheet (Microsoft Excel is available in the computer lab). Tables and graphs for the assignments should be properly labeled and easy to follow (e.g., do not split a table or figure over multiple pages). Research Paper: You are required to write a paper of no more than five double-spaced typewritten pages, plus references, figures, and tables. This paper is due on May 30. I will not accept a late paper. Exams: There will be an in-class exam on April 21 and an in-class final exam on June 8. The final exam will only include material covered after the first exam. I will give no late examinations without a compelling and fully documented medical excuse and will not offer an alternative date/time for the final exam. Grading: A student can earn a maximum of 350 points as follows: Assignments (100 points or 28.6%), first exam (60 points or 17.1%), final exam (120 points or 34.3%), and research paper (70 points or 20.0%). I do not grade on a strict curve, but you will receive no lower than an (A-) with 315 points; no lower than a (B-) with 280 points; no lower than a (C-) with 245 points; and no lower than a (D) with 210 points. Depending on the distribution of class scores, the final breakpoints may fall below those indicated. - --
Transcript
Economics 125 -,Economics of Population Growth, Spring 2005
Time, LocationInstructorOffice LocationOffice HoursEmail
Course Purpose: This course is designed to teach you the foundations of demographic analysis andfo~ecasting. You will learn the terminology, analytical tools, major forecasting methods (trendextrapolation, cohort-component, and economic-demographic models), and practical guidanceneeded to create, evaluate, interpret, and use forecasts. We will also cover fundamentaldemographic concepts such as population size, distribution, composition, and components ofchange (fertility, mortality, and migration), relationships between economic and demographicprocesses, and conclude with some new directions in forecasting.
Prerequisites: Economics 120 A-B-C. Economics 178 is recommended,.
Required Reading: Stanley K. Smith, Jeff Tayman, & David A. Swanson (2001). State and LocalPopulation Projections: Methodology and Analysis. New York, Kluwer AcademiclPlenumPublishers, and articles/Internet links on electronic reserve.
You are expected to read the assigned material prior to lecture and bring the book to class. This isan upper division course, which means you have greater responsibility for thinking beyond theassigned material and asking meaningful questions, as oppose to copying notes.
Assignments: You are required to complete 8 assignments. Assignments are to be handed in at thebeginning of class. I will not accept late assignments. All assignments should be done with anelectronic spreadsheet (Microsoft Excel is available in the computer lab). Tables and graphs for theassignments should be properly labeled and easy to follow (e.g., do not split a table or figure overmultiple pages).
Research Paper: You are required to write a paper of no more than five double-spaced typewrittenpages, plus references, figures, and tables. This paper is due on May 30. I will not accept a latepaper.
Exams: There will be an in-class exam on April 21 and an in-class final exam on June 8. The finalexam will only include material covered after the first exam. I will give no late examinationswithout a compelling and fully documented medical excuse and will not offer an alternativedate/time for the final exam.
Grading: A student can earn a maximum of 350 points as follows: Assignments (100 points or28.6%), first exam (60 points or 17.1%), final exam (120 points or 34.3%), and research paper (70points or 20.0%). I do not grade on a strict curve, but you will receive no lower than an (A-) with315 points; no lower than a (B-) with 280 points; no lower than a (C-) with 245 points; and no lowerthan a (D) with 210 points. Depending on the distribution of class scores, the final breakpoints mayfall below those indicated.
- --
Course Schedule, Econ-125, Spring 2005
2
--- - - -- - - -
Date Topics Asshmment
March 29Course Overview
Chapter 1Introduction and Uses of Forecasts
March 31 Fundamentals of Population AnalysisChapter 2SANDAG Info (2002)Chapter 4
April 5 Mortality Rogers (1995); Fogel and Costa (1997)Asshnment 1 due (5 pts.)
April 7 FertilityChapter 5Demeny (1993); Easterlin (1978)
April 12 MigrationChapter 6, pp. 97-118Asshmment 2 due (15 pts.)
April 14 Migration Chapter 6, pp. 119-135
April 19 Finish Migration & Exam Review No Assignment
April 21 Exam
April 26 Cohort-Component Method Chapter 3; Chapter 7, pp. 137-151Assi2nment 3 due (15 pts.)
April 28 Cohort-Component Method Chapter 7, pp. 151-160
May 3 Trend ExtrapolationChapter 8, pp. 161-175Assi2nment 4 due (20 pts.)
May 5 Trend Extrapolation Chapter 8, pp. 176-183
Chapter 9, pp. 185-198May 10 Economic-Demographic Models Hunt(1993)
Assi2nment 5 due (13 pts.)May 12 No Class
May 17 Economic-Demographic Models Chapter 9, pp. 198-214Assi2nment 6 due (5 pts.)
May 19 Special Adjustments to Forecasts Chapter 11, pp. 239-258
Chapter12May 30 Evaluating Projections Assignment 8 due (15 pts.)
Research paper dueNew Directions in Forecasting
June 2 Social Security Discussion Chapter 15Final Exam Review
June 8 Final Exam 7:00 -10:00 p.m.
Assignments, Econ-125, Spring 2005
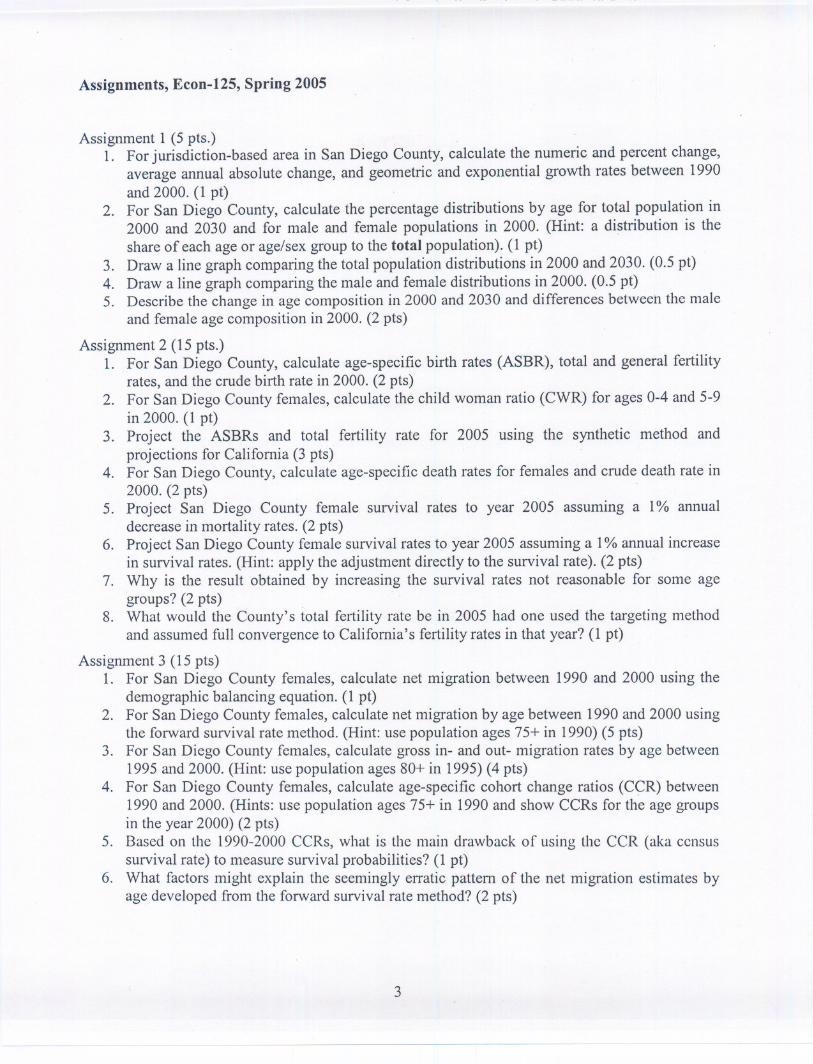
Assignment 1 (5 pts.)1. For jurisdiction-based area in San Diego County, calculate the numeric and percent change,
average annual absolute change, and geometric and exponential growth rates between 1990and2000.(1 pt) .
2. For San Diego County, calculate the percentage distributions by age for total population in2000 and 2030 and for male and female populations in 2000. (Hint: a distribution is theshare of each age or age/sex group to the total population). (1 pt)
3. Draw a line graph comparing the total population distributions in 2000 and 2030. (0.5 pt)4. Draw a line graph comparing the male and female distributions in 2000. (0.5 pt)5. Describethe changein age compositionin 2000and 2030and differencesbetweenthe male
and female age composition in 2000. (2 pts)
Assignment 2 (15 pts.)1. For San Diego County, calculate age-specific birth rates (ASBR), total and general fertility
rates, and the crude birth rate in 2000. (2 pts)2. For San Diego County females, calculate the child woman ratio (CWR) for ages 0-4 and 5-9
in 2000. (1 pt)3. Project the ASBRs and total fertility rate for 2005 using the synthetic method and
projections for California (3 pts)4. For San Diego County, calculate age-specific death rates for females and crude death rate in
2000. (2 pts)5. Project San Diego County female survival rates to year 2005 assuming a 1% annual
decrease in mortality rates. (2 pts)6. Project San Diego County female survival rates to year 2005 assuming a 1% annual increase
in survival rates. (Hint: apply the adjustment directly to the survival rate). (2 pts)7. Why is the result obtained by increasing the survival rates not reasonable for some age
groups? (2 pts) .
8. What would the County's total fertility rate be in 2005 had one used the targeting methodand assumed full convergence to California's fertility rates in that year? (1 pt)
Assignment 3 (15 pts)1. For San Diego County females, calculate net migration between 1990 and 2000 using the
demographic balancing equation. (1 pt)2. For San Diego County females, calculate net migration by age between 1990 and 2000 using
the forward survival rate method. (Hint: use population ages 75+ in 1990) (5 pts)3. For San Diego County females, calculate gross in- and out- migration rates by age between
1995 and 2000. (Hint: use population ages 80+ in 1995) (4 pts)4. For San Diego County females, calculate age-specific cohort change ratios (CCR) between
1990 and 2000. (Hints: use population ages 75+ in 1990 and show CCRs for the age groupsin the year 2000) (2 pts)
5. Based on the 1990-2000 CCRs, what is the main drawback of using the CCR (aka censussurvival rate) to measure survival probabilities? (1 pt)
6. What factors might explain the seemingly erratic pattern of the net migration estimates byage developed from the forward survival rate method? (2 pts)
3
-- - - --
HamIlton-perry {HP) methoa. {j ptS)
4. Explain the demographic reasons for the change in the total female population between 20002. Control the 1990 to 2000 female net migration estimates by age to the estimate for all
females derived by the demographic balancing equation, both from Assignment 3. (5 pts)3. What is the name of the method used to control the net migration estimates by age and why
did you select that particular method? (3 pts)"71 II. 1,. . ~1 r_ ...1_ . _ , 1 ___ ...1__ _1_°n. _1 _1__u_ _L:'
growth trend extrapolation methods? (2 pts)Assignment 8 (15 pts)1. Using the controlled population projections by jurisdiction-based area from Assignment 7,
calculate algebraic and absolute percentage errors .for each jurisdiction and trendextrapolation method. (2 pts)
2. Calculate the following summary measures of error for each trend extrapolation: MALPE,%Pos, MAPE, MEDAPE, and PRE (for the MAPE and MALPE using a naIve forecastderived by adjusting the 1990 census to the 2000 regional forecast). (Hint: only includeerrors for thejurisdiction-based areas in these summary measures.) (5 pts)
3. Using the summary measures of error, evaluate the precision, bias, utility, and shape of theerror distribution of the individual trend methods. Which method(s) do the best?(8 pts)
4
---
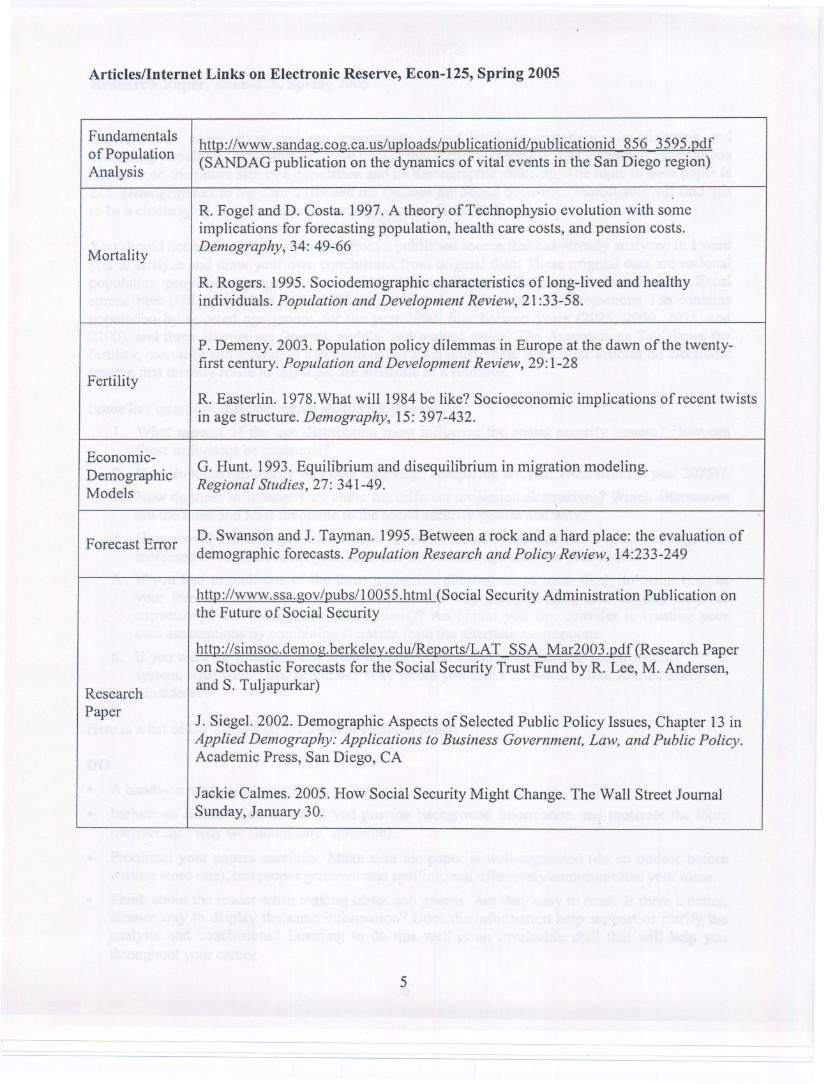
ArticleslInternet Links on Electronic Reserve, Econ-125, Spring 2005
Fundamentalsof PopulationAnalysis
Mortality
Fertility
Economic-DemographicModels
Forecast Error
ResearchPaper
http://www.sandag.cog.ca.us/uploads/publicationid/publicationid 856 3595.pdf(SANDAG publication on the dynamics of vital events in the San Diego region)
R. Fogel and D. Costa. 1997. A theory of Technophysio evolution with someimplications for forecasting population. health care costs. and pension costs.Demography. 34: 49-66
R. Rogers. 1995. Sociodemographic characteristics oflong-lived and healthyindividuals. Population and Development Review. 21:33-58.
P. Demeny. 2003. Population policy dilemmas in Europe at the dawn ofthe twenty-first century. Population and Development Review. 29:1-28
R. Easterlin. 1978.What will 1984be like? Socioeconomic implications of recent twistsin age structure. Demography. 15:397-432.
G. Hunt. 1993. Equilibrium and disequilibrium in migration modeling.Regional Studies. 27: 341-49.
D. Swanson and J. Tayman. 1995.Between a rock and a hard place: the evaluation ofdemographic forecasts. Population Research and Policy Review. 14:233-249
http://www.ssa.gov/pubs/10055.html (Social Security Administration Publication onthe Future of Social Security
http://simsoc.demog.berkelev.edu/Reports/LAT SSA Mar2003.pdf (Research Paperon Stochastic Forecasts for the Social Security Trust Fund by R. Lee. M. Andersen.and S. Tuljapurkar)
J. Siegel. 2002. Demographic Aspects of Selected Public Policy Issues. Chapter 13 inApplied Demography: Applications to Business Government, Law, and Public Policy.Academic Press. San Diego. CA
Jackie Calmes. 2005. How Social Security Might Change. The Wall Street JournalSunday. January 30.
5
- - --- --
Research Paper, Econ-125, Spring 2005
This research paper gives you the opportunity to get hands-on experience in analyzing andevaluating population projections and the impact that fertility, mortality, and migration assumptionscan have on the future size of a population and its demographic make-up. The topic of your paper isU.S. Demographics to the Year 2100 and the Outlookfor Social Security. I expect you will find thisto be a challenging and hopefully rewarding exercise. Good luck. .
You should not base your paper on data from a published source that has already analyzed it. I wantyou to analyze and draw your own conclusions from original data. These original data are nationalpopulation projections prepared by the U.S. Census Bureau. They are contained in an Excelspreadsheet (US_Projections_2025-2100.xls) on the class Web site. The Projections Tab containspopulation by selected age groups for the year 2000, four horizon years (2025, 2050, 2075, and2100), and three alternatives (lowest, middle, and highest series) The Assumptions Tab shows thefertility, mortality and migration assumptions for each alternative. Also, four articles on electronicreserve that directly relate to this topic are available as a resource. .
Some key questions that your paper should address are:
1. What aspects of the age distribution most influence the social security system? How canthese influences be measured?
2. How do these influences vary over time (e.g., comparing the year 2025 with the year 2075)?
3. How do these influences vary under the different projection alternatives? Which alternativesare the most and least favo~ableto the social security system and why?
4. How would the demographic outlook for social security change if the retirement age wasincreased to 72 years in the year 2025 and held at that age until the year 21OO?
5. If you had to pick one of the three projection alternatives as most likely to occur (i.e., asyour forecast), which one would you pick and why (Le. justifying total fertility rate, lifeexpectancy, and immigration assumptions)? An option you can consider is creating yourown assumptions by combining elements from the alternate assumptions.
6. If you were the president and could take only one action to address the social securitysystem, what would that action be? Why would you select it over the other actions beingconsidered?
Here is a list ofDo"s and Don't"s for your research paper:
DO
. A hands-on analysis of population projections
· Include an Introduction in which you provide background infonnation and motivate the topic(answcr thc "why wc should carc" qucstion).
· Proofread your papers carefully. Make sure the paper is well-organized (do an outline beforewriting word one), has proper grammar and spelling, and effectively communicates your ideas.
· Think about the reader when making tables and graphs. Are they easy to read? Is there a better,cleaner way to display the same infonnation? Does the infonnation help support or clarify theanalysis and conclusions? Learning to do this well is an invaluable skill that will help youthroughout your career.
6
. Label graphs completely. Give a title that answers what/where/when; label axes; provide alegend if necessary.
. Include a source at the bottom of all tables and graphs, telling where the data came from.
. Cite all data and references completely (for Websites, this means the complete URL, the date,the organization publishing it). Consult a style manual if you are not sure how to cite a source.
. Make sure you give your analysis the "common-sense" test. It is very possible to makecomputing mistakes that yield improbable results such as an elderly dependency ratio greaterthan 75.
DON'T
. Use data in an already analyzed paper. (You can cite data in a published paper, but it should notbe your main source of information.
. Write a boring paper.
. Wait until the last minute to start your paper.
· Plagiarize. I encourage you to collaborate with your classmates on this project, but the papermust be your own.


![Economics & Finance - 28th November 2017 - Curtin …newitems.library.curtin.edu.au/pdf/18.pdfEconomics & Finance - 28th November 2017 ... / a case study of paper bag makers: ... [Bingley],](https://static.documents.pub/doc/80x56/5aed499c7f8b9a3b2e9053b3/economics-finance-28th-november-2017-curtin-finance-28th-november-2017.jpg)
![Economics and the Wealth of Nations and Peopleassets.press.princeton.edu/chapters/p7610.pdfEconomics and the Wealth of Nations and People [Economics is the study of] human behavior](https://static.documents.pub/doc/80x56/5aa256877f8b9ac67a8cf496/economics-and-the-wealth-of-nations-and-and-the-wealth-of-nations-and-people-economics.jpg)
