19
ECONOMICS ASIA 2012 REVIEW 2013 OUTLOOK JANUARY 2013
| Date post: | 08-May-2015 |
| Category: |
Economy & Finance |
| Upload: | bloomberg-briefs |
| View: | 1,387 times |
| Download: | 1 times |

EconomicsAsiA
2012 Review2013 outlook
January 2013

Forecaster rankingsThe most accurate forecasters of major economic indicators. Page 3
orange BookComments from earnings calls on the global economy. Page 4
central Bank MonitorAn overview of global central banks. Page 5
Market indica-torsA look at global market indicators. Pages 6-7
econoMic Fun-daMentalsCharts on major economic indicators.
Pages 8-10
equity Valuation MapsForward price-to-earnings ratios for 40 MSCI indexes. Page 11
FX MarketsTop trading rules in predicting currency movements in 2012. Page 12
FiXed incoMeA summary of fixed-income markets. Page 13
coMModitiesA highlight of key movements in com-modity markets. Page 14
european deBt crisisA glance at the
region’s debt turmoil. Page 15
u.s. Fiscal cliFFA review of the budget agreement. Page 16
Bric slowdownAnalysis of the BRIC nations’ economies. Page 17
perspectiVesEconomists from HSBC, Deutsche Bank and Nomura on opportunities and risks in Asia in 2013. Page 18
Best oF BlooM-Berg econo-MistsTamara Hender-son and Michael McDonough present their best analysis. Page 19
contEnts globAl 2013 cAlEnDARclick on highlighted arrows for interactive features
montH Actions
JAn
ireland takes over presidency of the eu from Cyprus on Jan. 1.eCB interest rate announcement Jan. 10.Spain to sell bonds Jan. 10 and 17.Czech Republic presidential election on Jan. 11-12; run-off scheduled on Jan 25-26.German state election for lower Saxony on Jan. 20israel parliamentary elections will be held on Jan. 22.Jordan parliamentary elections will be held on Jan. 23.world economic Forum commences in Davos Jan. 23.First FoMC meeting of 2013 will be held on Jan. 29-30.
FEb
european Commission updates forecasts on Feb. 7.eu leaders’ summit on long term budget 2014-2020 from Feb. 7.eurogroup/ecofin meeting from Feb. 11.China welcomes the New Year, the Year of the Snake from Feb. 10-12.G20 finance ministers meeting from Feb. 14.ecuador general elections will be held on Feb. 17; run-off scheduled for Apr. 7.italian general elections will be held on Feb. 24-25.u.S. debt ceiling deadline to increase the $16.4 trillion limit on borrowing - Mid-February.
mAR
eurogroup/ecofin meeting from March 4.Pakistan general election due; National Assembly must be dissolved by March 18.China’s parliament holds annual session, appoints new president and prime minister.FoMC meeting, first economic projections - March 19-20.
APR
Malaysian parliamentary elections are due by April.Nepal will hold elections in April-May.FoMC’s two-day meeting will be held starting April 30.
mAY Madagascar presidential election will be held on May 8.Philippine general elections are due on May 13.
JUn
iran’s presidential election is scheduled for June 14.G8 leader summit from June 17.eurogroup/ecofin meeting commences June 21.tunisia general elections will be held on Jun. 23.Zimbabwe presidential election likely sometime after May.FoMC meeting, featuring updated economic projections, will be held June 18-19.
JUl
Croatia joins the european union on July 1.Cambodia parliamentary elections will be held on July 28.FoMC meeting will be held July 30-31.
AUg world Games 2013 will be held in Cali, Colombia from July 25 to Aug. 4.
sEPt
German general elections are due between Sept. 1 and oct. 27.Norway parliamentary election is scheduled for Sept. 9.FoMC meeting, featuring updated economic projections, will be held Sep. 17-18.
oct
Azerbaijan presidential election will be held in october.Georgia presidential election will be held in october.FoMC meeting will be held oct. 29-30.
noVChile presidential election is scheduled for Nov. 17.Australia federal elections must be held by Nov. 30.
DEc FoMC meeting, featuring updated economic projections, will be held Dec. 17-18.
Joseph Brusuelas [email protected] +1-212-617-7664
Richard Yamarone [email protected] +1-212-617-8737
Tamara Henderson [email protected] +65-6212-1140
Michael McDonough [email protected] +852-2977-6733
David Powell [email protected] +44-20-7073-3769
Niraj Shah [email protected] +44-20-7330-7383
Bloomberg Brief economics asia 2012 review/2013 outlook
newsletter executive editor
Ted Merz [email protected] +1-212-617-2309
Bloomberg news executive editor
Dan Moss [email protected] +1-202-624-1881
economics newsletter editors
Kevin Depew [email protected] +1-212-617-3131
Jennifer Rossa [email protected] +1-212-617-8074
Rob Williams [email protected] +1-212-617-8844
Nipa Piboontanasawat [email protected] +852-2977-6628
Scott Johnson [email protected] +852-2977-4702
Anthony Richardson [email protected] +852-2977-4673
Chris Kirkham [email protected] +44-20-7673-2464
To subscribe via the Bloomberg terminal type BRIEF <GO> or on the web at: www.bloombergbriefs.com
To contact the editors: [email protected]
This newsletter and its contents may not be forwarded or redistributed without the prior consent of Bloomberg. Please contact our reprints and permissions group listed above for more information
© 2013 Bloomberg LP. All rights reserved.
staff economists
Katie Porter [email protected] 212-617-6099
Ian Maready [email protected] 212-617-3761
Rose Marie Constantino [email protected] 212-617-4484
Pekka Aalto [email protected] +852-2977-6013
Andy Hodgson [email protected] +44-20-7392-0373
Steven Usher [email protected] +44-20-3525-8465
designers
Nick Ferris [email protected] 212-617-6975
[email protected] 212-617-6975
Lori Husted [email protected] 717-505-9701
newsletter Business Manager advertising reprints & permissions
1 2 3 4 5 6 7 8 9 10 11 12 13 14 15 16 17 18 19
01.04.13 www.bloombergbriefs.com Bloomberg Brief | Economics Asia 2

FoREcAstER RAnKings By BlooMBERg RANkINgS
top Forecasters of major Economies
RAnK FoREcAstER FiRm scoRE
1 Christophe Barraud Market Securities Paris 61.16
2 Joshua Shapiro Maria Fiorini Ramirez 58.39
3 Bernd weidensteiner/Christoph Balz Commerzbank 57.43
4 Rudolf Besch / Marina luetje DekaBank 57.37
5 Dean Maki Barclays 56.92
6 Christoph Schroeter Bayerische landesbank 56.91
7 Gregorio De Felice* intesa Sanpaolo 56.68
8 James o'Sullivan High Frequency economics 56.35
9 lou Crandall / Bill Jordan wrightson iCAP 56.08
10 David Greenlaw Morgan Stanley 55.89
u.s. economy
RAnK FoREcAstER FiRm scoRE
1 Junko Nishioka* RBS Securities Japan 61.10
2 Brendan Brown* Mitsubishi uFJ Securities 60.51
3 Yoshiki Shinke* Dai-ichi life Research institute 60.31
4 Masaaki kanno JPMorgan Securities Asia 58.32
5 Shen Jianguang* Mizuho Securities Asia 56.44
6 Naoki Murakami Monex 56.11
7 tomoru kakinuma Daiwa SB investments 55.83
8 Akiyoshi takumori Sumitomo Mitsui Asset Management 55.57
9 kyohei Morita Barclays 55.54
10 Hisashi Yamada* Japan Research institute 55.28
Japanese economy
RAnK FoREcAstER FiRm scoRE
1 Andreas Scheuerle / Peter leonhardt DekaBank 64.55
2 Jens kramer NordlB 63.43
3 Martin van vliet iNG Groep 63.32
4 ken wattret* BNP Paribas 63.04
5 laura Cavallaro Aletti Gestielle SGR 61.89
6 Gerd Hassel BHF-Bank 61.85
7 Daniel Hartmann* Bantleon Bank 61.58
8 Duncan Devries NiBC Bank 60.98
9 Frederik Ducrozet Credit Agricole 60.41
10 Sarah Hewin / thomas Costerg Standard Chartered 57.76
euro-Zone economy
RAnK FoREcAstER FiRm scoRE
1 Song Yu Goldman Sachs Group 65.44
2 Yao wei Societe Generale Asia 64.31
3 ting lu Bank of America Merrill lynch 59.78
4 Chang Jian Barclays 57.72
5 Yao Shaohua Hang Seng Bank 57.71
6 Chen Xingdong BNP Paribas Securities Asia 55.46
7 Stephen Green Standard Chartered 54.47
8 Connie tse Forecast 54.04
9 Mark williams Capital economics 53.62
10 Xie Dongming oversea-Chinese Banking 53.24
chinese economy
RAnK FoREcAstER FiRm scoRE
1 Adam Chester/David Page/Nikesh Sawjani lloyds Banking Group 60.10
2 Slavena Nazarova Credit Agricole 59.50
3 Brian Hilliard Societe Generale 59.08
4 Alan Clarke Scotiabank europe 56.45
5 Ross walker Royal Bank of Scotland 56.12
6 Philip Shaw/victoria Clarke investec Securities 56.08
7 Sarah Hewin Standard Chartered 56.05
8 Howard Archer iHS Global insight 56.04
9 Philip Rush Nomura international 55.87
10 Danielle Haralambous 4CASt 54.36
u.k. economy
METHoDology: To identify the top forecasters for these coun-tries and regions, we used estimates submitted to Bloomberg. We considered two years of data for monthly indicators, with a forecast minimum requirement of 15 out of 24 forecasts, a minimum of two consecutive forecasts within the last six months, and at least one forecast in the last three periods. For quarterly indicators such as gDP, we looked at two years of forecasts; to qualify, a forecaster had to have a minimum of five out of eight forecasts. For the last period, we used the most recent one for which data were available. Bloom-berg assigns a score between zero and 100 to economists reflecting the accuracy of their historical forecasts. Economists with lower fore-cast errors relative to other economists receive higher scores, and vice versa. Ranks are shown for the top 10 economists who meet inclusion rules — top 20 in the lists of best overall forecasters — or 20 percent of qualified economists, whichever is lower.
*Chief economist. Forecast submitted without attribution.
1 2 3 4 5 6 7 8 9 10 11 12 13 14 15 16 17 18 19
01.04.13 www.bloombergbriefs.com Bloomberg Brief | Economics Asia 3

oRAngE booK
corporate Executives Project U.s. Housing improvement, continued challenges in EuropeRicHARD YAmARonEBloomberg Economist
To see orange Book posTings on The BloomBerg Terminal Type ni orange-Book <go>
caterpillar [CAT] Earnings Call 10/22/12: “you can boil down what we’re thinking about 2013 to a short statement, and that goes both for economic environment and sales, and that statement is steady as she goes, not much change from 2012. As we look forward, on the positive side, in many countries around the world, monetary and credit policies have eased over the past year, and we do expect that to continue into 2013. However, economic growth has been slow to respond, and we’re not expecting any improvement in world economic growth until maybe the sec-ond half of 2013. And even then, for the full year, we’re only expecting economic growth for the world of about 2.7 percent, and that’s just a couple of tenths of a point above what we’re expecting for this year. In the developed world, we continue to expect growth at levels that are well below potential, at about 1.5 percent in total for the developed world, with about 2 percent growth in the U.S., and the euro zone close to 0 percent. We think Brazil will continue to improve some and that China’s growth rates will improve to about 8.5 percent.”
Honeywell [HoN] Earnings Call 10/19/12: “Turning to 2013, the clarity on the macro
side is still murky. There’s nothing out there to suggest anything but continued conservative planning at best.”
ge [gE] Earnings Call 10/19/12: “I think we’re kind of looking at 2013 being kind of like 2012, with the big variable being the fiscal cliff.”
Visa [V] Earnings Call 10/31/12: “The trends in the past two quarters suggest economic assumptions around 2013 were too optimistic. Many of the same uncertainties remain. As we look ahead into 2013, growing uncertainty in the U.S. and world economy has precipitat-ed a slowdown in domestic and cross-border spending.”
Marriott [MAR] Earnings Call 10/4/12: “In Europe, the big 2013 story will likely continue to be the economy as many countries struggle with sovereign debt burdens, austerity programs, and modest economic growth. We will also face tough comparisons to many 2012 special events including the olympics, the Euro Cup Championship, and a record-breaking 2012 fair schedule in germany.”
norfolk southern [NSC] Earnings Call 10/23/12: “looking ahead, we expect weaker overall fundamentals in most of our markets through the rest of the year and into the first half of 2013... [D]ramatic changes in the export coal market due to weaker demand for both met and steam coal into Europe and Asia will continue to present a challenging environment for export volume and export pricing.”
csX corp. [CSX] Earnings Call 10/17/12: “Domestic utility volumes are expected to face continued challenges due to lower natural gas prices, above-normal inven-tory levels, and environmental regulations. Headwinds should begin to moderate somewhat but will continue well into 2013.”
united technologies [UTX] Earnings Call 10/23/12: “We expect Europe to be essentially flat next year, and we expect the declines in the U.S. defense spending to continue, even without the impact of the potential sequestration. Bottom line is that we’re confident in our cost reduction and program execution and we have signifi-
cant operating leverage, should we see better than expected end market condi-tions. of course we still face some other significant headwinds in 2013.”
eaton corp. [ETN] Earnings Call 10/31/12: “[o]ur general view is that we will continue to see the U.S. in what we’re calling a gradual economic recovery, with a weaker early part of the year in 2013, and then some better activity in the second half. In Europe, we’re continuing to believe that we’ll see these soggy condi-tions through the first half of next year. And in Asia, I think maybe best typified by comments around the Chinese economy, we too are watching closely the sitting of the new government, what actions will re-ally happen post-Chinese New year.”
ppg industries [PPg] Earnings Call 10/18/12: “[R]ight now we haven’t seen a turnaround in Europe and we’re not expecting one as we move into 2013.”
weyerhaeuser [Wy] Earnings Call 10/26/12: “While today’s construction levels are still low by historic standards, all forecasts point to continued recovery in 2013, as we begin to return to long-term trend levels that are needed to house a growing number of U.S. households.”
MgM resorts [MgM] Earnings Call 10/31/12: “looking out into 2013, we’re very encouraged to see that convention bookings, our pace is up over 10 percent year-over-year with rate up. And although it’s early, 2014 pace is even stronger.”
Johnson controls [JCI] Earnings Call 10/30/12: “European economy will provide challenges across all of our businesses in 2013, while in Asia we expect slower growth, but we still see good growth, projecting that the weather patterns of last year do not repeat and that there will be a moderate improvement in North American aftermarket battery sales.”
Comments on the economic outlook for 2013 made in corporate conference calls indicate that expectations for a housing recovery in the U.S. are widespread. An improvement in China is also anticipated, while European economic activity is expected to be challenging and flat.
Most executives believe the U.S. recovery will continue, albeit with a pace of growth that is modest at best.
Caterpillar predicts global economic growth of 2.7 percent in 2013.
1 2 3 4 5 6 7 8 9 10 11 12 13 14 15 16 17 18 19
01.04.13 www.bloombergbriefs.com Bloomberg Brief | Economics Asia 4

cEntRAl bAnK monitoR By MICHAEl MCDoNoUgH, BlooMBERg ECoNoMIST
Policy Rate Ticker CountryNext Meets
PolicyRate
3M Chg
6M Chg
1YChg
CPIy/y
3MChg
CPI Target
Prior12M
Est. 1Q13
Est. 2Q13
Est. 3Q11
Est. 4Q13
APDR1T Curncy Argentina 10.45% 75 75 35 10.6%RBATCTR Index Australia 2/5 3.00% -50 -75 -150 2.0% 2.0-3.0 2.88% 2.75% 2.75% 2.75%BJIRONRR Index Bahrain 2.25% 0 0 0 1.9%BZSTSETA Index Brazil 1/16 7.25% -25 -125 -375 5.5% 4.5 +/-2 7.13% 7.13% 7.00% 7.25%BUBIRATE Index Bulgaria 1/31 0.03% 0 -13 -19 3.9%CABROVER Index Canada 1/23 1.00% 0 0 0 0.8% 2.0 +/-1 1.00% 1.00% 1.13% 1.13%CHOVCHOV Index Chile 1/18 5.00% 0 0 -25 2.1% 3.0 +/-1 5.00% 4.88% 4.88% 5.00%CHLR12M Index China 6.00% 0 -31 -56 2.0% 4.0P 6.00% 6.00% 6.00% 6.00%CORRRMIN Index Colombia 1/18 4.50% -25 -75 -25 2.8% 3.0 +/-1 4.50% 4.50% 4.63% 4.63%CKDRRATE Index Croatia 7.00% 0 0 0 4.4%CZBRREPO Index Czech Rep. 0.05% -20 -45 -70 2.7% 2.0 +/-1 0.13% 0.13% 0.25% 0.25%DEBRDISC Index Denmark 0.00% 0 -25 -75 2.3% 0.13% 0.25% 0.25% 0.13%EGBRLR Index Egypt 10.25% 0 0 0 4.3%EURR002W Index Euro zone 1/10 0.75% 0 -25 -25 2.2% <2.0 0.63% 0.63% 0.63% 0.63%HKBASE Index Hong Kong 0.50% 0 0 0 3.7%HBBRATE Index Hungary 5.75% -100 -125 -75 5.2% 3.0 5.63% 5.50% 5.50% 5.38%ICBRANN Index Iceland 2/6 6.00% 25 25 125 4.2% 6.00% 5.50% 5.50% 5.50%RSPOYLD Index India 7.00% 0 0 -50 9.6% 6.63% 6.50% 6.38% 6.50%IDBIRATE Index Indonesia 1/10 5.75% 0 0 -25 4.3% 4.5 +/-1 5.75% 5.75% 5.88% 6.00%ISBRATE Index Israel 1.75% -50 -50 -100 1.4% 1.0-3.0 1.88% 1.88% 1.88% 2.13%BOJDTR Index Japan 1/22 0.10% 0 0 0 -0.2% 1.0 0.10% 0.10% 0.10% 0.10%JORRRATE Index Jordan 4.75% 0 0 50 5.0%KIBODISC Index Kuwait 2.00% -50 -50 -50 2.1%LTRFREF Index Latvia 2.50% -100 -100 -100 1.6%LREPRR Index Lebanon 10.00% 0 0 0 10.2%MAOPRATE Index Malaysia 1/31 3.00% 0 0 0 1.3% 3.00% 3.13% 3.13% 3.13%MXONBR Index Mexico 1/18 4.50% 0 0 0 4.2% 3.0 +/-1 4.50% 4.50% 4.63% 4.63%MOBRRC Index Morocco 3/26 3.00% 0 0 -25 1.6%NZOCRS Index New Zealand 2.50% 0 0 0 0.8% 1.0-3.0 2.50% 2.63% 2.75% 3.00%NOBRDEP Index Norway 1.50% 0 0 -25 1.1% 2.5 1.50% 1.50% 1.63% 1.63%OCBOREPO Index Oman 1.00% 0 0 -100 3.2%PAPRSBP Index Pakistan 2/5 9.50% -100 -250 -250 7.9%PRRRONUS Index Peru 1/11 4.25% 0 0 0 2.7% 4.25% 4.25% 4.25% 4.25%PPCBON Index Philippines 1/24 3.50% -25 -50 -100 2.8% 4.0 +/-1 3.38% 3.38% 3.50% 3.63%PORERATE Index Poland 4.25% -50 -50 -25 2.8% 2.5 +/-1 3.75% 3.50% 3.50% 3.50%QAIRRR Index Qatar 4.50% 0 0 0 1.4%ROKEPOL Index Romania 5.25% 0 0 -75 4.6% 3.0 +/-1RREFRATE Index Russia 8.25% 0 25 25 6.6% 6.0-7.0 8.38% 8.25% 8.25% 8.00%SRREPO Index Saudi Arabia 2.00% 0 0 0 3.4%SIBCON Index Singapore 0.03% 1 0 1 3.6%SARPRT Index South Africa 1/24 5.00% 0 -50 -50 5.6% 3.0-6.0 4.88% 4.88% 4.88% 4.75%KORP7DR Index South Korea 1/11 2.75% -25 -50 -50 1.4% 2.0-4.0 2.63% 2.63% 2.75% 2.75%SWRRATEI Index Sweden 2/13 1.00% -25 -50 -100 -0.1% 2 1.00% 1.00% 1.00% 1.00%SZLTTR Index Switzerland 3/14 0.00% 0 0 0 -0.4% <2.0PTAREDSC Index Taiwan 3/21 1.88% 0 0 0 1.6% 1.88% 1.88% 2.00% 2.00%BTRR1DAY Index Thailand 1/9 2.75% -25 -25 -75 3.6% 0.5-3.0 2.63% 2.63% 2.75% 2.88%TUBR1WRA Index Turkey 1/22 5.50% -25 -25 6.2% 5.5 5.50% 5.50% 5.50% 5.25%CUAE1-7 Index U.A.E. 1.00% 0 0 0 0.5%UKRBDIS Index Ukraine 7.50% 0 0 -25 -0.2%UKBRBASE Index U.K. 1/10 0.50% 0 0 0 2.7% 2.0 0.50% 0.50% 0.50% 0.50%FDTR Index U.S. 1/31 0.25% 0 0 0 1.8% 1.5-2.0P 0.25% 0.25% 0.25% 0.25%VNBOLOAN Index Venezuela 16.24% -71 -60 -9 18.2%VNDIBASE Index Vietnam 9.00% 0 0 0 6.8%Source: Bloomberg
Bloomberg Brief Global Central Bank Monitor
Easing may continue on Europe, U.s., Japan concernsFor every increase in interest rates by central banks in 2012, policy makers cut rates 5 ½ times. global central banks are likely to maintain an easing bias going into 2013 on continued stress in Europe, uncertainty regarding the U.S. fiscal situation and worsening economic conditions in Japan. ongoing quantitative easing from group of Seven central banks will probably continue to help determine global economic condi-tions for the foreseeable future, especially as Japan’s new leaders may be preparing to expand the country’s program substantially to fight lingering deflation. of the 53 central banks surveyed, Brazil’s cut the most in 2012, with rates falling 375 basis points.
The people’s Bank of chi-na is likely to remain on hold for the foreseeable future as the government enacts targeted fiscal stimulus to support growth. The PBoC will probably continue to use aggressive open-market operations — especially reverse repurchase auctions — to manage financial sec-tor liquidity. A cut to reserve requirements is unlikely and may only occur with a signifi-cant, prolonged increase in interbank rates.
In 2012, the u.s. Federal reserve linked future policy to specific unemployment and inflation levels, in addi-tion to expanding quantitative easing. The U.S. unemploy-ment rate fell to 7.7 percent in November from a high of 10 percent in october 2009. The Fed has promised not to tighten while unemployment is above 6.5 percent. It’s un-clear how policy makers will account for a sharp decline in the labor participation rate, which may conceal actual unemployment levels.
Japan’s new government under Prime Minister Shinzo Abe is likely to place signifi-cant pressure on the Bank of Japan to double its inflation target to 2 percent, which would likely force the central bank to enlarge its asset pur-chase program substantially. Japan’s national CPI was minus 0.2 percent year-on-year in November, the sixth consecutive month of defla-tion. BoJ governor Masaaki Shirakawa’s five-year term ends on April 8.
1 2 3 4 5 6 7 8 9 10 11 12 13 14 15 16 17 18 19
01.04.13 www.bloombergbriefs.com Bloomberg Brief | Economics Asia 5

Net foreign investment into the Philippine stock market totaled $2.5 billion in 2012, helping drive a year-on-year rally of more than 30 percent. Relatively strong do-mestic fundamentals, coupled with upgrades of credit ratings from Moody’s Investors Service and Standard & Poor’s, helped push down the Philippine government’s 10-year borrowing cost to 4.4 percent.
Ukraine’s MSCI index was the leading laggard for non-European Union equities, dropping almost 50 percent partially due to a sharp slowdown in economic growth at the end of last year.
A last-minute agree-ment on the so-called fiscal cliff helped push U.S. equities up 16 percent year-on-year, while continued global risk aversion and central bank easing are helping keep U.S. yields at relatively low levels.
Newly elected Prime Minister shinzo abe’s plans to stoke Japan’s economy through fiscal and monetary stimulus may eventually place some upward pressure on Japan’s low borrowing costs.
A lull in the European debt crisis has led to declines in the 10-year yields of most countries in the region, which are trading at or near their 52-week lows.
led by Estonia and Belgium with their ad-vances of more than 35 percent, the euro zone’s MSCI equity indexes performed fairly well in the past year even as the recession continues. While german equi-ties were up almost 30 percent, Slovakia’s index was the leading laggard, losing about 11 percent.
ECONOMIC WORKBENCH:Have Our Data Make Your Point
mARKEt inDicAtoRs By MICHAEl MCDoNoUgH, BlooMBERg ECoNoMIST
YoY 52W Average 52W LAST YoY 52W Average 52W%Chg Min Last Max YIELD BPS Min Last Max
Asia/Pacific Asia/PacificMXAU Index Australia 962.4 15.7% 806 962 GACGB10 Index Australia 3.36% -47.6 2.8 4.3MXCN Index China 65.6 20.7% 52 66 GCNY10YR Index China 3.59% 15.0 3.2 3.6MXHK Index Hong Kong 11562.2 24.9% 9,042 11597 HKGG10Y Index Hong Kong 0.70% -80.9 0.5 1.6MXID Index Indonesia 5286.7 9.7% 4,264 5291 GIDN10YR Index Indonesia 5.17% -90.9 5.0 6.6MXIN Index India 778.4 26.3% 614 778 GIND10YR Index India 7.96% -38.7 8.0 8.8MXJP Index Japan 531.2 18.8% 427 539 GJGB10 Index Japan 0.79% -18.6 0.7 1.1MXKR Index Korea 587.1 9.5% 512 599 GVSK10YR Index Korea 3.13% -67.0 2.9 4.1MXMY Index Malaysia 598.7 7.8% 553 599 MGIY10Y Index Malaysia 3.48% -22.0 3.4 3.7MXPH Index Philippines 983.2 35.6% 734 983 PDSF10YR Index Philippines 4.40% -120.8 4.3 6.2MXSG Index Singapore 1707.3 19.0% 1,429 1707 MASB10Y Index Singapore 1.34% -29.0 1.3 1.8MXLK Index Sri Lanka 602.3 16.3% 486 633 GGSL10YR Index Sri Lanka 11.78% 152.4 10.0 14.8TAMSCI Index Taiwan 282.0 11.0% 245 289 GVTW10YR Index Taiwan 1.16% -12.6 1.1 1.3MXTH Index Thailand 521.7 28.3% 406 522 GVTL10YR Index Thailand 3.60% 30.9 3.2 3.9MXVI Index Vietnam 523.0 18.4% 420 606 GGVN10YR Index Vietnam 10.20% -230.0 9.6 12.7
North America North AmericaMXUS Index U.S. 1396.3 14.6% 1,220 1399 USGG10YR Index U.S. 1.83% -11.5 1.4 2.4MXCA Index Canada 1577.9 2.9% 1,413 1602 GCAN10YR Index Canada 1.87% -7.2 1.6 2.3MXMX Index Mexico 7354.7 28.1% 5,470 7355 GMXN10YR Index Mexico 5.41% -99.6 5.0 6.4
South America South AmericaMXAR Index Argentina 1312.3 -38.5% 948 2538 ArgentinaMXBR Index Brazil 2795.2 -5.6% 2,409 3487 GEBR10Y Index Brazil 9.13% -347.7 9.1 11.3MXCL Index Chile 2441.8 7.2% 2,226 2681 ChileMXCO Index Colombia 1358.9 27.2% 1,077 1360 COGR10Y Index Colombia 5.49% -211.0 5.5 7.4MXPE Index Peru 1628.6 15.6% 1,365 1629 GRPE10Y Index Peru 4.09% -267.0 4.1 4.8
Middle East & Africa Middle East & AfricaMXEG Index Egypt 1235.6 57.0% 781 1291 EGPT10Y ARAB Index Egypt 15.10% 14.8 17.3MXIL Index Israel 185.2 -10.0% 180 221 GISR10YR Index Israel 3.96% -59.0 3.9 4.8MSEUSJO Index Jordan 103.7 -4.7% 97 114 JordanMXNI Index Nigeria 670.2 54.7% 423 670 CTNGN10Y Govt Nigeria 11.70%MSEUSTK Index Turkey 649.6 64.0% 389 650 IECM10Y Index Turkey 6.84% -320.0 6.5 10.0MXZA Index South Africa 1021.2 20.0% 842 1023 GSAB9YR Index South Africa 6.40% -155.3 6.4 8.2MXAE Index U.A.E. 224.5 26.5% 169 225 U.A.E.
Europe EuropeEuro Area Euro Area
MXAT Index Austria 116.0 21.1% 86 116 GAGB10YR Index Austria 1.86% -126.6 1.7 3.4MXBE Index Belgium 63.5 34.0% 46 64 GBGB10YR Index Belgium 2.16% -211.1 2.0 4.6MXEST Index Estonia 855.0 39.6% 605 855 EstoniaMXFI Index Finland 76.9 8.4% 59 79 GFIN10YR Index Finland 1.65% -72.7 1.3 2.5MXFR index France 103.8 15.3% 83 104 GFRN10 Index France 2.10% -119.2 2.0 3.4MXDE Index Germany 109.2 22.5% 84 109 GDBR10 Index Germany 1.45% -45.1 1.2 2.1MXGR Index Greece 12.9 2.0% 9 17 GGGB10YR Index Greece 11.49% -2297 11.5 37.1MXIE Index Ireland 26.6 2.4% 24 28 GIGB9YR Index *Ireland (9Y) 4.43% -382.4 4.4 8.1MXIT Index Italy 50.3 6.7% 38 52 GBTPGR10 Index Italy 4.28% -263.7 4.3 7.2MXNL Index Netherlands 83.4 15.9% 66 83 GNTH10YR Index Netherlands 1.65% -63.1 1.5 2.6MXPT Index Portugal 52.1 -2.0% 39 GSPT10YR Index Portugal 6.52% -684.4 6.5 17.4SKSM Index Slovakia 189.8 -11.4% 188 216 GRSK10Y Index Slovakia 2.19% -248.8 2.2 4.8MXES Index Spain 91.3 -4.3% 65 97 GSPG10YR Index Spain 5.05% -23.2 4.9 7.6
Non-Euro EU Non-Euro EUMXBU Index Bulgaria 100.7 -33.4% 95 154 BulgariaMXCZ Index Czech Republic 297.4 -7.2% 280 337 CZGB10YR Index Czech Republic 1.93% -167.2 1.8 3.7MXDK Index Denmark 4557.1 27.5% 3,547 4565 GDGB10YR Index Denmark 1.51% -21 1.0 2.1MXHU Index Hungary 1024.9 10.0% 881 1109 GHGB10YR Index Hungary 6.08% -396.0 6.1 10.7RIGSE Index Latvia 402.1 6.8% 363 402 LatviaVILSE Index Lithuania 363.1 20.1% 302 363 LithuaniaMXPL Index Poland 1803.7 17.9% 1,415 1806 POGB10YR Index Poland 3.83% -206.0 3.7 5.9MXRO Index Romania 543.6 23.1% 436 568 GRRO5YR Index *Romania (5Y) 4.72% -58.4 4.7 6.2MXSE Index Sweden 8626.1 11.3% 7,217 8647 GSGB10YR Index Sweden 1.66% -4.8 1.1 2.1MXGB Index U.K. 1784.8 5.8% 1,559 1786 GUKG10 Index U.K. 2.00% -3.1 1.4 2.4
Non EU Non EUICEXI Index Iceland 685.4 15.8% 590 698 IcelandMXNO Index Norway 2342.0 6.1% 1,984 2440 GNOR10YR Index Norway 2.17% -26.6 1.6 2.6MXRU Index Russia 820.1 6.4% 657 940 MICXRU10 Index Russia 6.99% -187.7 6.9 9.0MXCH Index Switzerland 906.4 17.7% 741 906 GSWISS10 Index Switzerland 0.56% -17.4 0.4 1.0MXUK Index Ukraine 143.2 -48.9% 138 297 Ukraine
10 YEAR GOVERNMENT BOND YIELDS
TICKER COUNTRY LAST PRICE TICKER COUNTRY
MSCI EQUITY INDEXES
1 2 3 4 5 6 7 8 9 10 11 12 13 14 15 16 17 18 19
01.04.13 www.bloombergbriefs.com Bloomberg Brief | Economics Asia 6

Make an IMpact wIthBlooMBerg BrIef content
Bloomberg Briefs provide dedicated licenses to reuse our content to help your business. We offer a full suite of products and services ranging from hardcopy and electronic reprints to plaques, permissions/licensing and photocopies.
to find the solution that is right for you, contact us today at: 800 290 5460 x 100, email: [email protected]
mARKEt inDicAtoRs By MICHAEl MCDoNoUgH, BlooMBERg ECoNoMIST
The five-year U.S. breakeven rate at 2.1 percent remains below the 2.5 percent tightening threshold laid out by the Federal Reserve on Dec. 18.
Analysts forecast West Texas Intermedi-ate crude prices will climb only modestly in 2013, averaging $94.25 a barrel, about $2 above the current spot price. WTI prices fell by almost 10 percent year-on-year.
Corporate yuan-de-nominated securities sold outside mainland China gained 6.2 percent in 2012, more than returns on local-currency company bonds from any other Asian country, accord-ing to HSBC.
The yen has depreciated by about 10 percent, reaching its lowest level since July 2010, following the announcement on Nov. 14 of an early election in Japan.
Analysts forecast the euro will depreciate to $1.27 by the end of 2013, compared with a current rate of $1.32. The euro has been es-sentially flat on a year-on-year basis, rising only 0.7 percent.
LAST YoY 52W Average 52W TICKER LAST YoY 52W Average 52WPRICE bps/% Min Last Max PRICE %CHG Min Last MaxU.S. Asia/Pacific
$$SWAP10 Curncy 10Y US Swap Spread 3.75% -11.9 0.8 21.9 AUD Curncy Australian Dollar 1.05 1.2% 1.0 1.1USGGBE05 Index 5Y Breakeven Rate 2.10% 50.0 1.6 2.4 CNY Curncy Chinese Renminbi 6.23 1.1% 6.2 6.4.2Y10Y Index 2Y10Y Spread 157.51 145.3 158.1 HKD Curncy Hong Kong Dollar 7.75 0.2% 7.7 7.8.TED3M Index 3M Ted Spread 23.91 -33.8 20.1 57.6 INR Curncy Indian Rupee 54.49 -2.3% 48.7 57.2.LIBORIOS Index 3M Libor/OIS 16.0 -33.9 15 50 IDR Curncy Indonesian Rupiah 9653.0 -5.5% 8888 9799.AAABAA Index IG HY Corp Spread 96.00 -46.0 96.0 152.0 JPY Curncy Japanese Yen 86.89 -11.7% 76.2 87.3MUNSMT10 Index Muni Spread 99.67 5.0 85.3 126.4 MYR Curncy Malaysian Ringgit 3.03 4.0% 3.0 3.2
Eurozone NZD Curncy New Zealand Dollar 0.83 5.4% 0.8 0.8EUR003M Index 3M Euribor 0.19% -1.1 0 1 PHP Curncy Philippine Peso 40.74 7.4% 40.7 44.1EONIA Index EONIA 0.06% -0.3 0.1 0.4 SGD Curncy Singapore Dollar 1.22 5.0% 1.2 1.3EUSA10 Index EUR 10Y Swap Rate 1.67% -0.7 1.6 2.4 KRW Curncy South Korean Won 1061.65 8.4% 1062 1185
Europe Non-Euro EU LKR Curncy Sri Lankan Rupee 127.50 -10.6% 113.8 134.0BUBOR03M Index Hungary BUBOR 5.75% -1.5 5.8 7.7 TWD Curncy Taiwan Dollar 29.00 4.4% 29.0 30.3WIBO3M Index Poland WIBO 3M 3.99% -0.9 4.0 5.0 THB Curncy Thai Baht 30.36 3.0% 30.3 31.9BP0003M Index U.K. LIBOR GBP 3M 0.52% -0.6 0.5 1.1 VND Curncy Vietnamese Dong 20843 0.9% 20775 21035
Europe Non-EU EuropeMOIB91 Index Russia Moscow Interbank 7.75% 0.4 0.0 7.9 GBP Curncy British Pound 1.62 3.2% 1.5 1.6SF0003M Index Switzerland LIBOR CHF 0.01% 0.0 0.01 0.11 CZK Curncy Czech Koruna 19.30 2.1% 18.4 21.2
China DKK Curncy Danish Krone 5.69 0.1% 5.5 6.2SHIF3M Index 3M SHIBOR 3.90% -157.5 3.6 5.6 EUR Curncy Euro 1.31 0.4% 1.2 1.3CCSDO2 Curncy 2Y CNY IRS 2.85% -15.4 2.5 3.3 HUF Curncy Hungarian Forint 222.3 9.0% 212 249BOCRYLD Index Avg Dim Sum Yield 4.59% -127.0 4.6 5.9 ISK Curncy Iceland Krona 128.89 -5.5% 118.9 131.0
Japan NOK Curncy Norwegian Krone 5.57 6.2% 5.5 6.1JY0003M Index LIBOR 3M 0.17% -2.1 0.2 0.2 PLN Curncy Polish Zloty 3.12 9.8% 3.1 3.6TI0003M Index 3M TIBOR 0.31% -2.7 0.3 0.3 RON Curncy Romanian Leu 3.37 -1.8% 3.2 3.8JYSW2 Curncy 2Y Yen Swap 0.22% -16.1 0.2 0.4 RUB Curncy Russian Ruble 30.33 4.5% 29.0 33.7
Other Global SEK Curncy Swedish Krona 6.52 4.6% 6.5 7.3AU0003M Index Australia 3M LIBOR 3.24% -142.4 3.2 4.7 CHF Curncy Swiss Franc 0.92 1.0% 0.9 1.0CIBO03M Index Denmark CIBOR 3M 0.28% -72.5 0.3 1.0 UAH Curncy Ukranian Hryvnia 8.02 0.2% 8.0 8.2JPEIPLSP Index EMBI+ Spread 236.32 -140.2 236.3 430.1 AmericasHIHD03M Index Hong Kong 3M HIBOR 0.40% 1.8 0.4 0.4 ARS Curncy Argentina Peso 4.92 -12.7% 4.3 4.9JIIN3M Index Indonesia 3M JIBOR 4.99% -27.2 4.1 5.2 BRL Curncy Brazilian Real 2.05 -10.6% 1.7 2.1NSERO3M Index India 3M MIBOR 8.93% -81.0 8.6 11.5 CAD Curncy Canadian Dollar 0.99 2.4% 1.0 1.0SIBF3M Index Singapore SIBOR 3M 0.38% -1.2 0.4 0.4 CLP Curncy Chilean Peso 474.35 8.0% 470.2 518.5KWSWOOC Curncy S. Korea 3M OIS 2.81% -46.0 2.8 3.3 COP Curncy Colombian Peso 1763.50 9.4% 1755.0 1880.5TRLIB3M Index Turkey TRLIBOR 3m 5.79% -555.5 5.7 11.5 MXN Curncy Mexican Peso 12.78 6.8% 12.6 14.4
PEN Curncy Peruvian Sol 2.55 5.7% 2.5 2.7LAST YoY 52W Average 52W Middle East & AfricaPRICE %Chg Min Last Max EGP Curncy Egyptian Pound 6.42 -6.0% 6.0 6.4
Agricultural IRR Curncy Iranian Rial 12281 -8.8% 11197 12405C 1 Comdty Corn 686.00 4.2% 551.5 831.3 ILS Curncy Israeli Shekel 3.74 2.2% 3.7 4.1KC1 Comdty Coffee 150.50 -33.8% 133.5 234.9 MAD Curncy Moroccan Dirham 8.51 0.2% 8.3 9.1SB1 Comdty Sugar 19.63 -19.9% 18.5 26.5 NGN Curncy Nigerian Naira 156.20 2.6% 156.0 163.5W 1 Comdty Wheat 753.75 14.7% 591.3 943.3 ZAR Curncy South African Rand 8.59 -6.1% 7.4 8.9
Metals SYP Curncy Syrian Pound 71.04 -23.8% 54.1 71.2LA1 Comdty Aluminum 2132.25 6.8% 1809 2320 TRY Curncy Turkish Lira 1.78 5.1% 1.7 1.9HG1 Comdty Copper 372.15 5.5% 328.5 397.9 AED Curncy UAE Dirham 3.67 0.0% 3.7 3.7GC1 Comdty Gold 1677.50 4.8% 1537 1794 EUR CrossesSI1 Comdty Silver 31.0 11.0% 26.2 37.1 EURSEK Curncy EUR/SEK 8.55 4.2% 8.2 9.2
Energy EURGBP Curncy EUR/GBP 1 2.8% 1 1CO1 Comdty Crude (Brent) 111.90 -0.2% 89.2 126.2 EURNOK Curncy EUR/NOK 7.30 5.8% 7.3 7.7CL1 Comdty Crude (WTI) 92.57 -10.1% 77.7 109.8 EURCHF Curncy EUR/CHF 1.21 0.6% 1.2 1.2XB1 Comdty Gasoline 278.8 1.4% 255.0 341.7 EURJPY Curncy EUR/JPY 113.82 -12.0% 94.3 115.2NG1 Comdty Natural Gas 3.23 7.8% 1.9 3.9 JPY Crosses
Indexes AUDJPY Curncy AUD/JPY 91.20 -12.7% 75.7 91.7CRY Index CRB Index 297.54 -5.1% 267.2 325.9 GBPJPY Curncy GBP/JPY 140 -14.4% 118 142BDIY Index Baltic Dry Index 698.00 -57.0% 647 1426 EURJPY Curncy EUR/JPY 113.82 -12.0% 94.3 115.2CMDISPOT Index Bloomberg Global Spot Price 202.65 1.4% 190.0 209.9 CHFJPY Curncy CHF/JPY 94.15 -12.6% 78.5 95.2DBLCDBAT Index DBIQ Diversified Ag 229.0 -1.9% 209.2 250.1 NOKJPY Curncy NOK/JPY 15.60 -16.8% 12.7 15.7
SPREAD/RATE/INDEX CURRENCYTICKER
TICKER COMMODITY
COMMODITIES
CURRENCIESOTHER INDICATORS
A deal on the so-called fiscal cliff in the U.S., coupled with an improving economic outlook in China, has helped lead a year-end rally in copper, which may continue as Chinese growth stabilizes this year.
1 2 3 4 5 6 7 8 9 10 11 12 13 14 15 16 17 18 19
01.04.13 www.bloombergbriefs.com Bloomberg Brief | Economics Asia 7

Economic FUnDAmEntAls By JoSHUA RoBINSoN
Y/Y gDP % change, Actual and Forecast for 2012, 2013
0.0
0.5
1.0
1.5
2.0
2.5
3.0
3.5
Q1 Q2 Q3 Q4 (est) 2013 (est)
United States
Source: Bloomberg ECFC<GO>: Economic Forecasts BloombergBriefs.com
0.0
0.2
0.4
0.6
0.8
1.0
1.2
1.4
Q1 Q2 Q3 Q4 (est) 2013 (est)
Germany
Source: Bloomberg ECFC<GO>: Economic Forecasts BloombergBriefs.com
-2.5
-2.0
-1.5
-1.0
-0.5
0.0
Q1 Q2 Q3 Q4 (est) 2013 (est)
Spain
Source: Bloomberg ECFC<GO>: Economic Forecasts BloombergBriefs.com
-4.0
-2.0
0.0
2.0
4.0
6.0
8.0
Q1 Q2 Q3 Q4 (est) 2013 (est)
Japan
Source: Bloomberg ECFC<GO>: Economic Forecasts BloombergBriefs.com
0.0
0.5
1.0
1.5
2.0
2.5
3.0
3.5
4.0
Q1 Q2 Q3 Q4 (est) 2013 (est)
Brazil
Source: Bloomberg ECFC<GO>: Economic Forecasts BloombergBriefs.com
-0.7
-0.6
-0.5
-0.4
-0.3
-0.2
-0.1
0.0
Q1 Q2 Q3 Q4 (est) 2013 (est)
Euro Area
Source: Bloomberg ECFC<GO>: Economic Forecasts BloombergBriefs.com
0.0
0.1
0.1
0.2
0.2
0.3
Q1 Q2 Q3 Q4 (est) 2013 (est)
France
Source: Bloomberg ECFC<GO>: Economic Forecasts BloombergBriefs.com
-8.0
-7.0
-6.0
-5.0
-4.0
-3.0
-2.0
-1.0
0.0
Q1 Q2 Q3 Q4 (est) 2013 (est)
Greece
Source: Bloomberg ECFC<GO>: Economic Forecasts BloombergBriefs.com
0.0
0.5
1.0
1.5
2.0
2.5
3.0
3.5
4.0
Q1 Q2 Q3 Q4 (est) 2013 (est)
South Korea
Source: Bloomberg ECFC<GO>: Economic Forecasts BloombergBriefs.com
5.1
5.2
5.3
5.4
5.5
5.6
5.7
Q1 Q2 Q3 Q4 (est) 2013 (est)
India
Source: Bloomberg ECFC<GO>: Economic Forecasts BloombergBriefs.com
-0.4
-0.2
0.0
0.2
0.4
0.6
0.8
1.0
1.2
Q1 Q2 Q3 Q4 (est) 2013 (est)
United Kingdom
Source: Bloomberg ECFC<GO>: Economic Forecasts BloombergBriefs.com Source: Bloomberg ECFC<GO>: Economic Forecasts BloombergBriefs.com
-3.0
-2.5
-2.0
-1.5
-1.0
-0.5
0.0
Q1 Q2 Q3 Q4 (est) 2013 (est)
Italy
Source: Bloomberg ECFC<GO>: Economic Forecasts BloombergBriefs.com
7.0
7.2
7.4
7.6
7.8
8.0
8.2
Q1 Q2 Q3 Q4 (est) 2013 (est)
China
Source: Bloomberg ECFC<GO>: Economic Forecasts BloombergBriefs.com Source: Bloomberg ECFC<GO>: Economic Forecasts BloombergBriefs.com
0.0
0.5
1.0
1.5
2.0
2.5
3.0
3.5
4.0
4.5
5.0
Q1 Q2 Q3 Q4 (est) 2013 (est)
Australia
Source: Bloomberg ECFC<GO>: Economic Forecasts BloombergBriefs.com
0.0
1.0
2.0
3.0
4.0
5.0
6.0
Q1 Q2 Q3 Q4 (est) 2013 (est)
Russia
Source: Bloomberg ECFC<GO>: Economic Forecasts BloombergBriefs.com
Visit EcFc <go> FoR moRE
1 2 3 4 5 6 7 8 9 10 11 12 13 14 15 16 17 18 19
01.04.13 www.bloombergbriefs.com Bloomberg Brief | Economics Asia 8

Economic FUnDAmEntAls By JoSHUA RoBINSoN
current Account As % of gDP, Actual and Forecast for 2012, 2013
-3.2
-3.1
-3.1
-3.0
-3.0
-2.9
-2.9
-2.8
Q1 Q2 Q3 Q4 (est) 2013 (est)
United States
Source: Bloomberg ECFC<GO>: Economic Forecasts BloombergBriefs.com
4.8
5.0
5.2
5.4
5.6
5.8
6.0
6.2
6.4
Q1 Q2 Q3 Q4 (est) 2013 (est)
Germany
Source: Bloomberg ECFC<GO>: Economic Forecasts BloombergBriefs.com
-4.0
-3.5
-3.0
-2.5
-2.0
-1.5
-1.0
-0.5
0.0
Q1 Q2 Q3 Q4 (est) 2013 (est)
Spain
Source: Bloomberg ECFC<GO>: Economic Forecasts BloombergBriefs.com
0.0
0.2
0.4
0.6
0.8
1.0
1.2
1.4
1.6
1.8
Q1 Q2 Q3 Q4 (est) 2013 (est)
Japan
Source: Bloomberg ECFC<GO>: Economic Forecasts BloombergBriefs.com
-3.0
-2.5
-2.0
-1.5
-1.0
-0.5
0.0
Q1 Q2 Q3 Q4 (est) 2013 (est)
Brazil
Source: Bloomberg ECFC<GO>: Economic Forecasts BloombergBriefs.com
-0.4
-0.2
0.0
0.2
0.4
0.6
0.8
1.0
1.2
1.4
Q1 Q2 Q3 Q4 (est) 2013 (est)
Euro Area
Source: Bloomberg ECFC<GO>: Economic Forecasts BloombergBriefs.com
-2.2
-2.1
-2.1
-2.0
-2.0
-1.9
-1.9
-1.8
-1.8
Q1 Q2 Q3 Q4 (est) 2013 (est)
France
Source: Bloomberg ECFC<GO>: Economic Forecasts BloombergBriefs.com
-10.0
-9.0
-8.0
-7.0
-6.0
-5.0
-4.0
-3.0
-2.0
-1.0
0.0
Q1 Q2 Q3 Q4 (est) 2013 (est)
Greece
Source: Bloomberg ECFC<GO>: Economic Forecasts BloombergBriefs.com
0.0
0.5
1.0
1.5
2.0
2.5
3.0
3.5
4.0
4.5
Q1 Q2 Q3 Q4 (est) 2013 (est)
South Korea
Source: Bloomberg ECFC<GO>: Economic Forecasts BloombergBriefs.com
-6.0
-5.0
-4.0
-3.0
-2.0
-1.0
0.0
Q1 Q2 Q3 Q4 (est) 2013 (est)
India
Source: Bloomberg ECFC<GO>: Economic Forecasts BloombergBriefs.com
-3.5
-3.0
-2.5
-2.0
-1.5
-1.0
-0.5
0.0
Q1 Q2 Q3 Q4 (est) 2013 (est)
United Kingdom
Source: Bloomberg ECFC<GO>: Economic Forecasts BloombergBriefs.com Source: Bloomberg ECFC<GO>: Economic Forecasts BloombergBriefs.com
-3.0
-2.5
-2.0
-1.5
-1.0
-0.5
0.0
Q1 Q2 Q3 Q4 (est) 2013 (est)
Italy
Source: Bloomberg ECFC<GO>: Economic Forecasts BloombergBriefs.com
2.2
2.2
2.3
2.3
2.4
2.4
2.5
2.5
2.6
2.6
Q1 Q2 Q3 Q4 (est) 2013 (est)
China
Source: Bloomberg ECFC<GO>: Economic Forecasts BloombergBriefs.com Source: Bloomberg ECFC<GO>: Economic Forecasts BloombergBriefs.com
-5.0
-4.5
-4.0
-3.5
-3.0
-2.5
-2.0
-1.5
-1.0
-0.5
0.0
Q1 Q2 Q3 Q4 (est) 2013 (est)
Australia
Source: Bloomberg ECFC<GO>: Economic Forecasts BloombergBriefs.com
0.0
1.0
2.0
3.0
4.0
5.0
6.0
7.0
Q1 Q2 Q3 Q4 (est) 2013 (est)
Russia
Source: Bloomberg ECFC<GO>: Economic Forecasts BloombergBriefs.com
Visit EcFc <go> FoR moRE
1 2 3 4 5 6 7 8 9 10 11 12 13 14 15 16 17 18 19
01.04.13 www.bloombergbriefs.com Bloomberg Brief | Economics Asia 9
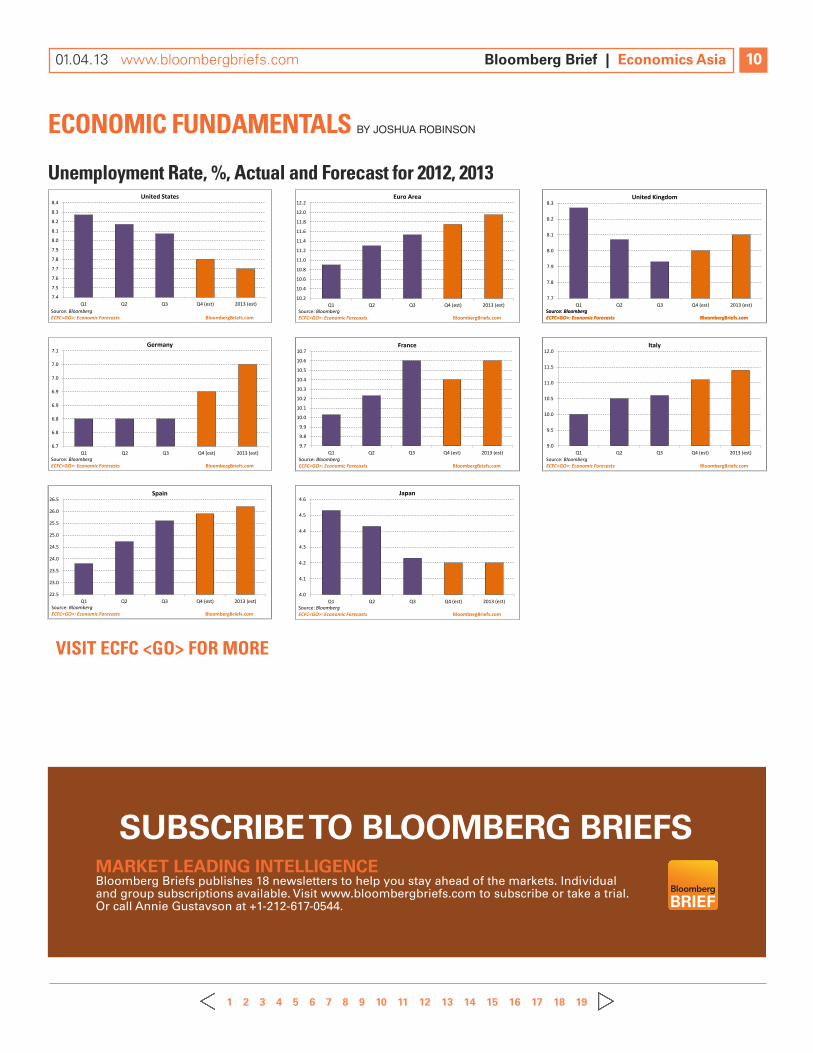
Economic FUnDAmEntAls By JoSHUA RoBINSoN
Unemployment Rate, %, Actual and Forecast for 2012, 2013
7.4
7.5
7.6
7.7
7.8
7.9
8.0
8.1
8.2
8.3
8.4
Q1 Q2 Q3 Q4 (est) 2013 (est)
United States
Source: Bloomberg ECFC<GO>: Economic Forecasts BloombergBriefs.com
6.7
6.8
6.8
6.9
6.9
7.0
7.0
7.1
Q1 Q2 Q3 Q4 (est) 2013 (est)
Germany
Source: Bloomberg ECFC<GO>: Economic Forecasts BloombergBriefs.com
22.5
23.0
23.5
24.0
24.5
25.0
25.5
26.0
26.5
Q1 Q2 Q3 Q4 (est) 2013 (est)
Spain
Source: Bloomberg ECFC<GO>: Economic Forecasts BloombergBriefs.com
10.2
10.4
10.6
10.8
11.0
11.2
11.4
11.6
11.8
12.0
12.2
Q1 Q2 Q3 Q4 (est) 2013 (est)
Euro Area
Source: Bloomberg ECFC<GO>: Economic Forecasts BloombergBriefs.com
9.7
9.8
9.9
10.0
10.1
10.2
10.3
10.4
10.5
10.6
10.7
Q1 Q2 Q3 Q4 (est) 2013 (est)
France
Source: Bloomberg ECFC<GO>: Economic Forecasts BloombergBriefs.com
4.0
4.1
4.2
4.3
4.4
4.5
4.6
Q1 Q2 Q3 Q4 (est) 2013 (est)
Japan
Source: Bloomberg ECFC<GO>: Economic Forecasts BloombergBriefs.com
7.7
7.8
7.9
8.0
8.1
8.2
8.3
Q1 Q2 Q3 Q4 (est) 2013 (est)
United Kingdom
Source: Bloomberg ECFC<GO>: Economic Forecasts BloombergBriefs.com Source: Bloomberg ECFC<GO>: Economic Forecasts BloombergBriefs.com
9.0
9.5
10.0
10.5
11.0
11.5
12.0
Q1 Q2 Q3 Q4 (est) 2013 (est)
Italy
Source: Bloomberg ECFC<GO>: Economic Forecasts BloombergBriefs.com
Market leading intelligence Bloomberg Briefs publishes 18 newsletters to help you stay ahead of the markets. Individual and group subscriptions available. Visit www.bloombergbriefs.com to subscribe or take a trial. Or call Annie Gustavson at +1-212-617-0544.
SUBScriBe tO BlOOMBerg BrieFS
BRIEF GET THE WORLD. IN BRIEFBLOOMBERGBRIEFS.COM
Visit EcFc <go> FoR moRE
1 2 3 4 5 6 7 8 9 10 11 12 13 14 15 16 17 18 19
01.04.13 www.bloombergbriefs.com Bloomberg Brief | Economics Asia 10

europe
Excluding Finland and Ireland, Europe remains relatively cheap with germany’s MSCI index trading at a forward price-to-earnings ratio of 10.9, following a nearly 30 percent rally in its equity market over the past year. Belgium’s MSCI index was the second best performer over the past 12 months, rising 37 percent and now trading at a forward P/E ratio of 13.7.
EqUitY VAlUAtion mAPs By MICHAEl MCDoNoUgH, BlooMBERg ECoNoMIST
Forward P/E Ratios suggest most Expensive markets in ireland, Philippines and colombia The following maps highlight the forward price-to-earnings ratio across 40 national MSCI indexes. The three most expensive indexes surveyed are Ireland (17.3 times), the Philippines (17.1 times) and Colombia (16.5 times). The three cheapest indexes surveyed are Argentina, Egypt and Hungary. The MSCI World Index is currently trading at a forward P/E ratio of 12.5 after rising 13.2 percent over the past year, compared with 10.3 times for the MSCI Emerging Market Index, which has climbed 14.7 percent over the past 12 months.
asia
South korea’s and China’s MSCI indexes are trading at forward price-to-earnings ratios of 8.5 and 10, making them the fifth and seventh cheapest surveyed, respectively. The MSCI Philippines Index has rallied 36 percent over the past year, helping push its forward P/E ratio to 17.1, making it the second most expensive.
north america
After surging by 30 percent over the past year, the forward price-to-earnings ratio of the MSCI Mexico Index reached 15.8, making it the fifth most expensive of the 40 countries surveyed. The forward P/E ratio for the MSCI U.S. Index stands at 12.9, making it the 19th most expensive.
south america
The MSCI Brazil Index is the 11th cheapest surveyed, with a forward price-to-earnings ratio of 10.5, after falling by about 1 percent in the past year. Colombia’s index is the third most expensive, with a forward P/E ratio of 16.5, after soaring by more than 30 percent over the past year.
COMPARE MARKET VALUATIONS
1 2 3 4 5 6 7 8 9 10 11 12 13 14 15 16 17 18 19
01.04.13 www.bloombergbriefs.com Bloomberg Brief | Economics Asia 11

Fx mARKEts By TAMARA HENDERSoN, BlooMBERg ECoNoMIST
cURREncY (xxxUsD)
PERcEnt cHAngE in 2012*
cHAngE in REER (noV. YoY)
REERZ-scoRE (10-YEAR)
kRw 9.1 4.8 -0.5
SGD 6.2 8.2 2.7
RuB 5.3 4.7 1.2
GBP 4.6 4.1 -0.7
CAD 3.0 2.3 0.9
CHF 2.6 -2.9 1.1
CNH 2.0 3.3 1.9
AuD 1.8 4.2 1.7
euR 1.8 -5.1 -1.9
iNR -3.1 -2.0 -0.4
BRl -9.1 -9.7 0.5
JPY -11.3 -7.1 -0.1
Source: Bloomberg, Bloomberg BTST, Bloomberg Brief calculations and BIS * As of the New York close on Dec. 31.
stRAtEgY PRoFit (%)
sHARPE RAtio
AVERAgE DURAtion (DAYs)
nUm-bER oF tRADEs
Fear & Greed 12.2 2.2 21 17
triangular MA 8.8 1.6 23 15
Buy & Hold 8.6 1.5 363 1
Rex oscillator 6.7 1.4 4 87
Buy & Hold 6.2 1.2 363 1
MA oscillator 5.3 1.1 15 23
Rate of Change 25.3 2.3 3 115
Rex oscillator 25.2 2.3 4 83
Stochastics 22.5 2.1 30 12
Bollinger Bands 12.9 2.1 44 8
RSi 8.8 1.8 81 3
Buy & Hold 4.8 0.8 363 1
kBand 6.9 1.1 26 14
trading envelopes 4.9 0.8 49 7
Bollinger Bands 4.4 0.7 48 7
MA oscillator 8.4 1.1 13 27
Rex oscillator 7.3 0.9 4 89
exponential MA 6.0 0.8 20 17
ichimoku 3.1 2.2 39 8
Simple MA 3.0 2.1 25 12
Rate of Change 2.7 1.6 4 89
RSi 11.6 1.4 168 2
weighted MA 3.0 0.4 20 15
MACD 2.4 0.3 21 15
triangular MA 6.6 0.9 23 15
Simple MA 6.0 0.8 31 11
Bollinger Bands 5.1 0.6 60 6
Rex oscillator 16.3 1.7 4 90
Parabolic 13.0 1.4 23 16
MA envelopes 11.9 1.3 116 3
ichimoku 16.6 1.9 39 9
variable MA 13.0 1.5 14 25
DMi 7.9 0.9 19 19
ichimoku 16.3 2.5 36 9
weighted MA 11.6 1.7 18 19
variable MA 10.3 1.5 14 25
stRAtEgY loss (%)
sHARPE RAtio
AVERAgE DURAtion (DAYs)
nUm-bER oF tRADEs
trading envelopes -11.5 -2.0 116 3
Rex oscillator -8.3 -1.4 4 102
Bollinger Bands -7.9 -1.4 116 3
william's %R -6.7 -1.3 30 12
Cmdty Channel index -5.7 -1.1 28 13
kBand -4.1 -0.8 36 10
Bollinger Bands -7.2 -0.6 68 5
RSi -4.2 -0.3 112 3
trading envelopes -3.1 -0.2 49 7
DMi -12.2 -1.9 10 35
Cmdty Channel index -9.1 -1.4 25 14
variable MA -8.6 -1.4 10 36
variable MA -11.9 -1.9 8 47
Cmdty Channel index -10.8 -1.7 33 11
Rex oscillator -9.4 -1.5 4 103
kBand -9.5 -1.1 36 10
Fear & Greed -4.6 -0.6 13 27
trading envelopes -4.4 -0.5 90 4
Bollinger Bands -3.2 -2.0 121 3
Cmdty Channel index -2.9 -1.9 30 12
Stochastics -1.7 -1.2 49 7
Parabolic -12.5 -1.5 12 27
Cmdty Channel index -10.1 -1.1 26 14
Rate of Change -8.9 -1.0 3 135
kBand -8.6 -1.0 36 10
Cmdty Channel index -5.0 -0.5 30 12
william's %R -4.3 -0.5 25 14
kBand -16.9 -1.7 36 10
trading envelopes -13.9 -1.4 89 4
william's %R -11.4 -1.2 33 10
Cmdty Channel index -16.1 -1.5 32 11
Bollinger Bands -14.7 -1.4 118 3
trading envelopes -12.6 -1.2 89 4
Stochastics -12.2 -1.6 30 12
Buy & Hold -11.3 -1.5 363 1
Cmdty Channel index -10.0 -1.3 26 14
moving Average Rules Were top trading strategies in 2012bEst WoRst
1 2 3 4 5 6 7 8 9 10 11 12 13 14 15 16 17 18 19
01.04.13 www.bloombergbriefs.com Bloomberg Brief | Economics Asia 12

asian rates
Credit rating upgrades by Moody’s and S&P in July and october helped push the Philippine 10-year bond yield down 100 basis points from the start of 2012 to 4.4 percent. Several interest rate cuts, combined with Australia’s AAA rating, have helped push yields on Australian 10-year government bonds to 3.3 percent from 3.7 percent at the start of last year.
FixED incomE By MICHAEl MCDoNoUgH, BlooMBERg ECoNoMIST
Europe’s Debt crisis, global Easing measures Play substantial Role in global Rate marketsBelow-trend global growth and continued strife in Europe’s debt crisis are likely to prompt many central banks to maintain an easing bias for at least the first half of 2013. Central bank easing, combined with risk aversion, played a substantial role in global rate markets in 2012. Following an interim solution to the so-called fiscal cliff in the U.S., global corporate debt is continuing a record 14-month rally, which will probably be tempered later this year on the back of record borrowings and tepid economic growth.
corporate Bonds
last year saw a record rally in global corporate bond markets, now enter-ing its 14th month. JPMorgan’s High yield Emerging Market Bond Index outperformed the MSCI World Index by more than 7 percent. The EM high yield index returned 21 percent, compared with a 16 percent gain for developed-market high yield debt.
u.s. rates
During 2012, the Federal Reserve’s operation Twist increased the dura-tion of the System open Market Account to 10.32 years from 6.09 in September 2011. Continued easing by the Fed, coupled with global risk aversion, helped keep 10-year Treasury yields below 2 percent for the majority of 2012, while five-year yields held mostly below 1 percent.
european Markets
From May through July, as concerns spread about a potential Spanish bailout and a greek exit from the euro zone, the yield spread between Spain’s 10-year government bonds and those of germany set 14 records. During this period, investors seeking safety helped push german two-year bond yields below zero, where they remain today.
FX, INTEREST RATE, CREDIT, EQUITY AND COMMODITY DERIVATIVESALL THE TOOLS YOU NEED IN ONE PLACE
80
90
100
110
120
0.0%
1.0%
2.0%
3.0%
Sep-11 Dec-11 Mar-12 Jun-12 Sep-12 Dec-12
Spread, basis points (rs) U.S. 5Y Yield (ls) U.S. 10Y Yield (ls)
-$200
-$100
$0
$100
$200
-$200
-$100
$0
$100
$200
2011 2015 2019 2023 2027 2031 2035 2039Th
ousa
nds
Difference in Fed's SOMA Portfolio byMaturity Now vs. September 2011
Risk Aversion, Fed Policies Keep U.S. Rates Low
Source: Bloomberg
*Weighted average years to maturity has risen to 10.32 from 6.09 in September 2011 due to Operation Twist
-0.2%
-0.1%
0.0%
0.1%
0.2%
0.3%
0.4%
200
300
400
500
600
700
Jan-12 Mar-12 May-12 Jul-12 Sep-12 Nov-12
Spain 10Y Spread vs. Germany (ls) New HighGermany 2Y Yield (rs) New Low
German 2Y Yields Turn Negative, Spain 10Y Spread Falls From High
Source: Bloomberg
0.0%
1.0%
2.0%
3.0%
4.0%
5.0%
Jan-12 Mar-12 May-12 Jul-12 Sep-12 Nov-12
Japan Australia Singapore
3.0%
4.0%
5.0%
6.0%
7.0%
Jan-12 Mar-12 May-12 Jul-12 Sep-12 Nov-12
Indonesia Philippines Thailand Malaysia
Asean Rates Benefit From Strong Domestic Economies, Rating Upgrades
Source: Bloomberg
10Y Yields:
10Y Yields:
*Australia & Singapore are 2 of 11 countries rated AAA by S&P w/o negative outlooks
95
100
105
110
115
120
125
Jan-12 Mar-12 May-12 Jul-12 Sep-12 Nov-12
GlobalEmerging MarketsDeveloped MarketsMSCI World Equity Index
JP Morgan High Yield Bond Index:
Global High Yield Bond Markets Outperform Equities
Source: Bloomberg
EM high yield bonds outperformed MSCI
*Rebased to 100
1 2 3 4 5 6 7 8 9 10 11 12 13 14 15 16 17 18 19
01.04.13 www.bloombergbriefs.com Bloomberg Brief | Economics Asia 13

commoDitiEs By SCoTT JoHNSoN
central Bank easing, economic recovery led Metals prices Higher toward year-end
90
95
100
105
110
115
120
Jan-12 Feb-12 Mar-12 Apr-12 May-12 Jun-12 Jul-12 Aug-12 Sep-12 Oct-12 Nov-12 Dec-12
Bloomberg Base Metals Three-Month Price Index Bloomberg Precious Metals Three-Month Price Index
*Rebased to 100
Source: Bloomberg
Dec. 20 - Gold traded near $1,668 per ounce, the lowest in three months, as an impasse in U.S. budget talks helped boost the dollar.
Jan. 13 - Goldman Sachs predicted gold futures would advance to $1,940 an ounce in 12 months.
Feb. 21 - Greece was awarded $173 billion in its second bailout.
Oct. 5 - Gold reached a high of $1,796 per ounce
Jan. 10 - Chinese copper imports rose to a record 508,942 metric tons in December.
April 3 - The Fed signaled it would hold off on further easing unless the U.S. economy falters or inflation accelerates.
June 21 - Gold erased the year's gains after the Fed failed to announce further debt purchases.
May 16 - Greece set new elections for June 17, after political parties failed to form a governing coalition.
Sept. 14 - The Fed announced a third round of quantitative easing.
June 7 - China cut interest rates for the first time since 2008.
Sept. 14 - Copper reached a four-month high after the Bank of Japan expanded its asset-purchase program.
crop prices Have come off drought Highs on improving supply
90
95
100
105
110
115
120
125
130
135
140
Jan-12 Feb-12 Mar-12 Apr-12 May-12 Jun-12 Jul-12 Aug-12 Sep-12 Oct-12 Nov-12 Dec-12
Bloomberg Crops Three-Month Price Index
*Rebased to 100
Source: Bloomberg
Jan. 19 - Macquarie predicted rains in Argentina would not reverse damage from months of hot, dry weather.
June 27 - U.S. corn stockpiles declined at the fastest pace since 1996 as a heat wave damaged crops.
July 11 - The U.S. cut its corn-harvest estimate 12 percent as the worst Midwest drought since 1988 eroded production.
Aug. 10 - Corn futures surged to a record high
July was the hottest month in the lower 48 U.S. states in records going back 117 years.
Sept. 12 - The U.S. reported corn output would fall by less than analysts predicted.
Aug. 13 - The condition of U.S. soybean crops improved for the first time in 2012 on rain and cooler temperatures.
Dec. 6 - The coldest winter in 20 years threatened Russian wheat crops.
July 30 - CBH Group warned that Western Australia's grain output may decline as much as 40 percent on dry weather.
Oct. 5 - Wheat prices declined after Russia said it would start grain sales from state stockpiles.
Middle east concerns, europe drove energy Volatility in 2012
80
85
90
95
100
105
110
115
Jan-12 Feb-12 Mar-12 Apr-12 May-12 Jun-12 Jul-12 Aug-12 Sep-12 Oct-12 Nov-12 Dec-12
Bloomberg Energy Three-Month Price Index
*Rebased to 100
Source: Bloomberg
Feb. 10 - Owners of more than 100 supertankers said they would stop loading cargoes from Iran, OPEC's second-largest producer.
March 31 - Saudi Arabia said it could increase crude production by as much as 25 percent immediately if needed.
May 23 - WTI crude fell below $90 a barrel, erasing gains through 2011, as U.S. supplies rose to a 22-year high and European leaders met to discuss the region's crisis.
Oct. 20 - U.S. stocks slid the most since June as companies from General Electric to McDonald's and Microsoft posted earnings results below estimates.
June 29 - Oil surged the most in more than three years after European leaders agreed to relief for Spain and Italy.
Sept. 17 - Oil declined more than $3 in less than a minute as October options were about to expire.
Feb. 15 - Iran announced a "major" breakthrough in its nuclear program.
March 1 - Brent hit a 3 1/2-year high of $128.40 a barrel
Aug. 30 - Hurricane Isaac shut down 95 percent of oil production and 73 percent of natural gas output from the Gulf of Mexico.
1 2 3 4 5 6 7 8 9 10 11 12 13 14 15 16 17 18 19
01.04.13 www.bloombergbriefs.com Bloomberg Brief | Economics Asia 14
EURoPEAn DEbt cRisis By NIRAJ SHAH, BlooMBERg ECoNoMIST
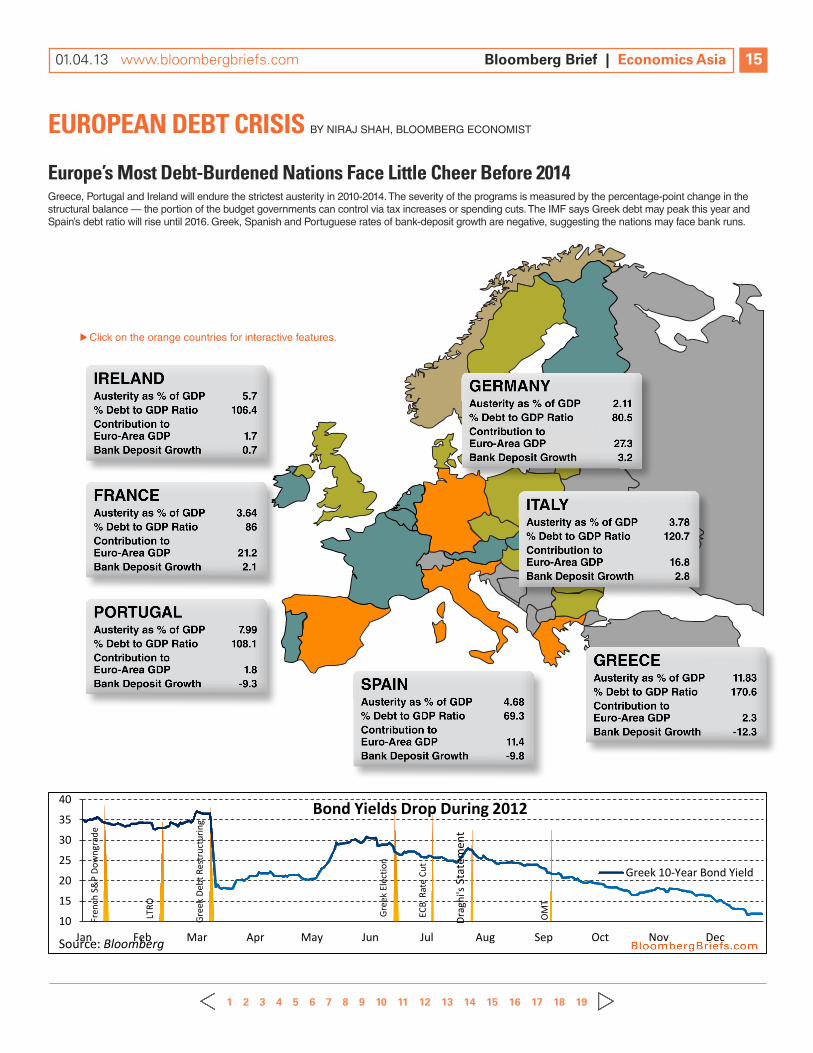
Europe’s most Debt-burdened nations Face little cheer before 2014greece, Portugal and Ireland will endure the strictest austerity in 2010-2014. The severity of the programs is measured by the percentage-point change in the structural balance — the portion of the budget governments can control via tax increases or spending cuts. The IMF says greek debt may peak this year and Spain’s debt ratio will rise until 2016. greek, Spanish and Portuguese rates of bank-deposit growth are negative, suggesting the nations may face bank runs.
10
15
20
25
30
35
40
Jan Feb Mar Apr May Jun Jul Aug Sep Oct Nov Dec
Greek 10-Year Bond Yield
Bond Yields Drop During 2012
LTRO
Gree
k El
ectio
n
Fren
ch S
&P
Dow
ngra
de
Gree
k De
bt R
estr
uctu
ring
ECB
Rat
e Cu
t
Drag
hi's
Stat
emen
t
OM
T
Source: Bloomberg
Click on the orange countries for interactive features.
1 2 3 4 5 6 7 8 9 10 11 12 13 14 15 16 17 18 19
01.04.13 www.bloombergbriefs.com Bloomberg Brief | Economics Asia 15

U.s. FiscAl cliFF By JoSEPH BRUSUElAS, BlooMBERg ECoNoMIST
aMt patch May Help 28 Million Households
Congress and President Barack obama agreed to permanently increase the exemption amounts subject to the alternative minimum tax to $50,600 for individuals and $75,750 for households that identify as married, filing jointly. The reform will probably prevent 28 million people from suffering a sharp hike in taxes this year.
Fiscal cliff Deal may create 1.7 Percent Drag on U.s. Economy in 2013The partial resolution to the standoff over the U.S. fiscal cliff will probably result in much slower growth in the first half of 2013 whiledoing little to narrow the substantial U.S. structural deficit over the long-term. The overall nominal fiscal drag due to the tax hike on those making more than $450,000 per year, the expiration of the tax holiday, and limits on personal exemptions and itemized deductions for households earning more than $300,000, will probably be 1.7 percent.
debt ceiling
No agreement was reached on lifting the U.S. budget ceiling. The U.S. Treasury has taken technical steps that should give lawmakers until late February or early March to resolve the latest policy crisis.
less after-tax income for u.s. Households
Under the agreement to resolve the U.S. budget standoff, many taxpayers will find less after-tax income in their paychecks. As many as 77.1 percent of U.S. households will see their payroll taxes rise while upper income households may see reduced standard and itemized deductions this year.
Falling tax revenues
According to the Congressional Budget office, the American Taxpayer Relief Act of 2012 will result in a net increase in the overall deficit of $3.6 trillion, primarily due to extending the Bush-era tax cuts to households earning less than $450,000 and making permanent the Alternative Mini-mum Tax patch.
Fiscal Cliff Overview... Facts / Consequences / Players / Charts CLIF
0.0%
5.0%
10.0%
15.0%
20.0%
25.0%
30.0%
35.0%
40.0%
Perc
enta
ge
New U.S. Tax Schedule Average Federal Tax Rate for Income Levels (Percentage)
Source: Taxpolicycenter.org Source: Taxpolicycenter.org
-500
-450
-400
-350
-300
-250
-200
-150
-100
-50
0
2013 2014 2015 2016 2017 2018 2019 2020 2021 2022
Billi
ons (
$)
Falling Revenues in Wake of Compromise
Change in Revenues
Source: Congressional Budget Office
$0
$10,000
$20,000
$30,000
$40,000
$50,000
$60,000
$70,000
$80,000
Individuals Married Filing Jointly Individuals Married Filing Jointly
2011 2012
Dolla
rs
Alternative Minimum Tax Patch
Source: Congressional Budget Office
-0.3
0.0
0.3
0.5
0.8
1.0
1.3
1.5
1.8
2.0
1994 1996 1998 2000 2002 2004 2006 2008 2010 2012
Debt
Lim
it M
inus
Deb
t Out
stan
ding
($, B
illio
ns)
U.S. Hits Debt Ceiling Setting Stage for New Crisis U.S. Statuatory Debt Limit Minus Total Public Debt Outstanding
Source: Bloomberg DEBTDTLM, DEBTOUTD INDEX<GO>
>
1 2 3 4 5 6 7 8 9 10 11 12 13 14 15 16 17 18 19
01.04.13 www.bloombergbriefs.com Bloomberg Brief | Economics Asia 16

Brazil
Brazil’s central bank cut policy rates by a total of 375 basis points in 2012, hoping to revive growth and temper appreciation pressures in the Brazilian real stemming from sustained capital inflows. With growth below an annualized one percent, Brazil has by far the weakest economy among the BRIC nations, yet inflation remains stubbornly high at above 5 percent. Improved momentum in China and the U.S., the country’s two largest trading partners, is pivotal for a brighter Brazilian outlook in 2013.
bRic sloWDoWn By TAMARA HENDERSoN, BlooMBERg ECoNoMIST
central-bank stimulus is Key to Economic growth of bRic nations in 2013 Inflation and growth in the four BRIC nations — Brazil, Russia, India and China — have slowed by an average 1.5 percentage points compared to figures available one year ago. This prompted cuts in central-bank policy rates in all but Russia. These stimulus measures should underpin economic growth in 2013.
russia
Russian growth at an annualized 2.9 percent represents a decline of 2.1 percentage points from one year ago, the sharpest fall among the BRICs. Inflation, at 6.6 percent, has failed to respond to weaker economic activity, requiring a rate increase of 25 basis points this year. With oil, oil prod-ucts and gas accounting for 65 percent of dollar-valued exports, higher fuel prices from a pickup in global activity in 2013 would be a significant source of support for Russia’s fiscal and current account balances.
china
China’s economy has hit a sweet spot, currently experiencing rising growth and slowing inflation. In 2013, higher food-price inflation, partially due to low year-ago comparables, will probably push consumer-price infla-tion closer to the government’s one-year deposit rate ceiling of 3 percent. PMIs, industrial production and retail sales all suggest a rebound in fourth-quarter growth, although significant slack in the manufacturing sec-tor points to a modest recovery at best in the year ahead.
0%
2%
4%
6%
8%
10%
12%
14%
Dec-10 Jun-11 Dec-11 Jun-12 Dec-12
Central Bank Policy Rate
Real GDP YoY
CPI Inflation YoY
Source: Bloomberg
China Has Strongest Growth, Lowest Inflation Among BRICs
india
India’s gDP stabilized in 2012, having been in a multi-year slowdown, amid investor angst about increases in already large fiscal and current account deficits. government reforms unveiled in the second half of 2012 will be important for retaining the country’s investment-grade credit rating and ensuring investor confidence in 2013. Higher fuel prices caused by subsidy cuts will probably weigh on growth and underpin inflation in the near term, presenting a dilemma for the Reserve Bank of India.
0%
2%
4%
6%
8%
10%
12%
14%
Dec-10 Jun-11 Dec-11 Jun-12 Dec-12
Central Bank Policy Rate
Real GDP YoY
WPI Inflation YoY
Source: Bloomberg
India Has Highest Inflation Among BRICs
0%
2%
4%
6%
8%
10%
12%
14%
Dec-10 Jun-11 Dec-11 Jun-12 Dec-12
Central Bank Policy Rate
Real GDP YoY
CPI Inflation YoY
Source: Bloomberg
Brazil Has Slowest Growth Among BRICs
0%
2%
4%
6%
8%
10%
12%
14%
Dec-10 Jun-11 Dec-11 Jun-12 Dec-12
Central Bank Policy Rate
Real GDP YoY
CPI Inflation YoY
Source: Bloomberg
Russia Is Only BRIC Faced With Stagflation
1 2 3 4 5 6 7 8 9 10 11 12 13 14 15 16 17 18 19
01.04.13 www.bloombergbriefs.com Bloomberg Brief | Economics Asia 17

Frederic neumann, co-head of asian economics research at HsBc in Hong kongOn opportunities: We think that emerging Asia will generally perform quite well next year and probably surprise on
the upside, but there’s still question marks over some of the structural reforms coming through in China, which will probably weigh on markets there, so broadly speaking, the Asean economy should probably still outperform. That’s perhaps a better place to play the regional reflation theme. We also like korea. korea has been battered in terms of growth this year. It is a high-beta economy, but we should see a fairly strong rebound in korea, as well. So our two geographic picks should really be korea and Asean next year as a way to play the broader Asian reflation.
On risks: Well, the Japanese economy is clearly facing tremendous challenges. Recently we’ve seen a lot of hope with the prospect of political transition and more aggressive BoJ action. But we don’t really think that will translate into stronger economic performance. We’ve seen a bit of hype in the stock market of late, for example, but it’s really hard to see that being carried through if the economy doesn’t pick up further in 2013. So Japan remains a source of risk. And the other one is India, where it’s more of the muddle-through scenario for the time being until we get much more convincing reforms being delivered, which seems unlikely before the elections in 2014. The economy will continue to underperform, and so should asset markets.
Michael spencer, chief economist for asia at deutsche Bank in Hong kongOn opportunities: In Asia, I think greater China and korea, for two reasons. one is that I think expectations for
growth in China among the investment community are still too low, and we expect to see Chinese growth steadily ris-ing from here really over the next 18 months, well into 2014. That’s, in my experience, a rather more positive view on China than most investors hold.
our expectation is that if you take the U.S. and European economies as a block, growth will be steadily better through 2013. And in economies like korea and Taiwan and Singapore, you get a magnified exposure to the global-demand pickup. Also, in keeping with the theme of growth generally surprising to the upside, I think we will see capital
flows to Asia strengthening next year. So there’s a broad bias in favor of Asian FX still, and the standouts there I think will be the Philippine peso and the Indian rupee. The Philippines is a country where I think inflationary pressures are going to be building again, and I think the central bank will use the exchange rate to tighten, in addition supplemented by rate hikes starting perhaps before the middle of the year.
On risks: A lot of the view, particularly on korea, Singapore, Taiwan and Hong kong, is a U.S./EU story. once we’re over that hurdle then I do think Japan could play a significant spoiler role. Now, I’m not as convinced as many people seem to be that we are going to see enough of a reflationary drive in Japan to get the yen weakening significantly. But I do think that that is a risk. If investors in Japan perceive that the government really is proceeding with a policy to try to weaken the yen as a way to reflate the economy, then that could of course affect pri-vate capital flows, and the yen could weaken significantly, much more than 20 percent or so. That obviously has adverse knock-on to korea and Taiwan, in particular. In terms of risk within Asia, I think Japan emerges as a country that could really disturb things next year.
rob subbaraman, chief economist for asia ex-Japan at nomura in Hong kongOn opportunities: We’re expecting Asia ex-Japan gDP growth for the region overall to pick up slightly from 6.3 to 6.4 percent, but that’s masking growing differentiation within the region. And it comes at a very interesting time because I think investors in Europe and the U.S., in their search for yield, are focused more and more on Asia, and I think there is this risk that they see the region as a homogeneous block, which we would regard as a big mistake.
In terms of China, we see it as a story of two distinct halves. Solid growth of 8.2 percent in the first half but then weaker-than-expected growth in the second half of 7.2. In the second half of the year, we expect heightened finan-cial risks emanating from the shadow banking sector plus inflation rising to over 4 percent resulting in two interest
rate hikes in the second half. outside China, we think growth next year is going to be below par in India, korea, Taiwan, Hong kong and Singapore, but we’re bullish on growth for emerging Southeast Asia. Philippines, Indonesia, we think will grow above 6 percent. Malaysia, Thailand, between 4 to 5 percent.
On risks: Basically we see four risks for Asia. one is kind of recoupling, where the world economy has another severe heart attack and Asia gets hit hard again. That could stem from Europe, for instance. We can’t rule out a China hard landing, and we can’t rule out, on the other side, another surge in food prices. But we would say the biggest risk is Asia overheating. our view is that there’s going to be more quantitative easing around the world. That’s going to push very strong capital inflows to Asia, and we think policy rates in Asia are going to stay very low. That’s going to fuel overheating broadly defined as debt buildup, frothier property markets and ultimately CPI inflation. The risk here is that Asian central banks fall behind the curve and have to catch up with even more aggressive rate hikes eventually.
Hsbc, Deutsche bank, nomura on Economic opportunities, Risks in the Year AheadEconomists from HSBC, Deutsche Bank and Nomura spoke to Scott Johnson about where they see the most economic opportunity in Asia in 2013 and what asset classes or countries may present the most risk.
PERsPEctiVEs By Scott JohnSon
FOR ECONOM
ICS ASIA ONly
1 2 3 4 5 6 7 8 9 10 11 12 13 14 15 16 17 18 19
01.04.13 www.bloombergbriefs.com Bloomberg Brief | Economics Asia 18

bEst oF bloombERg Economists
Asia-based economists michael mcDonough and tamara Henderson each present two of their best pieces of analysis from 2012
sgd Beats cHF as safe Haven from europe crisis — February 2, 2012The Singapore dollar is backed by a massive current-account surplus (19 percent of gDP), bullet-proof banks and a solid AAA-credit rating. Singapore’s central bank is highly reputable, well known for its pre-emptive measures to preserve real returns, while a long history of budget surpluses means there is no adverse incentive for the fiscal authorities to inflate away the real value of its sovereign debt. The Singapore dollar, owing to the city state’s currency regime of a managed float against key trading partners, has the advan-tage against the Swiss franc of providing investors with broad-based exposure to Asia’s populous and fast-growing economies. Singapore’s currency regime also means its dollar is less volatile than most of its counterparts.
—Tamara Henderson
0.55
0.60
0.65
0.70
0.75
0.80
0.85
2006 2007 2008 2009 2010 2011 2012
SGDCHF Cross Rate (Current)
SGDCHF Cross Rate (As of February)
Singapore Outpaced Switzerland as Safe Haven in 2012
Source: Bloomberg
Bank deposits show singapore safe-Haven allure — June 19, 2012Bank deposits have flooded into Singapore, an indication of the city-state’s rising status as a safe haven for global, especially European, investors. Singapore makes an attrac-tive alternative for global investors looking to diversify their holdings. The world’s stron-gest bank for two years running, according to Bloomberg rankings, oversea-Chinese Banking Corporation (oCBC), is Singaporean. Two other Singaporean lenders — United overseas Bank ltd. (No. 7) and DBS group Holdings ltd (No. 8) — are also among the ten strongest banks in the world. The Singapore dollar has been largely insulated against the pickup in deposits, in part because most of the deposit growth has remained in foreign currencies.
— Tamara Henderson
0
1000
2000
3000
4000
5000
6000
1999 2000 2001 2002 2003 2004 2005 2006 2007 2008 2009 2010 2011 2012
Singapore's Foreign Currency Deposit Explosion
Source: MAS
Foreign Currency Deposits Held in Singapore Banks, USD million
yen pressure May remain as BoJ rebuilds credibility — april 30, 2012The Bank of Japan’s ability to weaken the yen and strengthen the Japanese economy rests largely on the success of improving its reputation after the country’s so-called lost decade. The BoJ introduced a 1 percent inflation target in February and expanded its asset-purchase program again last week. Building credibility will depend on whether the central bank can achieve its target and ward off deflation. In the meantime, pressure will likely continue on the yen to appreciate. The BoJ expanded its asset-purchase program by 10 trillion yen on April 27. Still, any near-term success in weakening the yen is unlikely to last, especially as the euro zone slips deeper into recession and global economic growth cools, increasing investors’ appetite for safe-haven assets.
— Michael McDonough
china asymmetrical cut May spur growth, reform — May 24, 2012The rapid slowdown in China may place policy makers between a rock and a hard place as they try to engineer a soft landing without derailing long-term growth. An asymmetrical cut to lending rates that leaves deposit rates unchanged may be their best option. Aggressive easing would likely guarantee near-term stability. Still, without first enacting reforms to rebalance the economy, such as interest-rate liberalization, China may become even more dependent on unsustainable exports and investment for long-term growth. In the short term, a broad rate cut by the Chinese government would also discourage saving and potentially lead to a greater exodus from traditional bank accounts. Chinese investors have been moving out of traditional deposits, with the real yield close to zero.
— Michael McDonough
9,300
9,350
9,400
9,450
9,500
9,550
9,600
9,650
9,700
9,750
80.50
80.60
80.70
80.80
80.90
81.00
81.10
81.20
81.30
81.40
81.50
6:00 7:00 8:00 9:00 10:00 11:00 12:00 13:00 14:00 15:00 16:00
Japanese Yen (ls)Nikkei 225 (rs)
Source: Bloomberg (Hong Kong Time)
CPI data shows 0.2 percent rise y/y ex. fresh food.
Japan's IP growth below estimates at 1.0 percent m/m.
Yen Momentarily Weakens as BOJ Expands Asset-Purchase Program
BOJ expands asset purchase program
1.0%
2.0%
3.0%
4.0%
5.0%
6.0%
7.0%
May-10 Aug-10 Nov-10 Feb-11 May-11 Aug-11 Nov-11 Feb-12 May-12
Spread Between Deposit & Lending RatesChinese 1Y Deposit RateChinese 1Y Swap RateChinese 1Y Lending Rate
Asymmetrical Rate Cut May Prepare China for Broader Reforms
Source: Bloomberg
*Chinese banks derive more than 80 percent of profit from this spread
FOR ECONOM
ICS ASIA ONly
1 2 3 4 5 6 7 8 9 10 11 12 13 14 15 16 17 18 19
01.04.13 www.bloombergbriefs.com Bloomberg Brief | Economics Asia 19


