General Certificate of Education Advanced Subsidiary Examination June 2013 Economics ECON1 Unit 1 Markets and Market Failure Monday 13 May 2013 9.00 am to 10.15 am For this paper you must have: an objective test answer sheet a black ball-point pen an AQA 8-page answer book. You may use a calculator. Time allowed 1 hour 15 minutes Section A (ECON1/1) Answer all questions on your objective test answer sheet. Use a black ball-point pen. Do not use pencil. Do all rough work in this question paper, not on your objective test answer sheet. Section B (ECON1/2) Answer EITHER Context 1 OR Context 2. Use black ink or black ball-point pen. Pencil should only be used for drawing. Write the information required on the front of your answer book. The Examining Body for this paper is AQA. The Paper Reference is ECON1/2. Information The maximum mark for this paper is 75. There are 25 marks for Section A. Each question carries one mark. No deductions will be made for wrong answers. There are 50 marks for Section B. The marks for questions are shown in brackets. You will be marked on your ability to: – use good English – organise information clearly – use specialist vocabulary where appropriate. Advice You are advised to spend no more than 25 minutes on Section A and at least 50 minutes on Section B. ECON1 G/K92229/Jun13/ECON1 6/6/6/6
Transcript
General Certificate of EducationAdvanced Subsidiary ExaminationJune 2013
Economics ECON1Unit 1 Markets and Market Failure
Monday 13 May 2013 9.00 am to 10.15 am
For this paper you must have: an objective test answer sheet a black ball-point pen an AQA 8-page answer book.You may use a calculator.
Time allowed 1 hour 15 minutes
Section A (ECON1/1) Answer all questions on your objective test answer sheet. Use a black ball-point pen. Do not use pencil. Do all rough work in this question paper, not on your objective test answer sheet.
Section B (ECON1/2) Answer EITHER Context 1 OR Context 2. Use black ink or black ball-point pen. Pencil should only be used for drawing. Write the information required on the front of your answer book. The Examining Body for this
paper is AQA. The Paper Reference is ECON1/2.
Information The maximum mark for this paper is 75. There are 25 marks for Section A. Each question carries one mark. No deductions will be made
for wrong answers. There are 50 marks for Section B. The marks for questions are shown in brackets. You will be marked on your ability to: – use good English – organise information clearly – use specialist vocabulary where appropriate.
Advice You are advised to spend no more than 25 minutes on Section A and at least 50 minutes on
Section B.
ECON1G/K92229/Jun13/ECON1 6/6/6/6
2
G/K92229/Jun13/ECON1
Section A: Objective Test
Answer all questions in Section A.Each question carries 1 mark. No deductions will be made for wrong answers.
You are advised to spend no more than 25 minutes on Section A.
For each question there are four alternative responses, A, B, C and D. When you have selected the response which you think is the best answer to a question, mark this response on your objective test answer sheet. If you wish to change your answer to a question, follow the instructions on your
objective test answer sheet.
1 The main economic objective of firms in a market economy is most likely to be the
A achievement of economies of scale.
B maximisation of consumer satisfaction.
C achievement of an efficient allocation of resources.
D maximisation of profits.
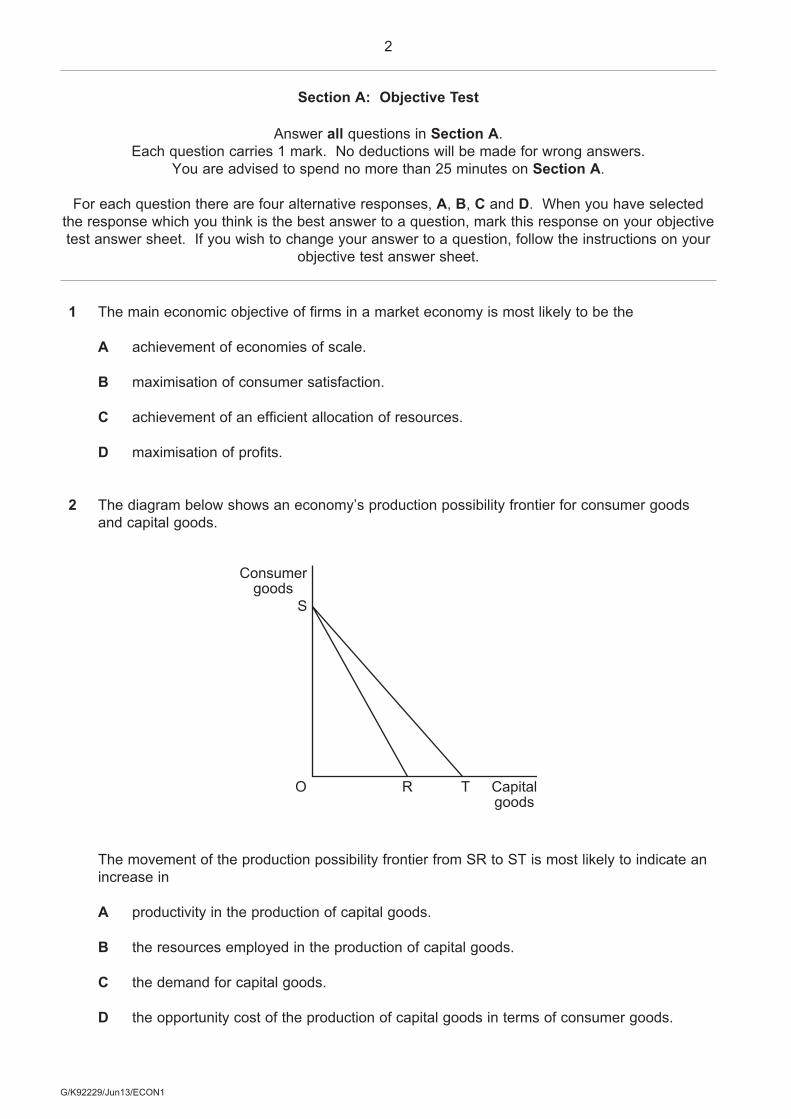
2 The diagram below shows an economy’s production possibility frontier for consumer goods and capital goods.
Consumergoods
S
O R T Capitalgoods
The movement of the production possibility frontier from SR to ST is most likely to indicate an increase in
A productivity in the production of capital goods.
B the resources employed in the production of capital goods.
C the demand for capital goods.
D the opportunity cost of the production of capital goods in terms of consumer goods.
3
G/K92229/Jun13/ECON1
Turn over
3 The price elasticity of supply for most goods is
A zero.
B between zero and –1.
C between –1 and minus infinity.
D positive.
4 The diagrams below show the marginal private benefit (MPB) and marginal social benefit (MSB) curves and the marginal private cost (MPC) and marginal social cost (MSC) curves of the consumption and production of a good.
Which one of the following diagrams, A, B, C or D, correctly shows negative externalities in both the consumption and production of the good?
£
O
A
Output
MSC
MPC
MSB
MPB
£
O
B
Output
MSC
MPC
MSB
MPB
£
O
C
Output
MSC
MPC
MSB
MPB
£
O
D
Output
MSC
MPC
MSB
MPB
4
G/K92229/Jun13/ECON1
5 Which one of the following is most likely to lead to greater labour productivity in an industry?
A An increase in market demand
B A fall in wages in the industry
C An increase in the number of firms in the industry
D An increase in capital investment in the industry
6 The table below indicates various types of market failure, the consequence of each of these failures and examples of possible intervention.
Situation Type of market failure
Consequence of market failure Example of intervention
A Factor immobility Inefficient allocation of resources Increase in indirect taxation
B Public goods Not provided Government provision
C Demerit goods Over-consumed Maximum price controls
D Merit goods Under-provided Minimum price controls
In which one of these situations is the example of intervention most appropriate?
A Situation A
B Situation B
C Situation C
D Situation D
5
G/K92229/Jun13/ECON1
Turn over
7 The existence of scarcity in an economy implies that
A there are no free goods.
B there are no public goods.
C individuals must make choices.
D there has been a misallocation of resources.
8 An increase in UK incomes leads to an increase in demand for holidays abroad and a decrease in demand for holidays in the UK. It can therefore be concluded that
A holidays in the UK are an inferior good while holidays abroad are a normal good.
B the demand for holidays abroad is income elastic while the demand for holidays in the UK is income inelastic.
C there is a negative cross price elasticity of demand between holidays abroad and holidays in the UK.
D holidays abroad have a high price elasticity of demand while holidays in the UK have a low price elasticity of demand.
9 The UK Government currently subsidises the building of social housing. Social housing is provided to low income households at rents which are lower than the free market rent.
Which one of the following would provide an economic justification for these subsidies?
A The unequal distribution of income and wealth caused by the free market results in an unsatisfactory allocation of resources.
B Subsidising low cost housing reduces inequalities in the distribution of wealth.
C Social housing is a public good because it is both non-rival and non-excludable.
D There is market failure in the housing market because of the existence of missing markets.
6
G/K92229/Jun13/ECON1
10 Which one of the following best describes the relationship between the demand for air travel and the demand for airline pilots?
A Composite demand
B Derived demand
C Joint demand
D Complementary demand
11 The diagram below shows the marginal private benefit (MPB) and marginal social benefit (MSB) curves and the marginal private cost (MPC) and marginal social cost (MSC) curves for a merit good.
£
MPC = MSC
MPB
MSB
F
E
O OutputH J
In the absence of government intervention in this market, a misallocation of resources is likely to occur because
A the free market price is too low.
B there is over-production of the good, of HJ.
C the free market output is too high.
D there is under-consumption of the good, of HJ.
7
G/K92229/Jun13/ECON1
12 The diagram below shows the demand (D) and supply (S) curves for cigarettes.
O 50 60
S2
S1
9
D
Quantity
Price ofcigarettes
(£)
65
The government imposes an indirect tax on cigarettes which shifts the supply curve from S1 to S2. Which one of the following, A, B, C or D, shows the share of the total tax revenue paid by producers and the share paid by consumers?
Producers (£) Consumers (£)
A 50 150
B 150 50
C 0 200
D 450 360
13 When money is used as a medium of exchange,
A barter or swapping of goods is likely to become more common.
B trade is likely to increase.
C the relative prices of goods never change.
D specialisation and the division of labour are made more difficult.
Turn over
8
G/K92229/Jun13/ECON1
14 The table below shows the world prices ($/tonne) of various fruits for a two-year period.
Fruit Year 1 Year 2
Oranges 150 80
Apples 200 140
Pears 80 70
Grapes 250 200
Which one of the following is supported by the data?
A The earnings of orange growers will have decreased between Year 1 and Year 2 if the demand for oranges is price elastic.
B The trend in the price of apples between Year 1 and Year 2 will encourage apple growers to increase output.
C The price elasticity of demand is lowest for pears.
D Total revenue from the sale of grapes will have fallen between Year 1 and Year 2 if the demand for grapes is price inelastic.
15 A firm increases the size of its business. As a result, its average costs fall because of better utilisation of its factory and the lower cost of buying advertising space. The firm therefore experiences greater
A technical and marketing economies of scale.
B purchasing and marketing economies of scale.
C financial and purchasing economies of scale.
D financial and technical economies of scale.
16 Which one of the following statements about market failure is correct?
A Small firms are less efficient than large firms due to diseconomies of scale.
B The existence of free riders will result in the over-production of public goods.
C The social benefits of some private goods exceed the private benefits.
D Markets do not supply merit goods.
9
G/K92229/Jun13/ECON1
Turn over
17 A misallocation of resources is most likely to occur in monopoly if
A other firms enter the industry.
B higher prices are charged than under competitive conditions.
C market output increases.
D there are economies of scale.
18 The diagram below shows the marginal private benefit (MPB) and marginal social benefit (MSB) curves and the marginal private cost (MPC) and marginal social cost (MSC) curves for Good X produced by a firm. The free market equilibrium position is at point J.
O
H
MPB = MSB
MSC
MPC
Output
£
G
FE
J
Which one of the following government policies should be used to correct the market failure that exists at point J?
A A per unit subsidy of FH
B A per unit tax of FG
C A per unit subsidy of EG
D A per unit tax of EG
10
G/K92229/Jun13/ECON1
19 A product has a price elasticity of demand of –0.5. If the price of this product increases by 10%, then total revenue will
A rise by more than 10%.
B rise by less than 10%.
C fall by more than 10%.
D fall by less than 10%.
20 An inferior good always has
A positive price elasticity of demand.
B many substitutes.
C negative cross elasticity of demand.
D negative income elasticity of demand.
21 The table below indicates the average price of clothing in price index number form.
Year Price Index
2008 100
2009 105
2010 120
2011 110
2012 125
Which one of the following can be deduced from the data above?
A The price of clothing rose throughout the whole period 2008 to 2012.
B Compared with 2012, the price of clothing was 20% cheaper in 2008.
C Revenue from the sale of clothing fell in 2011.
D Between 2010 and 2011, the price of clothing fell by 10%.
11
G/K92229/Jun13/ECON1
Turn over
22 Which one of the following is most likely to be an example of the immobility of a factor of production? Workers’ unwillingness to
A change jobs.
B accept lower wages.
C improve productivity.
D attend training courses.
23 Market failure arises when
A prices rise in response to excess demand.
B no account is taken of positive externalities in consumption.
C firms are unprofitable and go out of business.
D costs increase as firms expand their production.
24 The diagram below illustrates the market demand (D) and supply (S) curves for a good. The production of the good creates a negative externality.
O Quantity
D
S
Q1Q2
P2
P1
P3
Price
To reduce production and consumption of the good to OQ2, the government could impose a
A price ceiling of OP3.
B tax of P2P3.
C minimum price of OP2.
D tax of P2P1.
12
G/K92229/Jun13/ECON1
25 A government wishing to reduce firms’ carbon emissions through the use of pollution permits may fail to achieve such a reduction because
A firms would need permits if their production processes pollute the environment.
B firms which do not use all of their permits can sell some of them to other firms.
C permits issued to firms do not impose strict enough limits on their carbon emissions.
D firms improve their technology to reduce the number of permits they require.
QUESTION 25 IS THE LASTQUESTION IN SECTION A
On your answer sheetignore rows 26 to 50
Turn to page 14 for Section B
13
G/K92229/Jun13/ECON1
Turn over
Turn over for Section B
14
G/K92229/Jun13/ECON1
Section B: Data Response
Answer EITHER Context 1 OR Context 2.You are advised to spend at least 50 minutes on Section B.
EITHER Total for this Context: 50 marks
Context 1
THE PROVISION OF HIGHER EDUCATION IN THE UK
Study Extracts A, B and C, and then answer all parts of Context 1 which follow.
Extract A: Students in higher education in the UK in thousands, by type of course, 1980/1981 and 2008/2009
Undergraduate
Full-time 473 1328
Part-time 247 686
Postgraduate
Full-time 62 269
All higher education 827 2557
Part-time 45 274
1980/81 2008/09
Source: Social Trends 41, 2011
Extract B: Students should not have to pay fees for attending university
Universities need more income if they are to continue to provide quality education and to compete in international education markets. Where is this money to come from?
Some suggest that universities should be fi nanced, as they were before 1998, largely through government spending and taxation. Subsidies were paid directly to universities; students received grants from government to help fi nance their living costs. UK students did not have to pay tuition fees.
Others argue that universities should be fi nanced by increasing the amount of money they receive from selling their research to commercial companies. However, even in the case of the most successful universities in the USA, business provides only about 1% to 2% of university income. Less successful American universities raise much less money in this way.
Another option is to persuade rich individuals and companies to donate money to universities. Top American universities such as Harvard and Yale are very successful in appealing for gifts of this kind. Even so, US universities fail to raise suffi cient gift money to pay for most of the education they provide. Britain is very different from America and lacks a culture of charitable giving to universities.
1
5
10
15
Source: news reports, 2012
15
G/K92229/Jun13/ECON1
Turn over
Extract C: Should we charge students higher fees for attending university?
Since 1998, UK students have been charged tuition fees to help pay for their university courses. The fees were raised signifi cantly in 2012. Supporters of student fees believe that fee income provides the best way of fi nancing the growth of higher education. They argue that the lifetime return on a university degree is huge. The average graduate earns £160 000 more than the average non-graduate over a lifetime, as a result of gaining a degree. Therefore, those who personally profi t from education should contribute more towards the cost of providing the service. Without the better-off paying fees, the argument goes, university remains a highly subsidised middle-class privilege. They conclude that this cannot continue and that politicians must give universities the freedom to charge higher fees.
However, tuition fees are often attacked on the grounds that they deter young people, especially those from poor families, from going to university. Nevertheless, until 2011 at least, despite fees being charged, university applications continued to increase across all income groups.
The debate is about more than paying for university education. It centres on the nature of the society in which we want to live. Some economists argue that education is a service which is essential to any society which claims to be civilised. They also believe that education is a service which markets tend to under-provide.
1
5
10
15
Source: news reports, 2012
0 1 Defi ne the term ‘subsidies’ (Extract B, line 4). (5 marks)
0 2 Using Extract A, identify two significant points of comparison between the number of students on full-time courses and those on part-time courses over the period shown.
(8 marks)
0 3 With the help of an appropriate diagram, explain the view of education as a ‘…service which markets tend to under-provide’ (Extract C, line 18). (12 marks)
0 4 Using the data and your own economic knowledge, assess the case for fi nancing universities mainly through charging fees to their students. (25 marks)
Turn over for Context 2
16
G/K92229/Jun13/ECON1
Do not answer Context 2 if you have answered Context 1.
Total for this Context: 50 marks
OR
Context 2
MARKETS FOR SMARTPHONES
Study Extracts D, E and F, and then answer all parts of Context 2 which follow.
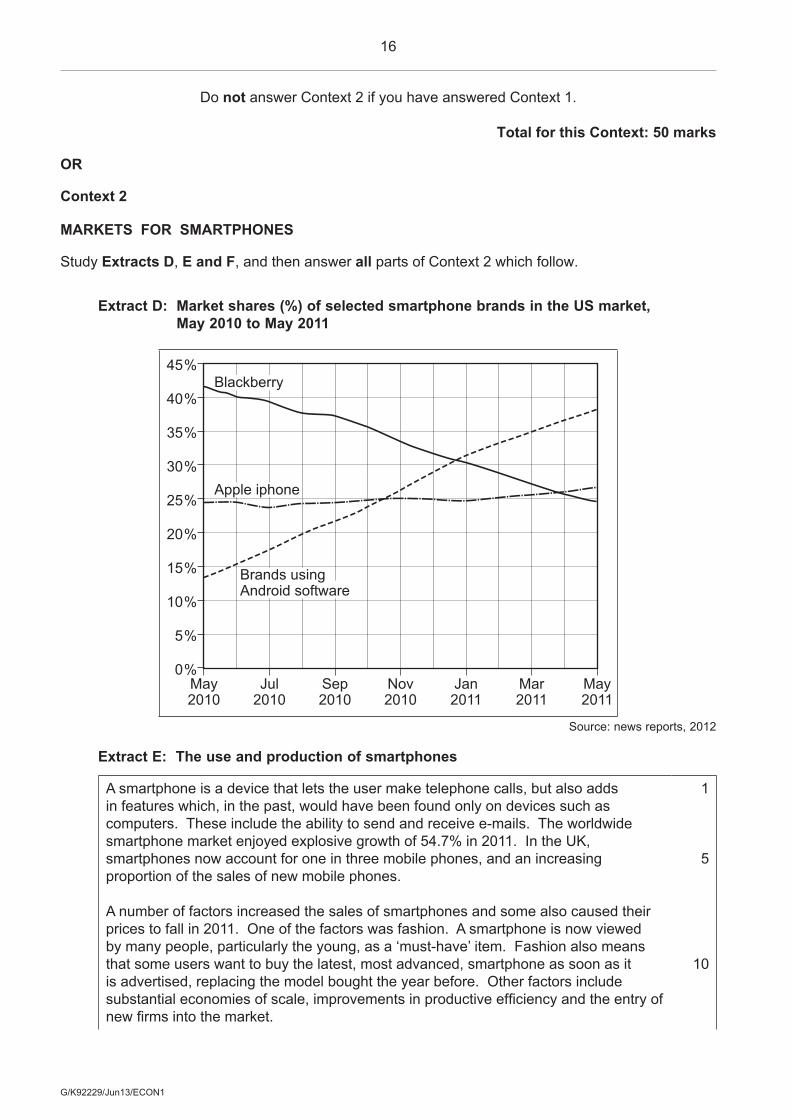
Extract D: Market shares (%) of selected smartphone brands in the US market, May 2010 to May 2011
0 %May2010
Jul2010
Sep2010
Nov2010
Jan2011
Mar2011
May2011
5 %
10 %
15 %
20 %
25 %
30 %
35 %
40 %
45 %
Brands usingAndroid software
Blackberry
Apple iphone
Source: news reports, 2012
Extract E: The use and production of smartphones
A smartphone is a device that lets the user make telephone calls, but also adds in features which, in the past, would have been found only on devices such as computers. These include the ability to send and receive e-mails. The worldwide smartphone market enjoyed explosive growth of 54.7% in 2011. In the UK, smartphones now account for one in three mobile phones, and an increasing proportion of the sales of new mobile phones.
A number of factors increased the sales of smartphones and some also caused their prices to fall in 2011. One of the factors was fashion. A smartphone is now viewed by many people, particularly the young, as a ‘must-have’ item. Fashion also means that some users want to buy the latest, most advanced, smartphone as soon as it is advertised, replacing the model bought the year before. Other factors include substantial economies of scale, improvements in productive effi ciency and the entry of new fi rms into the market.
1
5
10
17
G/K92229/Jun13/ECON1
Smartphones are assembled from a very large number of components produced in low-cost factories located mostly in Asia. Some people believe that the main reason why manufacturing costs are low stems from the low wages paid to Asian workers.
Smartphone manufacturers, with their headquarters in the USA and other rich countries, have been accused of exploiting the workers in poor countries whom they employ to make their phones.
15
Source: news reports, 2012
Extract F: Mobile phone use and possible health risks
The World Health Organisation (WHO) has stated that there “could be some risk” of mobile phone use causing cancer. Some national radiation advisory authorities have recommended measures to minimise exposure of their citizens to radiation emitted by mobile phones. However, an assessment by a European Commission Scientific Committee concluded that “exposure is unlikely to lead to an increase in cancer in humans”.
Another area of concern is radiation emitted by the broadcasting masts which provide the link to and from mobile phones. In contrast to mobile handsets, this radiation is emitted continuously. People who spend long periods of time a short distance from active telecommunications equipment may be at risk of much greater exposure to radiation than the general population.
In February 2009, a French telecom company was ordered to take down a mobile phone mast due to uncertainty about its effect on health. However, the general presumption taken by courts of law is that mobile phone users themselves, and not governments, should take responsibility for avoiding health risks. They should do this, for example, by using hands-free devices to decrease radiation to the head. The use of mobile phones when driving can also cause accidents.
1
5
10
15
Source: news reports, 2009 –2012
0 5 Defi ne the term ‘productive effi ciency’ (Extract E, line 12). (5 marks)
0 6 Using Extract D, identify two significant points of comparison between the market shares of smartphone brands over the period shown. (8 marks)
0 7 With the help of the information in Extract E, explain two possible reasons for the change in the sales of smartphones in 2011. (12 marks)
0 8 Using the information in the data and your own economic knowledge, evaluate the economic case for and against governments attempting to influence how mobile phones are manufactured and used. (25 marks)