Extended Summary 本文は pp.2–9 The Suppressing Effect of Voltage Distortion by the Fifth Harmonic Current at the Supply Point for Customers with a Middle Voltage Power Supply Kenji Yukihira Member (CRIEPI, [email protected]) Naotaka Okada Member (CRIEPI, [email protected]) Keywords: harmonics, limit value, customer, three-phase equipment, phase angle Because the limit values on the harmonic currents that can be emitted by customers of 6.6 kV and higher power supplies are ap- plied to large equipment (those drawing more than 20 A), they typ- ically apply to three-phase equipment. Transformers in the range of 75kVA to 500kVA are required by the Japanese Industrial Standard (JIS) to have a star-delta con- nection. Single-phase equipment is considered to be equivalent to three-phase equipment with a delta-delta connection transformer in the electric power distribution system, because many home appli- ances are connected phase-to-phase. Therefore, harmonic currents introduced by three-phase equipment and single-phase equipment cancel each other out. The authors reached the following conclusions by analyzing har- monic voltage and current data. (1) The limit values for customers with high-voltage power supplies may be unnecessary, because the harmonic currents from three-phase equipment reduce the harmonic voltages. Figure 1 shows the relative frequency of the phase angle of the fifth-harmonic current related to the fundamental phase voltage. The phase angles of single-phase equipment mainly appear between 150 and 180 de- grees, and those of three-phase equipment mainly appear between 300 and 330 degrees. As these currents are about 180 degrees out of phase, they should cancel each other out. (2) The harmonic voltages are generally produced by single- phase equipment. Figure 2 shows the relative frequency of the phase angles of the fifth harmonic voltage related to the fundamental phase voltage. The phase angle of the fifth harmonic voltage appears be- tween -30 and +30 degrees. This indicates that the 5th harmonic voltage on the 6.6 kV distribution lines in Japan is produced by single-phase equipment. Fig. 1. Relative frequency of the phase angle of the 5th harmonic current related to the fundamental phase volt- agevoltage (3) Figure 3 shows the relative frequency of the phase angles of the fifth-harmonic current related to the fifth-harmonic voltage based on the measurement of 45 customers that had installed a ca- pacitor and a reactor and 23 customers that had installed a capacitor without a reactor. The current of 45 customers, each with an in- stalled capacitor and reactor, mainly appears between 270 and 300 degrees. The fifth harmonic current operates to reduce the fifth har- monic voltage in the 6.6 kV distribution lines. On the other hand, the current of 23 customers with an installed capacitor, but without a reactor, mainly appears between 60 and 90 degrees. The current increases the fifth harmonic voltage. These characteristics of the phase of the fifth harmonic current do not depend upon the amount of the fifth harmonic current emitted by the customer. Therefore, we conclude that adding a series reactor to the capaci- tors to improve the power factor is a necessary and sufficient method for suppression of the fifth harmonic voltage. Fig. 2. Relative frequency of the phase angle of the 5th harmonic voltage related to the fundamental phase volt- age Fig. 3. Relative frequency of the phase angle of the 5th harmonic current related to the 5th harmonic voltage –1–
Transcript
Extended Summary 本文は pp.2–9
The Suppressing Effect of Voltage Distortion by the Fifth HarmonicCurrent at the Supply Point for Customers
Because the limit values on the harmonic currents that can beemitted by customers of 6.6 kV and higher power supplies are ap-plied to large equipment (those drawing more than 20 A), they typ-ically apply to three-phase equipment.
Transformers in the range of 75 kVA to 500 kVA are requiredby the Japanese Industrial Standard (JIS) to have a star-delta con-nection. Single-phase equipment is considered to be equivalent tothree-phase equipment with a delta-delta connection transformer inthe electric power distribution system, because many home appli-ances are connected phase-to-phase. Therefore, harmonic currentsintroduced by three-phase equipment and single-phase equipmentcancel each other out.
The authors reached the following conclusions by analyzing har-monic voltage and current data.
( 1 ) The limit values for customers with high-voltage powersupplies may be unnecessary, because the harmonic currents fromthree-phase equipment reduce the harmonic voltages. Figure 1shows the relative frequency of the phase angle of the fifth-harmoniccurrent related to the fundamental phase voltage. The phase anglesof single-phase equipment mainly appear between 150 and 180 de-grees, and those of three-phase equipment mainly appear between300 and 330 degrees. As these currents are about 180 degrees out ofphase, they should cancel each other out.
( 2 ) The harmonic voltages are generally produced by single-phase equipment. Figure 2 shows the relative frequency of the phaseangles of the fifth harmonic voltage related to the fundamental phasevoltage. The phase angle of the fifth harmonic voltage appears be-tween −30 and +30 degrees. This indicates that the 5th harmonicvoltage on the 6.6 kV distribution lines in Japan is produced bysingle-phase equipment.
Fig. 1. Relative frequency of the phase angle of the 5thharmonic current related to the fundamental phase volt-agevoltage
( 3 ) Figure 3 shows the relative frequency of the phase anglesof the fifth-harmonic current related to the fifth-harmonic voltagebased on the measurement of 45 customers that had installed a ca-pacitor and a reactor and 23 customers that had installed a capacitorwithout a reactor. The current of 45 customers, each with an in-stalled capacitor and reactor, mainly appears between 270 and 300degrees. The fifth harmonic current operates to reduce the fifth har-monic voltage in the 6.6 kV distribution lines. On the other hand,the current of 23 customers with an installed capacitor, but withouta reactor, mainly appears between 60 and 90 degrees. The currentincreases the fifth harmonic voltage. These characteristics of thephase of the fifth harmonic current do not depend upon the amountof the fifth harmonic current emitted by the customer.
Therefore, we conclude that adding a series reactor to the capaci-tors to improve the power factor is a necessary and sufficient methodfor suppression of the fifth harmonic voltage.
Fig. 2. Relative frequency of the phase angle of the 5thharmonic voltage related to the fundamental phase volt-age
Fig. 3. Relative frequency of the phase angle of the 5thharmonic current related to the 5th harmonic voltage
– 1 –
Extended Summary 本文は pp.10–18
Assessment of Energy Saving and CO2 Mitigation Potential by ElectricVehicle and Plug-in Hybrid Vehicle under Japan’s Power Generation Mix
Ryoichi Komiyama Member (The University of Tokyo)
Yasumasa Fujii Member (The University of Tokyo)
Keywords: electric vehicle, plug-in hybrid vehicle, optimal power generation mix model, vehicle penetration model
1. IntroductionThis paper evaluates the impact of an extensive introduction of
electric vehicle (EV) and plug-in hybrid vehicle (PHEV) on energysupply mix in Japan. Energy consumption in Japan’s transport sec-tor has been dominated by petroleum, and CO2 emissions in thissector accounts for twenty percent of Japan’s carbon dioxide (CO2)emissions. Therefore, the deployment of clean energy vehicles, suchas EV and PHEV, are expected to play a significant role in tacklingwith energy security and environmental concerns. On these back-grounds, we develop energy system model, explicitly analyzing theimpact of EV and PHEV introduction into daily electric load curveconsidering its specific electricity charging profile by 10 minutes in365 days.
2. MethodologyFor assessing energy and environmental benefits of EV and
PHEV, we develop energy system model integrating optimal powergeneration mix model and vehicle penetration model, consideringoptimal overnight charging profile of electricity derived from EVand PHEV.
Through the mutual feedback of electricity price and electricitydemand of EV and PHEV among both models, vehicle penetrationmodel yields long-term perspective on vehicle penetration mix asshown in Fig. 1 and optimal power generation mix model identifiesthe best mix of power generation and optimal charging pattern ofEV and PHEV as illustrated in Fig. 2.
Sensitivity analysis is conducted on EV and PHEV penetration
Fig. 1. Passenger vehicle ownership in Japan
Fig. 2. Monthly power generation profile in May 2050 at Advance case in vehicle penetration (Nuclear:Decommission after 40 years, CO2 regulation)
(Base, Advance), CO2 regulation (No regulation, 50% reduction)and Nuclear (Status quo, Decommission after 60 years and 40 yearsoperation).
3. Estimated ResultsCalculated results suggest that massive EV and PHEV penetra-
tion serves as energy saving measure in Japan’s whole energy sys-tem, due to significant petroleum reduction exceeding the growth offuel input into power generation sector derived from significant EVand PHEV penetration.
Massive EV and PHEV deployment is estimated to contribute toCO2 mitigation of the energy system as well. Evaluating CO2 emis-sions per mileage by automobile, however, carbon emissions permileage of EV is almost equivalent to that of gasoline hybrid ve-hicle (HEV) in the case of decommissioning nuclear after 40 yearsoperation, as shown in Fig. 3, which eventually causes higher carbonintensity of electricity supply.
This paper estimates that EV and PHEV penetration might pro-vide beneficial effect on energy saving and CO2 mitigation in wholeenergy system. It is also revealed in this paper, however, that CO2
regulation and decommission of nuclear cause increase in electricityprice and eventually decrease in EV and PHEV introduction, con-sequently suppressing petroleum demand reduction through thoseadvanced vehicles. These calculated results imply that energy andenvironmental policy in power sector potentially has inter-sectoralimpact on transport sector.
Fig. 3. CO2 per mileage in 2050 at Advance case invehicle penetration
– 2 –
Extended Summary 本文は pp.19–25
Capacity Planning and Economical Evaluation of a RenewablePower System for Remote Island
Zhuomin Zhou Member (National Institute of Advanced Industrial Science and Technology, [email protected])
Tetsuhiko Maeda Senior Member (National Institute of Advanced Industrial Science and Technology)
Masayoshi Ishida Member (University of Tsukuba)
Keywords: remote island, renewable power system, hydrogen storage, capacity planning, economical evaluation
With the shutdown of many nuclear power plants after the GreatEast Japan Earthquake, how to meet the future power demand isactively discussed in Japan. In the medium- and long-term, it is im-portant to speed up the introduction of renewable energy. In general,it’s easier to introduce renewable energy to remote islands, becauserenewable power system became more economical competitive toconventional power system (such as diesel engine power generation,usually with a high fuel cost) in remote islands. To prompt the intro-duction of renewable energy in remote islands, detailed economicalevaluation, advantage and disadvantage evaluations are necessary.This paper presents capacity planning and economical evaluation ofa renewable power system proposed for Okushiri Island, which is aremote island in the southwest of Hokkaido. Figure 1 shows basicconfiguration of the renewable power system. In this system, thepower demand is mainly provided by photovoltaic (PV), wind tur-bine (WT). Batteries (BA) are used as short time energy storage, andhydrogen storage system (composed of water electrolyzer (WE), hy-drogen storage (TK), and fuel cell (FC)) is used as long time energystorage here. Optimal capacities of these power sources are thosemeet the required supply reliability, with the lowest cost.
In order to evaluate the supply reliability and economy, evaluationindexes are defined respectively as follow:
( 1 ) Loss of power supply reliability (LPSP):
LPSP =Annual power shortageAnnual power demand
( 2 ) Levelized Cost of Energy (LCE):
LCE =Annual system costAnnual power usage
Fig. 1. Configuration of the system
As the first step in the capacity planning, mathematical modelsfor characterizing PV, WT, BA, WE, FC, and TK are explained.The second step is to optimize the capacities of the power sourcesaccording to the LPSP and the LCE concepts. The configurations,which meet the required LPSP with the lowest LCE, give the optimalchoices. These calculations are carried out with hourly meteorolog-ical data and energy demand data of Okushiri Island.
A capacity planning and economical evaluation result is shownin Fig. 2. We can see that higher power supply reliability meanshigher cost. With the increasing of LPSP, LCE fall down quicklyat first because of the decreasing of capacities of TK and FC. How-ever, When LPSP > 0.02, the decreasing of LCE became very slow.When LPSP < 0.02, system with hybrid storage (combination ofbattery and hydrogen storage) is the best choice with lowest cost.When LPSP > 0.02, system with battery only storage get the lowestLCE.
Fig. 2. Result of Capacity planning and Economicalevaluation (BOS: Balance of system, MNT: Mainte-nance)
– 3 –
Extended Summary 本文は pp.26–36
Improvement of Transient Stability and Short-Term Voltage Stability byRapid Control of Batteries on EHV Network in Power System
Kenichi Kawabe Member (The University of Tokyo)
Akihiko Yokoyama Senior Member (The University of Tokyo)
Keywords: power system, emergency control, short-term voltage stability, transient stability, battery energy storage system, FACTSdevices
Recent trends towards deregulation in an electrical power sec-tor and a large penetration of renewable energy resources increaseuncertainty in the power system operations, which may lead to dete-rioration of the power supply reliability. Effective utilization of theexisting transmission networks with an advanced emergency con-trol scheme can be a promising approach in terms of economic effi-ciency and robustness for the uncertainty. Development of the newemergency control scheme applicable to the future grid can be moreeffective by utilizing advanced electrical power controllers availablein the future grid. BESS (battery energy storage system) is one ofthe attractive equipment for the emergency control since BESSs willbe installed on EHV (extra high voltage) networks for demand andsupply matching.
In this paper, use of BESSs is studied for the improvement ofshort-term voltage stability from the view point of the voltage con-trol. Active and reactive power exchanges by the BESS are tar-gets for the emergency control. Based on the stabilizing controlscheme proposed in our previous research to improve transient sta-bility, a new control scheme is developed considering a finding thatthe short-term voltage stability is closely related to the angle sta-bility. The new control scheme changes active and reactive powerexchange between the BESSs and the grid to shift the time deriva-tive value of the stability indices, an energy function of the powersystem and rotor speed of the critical generator, into a desirable di-rection for the stability enhancement. In this paper, an additionalcontrol system that limits active and reactive power absorption fromthe grid is applied to the stabilizing control system since the powerabsorption drops the system voltages.
Numerical simulations are conducted on two test systems, wherea part of the loads are modified as induction motor loads, to verifythe effectiveness of the proposed control system of BESSs for theimprovement of the short-term voltage stability. The results on theIEEJ west 10-machine test system are shown in Figs. 1–3. MultipleBESSs are assumed to be installed at load buses. Figures 1 and 2show comparison of generator rotor angles and bus voltages be-tween the cases without and with control of the BESSs, respectively,under a large-capacity generator trip at G3. The comparison of con-trol action of a BESS at bus 2 is shown in Fig. 3. As shown in theresults, control of the BESSs by the proposed control scheme pre-vents the immediate system collapse. It enables the system operatorto add transmission capacitor banks several seconds after the contin-gency. The active and reactive powers are injected during the periodwhere each control action is effective for the improvement of thetransient stability. Therefore, the control action is effective not onlyfor the prevention of voltage collapse but also for the suppressionof the rotor angle oscillation as seen from Fig. 1. The robustness ofthe proposed method is also checked by analyzing other generatoroutages. As shown in Table 1, the control of BESSs can improvethe system stability under all the fault cases assumed here.
(a) Without BESSs (b) With BESSs
Fig. 1. Comparison of rotor angles
(a) Without BESSs (b) With BESSs
Fig. 2. Comparison of bus voltages
(a) Without BESSs (b) With BESSs
Fig. 3. Comparison of control action of a BESS at bus 2
Table 1. Results of dynamic simulations under genera-tor outages with and without control of BESSs
– 4 –
Extended Summary 本文は pp.37–44
Estimation Methods of Short Circuit Current using Normal PMUMeasurements and Field Testing
Suresh Chand Verma Senior Member (Chubu Electric Power Co., Inc., [email protected])
Yoshiki Nakachi Member (Chubu Electric Power Co., Inc., [email protected])
Yoshihiko Wazawa Member (Chubu Electric Power Co., Inc., [email protected])
Keywords: phasor measurement unit (PMU), analog simulator, reference phase, outlier filter, power system monitoring, short circuitcurrent
1. IntroductionThis paper proposes estimation methods of short circuit current
using phasor measurement unit (PMU) measurements (phasors).The methods follow the basic notion of representing the source sideof a power system by an equivalent circuit with a voltage behindback impedance, and employ a set of voltage and current phasorsmeasured at substations during the normal variation of loads in theirestimation. In order to improve the estimation accuracy of the pro-posed methods, the concept of using the changes between the con-secutive phasors is introduced. Furthermore, to make the methodsapplicable to the real world system, a reference phasor concept toremove the effects of system wide frequency variations and a filter-ing process to filter out the outlier phasors, are proposed and im-plemented. The validity and effectiveness of the proposed methodswere checked and confirmed using experiments and field tests.
2. Short Circuit Estimation MethodThe main steps of the proposed short circuit estimation method
are described as follows;(S1) Measure voltage and current phasors during natural load
variation using PMU.(S2) Remove the system wide frequency variation from a set of
coherent phasors using a system phasor which is measured at theupper power system.
(S3) Prepare a set of coherent phasors using a reference pha-sor which is selected from measured phasors at multiple measuringpoints while filtering out the outliers.
(S4) Estimate short circuit impedance employing a least squareor a covariance approach (referred to below as dLS or dCV) onthe set of coherent phasors in step S3. In this step, the differencebetween two consecutive measured phasors is used to estimate the
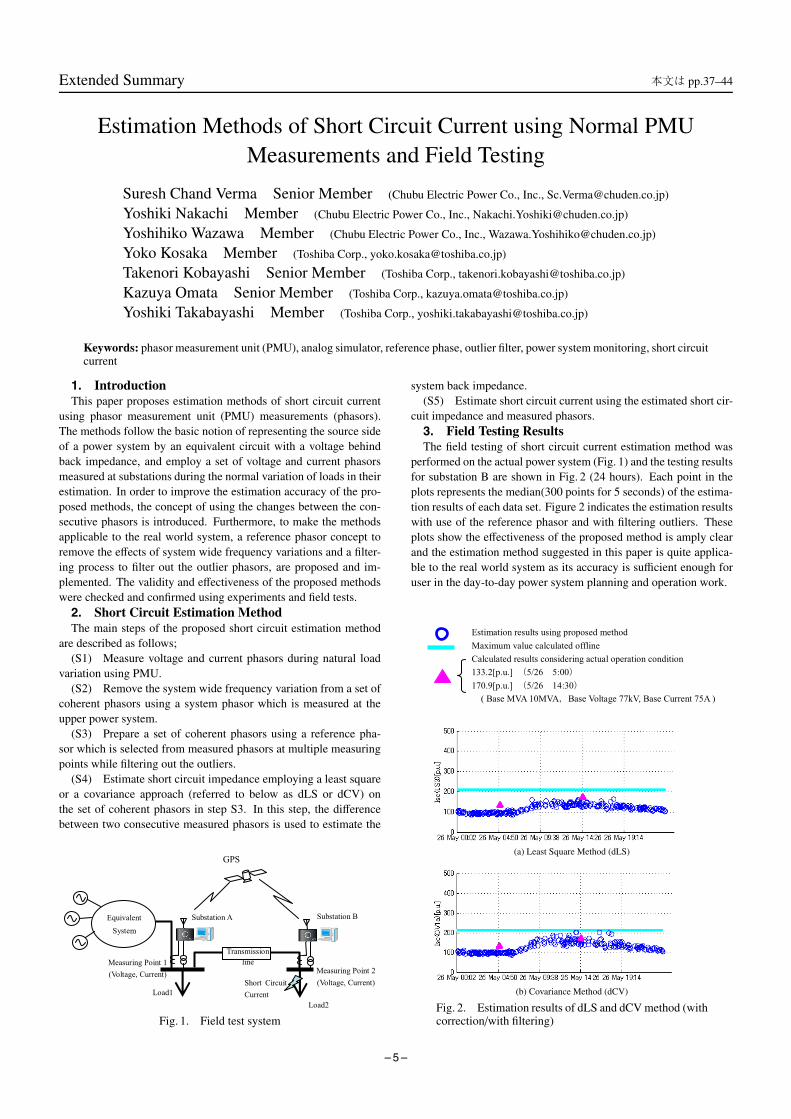
Fig. 1. Field test system
system back impedance.(S5) Estimate short circuit current using the estimated short cir-
cuit impedance and measured phasors.3. Field Testing ResultsThe field testing of short circuit current estimation method was
performed on the actual power system (Fig. 1) and the testing resultsfor substation B are shown in Fig. 2 (24 hours). Each point in theplots represents the median(300 points for 5 seconds) of the estima-tion results of each data set. Figure 2 indicates the estimation resultswith use of the reference phasor and with filtering outliers. Theseplots show the effectiveness of the proposed method is amply clearand the estimation method suggested in this paper is quite applica-ble to the real world system as its accuracy is sufficient enough foruser in the day-to-day power system planning and operation work.
(a) Least Square Method (dLS)
(b) Covariance Method (dCV)
Fig. 2. Estimation results of dLS and dCV method (withcorrection/with filtering)
– 5 –
Extended Summary 本文は pp.45–55
Control of Multistage SVRs using Voltage Sensor in Distribution Systemwith Large Amount of Photovoltaic Generations
Shinya Sekizaki Student Member (Nagoya Institute of Technology, [email protected])
Mutsumi Aoki Member (Nagoya Institute of Technology)
Hiroyuki Ukai Member (Nagoya Institute of Technology)
Shunsuke Sasaki Non-member (Chubu Electric Power Co., Inc.)
Takaya Shigetou Member (Chubu Electric Power Co., Inc.)
Keywords: voltage control, SVR, photovoltaic generation system, PV, distribution system
1. IntroductionRecently, for reducing greenhouse gas emissions, Photovoltaic
generation (PV) is being focused on in Japan. However, since anoutput of PV depends on weather conditions and climate condi-tion may change rapidly or randomly, voltage in distribution sys-tem with many PVs will fluctuate. By contrast, Step Voltage Regu-lator (SVR), which is located on distribution line to keep voltagewithin adequate range, has time delay to operate against voltagechange. Hence, SVR could not prevent voltage deviation from ade-quate range when a large amount of PVs are connected to distribu-tion network. From this point of view, several novel equipment thatcontrol voltage flexibility such as Static Var compensator (SVC) andBattery are being noted lately. Although, this kind of new deviceis usually expensive and huge cost is necessary to introduce thesedevices into many distribution systems. It is necessary to managevoltage properly using established device to control voltage includ-ing Load Ratio control Transformer (LRT) and SVR over the nextdecade. In this paper, the authors focused on SVR and propose theeffective control method of SVR to manage voltage fluctuated byPV.
2. Proposed MethodAs mentioned above, SVR has time delay against voltage fluctu-
ation caused by PV. For this reason, SVR could not manage voltagewithin adequate range in case that a large amount of PVs are con-nected to distribution system. Furthermore, SVR could cause volt-age deviation due to its operation. Figure 1 shows voltage deviationcaused by SVR. In Fig. 1, SVR changes its tap position frequentlyto keep voltage within adequate range fluctuated by PV. However,due to delay of SVR, voltage deviation is occurred after the opera-tion. The authors call this phenomenon as Repeat Operation of SVR
Fig. 1. Voltage deviation caused by ROS
(ROS). ROS is the main cause of voltage deviation and it is neces-sary to restrain ROS to prevent voltage deviation. In this paper, theauthors expand the dead band of SVR to prevent ROS.
In order to manage voltage using established device, it is assumedthat SVR and restricted communication are available in this paper.Hence, SVR operates based on self-terminal information and lim-ited information obtained from voltage sensor. SVR acquires volt-age information from voltage sensor and calculates the relation be-tween voltage and sending active power of SVR using least squaremethod like Fig. 2. As a result, SVR can estimate voltage on distri-bution line and expand its dead band properly.
3. Case StudyNumerical simulation is performed to confirm the effectiveness
of proposed method. In simulation, a large amount of PVs are con-nected to distribution system and voltage fluctuates largely and ran-domly. By using proposed method, the dead band of SVR can beexpanded and ROS can be prevented like in Fig. 3. Figure 3 showssecondary voltage of SVR but voltage is unlikely to deviate fromdead band.
Fig. 2. Estimate voltage using sending active power
Fig. 3. Secondary voltage of SVR
– 6 –
Extended Summary 本文は pp.56–63
An Application of Robust Power System Security to Future ElectricPower System and its Evaluation under Uncertainties
——Examination of the N-1 Security——
Yoshiharu Okumoto Member (The Chugoku Electric Power Company)
Naoto Yorino Senior Member (Hiroshima University)
Yutaka Sasaki Member (Hiroshima University)
Yoshifumi Zoka Senior Member (Hiroshima University)
Toshihiro Yamanaka Student Member (Hiroshima University)
Tomohisa Akiyoshi Student Member (Hiroshima University)
Keywords: evaluation index for the N-1 security, high-penetration of PV, smoothing effect of PV output power, storage battery
1. AbstractIn this paper, we explain how the N-1 security will be difficult
to keep up and propose the countermeasure under uncertainties inthe future. It is a fact that no effective methodologies exist to ana-lyze the N-1 security quantitatively in relation to the PV penetration.Overcoming the present situation, we propose a solution for the sub-ject by using the concept of Robust Power System Security as oneevaluation index for quantitative analysis.
The effectiveness of the proposed methods is demonstratedthrough simulations using a three machines model system.
2. Robust Power System SecurityRobust Power System Security (RS) is defined to evaluate the
N-1 security under the circumstances where we can’t eliminate un-certainties at the stage of power system operation planning.
This concept is proposed to keep up the N-1 security by arrang-ing some conditions under uncertainties. It consists of four regionsand the positioning of each region is determined by the uncertaintycondition. The main characteristic of this concept is that RDS, thekey region for judging the security, shrinks and finally disappears inaccordance with the increase of uncertainties or enlarges in accor-dance with power supply capacity.
3. SimulationBased on the amount of insolation, we converted it to PV out-
put power by using the effect of smoothing. By applying RS, wesimulated Table 1 indicate the area of RDS.
The N-1 security will be affected by the rate of PV penetration
Table 1. Relation between the area of RDS and the stor-age battery installation correspond to PV penetration
The following is drawn by using the green part in Table 1.
Fig. 1. Diagram illustrating the trade-off relation be-tween PV penetration and the area of RDS
The following is drawn by using the orange part in Table 1.
Fig. 2. Visualized relation of RSS, RTA and RDS basedon RS
and by installing the storage batteries.Simulation was done based on the following process.( 1 ) The area of RDS was computed in accordance with the PV
penetration rate and the installation of storage batteries.( 2 ) PV penetration rate was set from 0 % to 30% by 5% unit.( 3 ) The storage batteries were installed up to completely com-
pensate the PV penetration.4. ConclusionsThe followings are shown that (1) the relation between the PV
penetration and the area of RDS is clearly trade-off, (2) the instal-lation of storage batteries is effective to enhance the N-1 securityand (3) the power system operators will be able to monitor the N-1security condition directly by visualizing this concept.
– 7 –
Extended Summary 本文は pp.64–71
An Insolation Forecasting Method by Partial Least Squaresand a Confidence Interval Estimating Method
Naoto Ishibashi Member (Fuji Electric Co., Ltd.)
Tatsuya Iizaka Member (Fuji Electric Co., Ltd.)
Ryoko Ohira Non-member (Fuji Electric Co., Ltd.)
Yosuke Nakanishi Senior Member (Fuji Electric Co., Ltd.)
Keywords: photovoltaic generation, insolation forecasting, confidence interval, partial least square
This paper presents an insolation forecasting method using nu-merical weather forecasting data and a confidence interval estimat-ing method. It is planned to introduce photovoltaic (PV) system on alarge scale into the power system in order to achieve the low carbonsociety. However, PV has a negative effect on the power system be-cause the output of PV system depends on weather conditions suchas clear fine, cloudy and rainy. Thus, it is necessary to forecast theinsolation and evaluate the confidence interval in terms of powersystem operating and planning.
This paper proposes the insolation forecasting method by PartialLeast Squares (PLS) and the confidence interval estimating methodconsidering the forecasting error distributions. In recent years, itis popular to forecast insolation with numerical weather forecast-ing data as input variables. But it is difficult that the conventionalmethod such as multiple regression equation (MRE) simulates mul-ticollinearity among input variables. PLS handles multicollineardata among those in order to construct proper forecasting models.Also, the conventional method estimates discrete confidence inter-vals based on each weather condition. The proposed method canestimate continuous confidence intervals by linearly-approximatingfor representative values of some weather conditions extracted fea-tures from forecasting error distributions.
The effectiveness of the proposed method is demonstrated us-ing numerical weather forecasting data and actual data observed byJapan Meteorological Agency. First, to demonstrate the model ac-curacy of the proposed insolation forecasting method, it is compared
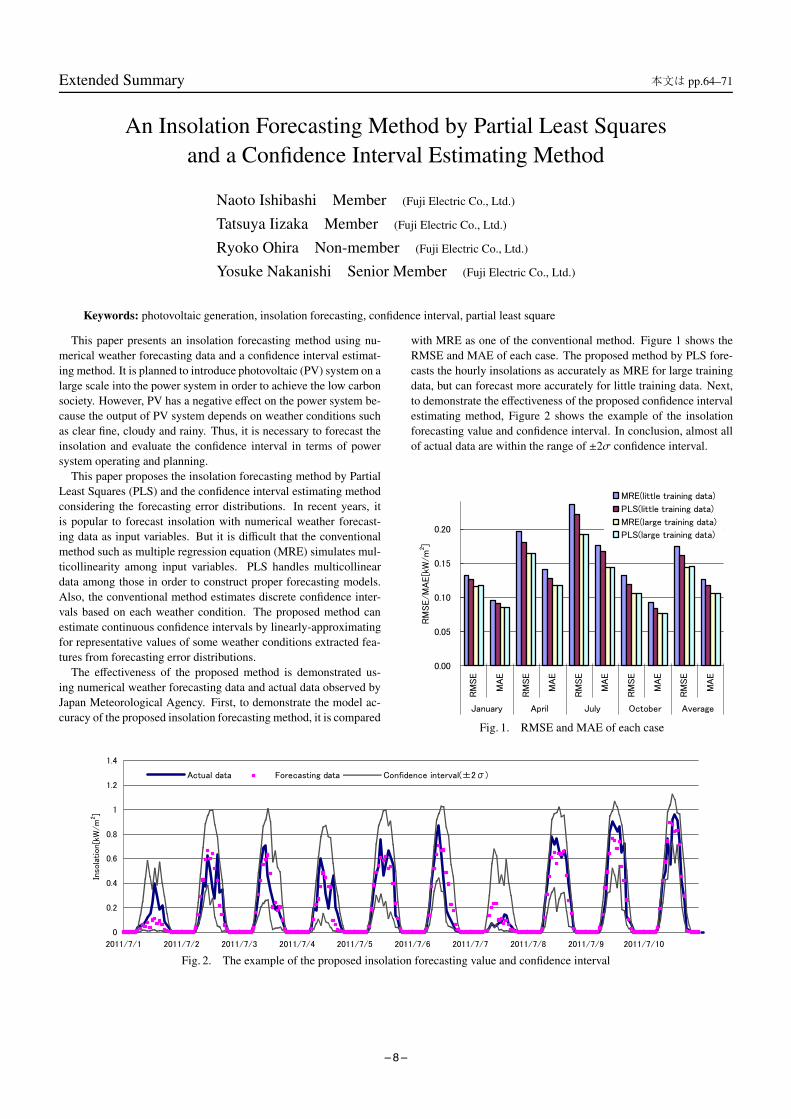
with MRE as one of the conventional method. Figure 1 shows theRMSE and MAE of each case. The proposed method by PLS fore-casts the hourly insolations as accurately as MRE for large trainingdata, but can forecast more accurately for little training data. Next,to demonstrate the effectiveness of the proposed confidence intervalestimating method, Figure 2 shows the example of the insolationforecasting value and confidence interval. In conclusion, almost allof actual data are within the range of ±2σ confidence interval.
Fig. 1. RMSE and MAE of each case
Fig. 2. The example of the proposed insolation forecasting value and confidence interval
– 8 –
Extended Summary 本文は pp.72–78
A GRBFN-EPSO-based Method for Predicting PV Generation Output
Masato Takahashi Student Member (Meiji University)
In this paper, a new method is presented to predicting PV gener-ation output. The method makes use of a hybrid intelligent systemof GRBFN (Generalized Radial Basis Function Network) of artifi-cial neural network (ANN) and EPSO (Evolutionary Particle SwarmOptimization) of meta heuristics. RBFN is one of ANNs that havegood performance for nonlinear function approximation. GRBFNis an extension of RBFN in a sense that the center and the widthof the radial basis functions are determined by the learning pro-cess although the conventional RBFN does not update them throughthe learning process. PSO is one of swarm intelligence techniquesthat find out solution candidates with multi-point search or a set ofagents. However it has a problem to provide local solutions in carewhere the algorithm parameters are not appropriate. EPSO is usedto evaluate better the weights between the hidden and the outputlayers because it is useful for solving nonlinear optimization prob-lems from a standpoint of global optimization. In particular, EPSOhas advantage to adjust the algorithm parameters with the evolution-ary strategy to make the search process more diverse by the repli-cation. In addition, DA (Deterministic Annealing) clustering thatcorresponds to a global clustering technique is employed to evalu-ate the initial solutions of the center and the width so that the per-formance of GRBFN is improved. Furthermore, the weight decay(WD) method is utilized at the learning processes to avoid the over-fitting to learning data since the conventional methods are inclinedto provide erroneous results due to the overfitting to complicatedtime series data of PV generation output. The proposed method wastested for real data with sampling time of one minute. The numberof learning and test data are 2700 and 900, respectively. As the inputvariables, the following was employed:
x1T : PV generation output at time Tx2T : temperature of PV panel at time Tx3T : variance of x1T for five minutes at time Tx4T : variance of x2T for five minutes at time Tx5T : variance of x1T for ten minutes at time Tx6T : variance of x2T for ten minutes at time Tx7T : first order difference of time series {x1T }
x7T = x1T − x1T−1
x8T : first order difference of time series {x2T }x8T = x2T − x2T−1
x9T : second order difference of time series {x1T }x9T = x1T − 2x1T−1 + x1T−2
x10T : second order difference of time series {x2T }
x10T = x2T − 2x2T−1 + x2T−2
For convenience, the following methods are defined:
It should be noted that k-means of the conventional clustering isused at Method B and WD stands for the weight decay method.Table 1 shows the results of each method, where the average and themaximum errors, and the standard deviation of errors are given. Thevalues in parenthesis mean the normalized data for MLP results. Itcan be Method H is better than others in terms of the average, andthe maximum errors and the standard deviation of errors. For exam-ple Method H succeeded in reducing 43% average errors of MLP.The trend was applied to the maximum errors and the standard de-viation of errors. Therefore, the simulation results have shown thatthe proposed method outperforms other methods.
Table 1. Simulation results of each method
– 9 –
Extended Summary 本文は pp.79–90
Experimental Study of Islanding-Prevention Method by HarmonicInjection Synchronized to Exciting Current Harmonics
of Pole TransformerYoshiaki Yoshida Member (Doshisha University, [email protected])
Hirokazu Suzuki Senior Member (The University of Tokyo, [email protected])
Yoshiyuki Ishihara Member (Doshisha University, hiroko yumi mayako [email protected])
Keywords: pole transformer, islanding-prevention, synchronized injection of harmonic currents, harmonic voltage detection, pho-tovoltaic system
1. IntroductionWhen distributed generators (DGs) such as photovoltaic (PV)
systems spread widely in distribution systems, it is important toquickly prevent islanding operation caused by power system faultin order to ensure electrical safety. So far, the various islanding pro-tection methods have been used practically. But, the conventionalactive systems tend to increase the detection time, because mutualinterference occurs due to asynchronous state between active sig-nals. On the other hand, the new active islanding detection sys-tem that is called “frequency-feedback system with step-injection”,also has possibility of extending the detection time in so called non-detection zone. So, we propose a novel islanding-prevention methodby harmonic injection synchronized to exciting current harmonics ofthe pole transformer in order to avoid mutual interference betweenactive signals.
2. Proposed Methods and Experimental ResultsThe conceptual block diagram of the proposed method is shown
in Fig. 1. The power conditioning subsystem (PCS) can estimatethe exciting current harmonics of the pole transformer by observ-ing the line voltage of interconnection terminal, because the excit-ing current harmonics can be approximated as the functions of thefundamental wave voltage V1. So, as the active signal for islanding-detection, PCS can inject the k-th harmonic current IGk1 synchro-nized to exciting current harmonics of the pole transformer into thedistribution network. Where, IGk1 is a few percent of the rated cur-rent, considering the influence on power quality, and k is 3 or 5.
Fig. 1. Conceptual block diagram of proposed method
Fig. 2. Islanding detection wave form (example of ΔP =ΔQ = 0 [%], nG = 1)
In order to detect islanding state reliably, PCS changes the activesignal amplitude from IGk1 to IGk2 after detecting the k-th harmonicvoltage change of more than ΔVkth (0.5%). As the result, since theharmonic voltage under the islanding state will change linearly fromVk1 to Vk2, PCS can estimate the harmonic components ΔZk of theload impedance in order to avoid miss operations. We confirmedthe validity of the proposed detection algorithm by performing theislanding detection tests using the prototype inverters equipped withthe proposed method and verified the fast detection of about 0.1 sec(shown in Fig. 2). Further, we have carried out the miss operationtests to clarify the occurrence reason and studied the countermea-sure by improving the proposed detection algorithm.
3. ConclusionsWe proved the feasibility of detecting the islanding-operation
quickly and reliably, even if the islanding state is in non-detectionzone. And this proposed method is applicable to the islanding detec-tion system under clustered installation of PV systems because mu-tual interference does not occur due to synchronous state betweenactive signals.
– 10 –
Extended Summary 本文は pp.91–98
Development of Estimation Method of Spatial Average IrradianceFluctuation Characteristics Considering Smoothing Effect
around Observation PointTakeyoshi Kato Member (Nagoya University)
Shinsuke Kumazawa Member (Nagoya University)
Nobuyuki Honda Member (Chubu Electric Power Co., Inc.)
Masakazu Koaizawa Member (Chubu Electric Power Co., Inc.)
Shinichi Nishino Member (Chubu Electric Power Co., Inc.)
In order to estimate the total power output fluctuation of high-penetration photovoltaic power generation system (PVS) by usingthe data of limited number of points, the smoothing effect aroundindividual observation point should be taken into account. Based onthe so-called transfer hypothesis, this study proposed a low-pass fil-ter to estimate the spatial average irradiance fluctuation characteris-tics by taking into account the smoothing effect around observationpoint.
By using the transfer hypothesis, first, we estimated the fre-quency characteristics of ensemble average irradiance fluctuation of18 points in the Nobi plain. As a result, we confirmed the followingtwo results; 1) the fluctuation characteristics of spatial average ir-radiance can be estimated by using the frequency characteristics ofsingle point irradiance S A( f ), and 2) the fluctuation cycle Tx fromwhich the random fluctuation factor begins to increase can be for-mulated when the radius of equivalent circle area is smaller than30 km.
Based on the fact that the short-cycle fluctuation can be calcu-lated by using the so-called 1/
√N rule, we calculated the number
of lattice point M of a 5 km × 5 km mesh covering the area. Then wemodified the transfer hypothesis by using the lattice point M, so thatthe frequency characteristics of spatial average irradiance fluctua-tion S cenM( f ) considering the smoothing effect around observationpoint can be presented as a function of S A( f ) and Tx. Based onS cenM( f ) for various area sizes, we formulated Tx as a function ofthe area size S as shown in Fig. 1. Ty in Fig. 1, which is calculatedby using Tx and the number of lattice points M, shows the cyclefrom which the fluctuations in the different points become indepen-dent each other.
S cenM( f )/S A( f ) corresponds to a low-pass filter gain G( f ) for
Fig. 1. Relation between area size and Tx or Ty
calculating the frequency characteristics of spatial average irradi-ance fluctuation by taking into account the smoothing effect aroundobservation point. Besides, Tx, Ty, and M are formulated as a func-tion of area size. Therefore, we proposed the calculation proceduresregarding G( f ) for a given area size. Figure 2 shows the calculatedG( f ) for various area sizes.
Finally, we calculated G( f )·S A( f ) as shown in Fig. 3. G( f )·S A( f )is almost the same as the frequency characteristics S traM( f ) of thespatial average irradiance fluctuation calculated by using the multi-points observation data. Consequently, the spatial average fluctua-tion characteristics of various area sizes within the radius of 20 kmcan be estimated successfully by applying the dedicated low-passfilter according to the area size.
Fig. 2. LPF gain for smoothing effect around observa-tion point
Fig. 3. Frequency characteristics of spatial average irra-diance fluctuation estimated with LPF for smoothing ef-fect around observation point
– 11 –
Extended Summary 本文は pp.99–105
New Method of Calculating Temperature Distributionon Solid Substances
Toshiharu Tada Member (The Kansai Electric Power Co., Inc.)
Keywords: temperature distribution, thermal conduction, thermal resistance, time constant, reflection ratio
1. IntroductionThere was a useful and classical equation for the trend of tem-
perature which was an original equation of an equation applied tothis paper, and used thermal resistance corresponding to electric re-sistance inverse proportional to square and heat source regarded asfixed one. As the result, this equation was not developed for thecalculation of temperature distribution. And the old mindset on aclassical equation caused unreasonableness. Thus, a heat conduc-tion equation and the finite element method became widely used forthe calculation of a temperature distribution. However, if a heat con-duction equation was applied to calculate a temperature distribution,its result was not agreed with measured one. The method of calcu-lating temperature distribution using the finite element method was atentative technique due to simulating a natural phenomenon throughrepeating process with the computer. This proposed method of cal-culating temperature distribution used the new concepts of thermalresistance proportional to the volume and moving heat source, basedon a classical equation, and as a result, existing unreasonablenesswas dispelled perfectly.
2. Calculation of Temperature DistributionWe studied a sodium-sulfur (NaS) battery. The temperature dif-
ference θ was distributed proportionally to r3, where r was the dis-tance from the center of the battery. This θ distribution was simu-lated by using thermal resistance ΔR = ψΔV , where ψ and V werea factor and volume. The differential equation of time constant τwas calculated by numerical analysis, but its solution included anunknown value of the total number of layers m, which was solvedby assuming as m= 1. The heat source ΔPn′ was located in the n′thlayer, and the heat source ΔP′n′ heated its layer, resulting in the Pf low
of moving P passing through its layer. ΔPn′ was not equal to ΔP′n′ .The concept of Pf low was needed to represent the heating of layersthat did not have a heat source. And P = P′was established, be-cause Pf low was consumed completely by heating the layers and didnot flow to the outside of this heating system, thus differing from thethermal current W = Δθ/ΔR. Time constant τ was unitary through-out the substance and the temperature difference Δθ was dividedevenly, so Δθ equation had to be in the same form as the τ equationto allow the substitution p′ for cρ in the τ equation. Also, p′ wasdistributed evenly due to cρ being distributed evenly, where p′ wasthe heat source P′ per volume, and the volumetric specific heat cρwas thermal capacity C per volume and a constant. If the θ and Wdistributions were calculated on a composite substance constructedwith many layers, ψc proportional to cρ was established by chang-ing ψc due to the unitary existence of τ, where ψc was a constant ψ.Equations for calculations of these distributions included terms ofn′/m with n′ using m, so that m was allowed to take any values tolead to the assumed m = 1. Also, these distributions differed by themethod of selecting m = 1, as a result, the smallest value of W wasallowed to flow, because W was a flow depending on W ∝ √n′, andψc changed by compounding was not smaller than ψc which was theoriginal value for each layer, leading to the largest τ.
3. Thermal Conduction in Wave3.1 Reflection Ratio of W and Pf low If W flowed
from ψc1 to ψc2, its reflection ratio λw = (ψc1 − ψc2)/(ψc1 + ψc2)was represented. Similarly to λw, the reflection ratio of Pf low wasλp = (c1ρ1 − c2ρ2)/(c1ρ1 + c2ρ2). The numerals of ψc and cρ rep-resented their layers of the composite substance. For ψc1 < ψc2,reflection waves W ′ in phase inversion due to λw < 0 and trans-mitted waves W ′′ occurred on the contact surface of ψc2, resultingin that, Wa f ter after reflection being smaller than the input wavesW was equal to W ′′. W ′ occurred not only on the boundary but alsothroughout the whole substance, resulting from diffraction of waves.That is, an increased temperature corresponding to smaller Wa f ter
caused by W ′ on the boundary was continuously spread through-out the whole substance, because it meant a higher potential energylevel causing the spread of waves. As a result of this spread, evenif the reflection of W occurred, Wa f ter caused the existence of τ bythe shifting of the position of each divided layer to establish theWa f ter ∝
√n′ curve. Also, Pf low−a f ter after reflection was smaller
than the input Pf low by this reflection because thermal energy wastransmitted by the combination of W and Pf low, and it heated asmaller number of divided layers than at no reflection, thus mak-ing the heated system separate. For reflection with λw > 0 underψc1 > ψc2, W ′ in phase caused Wa f ter to be larger than W. Also,Pf low−a f ter was larger than the input Pf low, becoming too large toheat divided layers in ψc2 and flowing to the outside of this heatedsystem. This was an unreasonable result, because Pf low−a f ter had tobe consumed perfectly within this system. Thus Wa f ter = W andPf low−a f ter = Pf low flowed through the boundary just as at no reflec-tion. λp was equal to λw because ψc was proportional to cρ.
3.2 Method for Conduction in Waves Electrostatic in-duction and electromagnetic induction did not accept the reflectiontheory. Thus, thermal energy was transmitted from ions at a higherpotential energy level to other ions at a lower potential energy levelthrough coupling by electromagnetic waves, because thermal energyemitted in every direction by an ion was compensated for by receiv-ing thermal energy emitted from neighboring ions. Thermal energywas transmitted by the repeated process of sending and receiving be-tween ions. Thermal energy in electromagnetic waves transmitted inthe spaces between the ions in the substance. The reason was that,ions taking on a positive or negative electric charge were vibratedby receiving thermal energy and then they emitted electromagneticwaves like airwaves.
4. Conclusion( 1 ) If the substance was a composition, temperature distribu-
tion was reasonably and perfectly calculated by using thermal resis-tance proportional to volume and the numerical analysis.
( 2 ) The thermal current flowed proportionally to the squareroot of the number of divided layers, which caused the thermal resis-tance to change and resulted in selection of the largest time constant.
( 3 ) When the reflection ratios of the thermal energy were cal-culated and applied, no problem occurred.
– 12 –
Extended Summary 本文は pp.106–113
Application of the Type-C Constrained Interpolation Profile Methodto Lightning Electromagnetic Field Analyses
Kenta Kajita Student Member (Doshisha University)
Kohta Miyagawa Student Member (Doshisha University)
In this paper, the type-C constrained interpolation profile (CIP)method has been applied to analyzing lightning electromagneticfields. The CIP method is one of the finite-difference methods.Differently from the finite-difference time-domain (FDTD) method,however, it considers not only electric- and magnetic-field valuesat each discretized points in a working space but also their spatial-derivative values there. Therefore, in principle, it can compute fieldsaccurately even when a relatively coarse grid and a relatively largetime increment are used.
Figure 1 shows CIP-, FDTD-, and theoretically-calculated wave-forms of vertical electric field on flat perfectly conducting groundsurface at horizontal distances 3 and 6 km from a simulated light-ning channel. The lightning channel is represented by an engineer-ing transmission-line (TL) model, and along it a subsequent light-ning return-stroke current whose magnitude is 10 kA and risetime is1 µs propagates upward at the speed of light. The CIP and FDTDcalculations are performed in a three-dimensional working space of20 km × 20 km × 9 km, which is divided uniformly into cubic cellsof 100 m × 100 m × 100 m. Time increments in the CIP and FDTDcalculations are set to 190 ns and 173 ns, respectively.
Fig. 1. CIP-, FDTD-, and theoretically-calculated wave-forms of vertical electric field on flat perfectly conductingground surface at horizontal distances 3 and 6 km from asimulated lightning channel. Along the lightning chan-nel, a subsequent lightning return-stroke current of mag-nitude 10 kA and risetime 1 µs propagates upward at thespeed of light. Both the CIP and FDTD working spacesare divided uniformly into cubic cells of 100 m × 100 m× 100 m.
Figure 2 shows CIP-, FDTD-, and theoretically-calculated wave-forms of electric field on flat perfectly conducting ground surface athorizontal distance 300 m from the TL-represented lightning chan-nel. Along the channel, a Gaussian-pulse current whose magnitudeis 1 kA and half-peak width is 1 µs propagates upward at the speedof light. The CIP and FDTD calculations are performed in a three-dimensional working space of 1.4 km × 1.4 km × 0.7 km, which isdivided nonuniformly into rectangular cells of 7 m × 7 m × 10 m inthe vicinity of the channel and 60 m × 60 m × 10 m in the rest of thespace. Time increments in the CIP and FDTD calculations are set to19 ns and 8.1 ns, respectively.
It appears from Figs. 1 and 2 that CIP-calculated waveforms inboth uniform and nonuniform grids agree well with the correspond-ing theoretically calculated ones, while the FDTD-calculated wave-forms do not. This indicates that the CIP method is effective in cal-culating high-frequency electromagnetic fields in a relatively coarsegrid and in a nonuniform grid in which the ratio in sizes of large andsmall cells is relatively high.
Fig. 2. CIP-, FDTD-, and theoretically-calculated wave-forms of electric field on flat perfectly conducting groundsurface at horizontal distance 30 m from the simulatedlightning channel. Along the lightning channel, aGaussian-pulse current whose magnitude is 1 kA andhalf-peak width is 1 µs propagates upward at the speedof light. Both the CIP and FDTD working spaces are di-vided nonuniformly into rectangular cells of 7 m × 7 m× 10 m in the vicinity of the simulated lightning channeland 60 m × 60 m × 10 m in the rest of the space.
– 13 –
Extended Summary 本文は pp.114–120
Identification of Metallic Particle Defect in GIS Based onPartial Discharge Mechanism
1. IntroductionA metallic particle defect seriously degrades an insulation perfor-
mance in gas insulated switchgear (GIS). Therefore, the estimationof property and risk of the metallic particle is important to main-tain the reliability of GIS. In this paper, based on a partial discharge(PD) mechanism, we suggest the progressive method to indentifythe shape of metallic particle defect from some physically charac-teristic PD properties.
2. Experimental SetupThe electrode setup simulating the metallic particle defect in GIS
is set in a chamber filled with 0.2 MPa SF6 gas. The metallic parti-cle made of stainless steel is put on parallel electrode system with30 mm gap. The diameter of particle φ is 0.6–1.0 mm, the parti-cle length � is 13–19 mm, and the gap length g is 11–17 mm. Thetip shape of metallic particle is hemispherical. We applied the acvoltage to this electrode setup, and observed PD current and lightemission image by an oscilloscope and high-speed video camera,respectively.
3. Estimation of Maximum Electric Field on theMetallic Particle
PD inception voltage (PDIV) will be very useful for the identi-fication of the shape of metallic particle. However, under actualoperating condition of GIS, the applied voltage to the metallic par-ticle is constant to the operating voltage and is not variable. In otherwords, we need to construct the method for the estimation of PDIVfrom some PD properties under various voltage levels.
We measured the instantaneous PD inception voltage for eachpolarity with its distribution for various applied voltage. And, wefound that the minimum instantaneous voltage of positive PD ex-tinction and the average instantaneous voltage of negative PD incep-tion agrees with the positive and negative PDIVs, respectively. Theformer is because the minimum instantaneous voltage of positivePD extinction represents the PD voltage without corona relaxationprobabilistically. The latter is because the negative PD is based onTorricelli pulse mechanism.
Inceptive PD occurs when the maximum electric field of metallicparticle exceeds the PD inception electric field strength. Therefore,the estimated PDIV will correspond to the maximum electric fieldstrength, which is decided by the shape of metallic particle.
4. Identification of the Shape of Metallic ParticleAssuming that the metallic particle exists on the conductor or the
tank in GIS, the gap length between the conductor and the tank, cor-responding to the gap length of parallel electrodes in our electrodesystem, is unique. In this case, the maximum electric field Emax nor-malized by applied voltage gives the combination of diameter and
Fig. 1. Relationship of maximum electric field strengthand negative PD pulse number for needle electrode (Va =45 kVrms, � + g = 30 mm, P = 0.2 MPa)
Fig. 2. Flowchart of method of particle size identification
length of the metallic particle. In addition, we found that the nega-tive PD pulse number strongly depends upon diameter and length ofthe metallic particle, and this relationship is opposite to that of themaximum electric field. So, we can estimate diameter and length ofthe metallic particle from negative PD pulse number and normalizedelectric field Emax as shown in Fig. 1.
In Fig. 2, we summarize the proposed method of the identificationof the shape of the metallic particle defect.
– 14 –
Extended Summary 本文は pp.121–128
Radiation Loss of Gas Tungsten Arc Welding Affectedby Current Increment
Michio Hirose Student Member (Tokyo City University)
Toru Iwao Member (Tokyo City University)
Motoshige Yumoto Member (Tokyo City University)
Keywords: GTA welding, arc current, metal vapor, vapor contamination ratio, radiation loss
Gas tungsten arc welding (GTAW) is a high quality and weldingwhich is one of the GTAW has been used as a high quality joiningcase. Because the inert gas is used as a shielding gas, the arc is notcontaminated by surrounding gas. Therefore, this joining processis very clean to join the materials. However, the weld defects areoccurred, such as lack of penetration and overlap because of lowheat transfer to the anode. Some researchers have researched theweld defect. However, the view point of radiation loss has not beenresearched.Especially, the TIGwelding is contaminated with metalvapor from anode material. In this case, the heat transfer to anodeis affected by radiation emitted from metal vapor, because of thenet emission coefficient emitted from metal vapor is very high. Inthis paper, the radiation loss of gas tungsten arc welding affected by
current increment is elucidated. When the current increases, the heattransfer to the anode increases, and then the contamination ratio ofmetal vapor increases. When the contamination ratio of metal vaporincreases, the arc temperature changes,and then the heat transfer tothe anode changes. Therefore, that energy balance of heat transfer toanode and radiation loss should be considered in the TIG welding.As a result, the radiation loss increases with increasing the current.When the metal contamination ratio and its distribution change, theradiation loss changes. In addition, the current increase to 300 A,the radiation loss is saturated. Therefore, the radiation loss is ob-tained by the complex condition between the current, temperature,metal contamination distribution. And the heat transfer to the anodeis affected by this radiation loss.
– 15 –
Extended Summary 本文は pp.129–136
Control of Spectrum for Improvement of Color Rendering SpectrumAffected by Scandium Vapor Mixed with Argon Arc
Eriko Mitsuyasu Student Member (Tokyo City University)
Toru Iwao Member (Tokyo City University)
Motoshige Yumoto Member (Tokyo City University)
Keywords: arc lamp, metal vapor, scandium, radiation, large-scale lighting
The arc lighting to obtain the environment to evacuate, save thelife, keep the safety and be comfortable are focus on. The lack ofradiation intensity and color rendering spectrum is problem becauseof inappropriate energy balance. This paper elucidates the improve-ment of color rendering spectrum with control of spectrum affectedby scandium vapor mixed with argon arc. The temperature withkeeping the color rendering increases with increasing the contam-ination ratio of metal vapor because of x, y chromaticity diagram.In addition, the volume increment of low temperature region; pe-riphery of the arc is effective for the color rendering. The radiation
power increases with increasing the metal vapor even if the temper-ature is low. Especially, the maximum radiation power with metalvapor is 10 times as high as that without one. The radiation powerincreases with keeping the color rendering and the radiation powerincreases when the appropriate temperature is chosen under consid-eration of x, y chromaticity diagram. The improvement of colorrendering spectrum is expected by the control of balance betweenthe broad continuous spectrum of argon and line spectrum of scan-dium with temperature distribution derived from current incrementand/or arc pinch.