ECTC2005 ECTC2005 Tin Whisker Formation Tin Whisker Formation A Stress Analysis A Stress Analysis Chen Xu – Cookson Electronics G. T. Galyon – IBM (presenting) S. Lal – FCI B. Notohardjono – IBM
Chen Xu – Cookson ElectronicsG. T. Galyon – IBM (presenting)
S. Lal – FCIB. Notohardjono – IBM
1
Mr. WhiskerMr. Whisker
Courtesy of Peter Bush/SUNY-Buffalo
2
AgendaAgenda• Integrated Theory for Whisker Formation & Stress• Kirkendahl Effect and Stress• Intermetallic Formation and Stress• Finite Element Stress for Tin Film• Film Stress Measurements – XRD• Film Stress Measurements- Flexure Beam
Integrated Theory: Elements Of Integrated Theory: Elements Of
• Compressive stress- A necessary factor– Compressive stress sources
• Must be high impedance or sustaining sources, e.g.– Intermetallic formation– High humidity (oxide reactions at film surface)– Temperature cycling (differential thermal expansion)– Built in film stresses (additives/gaseous entrapment)
• Arguments to the contrary are potentially flawed– e.g., non sustaining stresses– e.g. Flexure beam observations– e.g. Bent lead-frame experiments
• Recrystallization – A necessary factor (?)– Not covered in this presentation
• Tin Self-Diffusion – A necessary factor– Not covered in this presentation
4
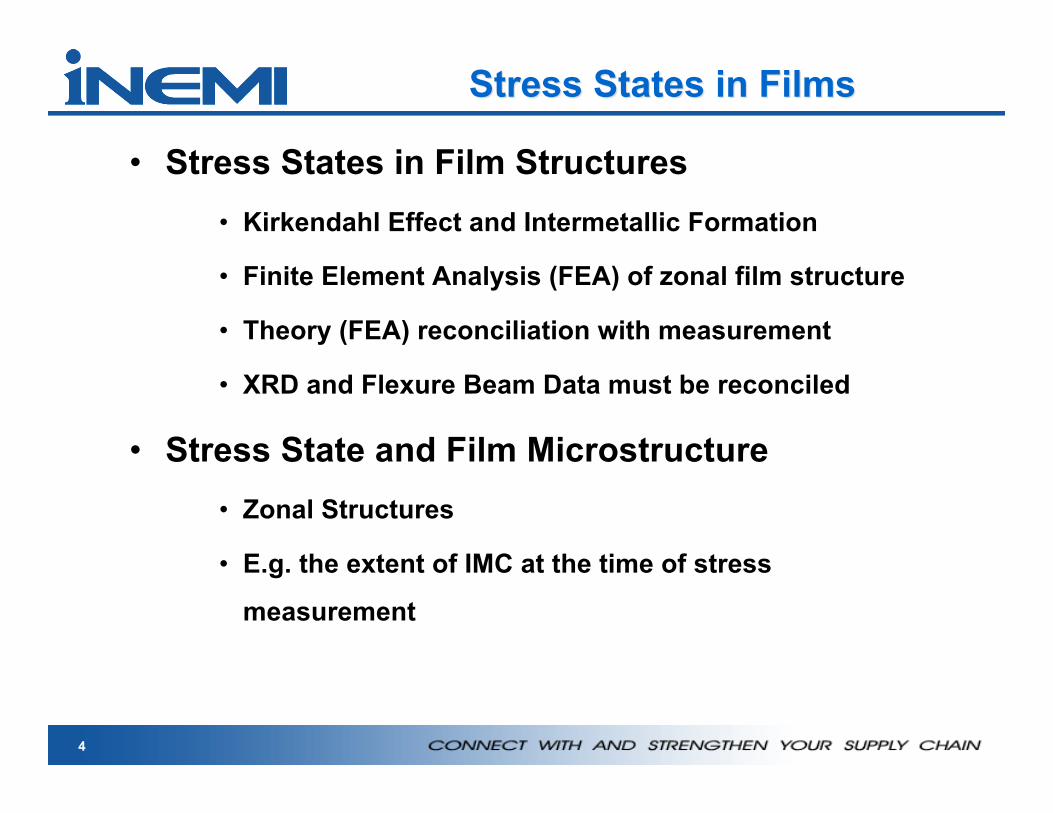
Stress States in FilmsStress States in Films
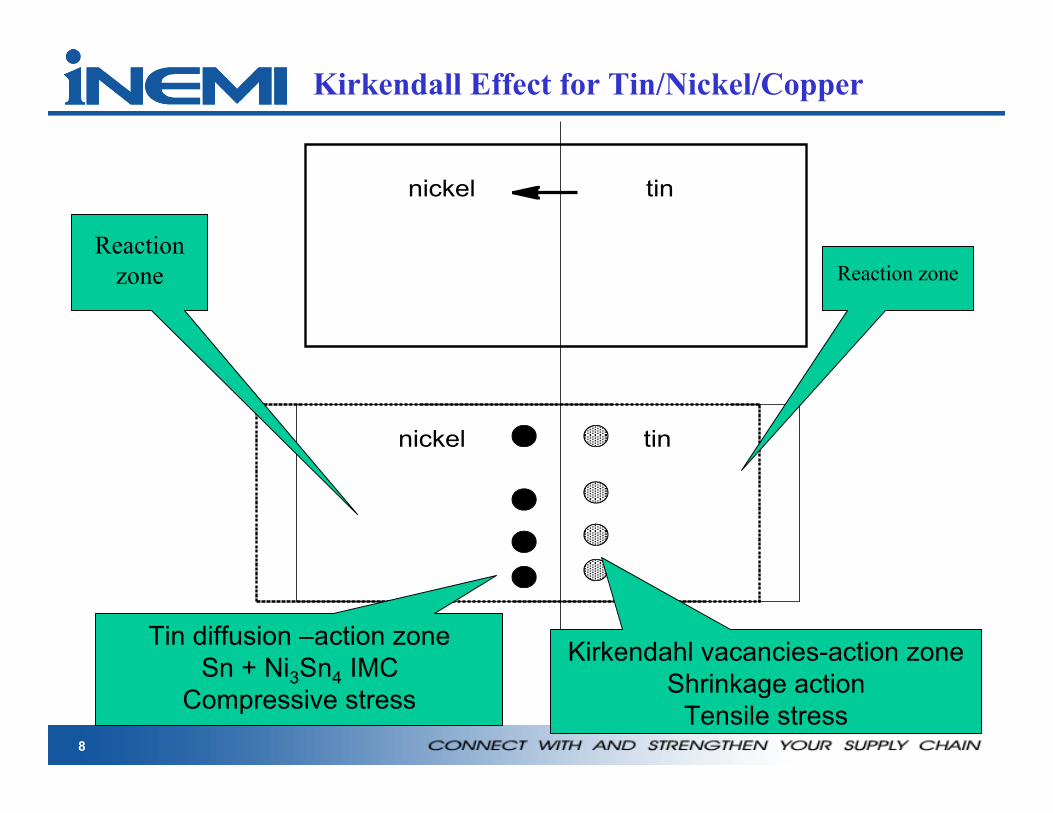
• Stress States in Film Structures• Kirkendahl Effect and Intermetallic Formation
• Finite Element Analysis (FEA) of zonal film structure
• Theory (FEA) reconciliation with measurement
• XRD and Flexure Beam Data must be reconciled
• Stress State and Film Microstructure• Zonal Structures
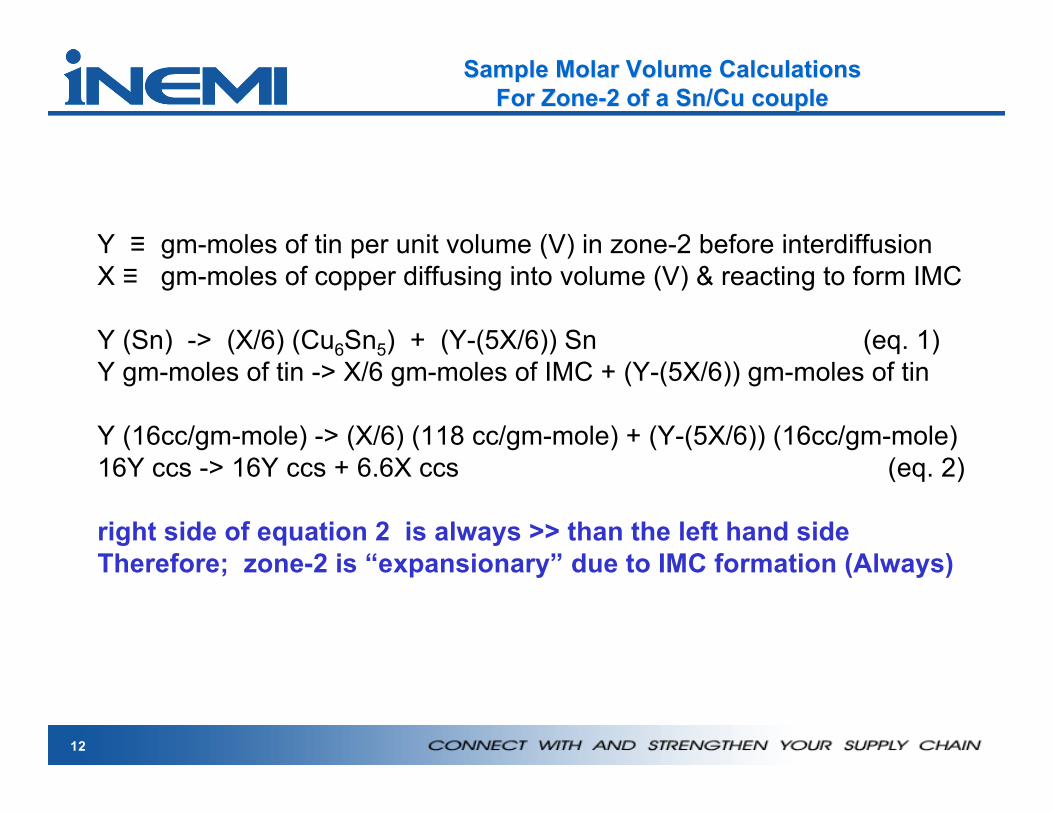
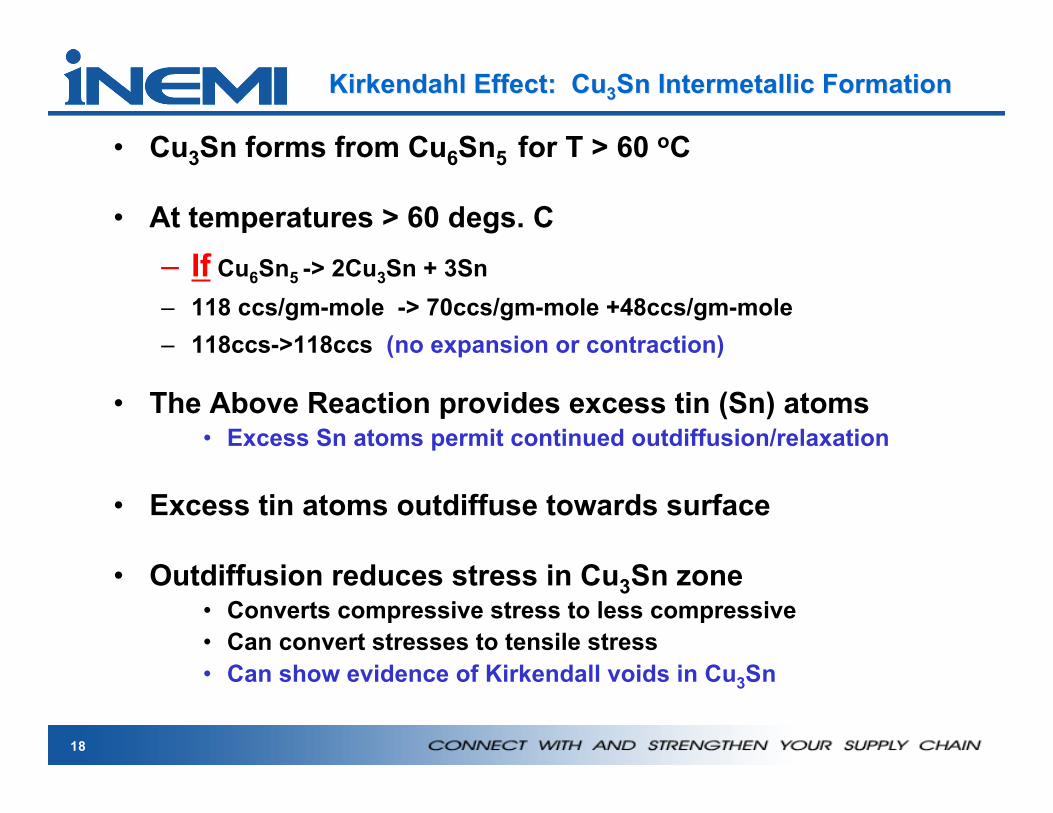
• At temperatures > 60 degs. C– If Cu6Sn5 -> 2Cu3Sn + 3Sn– 118 ccs/gm-mole -> 70ccs/gm-mole +48ccs/gm-mole– 118ccs->118ccs (no expansion or contraction)
• The Above Reaction provides excess tin (Sn) atoms• Excess Sn atoms permit continued outdiffusion/relaxation
• Excess tin atoms outdiffuse towards surface
• Outdiffusion reduces stress in Cu3Sn zone• Converts compressive stress to less compressive• Can convert stresses to tensile stress• Can show evidence of Kirkendall voids in Cu3Sn
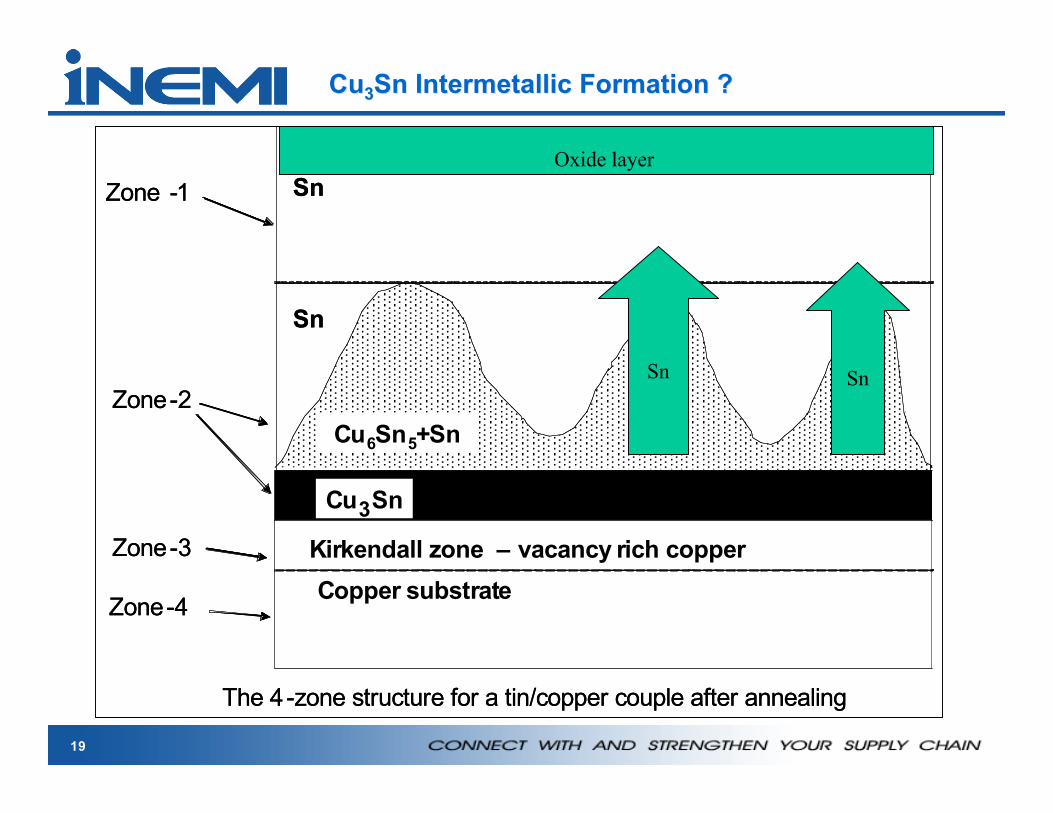
The 4-zone structure for a tin/copper couple after annealing
Cu3Sn
Zone -1
Zone-2
Zone-3
Zone-4
Kirkendall zone – vacancy rich copper
Copper substrate
Cu6Sn5+Sn
Sn
Sn
The 4-zone structure for a tin/copper couple after annealing
Cu3Sn
Zone -1
Zone-2
Zone-3
Zone-4
Sn Sn
Oxide layer
20
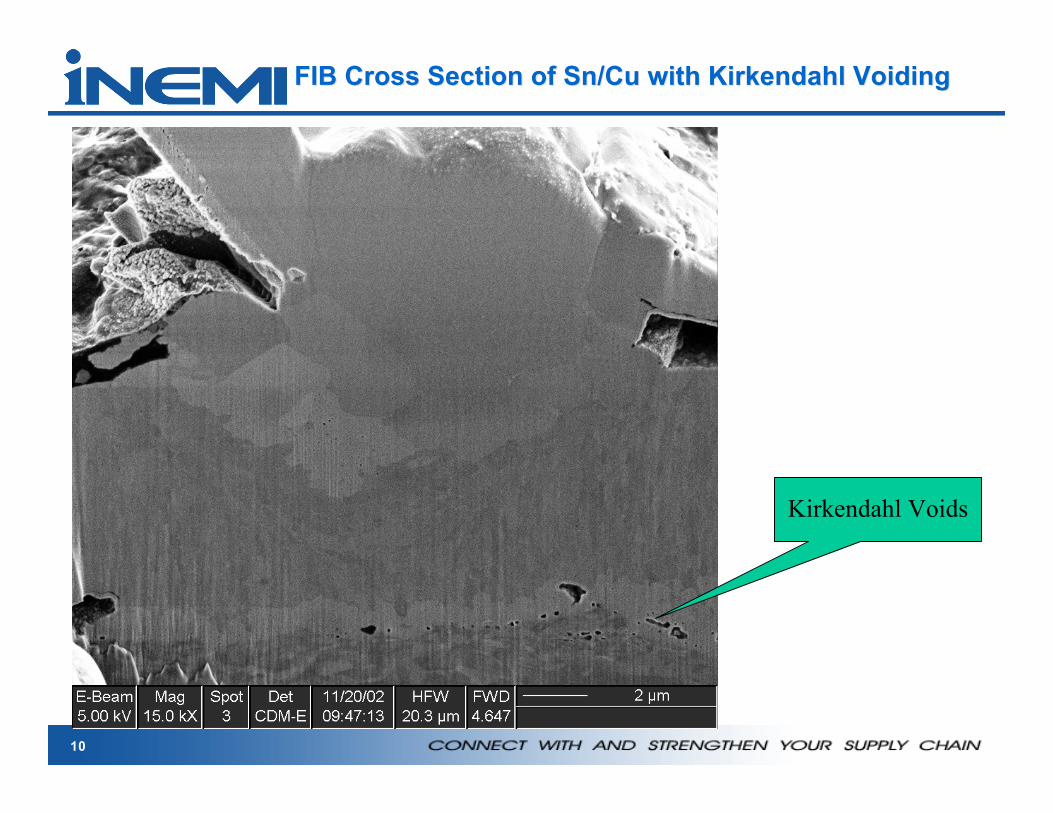
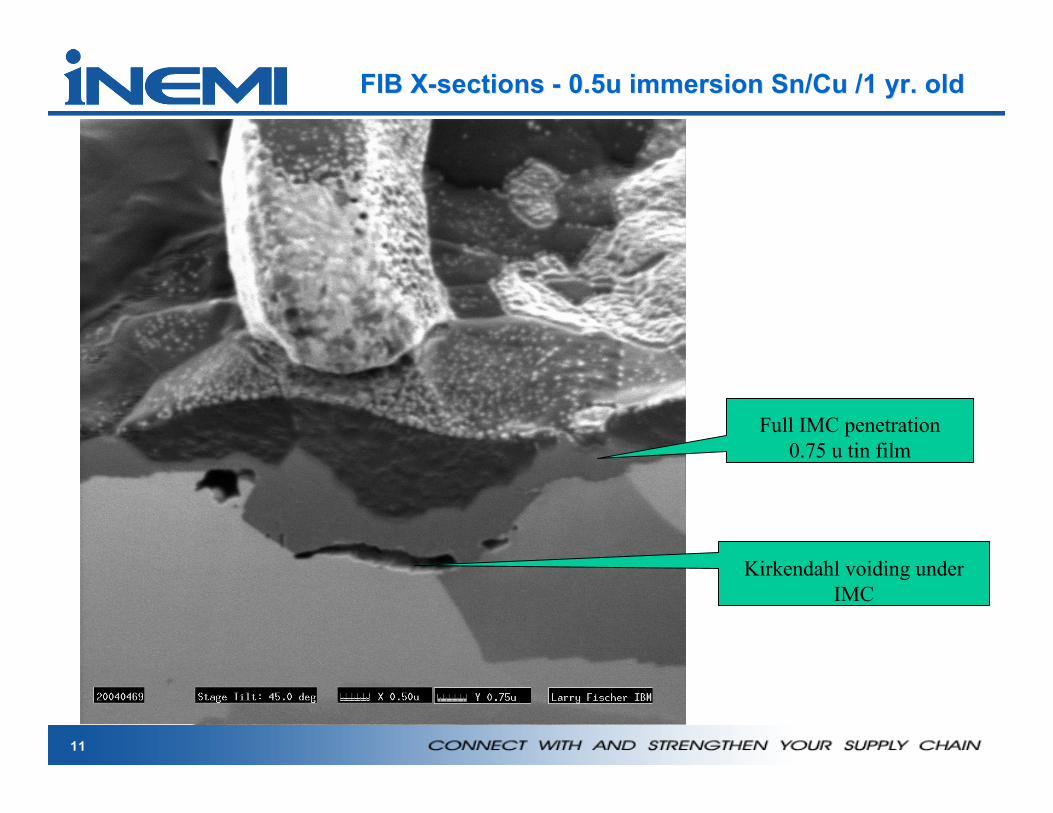
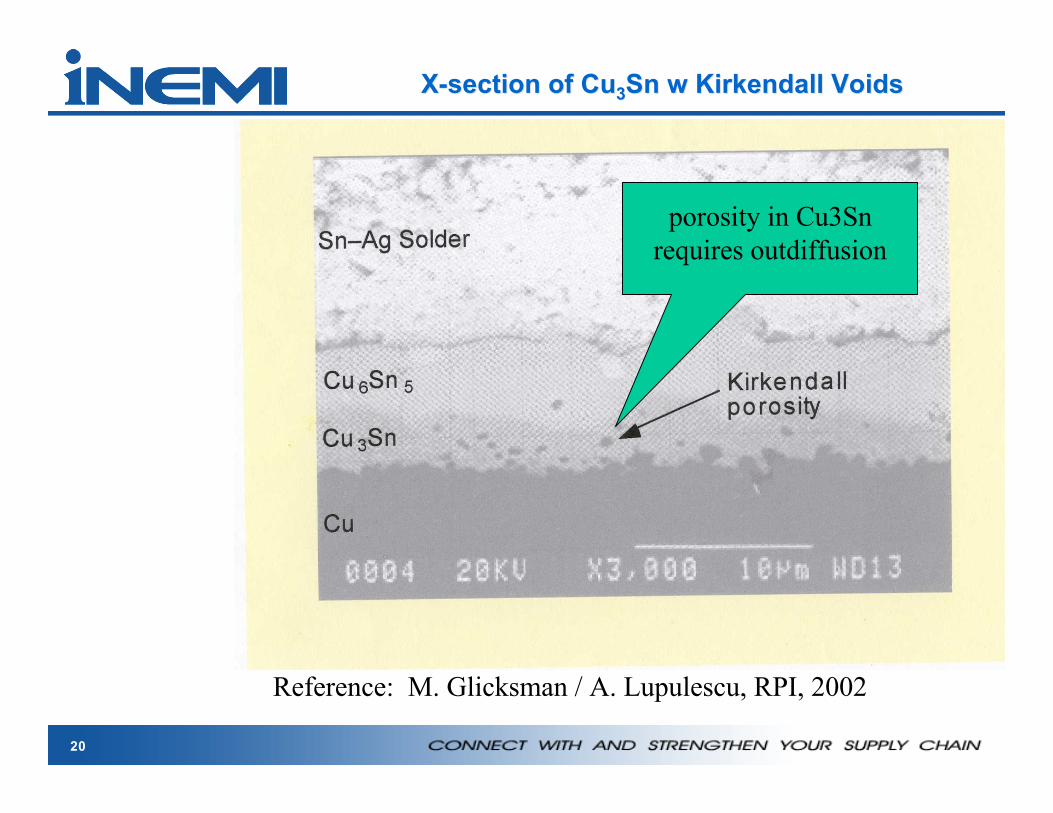
X-section of CuX-section of Cu33Sn w Kirkendall VoidsSn w Kirkendall Voids
Picture from RPI research to be inserted.
Reference: M. Glicksman / A. Lupulescu, RPI, 2002
porosity in Cu3Snrequires outdiffusion
21
X-section of CuX-section of Cu33Sn w Kirkendall VoidsSn w Kirkendall Voids
TinFilm
Cu6Sn5
Cu3Sn
Cu Substrate
Kirkendahlvoiding in Cu3SnKirkendahl voiding in Cu
Finite ElementFinite ElementAnalysisAnalysisTin FilmsTin Films
B. NotohardjonoG. Galyon (presenting)
C.XuS. Lal
23
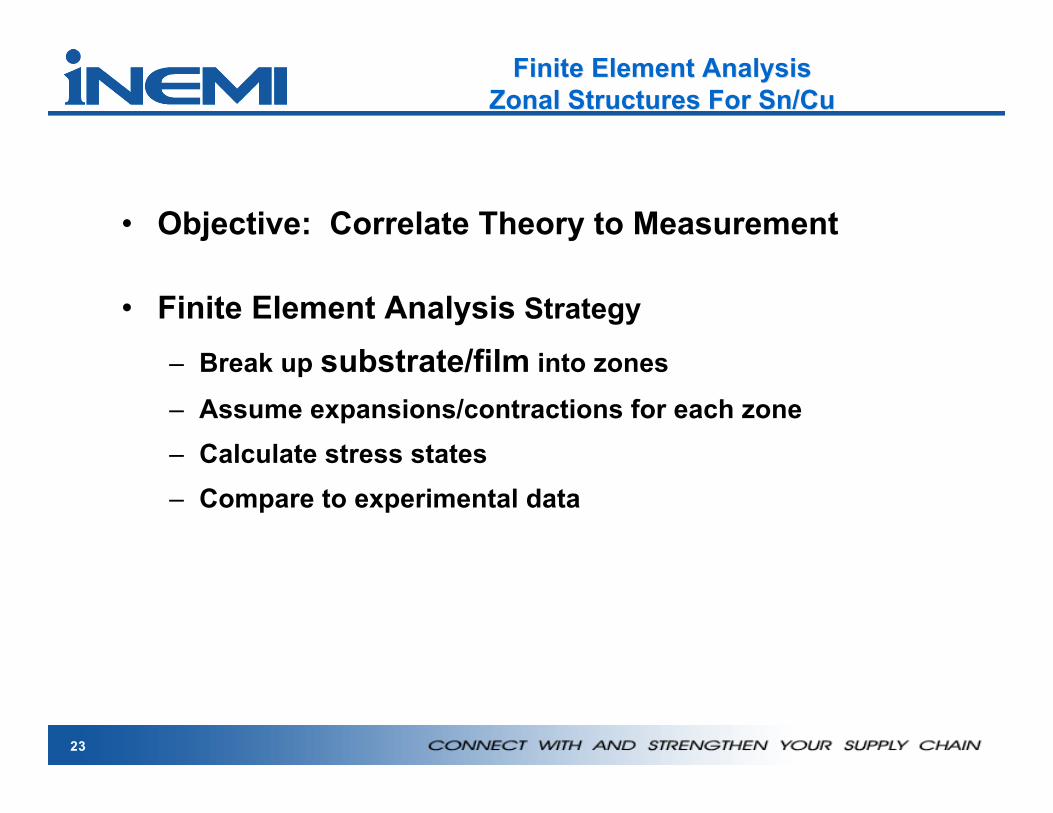
Finite Element AnalysisFinite Element AnalysisZonal Structures For Sn/CuZonal Structures For Sn/Cu
• Objective: Correlate Theory to Measurement
• Finite Element Analysis Strategy
– Break up substrate/film into zones
– Assume expansions/contractions for each zone– Calculate stress states– Compare to experimental data
24
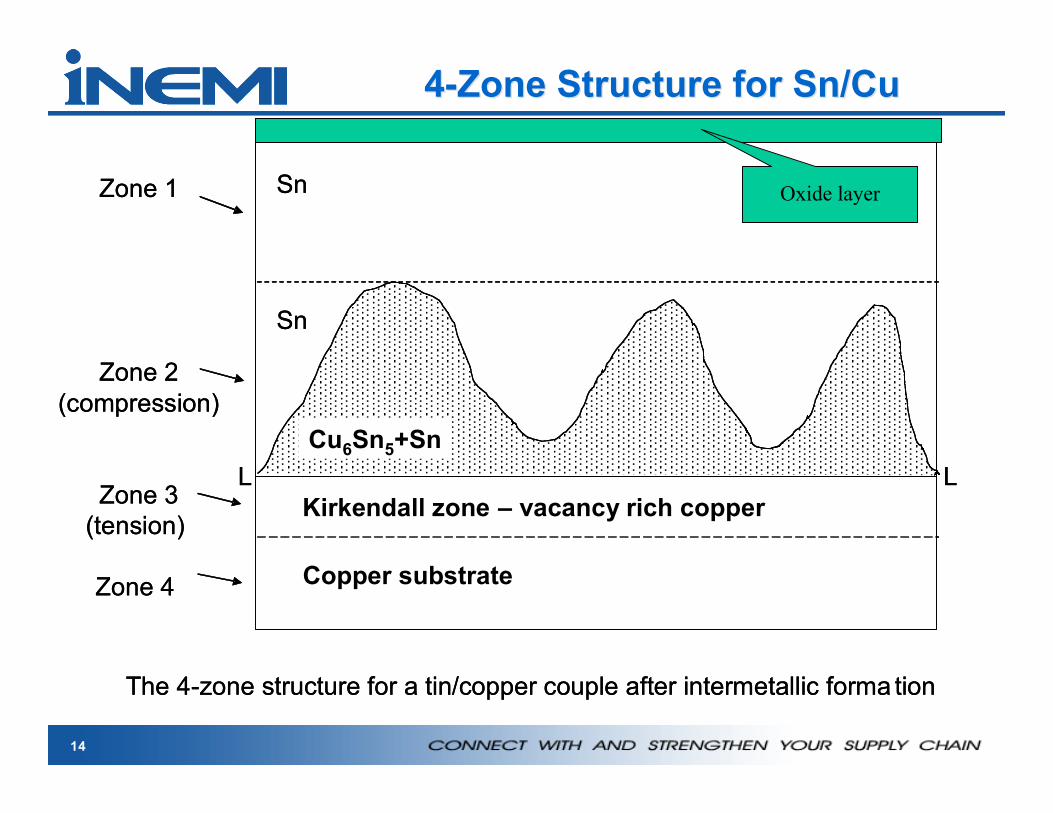
Kirkendall zone – vacancy rich copper
Copper substrate
Cu6Sn5+Sn
Sn
SnZone 1
Zone 2
(compression)
Zone 3
(tension)
Zone 4
The 4-zone structure for a tin/copper couple after intermetallic forma tion
L L
Kirkendall zone – vacancy rich copper
Copper substrate
Cu6Sn5+Sn
Sn
SnZone 1
Zone 2
(compression)
Zone 3
(tension)
Zone 4
The 4-zone structure for a tin/copper couple after intermetallic forma tion
L L
Oxide layer
Four Zone Structure for Sn/Cu
25
Finite Element Stress AnalysisFinite Element Stress AnalysisModel Parameters for Sn/CuModel Parameters for Sn/Cu
• Set zonal thickness and properties– E.g., Zone-1 at 5 microns: 100% tin– E.g., Zone-2 at 2 microns: mixture of tin and IMC– E. g.,Zone-3 at 2 microns: vacancy rich copper– E.g., Zone-4 at 10 microns: copper substrate
• Let active zones expand/contract– Zone-2 will expand: inter-diffusion/IMC formation– Zone-3 will shrink: Kirkendall vacancy formation– Zones1/4 will react:
• Calculate stresses in reactive zones
• Compare FEA scenario to experimental results
26
0 .9 1.8
2.8
3.8
4.8
5.8
7 8 9
10
Legend: zone-2 expansion
Distance from Surface-microns
-10
-8
-6
-4
-2
0
2
4
6
8
Stre
ss-ksi
zone-2=0
zone-2=.0001
zone-2=.001
zone 2=.00125
zone 2=.002
4-Zone Structure Stress States zone-3 shrinkage = .001
zone 1 zone 2 zone 3
The flexure beamIs concave downfor all 5 scenarios
for zone-1 showing how the Zone-1 stress becomes increasingly tensile with increasing zone-2 expansion
Finite Element AnalysisFinite Element Analysis
28
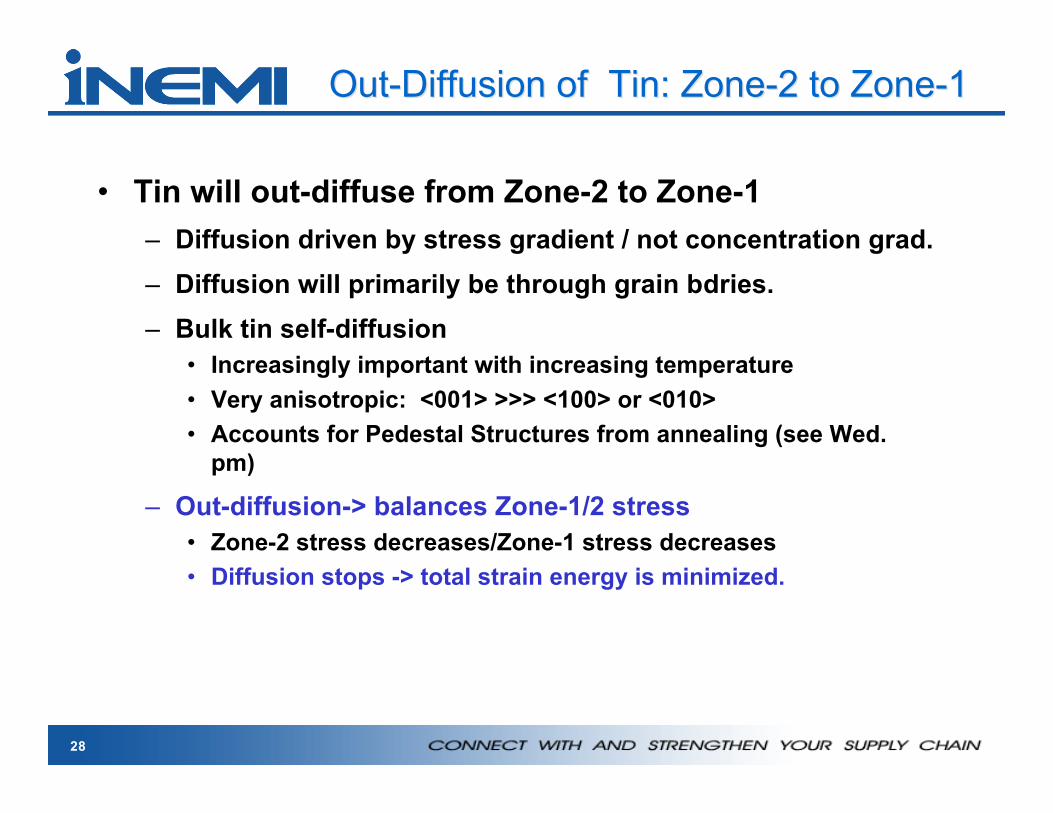
Out-Diffusion of Tin: Zone-2 to Zone-1Out-Diffusion of Tin: Zone-2 to Zone-1
• Tin will out-diffuse from Zone-2 to Zone-1– Diffusion driven by stress gradient / not concentration grad.– Diffusion will primarily be through grain bdries.– Bulk tin self-diffusion
• Increasingly important with increasing temperature• Very anisotropic: <001> >>> <100> or <010>• Accounts for Pedestal Structures from annealing (see Wed.
pm)
– Out-diffusion-> balances Zone-1/2 stress• Zone-2 stress decreases/Zone-1 stress decreases• Diffusion stops -> total strain energy is minimized.
29
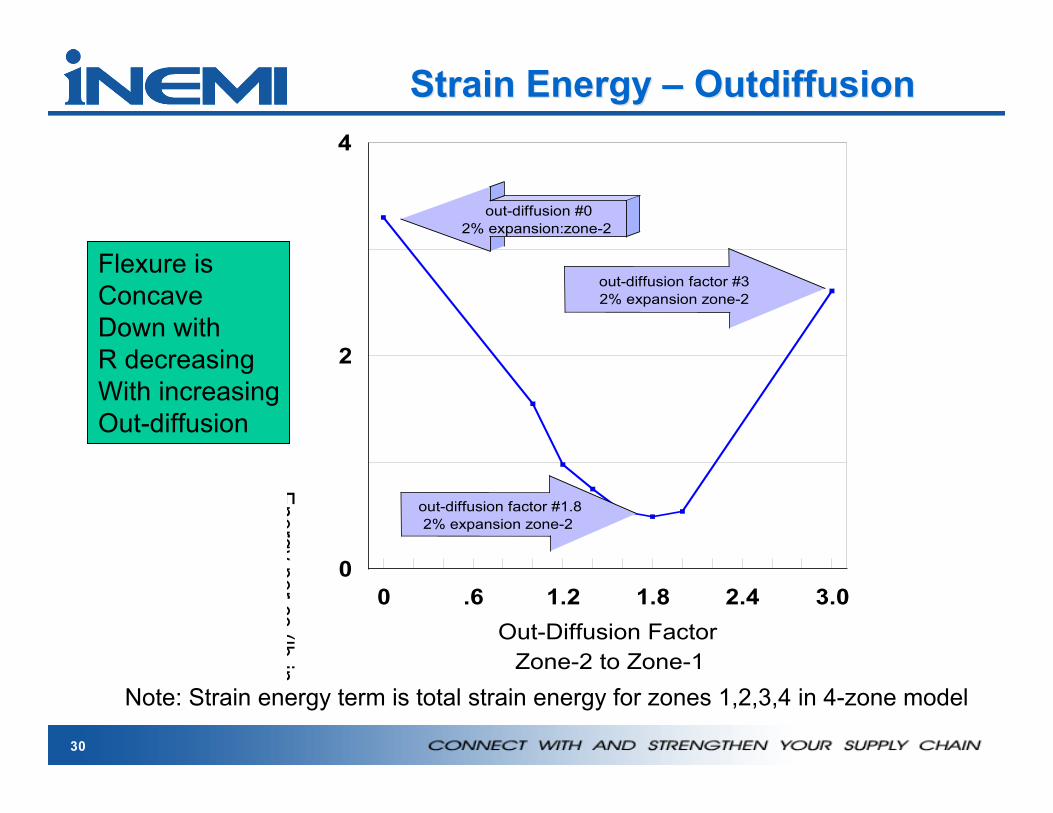
Starting point tin in tension
Equilibrium point tin incompression
Past equilibrium-tin in highcompression
e.g. –out diffusion factor 1.2means that the 2% expansionhas been reduced 1.2% by outdiffusion from zone-2 to zone-1
Finite Element Analysis Finite Element Analysis ––outdiffusionoutdiffusion
30
0 .6 1.2 1.8 2.4 3.0
Zone-2 to Zone-1
Out-Diffusion Factor
0
2
4
En
erg
y pe
r cc (lb-in
x 10
+6
)
out-diffusion #0
2% expansion:zone-2
out-diffusion factor #3
2% expansion zone-2
out-diffusion factor #1.8
2% expansion zone-2
Note: Strain energy term is total strain energy for zones 1,2,3,4 in 4-zone model
Flexure isConcave Down with R decreasingWith increasingOut-diffusion
Strain Energy Strain Energy –– Outdiffusion Outdiffusion
31
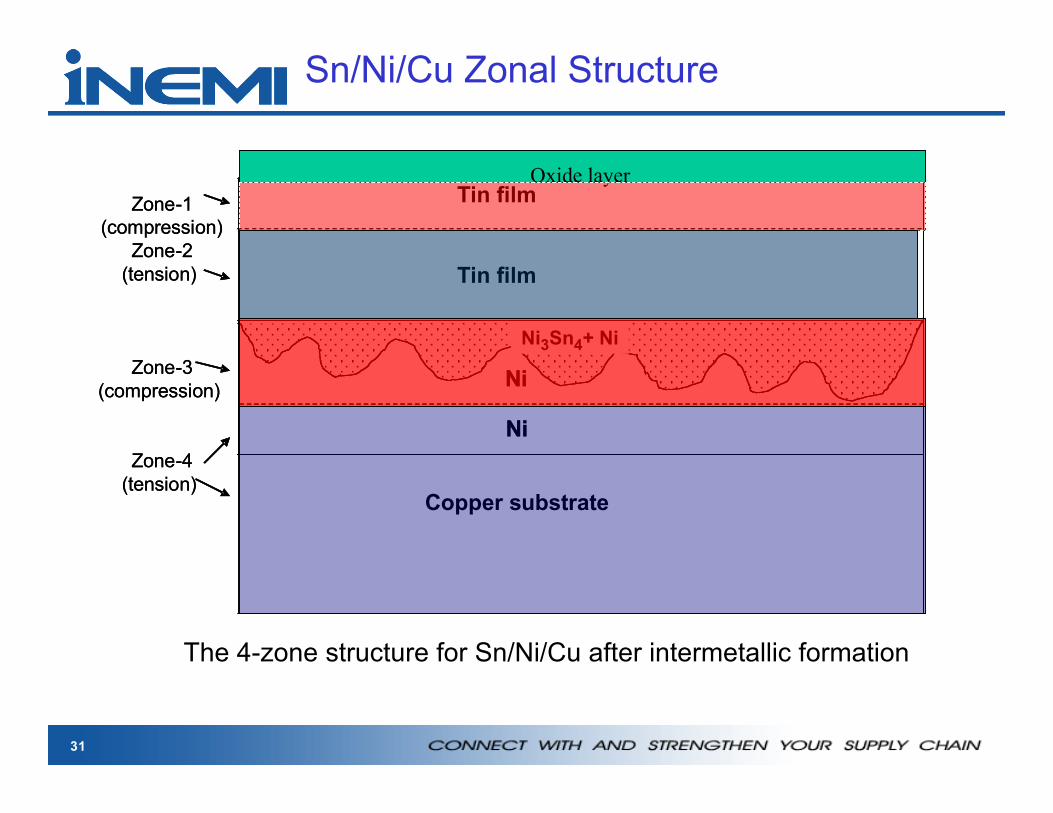
Zone-1
(compression)
Zone-2
(tension)
Zone-3
(compression)
Zone-4
(tension)
Ni3Sn4+ Ni
Ni
Ni
Copper substrate
Tin film
Tin film
Zone-1
(compression)
Zone-2
(tension)
Zone-3
(compression)
Zone-4
(tension)
Ni3Sn4+ Ni
Ni
Ni
Copper substrate
Tin film
Tin film
The 4-zone structure for Sn/Ni/Cu after intermetallic formation
Oxide layer
Sn/Ni/Cu Zonal Structure
32
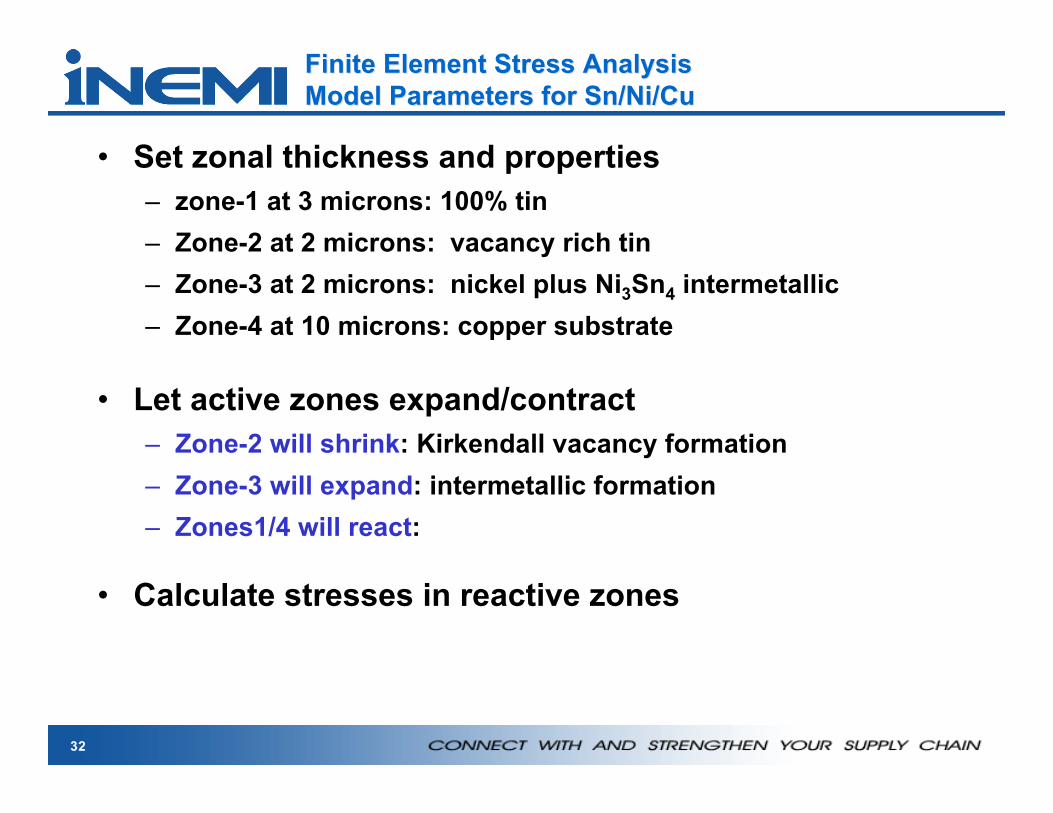
Finite Element Stress AnalysisFinite Element Stress AnalysisModel Parameters for Sn/Ni/CuModel Parameters for Sn/Ni/Cu
• Set zonal thickness and properties– zone-1 at 3 microns: 100% tin– Zone-2 at 2 microns: vacancy rich tin– Zone-3 at 2 microns: nickel plus Ni3Sn4 intermetallic– Zone-4 at 10 microns: copper substrate
• Let active zones expand/contract– Zone-2 will shrink: Kirkendall vacancy formation– Zone-3 will expand: intermetallic formation– Zones1/4 will react:
• Calculate stresses in reactive zones
33
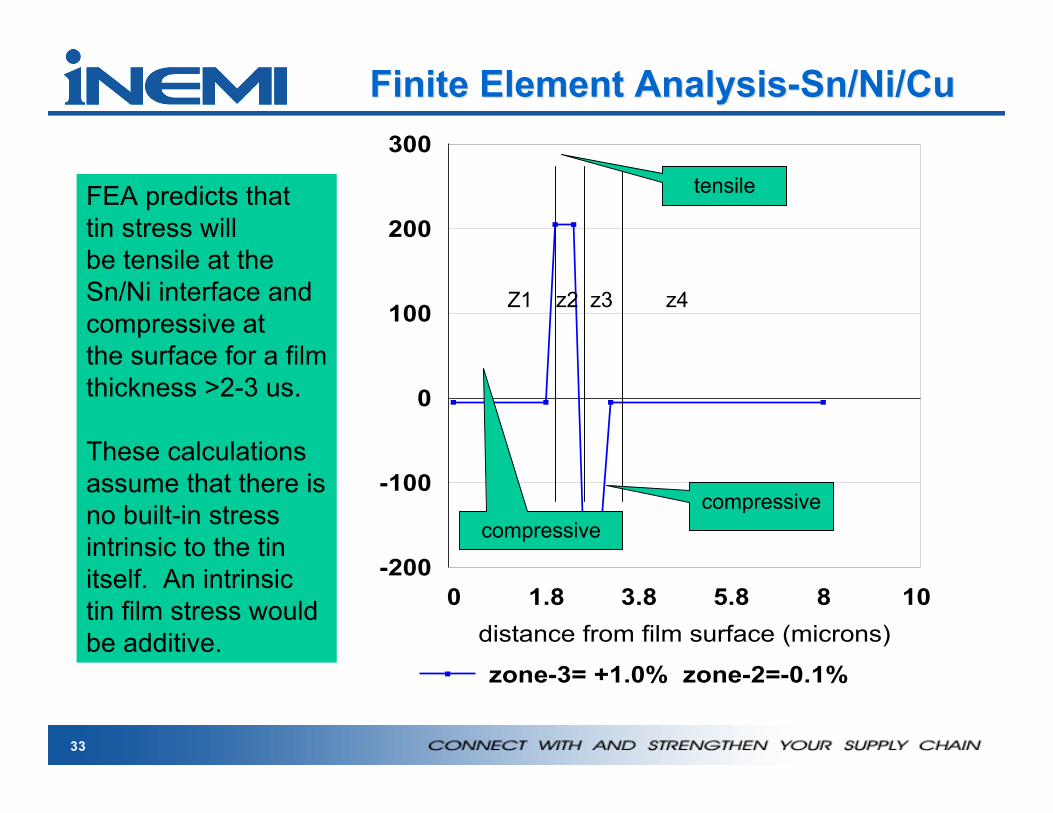
0 1.8 3.8 5.8 8 10
distance from film surface (microns)
-200
-100
0
100
200
300
Stre
ss (psi)
zone-3= +1.0% zone-2=-0.1%
Z1 z2 z3 z4
FEA predicts that tin stress willbe tensile at the Sn/Ni interface andcompressive at the surface for a filmthickness >2-3 us.
These calculations assume that there isno built-in stress intrinsic to the tin itself. An intrinsic tin film stress would be additive.
compressive
tensile
compressive
Finite Element Analysis-Sn/Ni/CuFinite Element Analysis-Sn/Ni/Cu
34
FEA SummaryFEA Summary
• FEA of Zonal Structures– Predicts Flexure Beam and XRD σ measurement in
opposition to each other
– Predicts that XRD at time zero may be tensile andover time goes compressive
35
What Does Stress Data Say?What Does Stress Data Say?
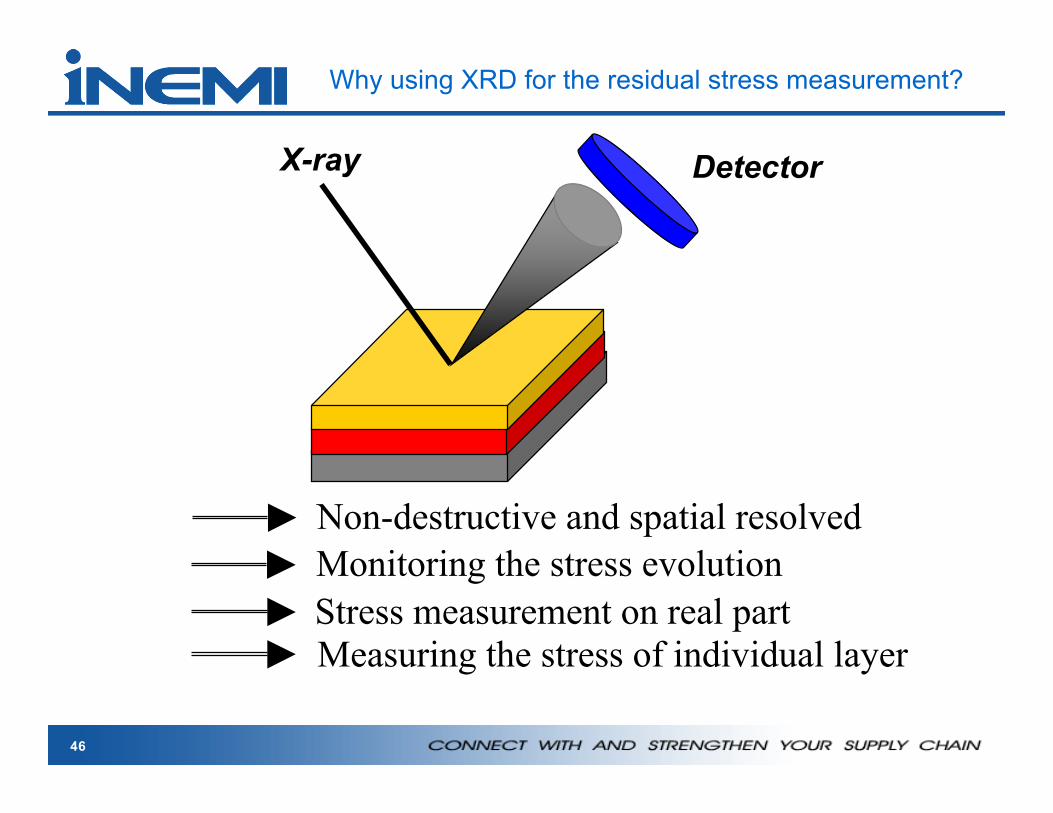
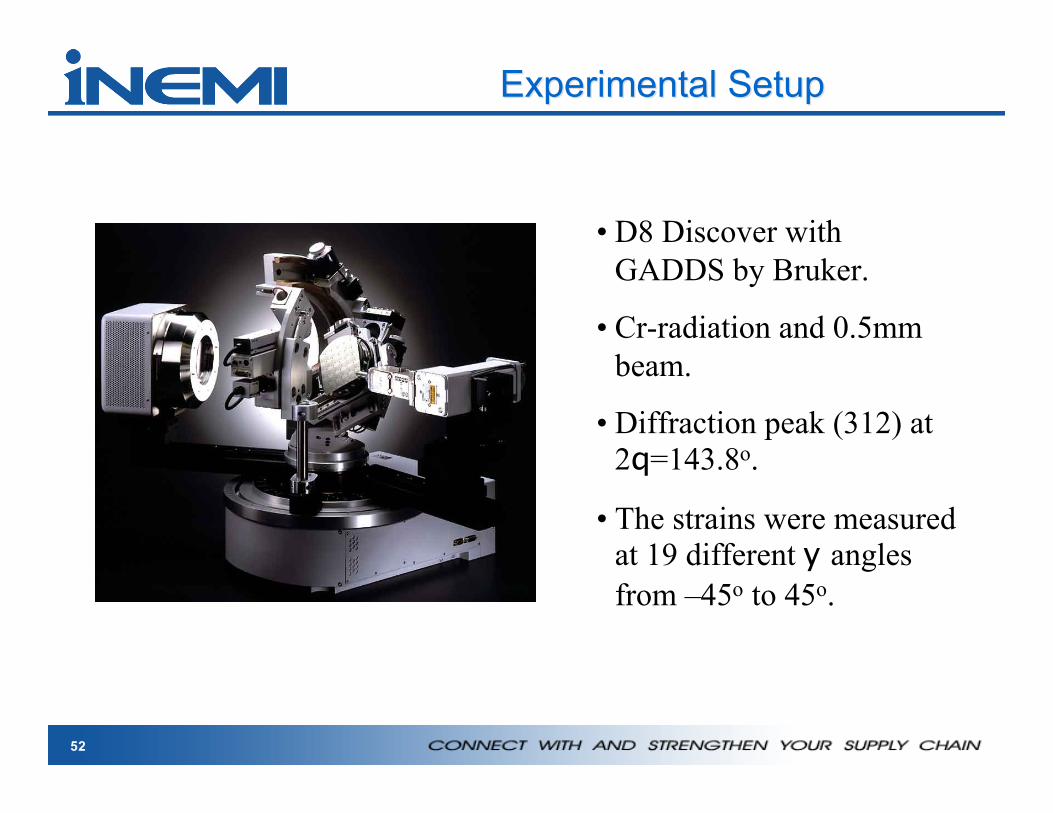
• XRD Data– C. Xu, Y. Zhang, et al: Cookson/Enthone Y2000+
• Flexure Beam Data– Lee and Lee: Seoul National University Y1998– S. Lal: FCI Corporation – Private Communication
36
XRD XRD for for Sn/Ni/Cu Sn/Ni/Cu aged 40 days at ambientaged 40 days at ambient
0.5
1.0
1.5
2.0
2.5
3.0
3.5
4.0
4.5
5.0
5.5
6.0
6.5
7.0
7.5
8,0
8.5
9.0
9.5
10
-10
-5
0
5
10
15
20
Stre
ss-M
Pa
Thickness of Tin Film for Sn/Ni/Cu Structure
For tin films <2.0 microns allXRD stress values are tensile
For tin films >2.0 microns allXRD stress values are compressive
These values are consistentwith FEA analysis of a zonalSn/Ni/Cu structure
Transition from tensile tocompressive
Reference: Cookson Electronics, C. Xu, et al.
37
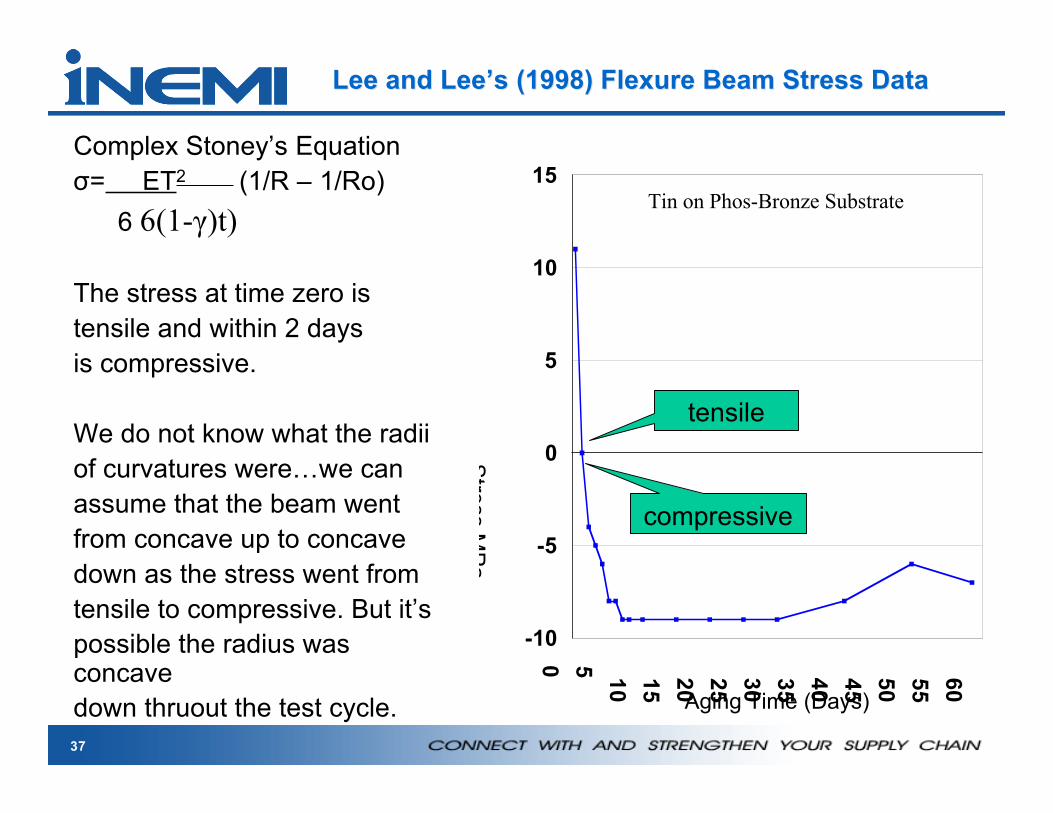
Lee and LeeLee and Lee’’s (1998) Flexure Beam Stress Datas (1998) Flexure Beam Stress Data
The stress at time zero istensile and within 2 daysis compressive.
We do not know what the radiiof curvatures were…we canassume that the beam wentfrom concave up to concavedown as the stress went fromtensile to compressive. But it’spossible the radius wasconcavedown thruout the test cycle.
tensile
compressive
Tin on Phos-Bronze Substrate
38
Com
pres
sive
Tens
ile
Aging Time
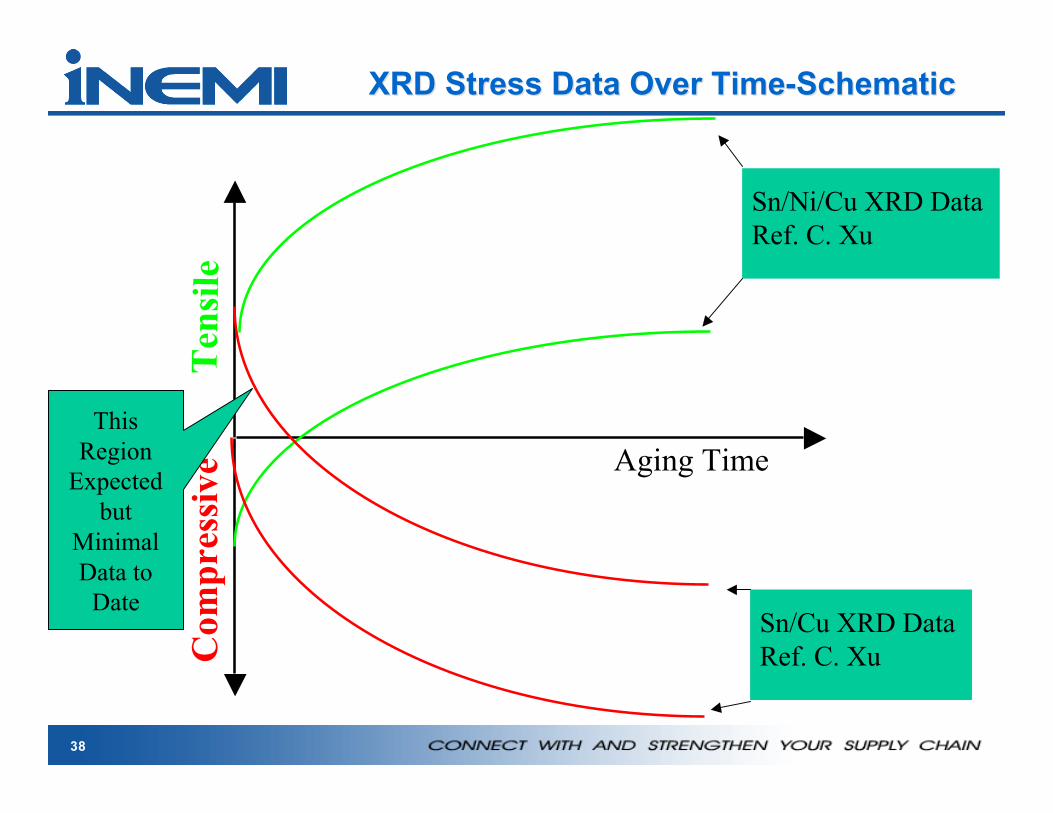
XRD Stress Data Over Time-SchematicXRD Stress Data Over Time-Schematic
Sn/Ni/Cu XRD Data Ref. C. Xu
Sn/Cu XRD DataRef. C. Xu
ThisRegion
Expectedbut
MinimalData to
Date
39
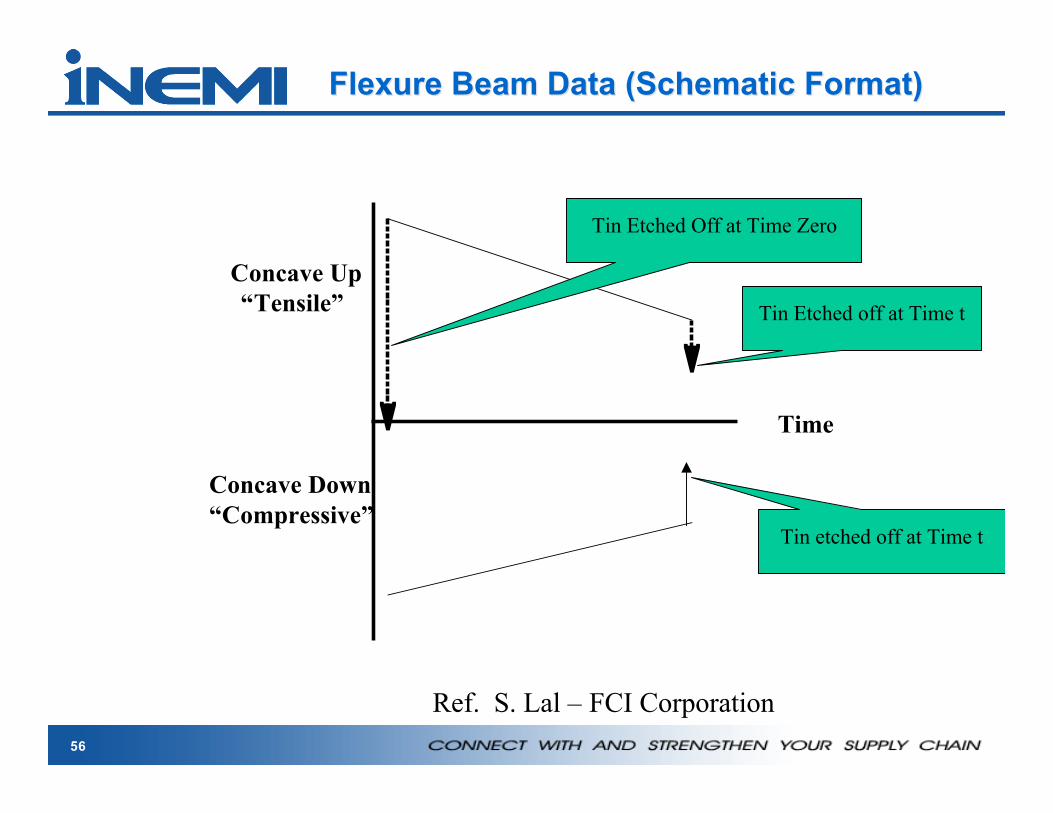
Flexure Beam Data (Schematic Format)Flexure Beam Data (Schematic Format)
Concave Up “Tensile”
Time
Concave Down“Compressive”
Tin Etched Off at Time Zero
Tin Etched off at Time t
Ref. S. Lal – FCI Corporation
Tin etched off at Time t
40
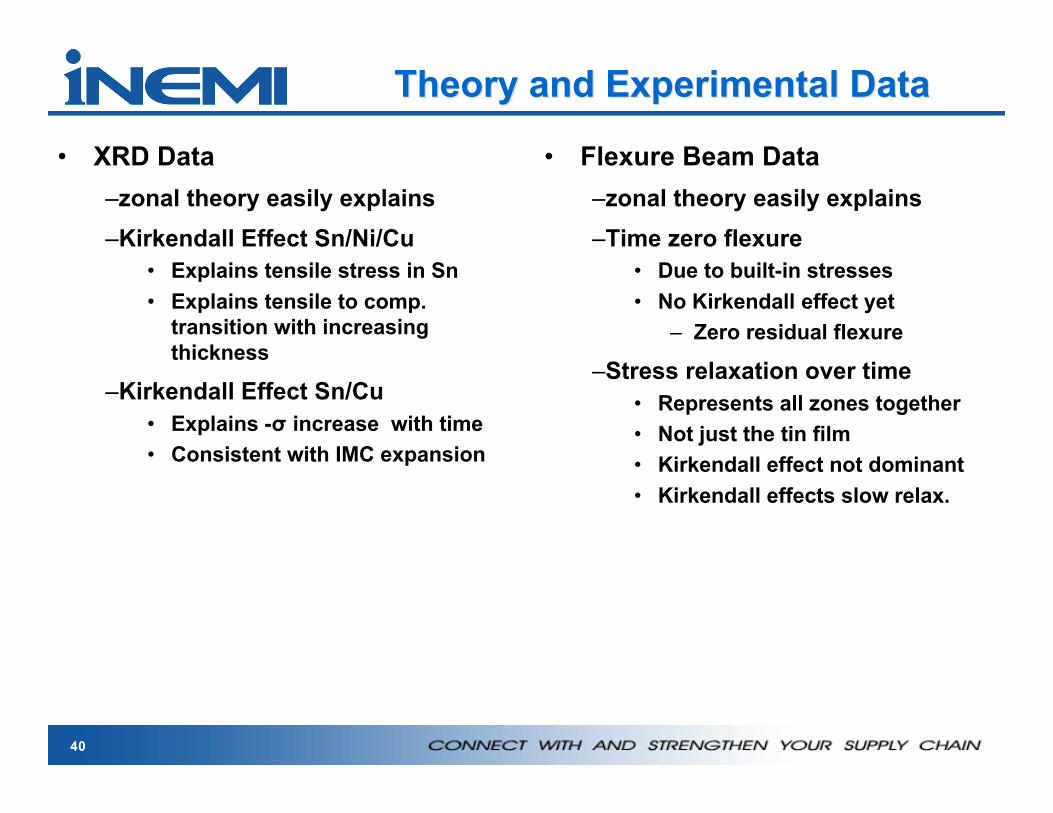
Theory and Experimental DataTheory and Experimental Data
• XRD Data–zonal theory easily explains–Kirkendall Effect Sn/Ni/Cu
• Explains tensile stress in Sn• Explains tensile to comp.
transition with increasingthickness
–Kirkendall Effect Sn/Cu• Explains -σ increase with time• Consistent with IMC expansion
• Flexure Beam Data–zonal theory easily explains–Time zero flexure
• Due to built-in stresses• No Kirkendall effect yet
– Zero residual flexure
–Stress relaxation over time• Represents all zones together• Not just the tin film• Kirkendall effect not dominant• Kirkendall effects slow relax.
• Stresses are biaxial– Results are in synch with Zonal Structure Theory
• Show predicted tensile/compression transition– Stress over Time analysis
• Tensile Stresses Increase with time to about 15 MPa
• XRD on Sn/Cu– Historical Data Set
• Stresses are biaxial• Compressive Stresses increase with time to 15-20 MPas
– Current data set very preliminary – Work in Progress• Latest Results will be discussed in Conference• Preliminary indications of tensile to compressive transition
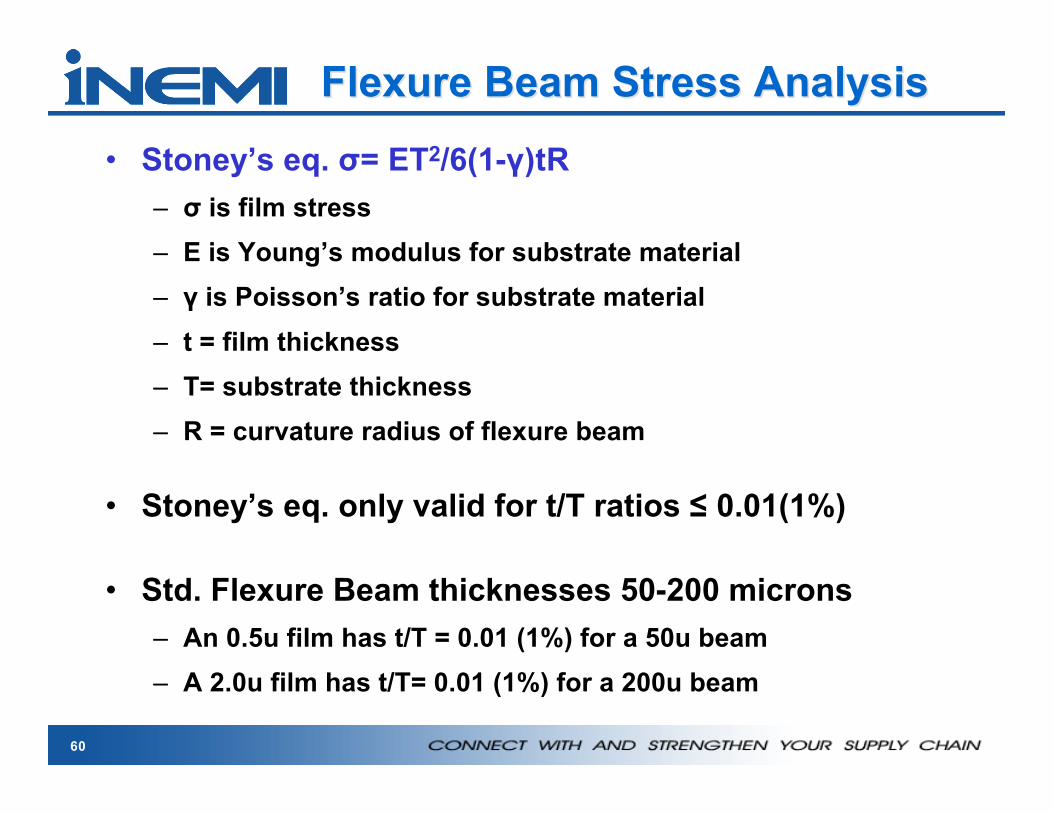
• Stoney’s eq. σ= ET2/6(1-γ)tR– σ is film stress– E is Young’s modulus for substrate material– γ is Poisson’s ratio for substrate material– t = film thickness– T= substrate thickness– R = curvature radius of flexure beam
• Stoney’s eq. only valid for t/T ratios ≤ 0.01(1%)
• Std. Flexure Beam thicknesses 50-200 microns– An 0.5u film has t/T = 0.01 (1%) for a 50u beam– A 2.0u film has t/T= 0.01 (1%) for a 200u beam
The stress at time zero istensile and within 2 daysis compressive.
We do not know what the radiiof curvatures were…we canassume that the beam wentfrom concave up to concavedown as the stress went fromtensile to compressive. But it’spossible the radius wasconcavedown thruout the test cycle.
tensile
compressive
Tin on phos-bronze substrate
63
Flexure beam with Concave Up curvature (i.e. “smiley faced)Simple Stoney’s analysis shows tensile stress in tin film
Zone-1 tin
Zone-2 imc
Zone-3Kirkendall vacs.
Zone-4Cu substrate
Note: Zone-1 (tin) may be compressive if the curvature is due to shrinkage in either zones 2/3.
Flexure Beam with Concave Down Curvature (i.e. “Grumpy Faced” )Simple Stoney’s analysis shows compressive stress in tin film
Note: Zone-1 may be tensile even though Stoney’s eq. says it is in compression. i.e., If Zone-1 only “reacts” to the expansionary action of underlying zones it will be in tension even though the curvature is concave down
Compressive StressCompressive StressDriving Force for Whisker FormationDriving Force for Whisker Formation
• Internal compressive stress– Agreed to by great majority of published authors– These authors agree
• Applied (external) mechanical stress– Not frequently addressed by published authors– Established by Fisher, Pitt, Glazunova– Some negative results (Dunn, private communications)– These authors agree: mech. Stress can induce whiskers
• Role of intermetallic at substrate interface– Majority believe IMC compresses film– These authors agree