DOCUMENT RESUME ED 354 345 CE 063 057 AUTHOR Stevens, David W.; And Others TITLE Measuring Employment Outcomes Using Unemployment Insurance Wage Records. INSTITUTION Research and Evaluation Associates, Inc., Washington, DC. SPONS AGENCY Office of Policy and Planning (ED), Washington, DC. PUB DATE 31 Dec 92 CONTRACT LC89001001 NOTE 233p. PUB TYPE Reports Research/Technical (143) EDRS PRICE MF01/PC10 Plus Postage. DESCRIPTORS Data Analysis; Databases; Data Collection; Data Interpretation; Data Processing; Demonstration Programs; Education Work Relationship; *Employment Patterns; *Employment Statistics; Federal Government; Information Utilization; *Payroll Records; Postsecondary Education; Program Implementation; Recordkeeping; *State Programs; *Unemployment Insurance; Users (Information); Vocational Education; *Vocational Followup; Wages ABSTRACT This report presents findings of a demonstration project that tested the concepts and applications of linking student records using social security numbers with state unemployment insurance (UI) wage and other data sources. It also contains information of value to policymakers, state and local administrators, practitioners, and consumers of postsecondary vocational education. Chapter I explores the value of wage data sources in examining trends regarding former students in the workplace. Chapter II provides the historical perspective and looks at the changing legislative environment and factors influencing the use of state UI wage data. Chapter III identifies needs of various audiences for employment and earnings information. Chapter IV describes concepts tested by the demonstration project as well as the data sources and elements used. Chapter V presents findings from the two-state demonstration to illustrate how wage data can be used and presented. Chapter VI provides a profile of the strength of the longitudinal perspective. Chapter VII discusses five steps for state implementation of a system to link school-based information with state UI and ethe: state and federal wage data records: (1) plan and determine data priorities, (2) identify state and federal administrative data sources, (3) make data collection decisions, (4) develop data processing procedures, and (5) conduct data analysis. Appendixes include 91 endnotes and a discussion of the differences between outcome measures and performance standards. (YLB) *********************************************************************** Reproductions supplied by EDRS are the best that can be made from the original document. **********************************************************************
Transcript
DOCUMENT RESUME
ED 354 345 CE 063 057
AUTHOR Stevens, David W.; And OthersTITLE Measuring Employment Outcomes Using Unemployment
Insurance Wage Records.INSTITUTION Research and Evaluation Associates, Inc., Washington,
DC.
SPONS AGENCY Office of Policy and Planning (ED), Washington,DC.
PUB DATE 31 Dec 92CONTRACT LC89001001NOTE 233p.PUB TYPE Reports Research/Technical (143)
EDRS PRICE MF01/PC10 Plus Postage.DESCRIPTORS Data Analysis; Databases; Data Collection; Data
Interpretation; Data Processing; DemonstrationPrograms; Education Work Relationship; *EmploymentPatterns; *Employment Statistics; Federal Government;Information Utilization; *Payroll Records;Postsecondary Education; Program Implementation;Recordkeeping; *State Programs; *UnemploymentInsurance; Users (Information); Vocational Education;*Vocational Followup; Wages
ABSTRACTThis report presents findings of a demonstration
project that tested the concepts and applications of linking studentrecords using social security numbers with state unemploymentinsurance (UI) wage and other data sources. It also containsinformation of value to policymakers, state and local administrators,practitioners, and consumers of postsecondary vocational education.Chapter I explores the value of wage data sources in examining trendsregarding former students in the workplace. Chapter II provides thehistorical perspective and looks at the changing legislativeenvironment and factors influencing the use of state UI wage data.Chapter III identifies needs of various audiences for employment andearnings information. Chapter IV describes concepts tested by thedemonstration project as well as the data sources and elements used.Chapter V presents findings from the two-state demonstration toillustrate how wage data can be used and presented. Chapter VIprovides a profile of the strength of the longitudinal perspective.Chapter VII discusses five steps for state implementation of a systemto link school-based information with state UI and ethe: state andfederal wage data records: (1) plan and determine data priorities,(2) identify state and federal administrative data sources, (3) makedata collection decisions, (4) develop data processing procedures,and (5) conduct data analysis. Appendixes include 91 endnotes and a
discussion of the differences between outcome measures andperformance standards. (YLB)
U IS DEPARTMENT OF EDUCATIONOffice or Educational Reseruch and improvement
ED ATIONAL RESOURCES INFORMATIONCENTER (ERIC)
This document has been reproduced asreceived from the person or organizationoriginating it
O Minor changes bloc been made to improvereproduction Quality
Points of view or opinions slated in this docu-
ment do not necessarily represent officialOERI position or policy
.
k 10 A
2 BEST COPY AVAILABLE
rfsoita
Measuring Employment Outcomes UsingUnemployment Insurance Wage Records
December 31, 1992
David W. StevensRegional Employment Dynamics Center
University of Baltimore
Peggy A. RichmondJoseph F. Haenn
Joan S. MichieResearch and Evaluation Associates, Inc.
Prepared for the U.S. Department of Educationunder contract by:
Research and Evaluation Associates, Inc.Washington, DC
Contract No. LC89001001
U.S. DEPARTMENT OF EDUCATION OFFICE OF POLICY AND PLANNING
r.
The views expressed In this report developed under contract to theU.S. Department of Education do not necessarily reflect the position orpolicy of the Department, and no official endorsement by theDepartment should be inferred.
ACKNOWLEDGMENTS
Over two decades of learning about administrative data sources lie behind thisreport. Many people provided guidance and encouragement along the way. Morerecently, school administrators in two states- -who were promised anonymity- -agreedto cooperate fully in the Demonstration Project through which the data in this volumewere acquired and processed. State Employment Security Agency personnel in eachstate provided the wage record data that serve as the core of the archival approachdescribed in this volume. To these mentors and necessarily anonymous colleagueswe express grateful appreciation.
Two Federal agencies contributed to the assembly of the 22 data sets thatwere processed. Dr. Phillip A.D. Schneider, Assistant Director for WorkforceInformation, In the U.S. Office of Personnel Management, and his colleagues AndrewKiugh and Ben Clayton, provided access to unit-record information about Federalcivilian employees. Kenneth C. Sheflen, Director of the U.S. Department of Defense'sManpower Data Center, and his colleague Stewart Reiman, provided comparableinformation for military personnel who had been former students in the two states.
Robert L. Crosslin, American University, and Richard J. McHugh, Director ofthe Center for Economic and Management Research at the University of SouthFlorida, were consultants to the study and helped to acquire the data needed toinvestigate the importance of local economic conditions as factors in understandingeducational outcomes.
Most data processing and analytical support services were ably provided byDebra Hoover and James Warren, both affiliated with the University of Baltimore'sRegional Employment Dynamics Center. Without their expertise and dedication, dataextraction and presentation could not have been completed in a timely manner.
Over the course of the three year study, several other staff members ofResearch and Evaluation Associates helped to collect data, analyze data, andprepare preliminary reports. They are: Richard White, Brenda Lester, Patricia Perry,Kim Hrabak, Zenzi Hopkins, and Hope Reed.
Finally, this project could not have been completed without the leadership andguidance of our project officer, David Goodwin, in the Office of Policy and Planning,U.S. Department of Education. His steadfast commitment to this effort made the workprofessionally satisfying and person ally enjoyable. We thank him.
David W. StevensPeggy A. Richmond
Joseph F. HaennJoan S. Michie
ii
EXECUTIVE SUMMARY
In vocational education, as in other areas of education, assessment of studentperformance is increasingly viewed as a way to measure program quality and tomotivate program Improvement. Job placement and earnings are two of the basicoutcomes of interest in any program designed to prepare students for work. Whenmeasuring these outcomes, educational Institutions have traditionally collected suchinformation through surveys of their graduates, but the results reported are widelyconsidered to be unreliable. Policymakers and program administrators have soughtnew ways to improve the measurement of employment outcomes for studentsparticipating in vocational programs.
Federal education policy is moving rapidly toward an emphasis on measuringperformance as an Indicator of program accountability. The Carl D. PerkinsVocational and Applied Technology Education Act requires states to developperformance measures and standards for vocational education at the secondary andpostsecondary levels. The recently reauthorized Higher Education Act strengthensthe role of states in reviewing eligibility of institutions seeking to participate in Federalstudent aid programs. Institutions subject to review are required to meet establishedstate standards, which in the case of programs whose objectives are preparation foremployment include assessment of students' earnings and employment.
States are also Instituting their own systems of accountability. These systems oftenentail some assessment of the employment experience of students enrolled invocational programs. For example, in Florida, programs are required to attain a 70percent job-placement rate to remain eligible for state vocational education funds.Tennessee has a system of performance-based funding for higher education thatincludes, for public two-year colleges, a measure of the program's job placement rate.In Washington, the State Board for Community College Education publishes findingson the vocational outcomes for graduates of community college programs.
This study was undertaken to explore the feasibility of using state unemploymentinsurance (UI) wage record data and other routinely maintained state and Federaldata to measure the labor market performance of students enrolled in proprietaryinstitutions and community colleges. Unlike school surveys, the U! data do not sufferfrom low response rates (over 90 percent of civilian employees are covered), are notsubject to faulty recall by respondents, and entail no new data collection burden onrespondents.
iii
Methods
Using social security numbers, the study matched student and employment recordsof approximately 11,000 former students who had attended different communitycolleges and proprietary schools in two states. The data bases used include: a)student records; b) unemployment insurance wage records for the state where thestudent attended school; c) state unemployment insurance wage records fromadjacent states; d) Office of Personnel Management (OPM) data for Federal civilianemployees; and e) U.S. Department of Defense manpower data for military personnel.The results obtained, although based on actual records, are designed to illustrate thepossible uses of these data. The results are not based on a representative sampleof states, institutions, types of institutions, or occupational fields.
The primary source of data used in this study for determining post-programemployment and earnings is state unemployment insurance wage records. UI wagerecords consist of quarterly reports of earnings submitted by each employer who isrequired to comply with a state's unemployment compensation law. For each coveredemployee, an employer is required to report the employee's social security numberand the total amount of earnings during the quarter. The employer also reportshis/her own unique employer identification number, geographic code, and an industryaffiliation. UI wage records are collected and maintained by the State EmploymentSecurity Agency in each state except Massachusetts and New York, which do notcurrently require employers to report this information until a claim to receiveunemployment benefits is filed.
Findings
The chief findings from the study are:
The use of existing records resulted in identification of employment andearnings for nearly 80 percent of former students. This substantially exceedsthe response rate normally associated with school-administered surveys.
Figure 1 shows the employment rate of former community college studentsbroken down by different data sources. By using UI wage records alone, 62percent of former students in State A were found and 72 percent in State B.The use of three additional data sources for State A--adjacent state UI records,OPM data on Federal employment, and DOD manpower records, raised thetotal number of former students located to 78 percent. The use of a state database on higher education enrollment, although not part of this study, wouldfurther increase the percentage of former students located. These resultsshow that in some states the use of UI wage records alone may be sufficientto obtain reliable results. Where labor markets cross statelines or where thereis substantial Federal civilian or military employment, the use of additional datasources may be helpful.
:v
100
80
ce
cCC 60
O G.
Q i s 40
C.)
20
0
Hi WV.Record
Fed. Adj.Civilian
EnMI Mete Milltety
No AdjacentSW. Data Used
State A State B
Figure 1. Cumulative Percentage of Employment by Source ofData for Two States
UI records can be used to access both short and long term employment andearnings growth patterns for former students. The study generated a widerange of findings comparing the employment and earnings of students indifferent schools, students attending public and private institutions, males andfemales, program graduates and non-completers, students with different gradepoint averages, and students majoring in different fields.
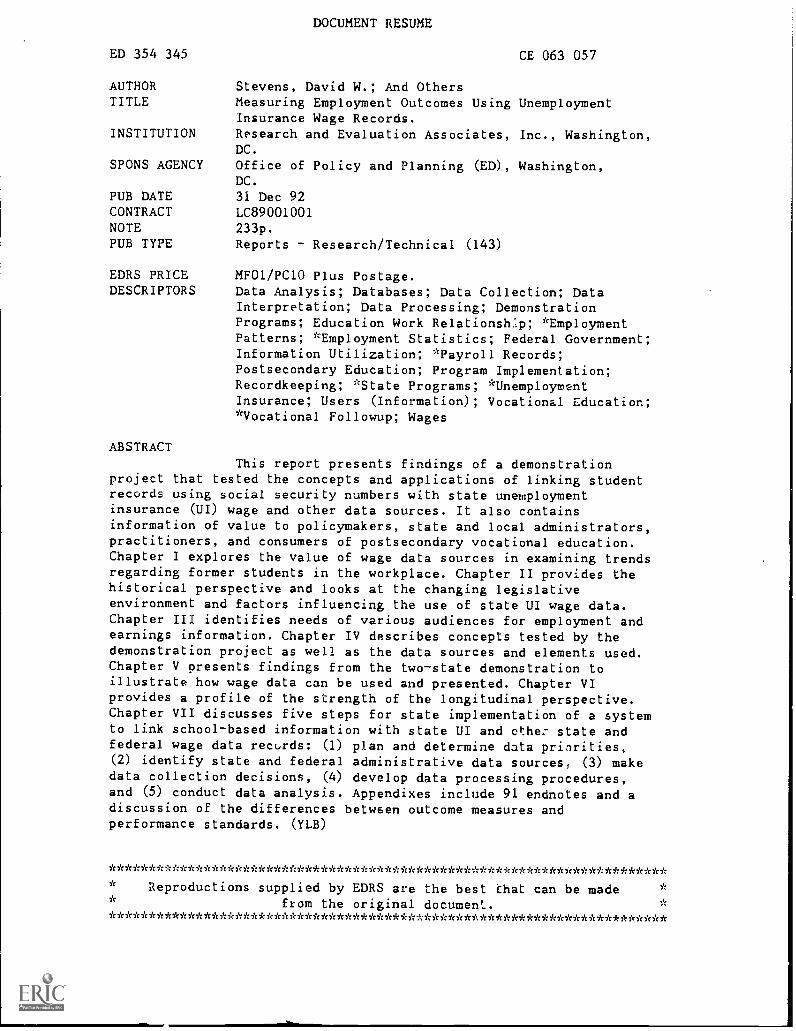
Figure 2 illustrates how the employment rate of students attendingsimilar programs at different institutions can be compared. In thisexample, there are clear and consistent differences in the jobplacement rate of students attending different schools. The ability tocompare job-placement rates for students in different institutions iscritical to establishing a system of accountability for educationaloutcomes.
Figure 2. Employment Rate by Selected Institutions forStudents Majoring in Data Processing Technologies
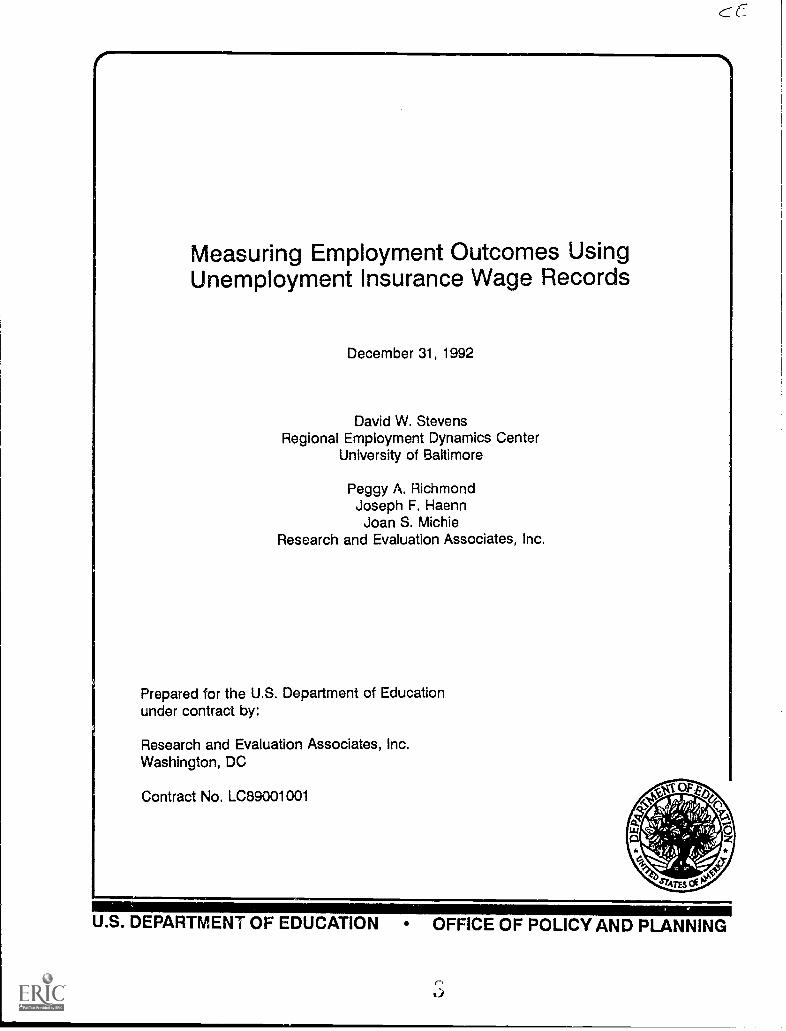
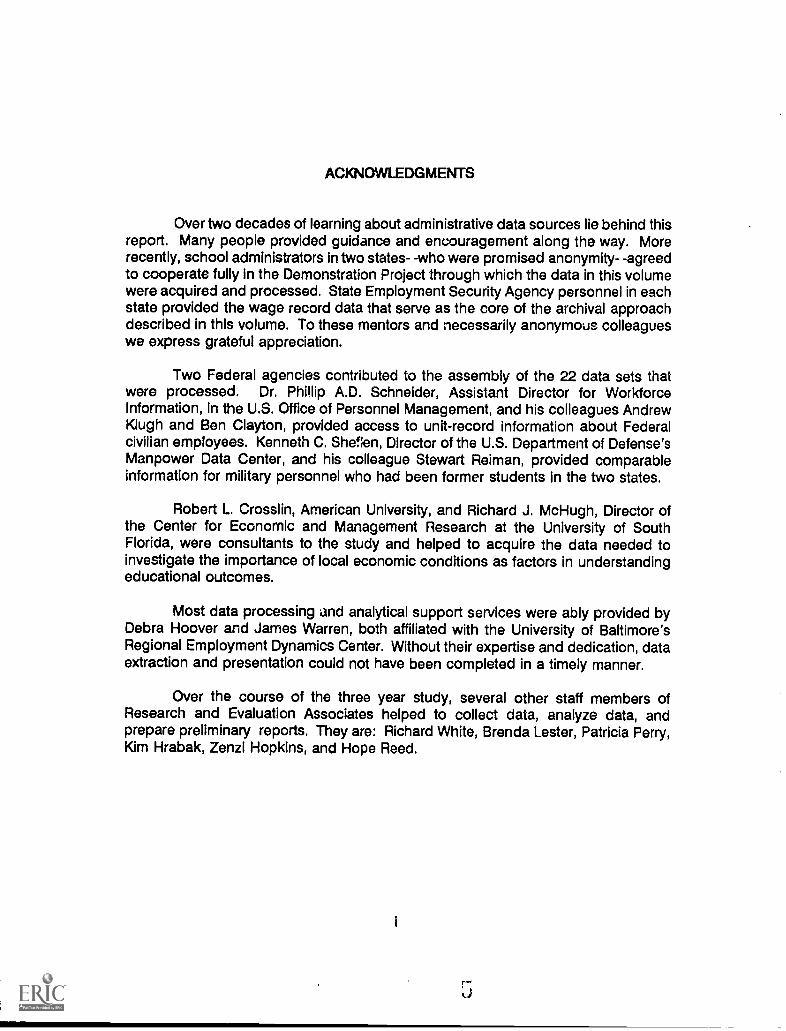
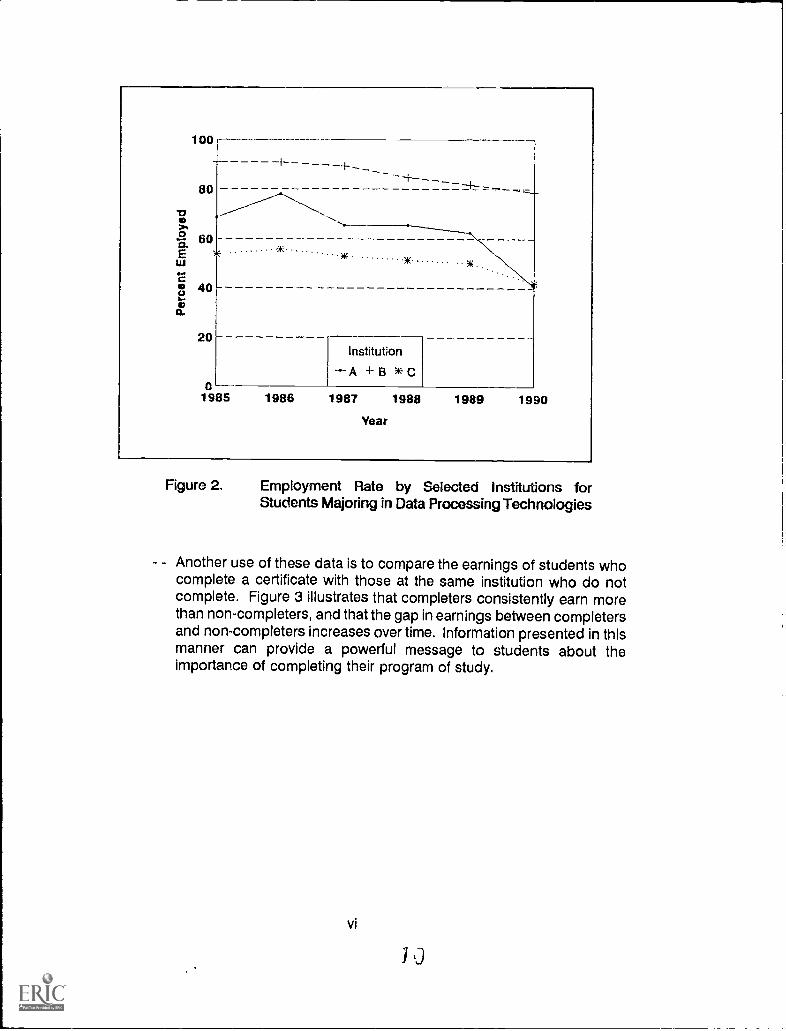
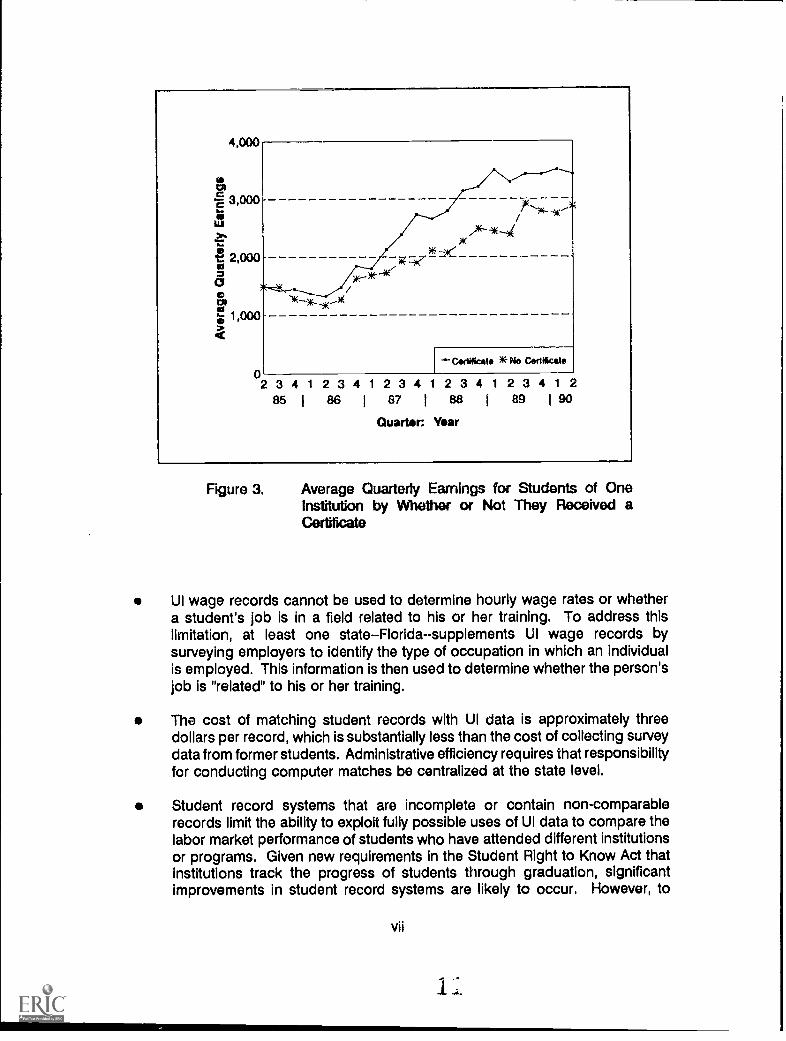
Another use of these data is to compare the earnings of students whocomplete a certificate with those at the same institution who do notcomplete. Figure 3 illustrates that completers consistently earn morethan non-completers, and that the gap in earnings between completersand non-completers increases over time. Information presented in thismanner can provide a powerful message to students about theimportance of completing their program of study.
vi
I LJ
4,000
al-2 3,000now),..A.
t 2,000as=0Oal,i; 1,000
4
02 3 4 1 2 3 4 1 2 3 4 1 2 3 4 1 2 3 4 1 2
85 I 86 I 87 I 88 I
Quarter; Year
89 1 90
Figure 3. Average Quarterly Earnings for Students of OneInstitution by Whether or Not They Received aCertificate
UI wage records cannot be used to determine hourly wage rates or whethera student's job is in a field related to his or her training. To address thislimitation, at least one state--Florida--supplements UI wage records bysurveying employers to identify the type of occupation in which an individualis employed. This information is then used to determine whether the person'sjob is "related" to his or her training.
The cost of matching student records with UI data is approximately threedollars per record, which is substantially less than the cost of collecting surveydata from former students. Administrative efficiency requires that responsibilityfor conducting computer matches be centralized at the state level.
Student record systems that are incomplete or contain non-comparablerecords limit the ability to exploit fully possible uses of UI data to compare thelabor market performance of students who have attended different institutionsor programs. Given new requirements in the Student Right to Know Act thatinstitutions track the progress of students through graduation, significantimprovements in student record systems are likely to occur. However, to
vii
compare the employment experience of students by race, gender, program ofstudy, grade point average, credits earned, or other characteristics notaddressed in the Student Right to Know Act, it would be necessary to ensurethat such data are Included in the student records that schools maintain.
To ensure the confidentiality of UI records, rules must be established toprotect the privacy of students and employers. This study has censored anydata with less than three records in a cell.
Conclusions
This study concludes that the use of UI wage records is a viable strategy to improvethe assessment of employment rates and earnings for graduates of vocationalprograms. Future applications of the methodology tested in this study will occurprimarily at the state level. For example, Florida now makes extensive use of UI wagerecords as part of a state-wide accountability system applicable to vocationaleducation and other job training programs. Other states have begun recently toexplore possible use of this resource. In the future, states would rely on thisapproach to develop performance indicators in vocational education and respond tonew oversight requirements mandated in the Higher Education Act.
viii
12
CONTENTS
PAGE
ACKNOWLEDGMENTS
EXECUTIVE SUMMARY iii
TABLES xii
FIGURES xiii
I. INTRODUCTION 1
Purpose of the Study 1
Structure of the Report 24
How to Use the Report 26
II. THE CONTEXT 26
Historical Perspective 26
Deficit Reduction Act of 1984 27
America 2000 28
Legislation in the 1990's 29
Participants' Views of Accountability Issues 30
III. CONSUMERS, VOCATIONAL EDUCATION ADMINISTRATORS, ANDPOUCYMAKERS: QUESTIONS THAT CAN BE ANSWERED WITH WAGE
RECORD DATA 32
Consumers 32
Vocational Education Administrators 35
Policymakers 36
IV. TESTING THE CONCEPTS 39
Data Sources 41
Core of Data Elements 48
External Factors 50
ix
PAGE
V. FINDINGS OF THE DEMONSTRATION PROJECT 52
Introduction 52Employment and Earnings and Programs 54Effects of Data Collection Decisions on Outcomes 64Former Students at the Time of Initial Application 67Enrollment Persistence and Employment Rates 73Grades and Future Earnings 77Outcomes and Institutions 79Earning Gains of Former Students 83Student Characteristics and Outcomes 86Outcomes and the Local Economy 94Lessons Learned 100
VI. WHICH IS BETTER? POINT-IN-TIME OUTCOMES VERSUS THELONGITUDINAL PERSPECTIVE 101
Point-in-Time Employment 101The Longitudinal Perspective of Employment and Earnings 107A Profile of the Strengths of the Longitudinal Approach 113
VII. FIVE STEPS FOR STATE IMPLEMENTATION 114
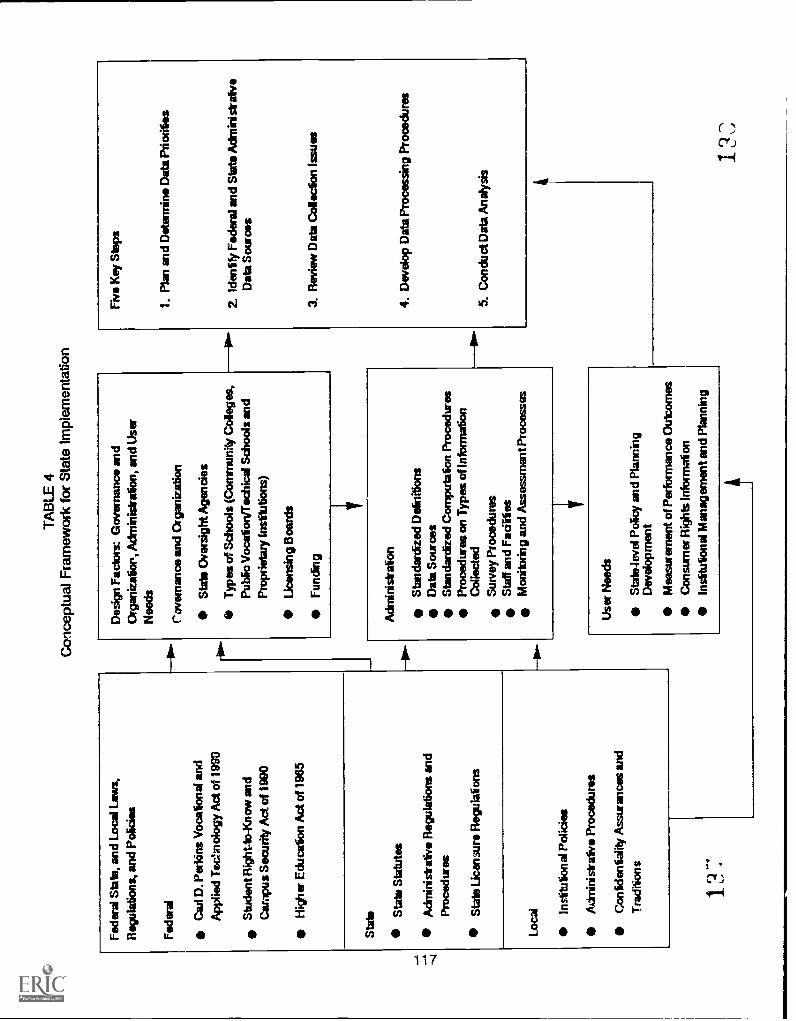
Introduction 114Conceptual Framework for State Implementation 118Overview of the Five Steps 122
Step 1. Plan and Determine Data Priorities 123
Start with a Few Key Agencies 123Plan Interagency Agreement With State Employment
Security Agency (SESA) 127Determine Priorities for Data Collection 130Planning Checklist 134
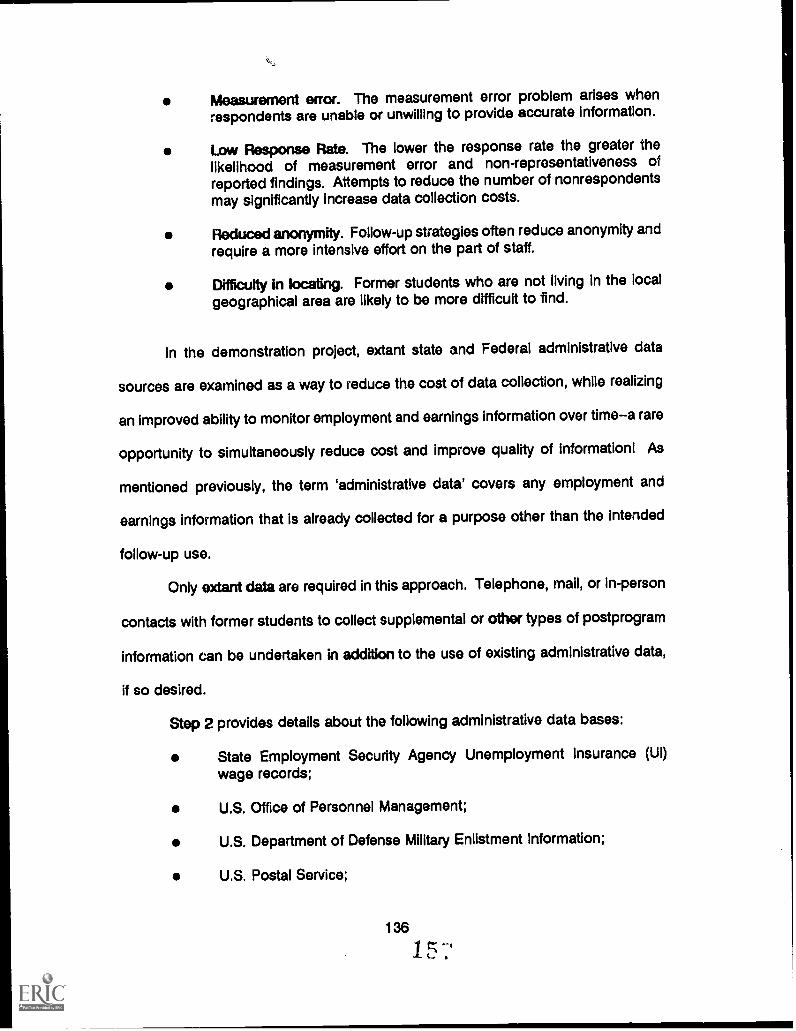
Step 2. Identify State and Federal AdministrativeData Sources 135
Insurance (UI) Wage Records 137U.S. Office of Personnel Management 141U.S. Department of Defense Military Enlistment
Information 143U.S. Postal Service 144
x
PAGE
Social Security Administration Information 145
Internal Revenue Service Information 146
Checklist for Data Sources 148
Step 3. Make Data Collection Decisions 149
Background and Overview 149
Data Elements from Institutional Records 152
Social Security Number 152
Curriculum Coding 156
Student Demographics 157
SESA UI Wage Records 161
Confidentiality of State UI Wage Records 166Data Elements for External Factors 168
A Recap of Data Collection Issues 170
Step 4. Develop Data Processing Procedures 171
Introduction 171
Integration of Systems 171
Interdependencies in Data Flows 174Assignment of Responsibilities 175
Funding Arrangements 176Completion of Interagency Agreements 176
Step 5. Conduct Data Analysis 179
How to Build a Comprehensive Data Platform 179
Data Analysis 184Interpretation of Data 185
ENDNOTES 186
APPENDIX, OUTCOME MEASURES VERSUS PERFORMANCE STANDARDS . 200
Concepts 201
Historical Precedents 202
Principles 204
The Mechanics of Measurement 205
The Relevance of Employment and Earnings Outcome Measures 207
Endnotes 209
xi
1
TABLES
PAGE
1. Questions That Consumers Might Ask 34
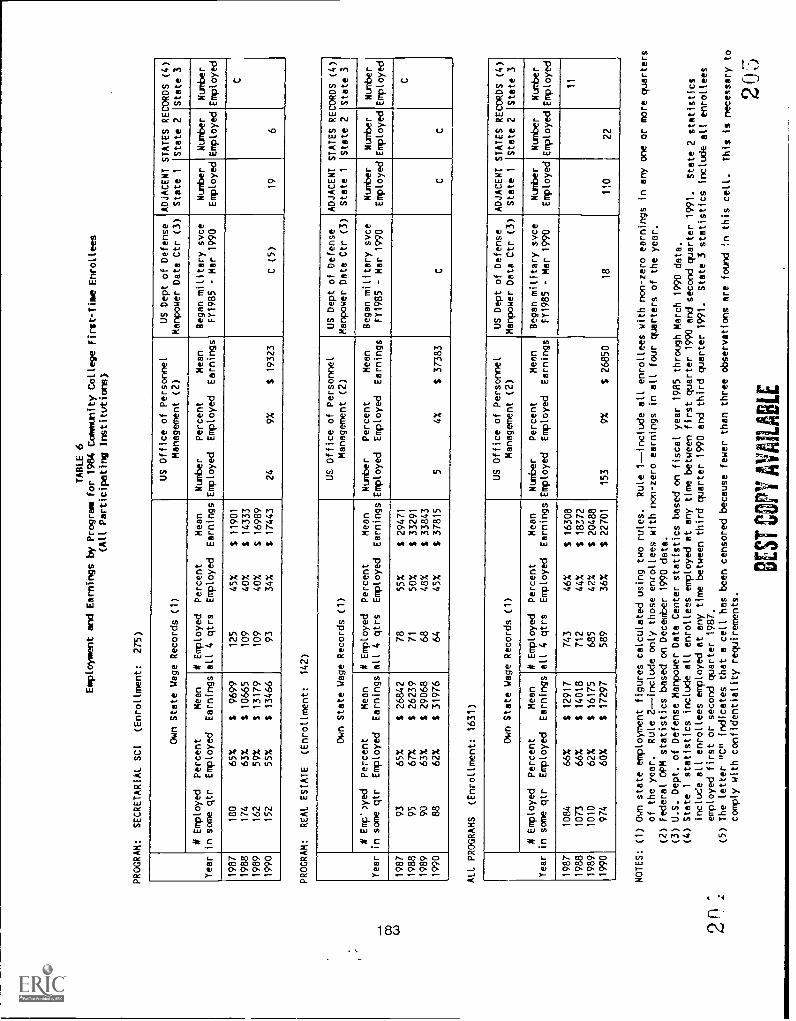
2. Employment and Earnings by Program for 1984Community College First-Time Enrollees(All Participating Institutions in One State) 55
3. Employment and Earnings by Program for 1984Community College First-Time Enrollees(All Participating Institutions)
61
4. Conceptual Framework for State Implementation 117
5. Employment and Earnings by Program for 1984Community College First-Time Enrollees(All Participating Institutions in One State) 180
6. Employment and Earnings by Program for 1984Community College First-Time Enrollees(All Participating Institutions) 183
xii
i t3
FIGURES
PAGE
1. Employment Rate by Selected Institutkins for StudentsMajoring in Data Processing Technologies 8
2. Cumulative Percentage of Employment by Sourceof Data for Two States 9
3. Employment Rate by Selected Institutions for DataProcessing Technologies 12
4. Employment Rate for Students of One Institution byWhether or Not They Received a Certificate 14
5. Average Quarterly Earnings for Students of OneInstitution by Whether or Not They Receiveda Certificate 15
6. Average Quarterly Earnings by Grade Point Averageat Program Exit 16
7. Employment Rate by Gender 17
8. Average Quarterly Earnings by Gender 18
9. Employment Rates of 1984 Community College Businessand Commercial Technology Enrollees by the Growth Levelof the County in Which the College is Located 20
10. Earnings of 1984 Community College Business andCommercial Technology Enrollees by Growth Level ofCounty in Which the College Is Located 21
11. Uses of Existing State and Federal Data Sources 33
12. Summary of Table 2 62
13. Summary of Table 3 63
14. Difference Between Annualized Quarterly Earningsand Actual Annual Earnings 65
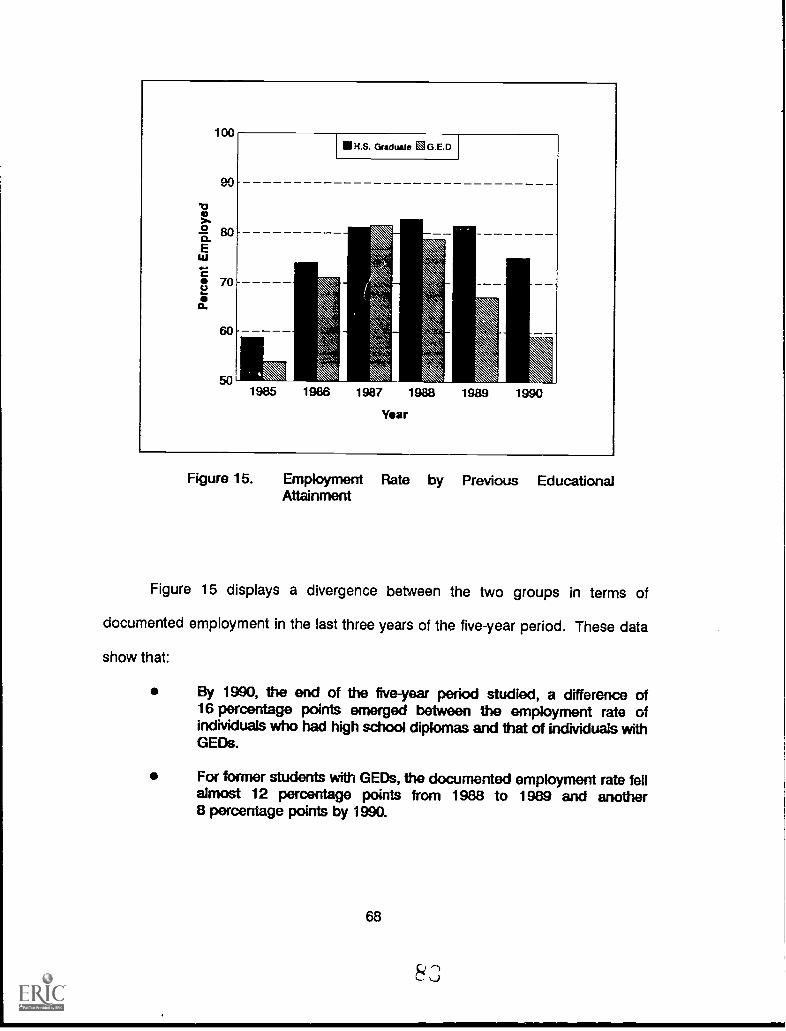
15. Employment Rate by Previous Educational Attainment 66
1"'
PAGE
16. Employment Rate by Educational Goal at Time ofEntry to the Institution 70
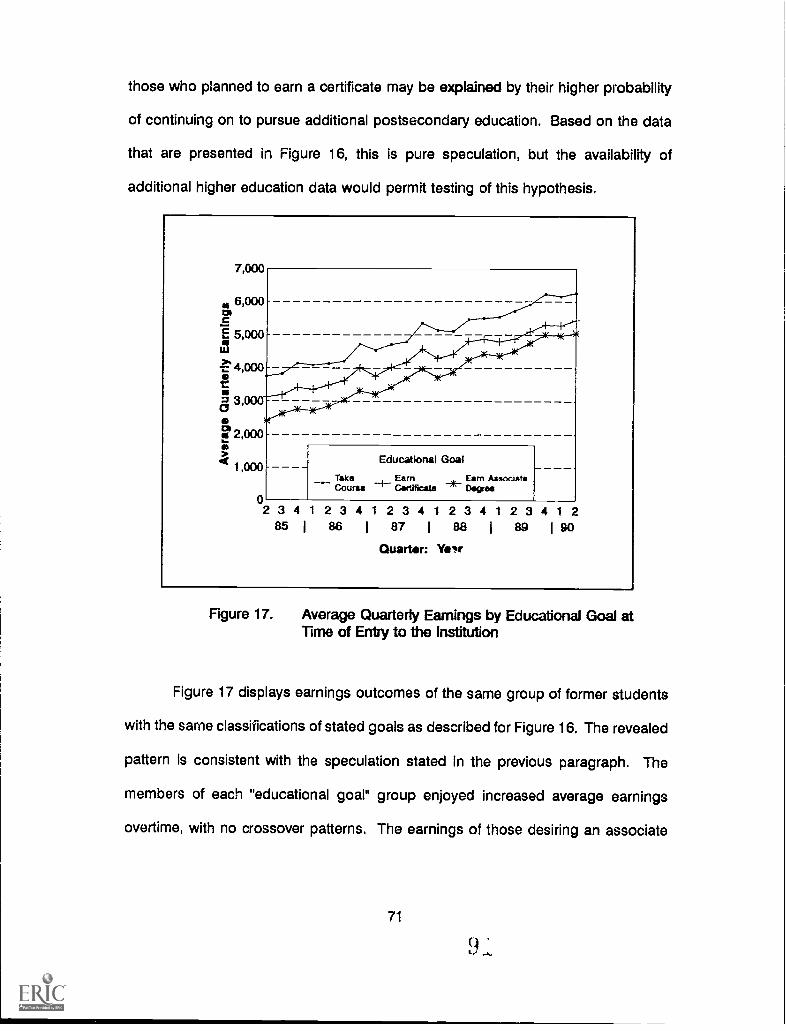
17. Average Quarterly Earnings by Educational Goalat Time of Entry to the Institution
71
18. Subsequent (Continuing) Enrollment of 1986First-Time Community College Enrollees 73
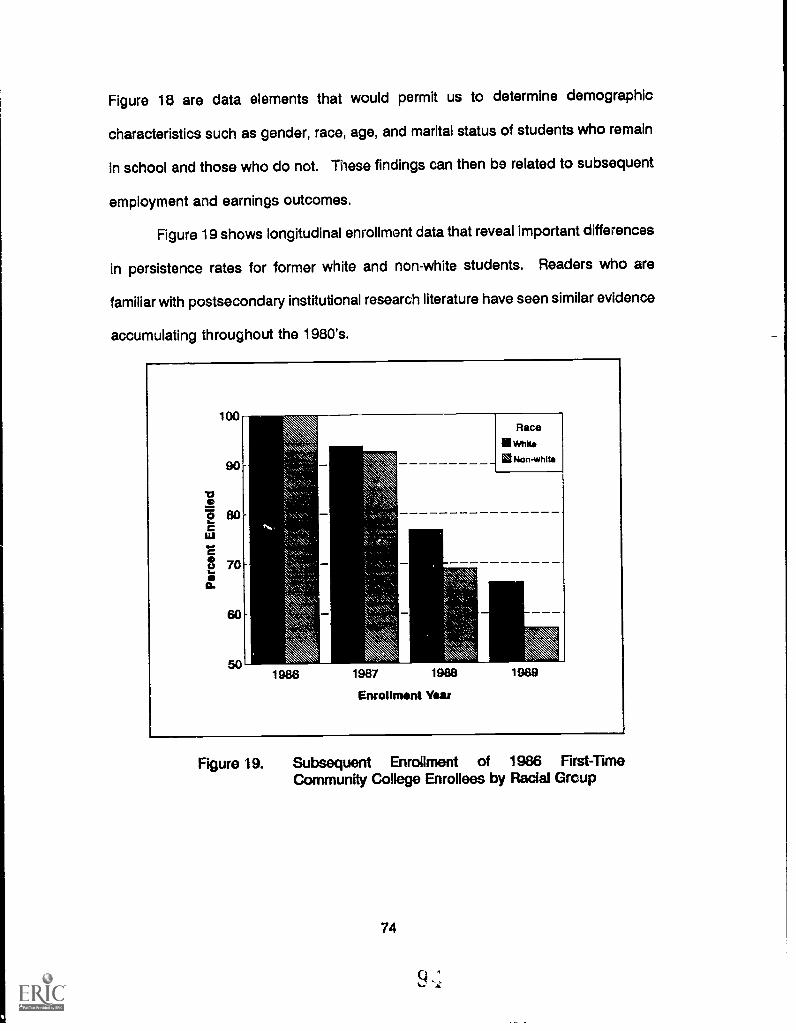
19. Subsequent Enrollment of 1986 First-Time CommunityCollege Enrollees by Racial Group 74
20. Subsequent Enrollment of 1986 First-Time CommunityCollege Enrollees by Marital Status 75
21. Employment Rate for Completers and Non-Completers ofa Program of Study
76
22. Average Quarterly Earnings by Grade Point Average atProgram Exit 77
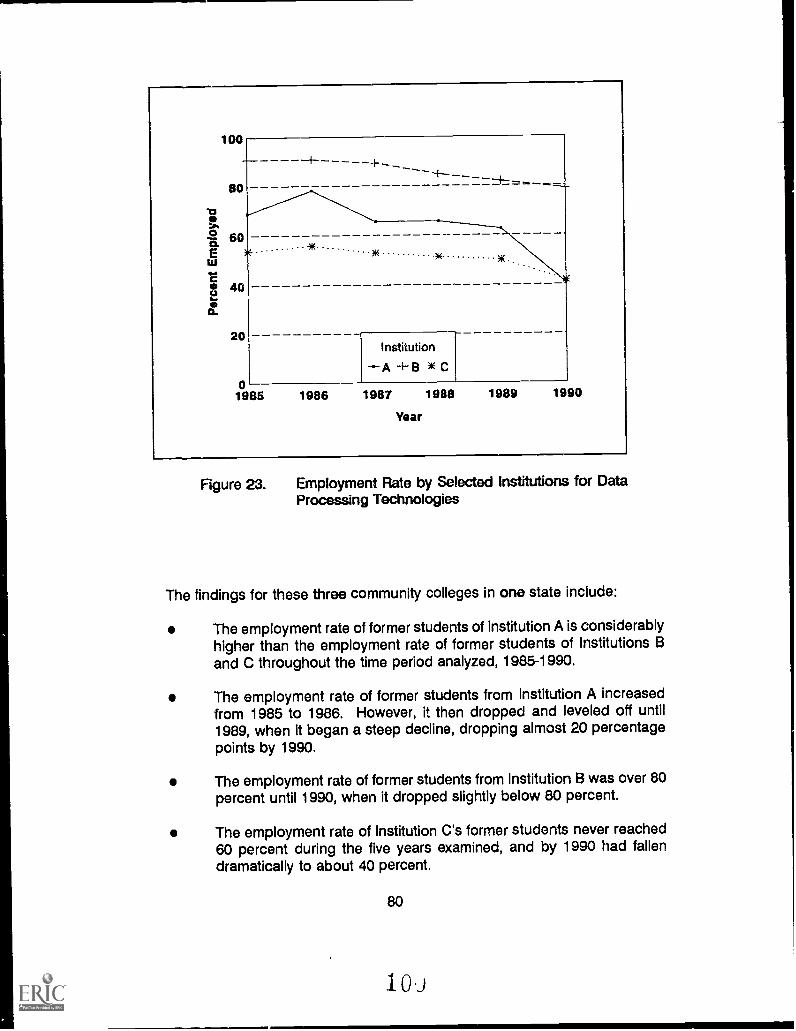
23. Employment Rate by Selected Institutions forData Processing Technologies 80
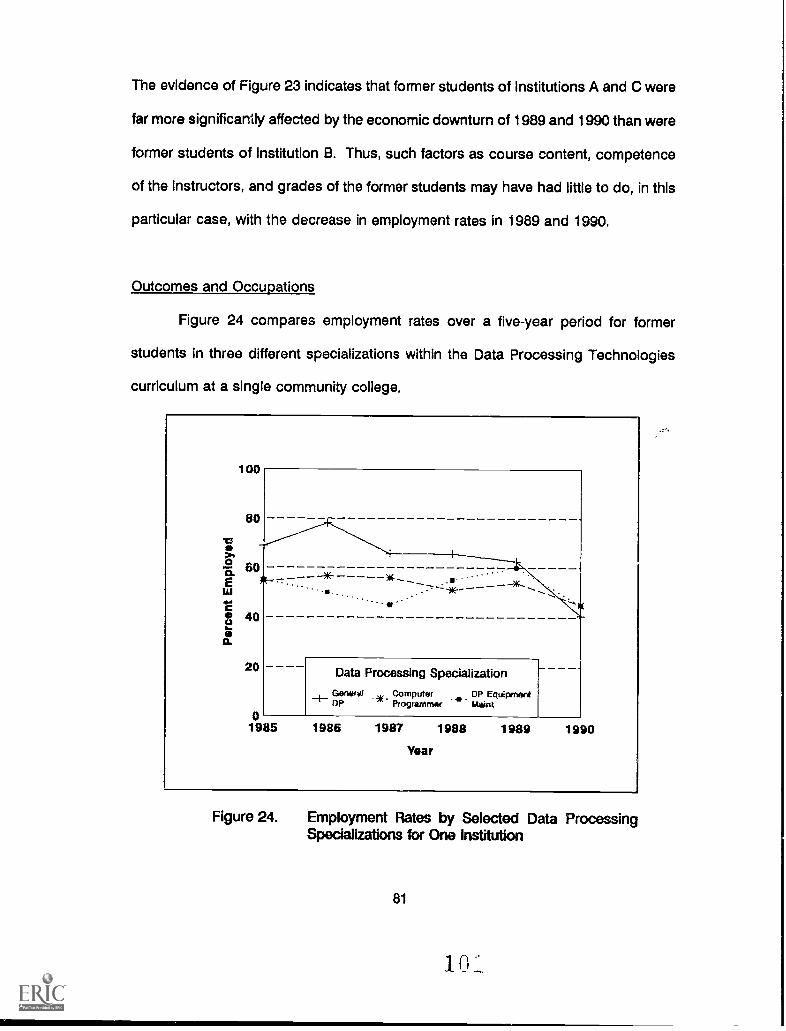
24. Employment Rates by Selected Data ProcessingSpecializations for One Institution
81
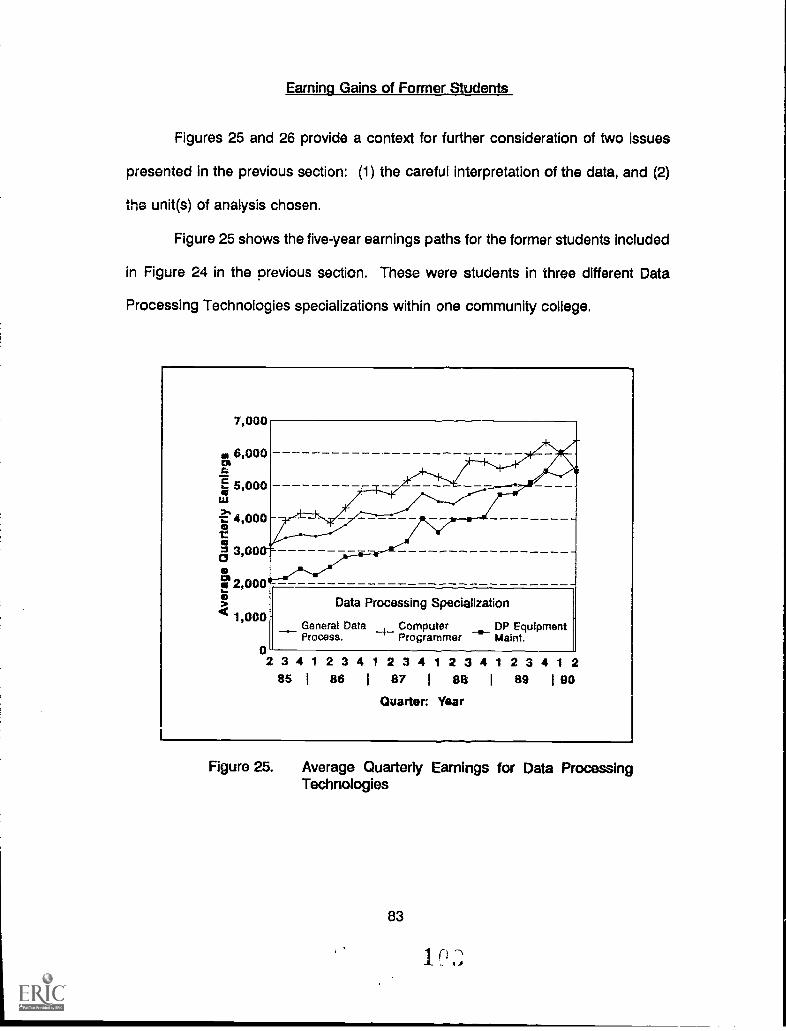
25. Average Quarterly Earnings for Data ProcessingTechnologies
83
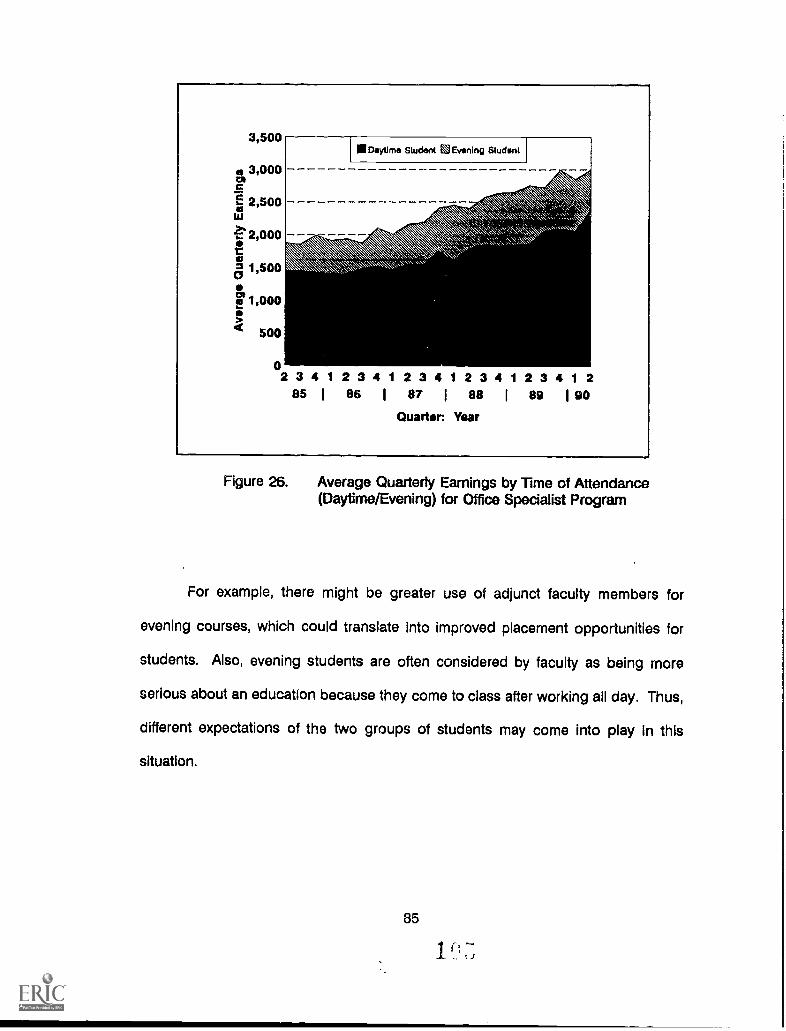
26. Average Quarterly Earnings by Time of Attendance(Daytime/Evening) for Office Specialist Program 85
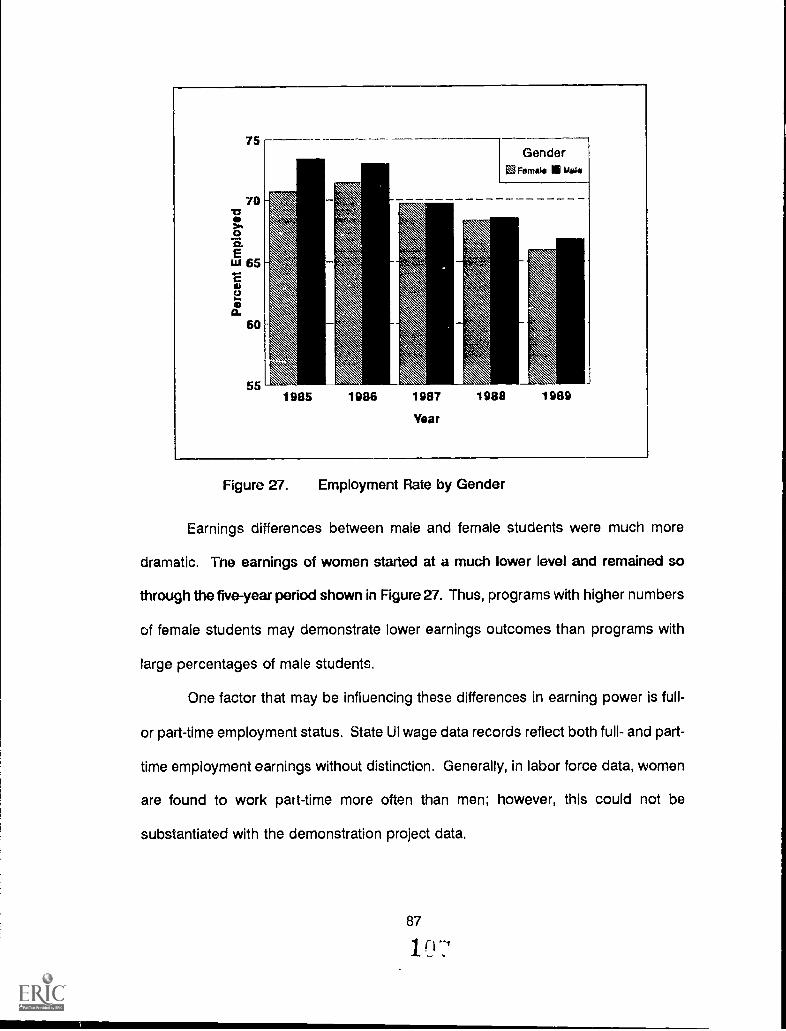
27. Employment Rate by Gender 87
28. Average Quarterly Earnings by Gender 88
29. Employment Rate by Racial Group 89
30. Average Quarterly Earnings by Racial Group 90
31. Employment Rate by Age at Time of Enrollment 92
32. Average Quarterly Earnings by Age at Time of Enrollment 93
xiv
1 '")u
PAGE
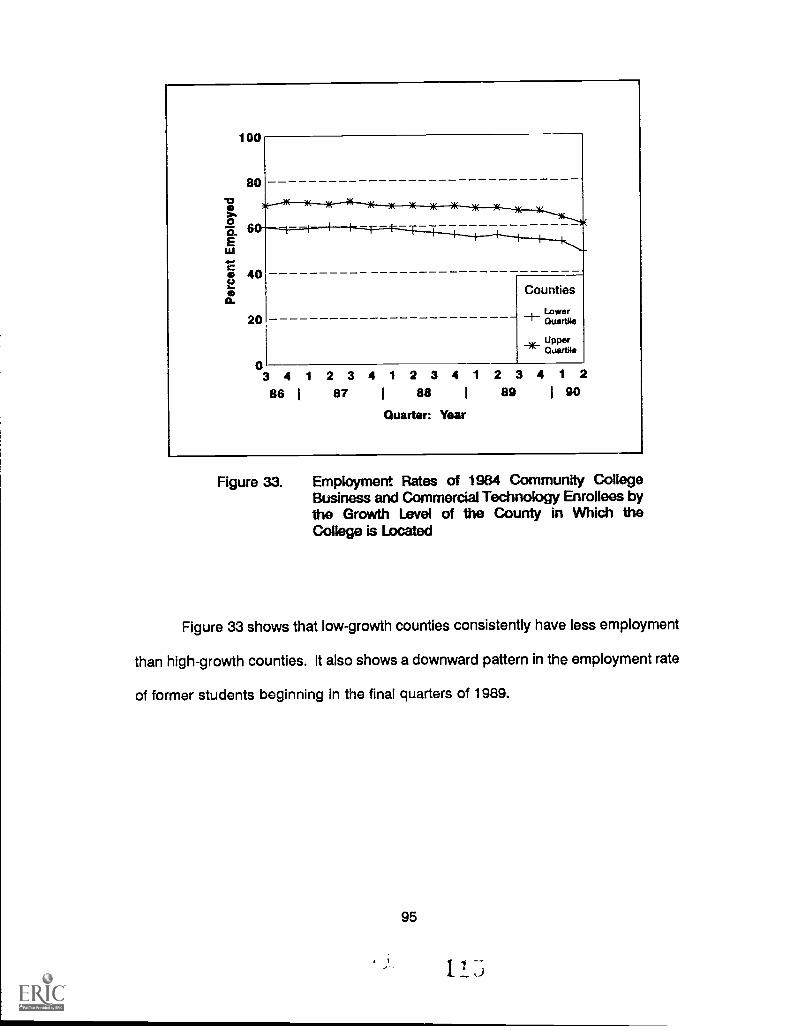
33. Employment of 1984 Community College Business andCommercial Technology Enrollees by Growth Level ofthe County in Which the Community College Was Located 95
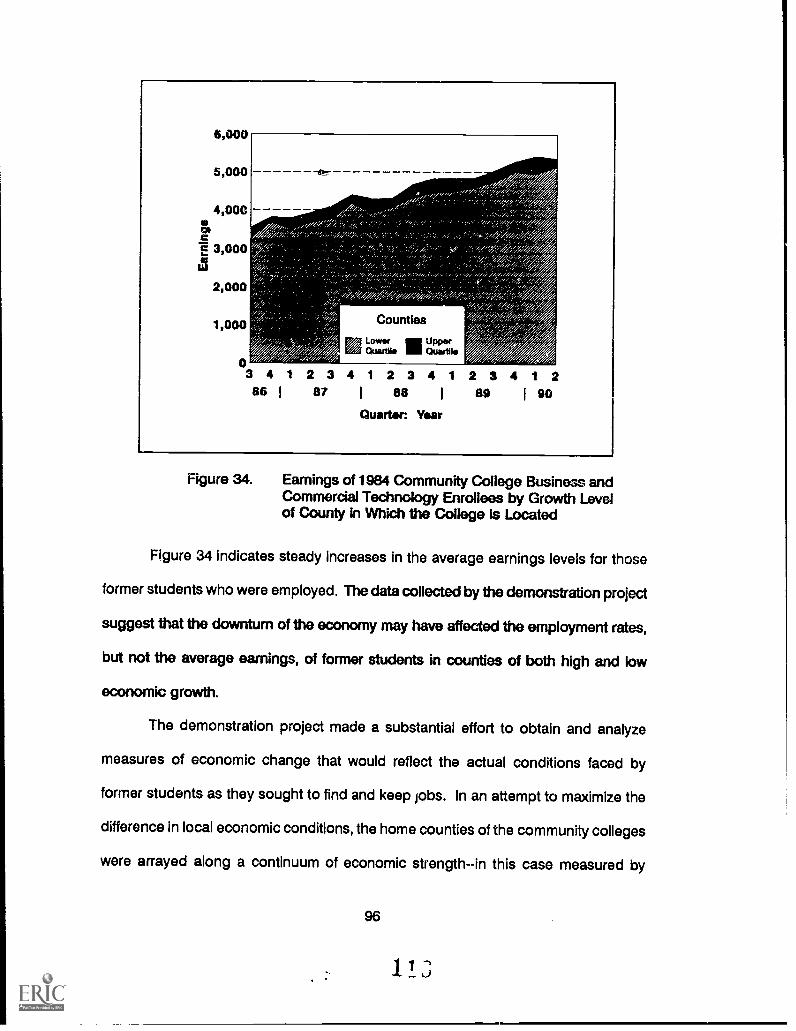
34. Earnings of 1984 Community College Business andCommercial Technology Enrollees by Growth Level ofCounty of School Location 96
35. Employment of 1984 Community College Health Services andParamedical Technology Enrollees by Growth Level of theCounty in Which the Community College Was Located 97
36. Earnings of 1984 Community College Health Services andParamedical Technology Enrollees by Growth Level of theCounty in Which the Community College Was Located 98
37. Cumulative Percentage of Employment by Source ofData for Two States 100
38. Cumulative Percentage of Employment by Source ofData by Type of Institution 105
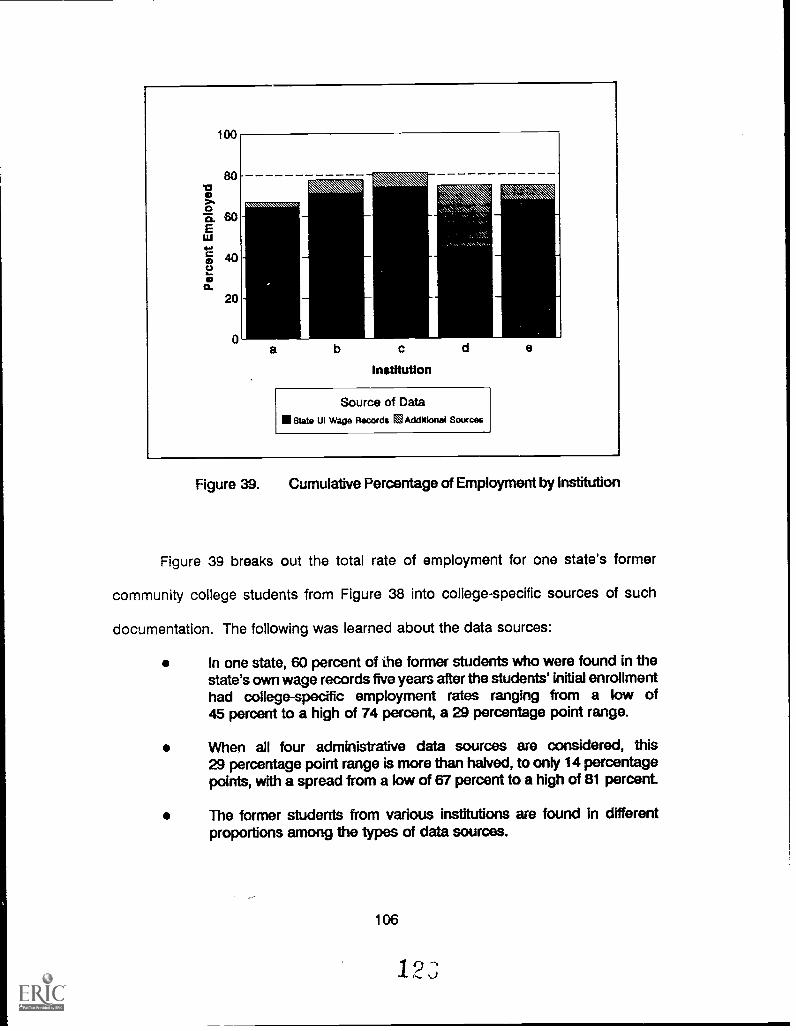
39. Cumulative Percentage of Employment by Institution 106
40. Employment Rate for Students of One Institutionby Whether or Not They Received a Certificate 107
41. Average Quarterly Earnings for Students of OneInstitution by Whether or Not They Receiveda Certificate 109
42. Employment Rate for Students of One Institutionby Whether or Not They Were Placed in a Job 111
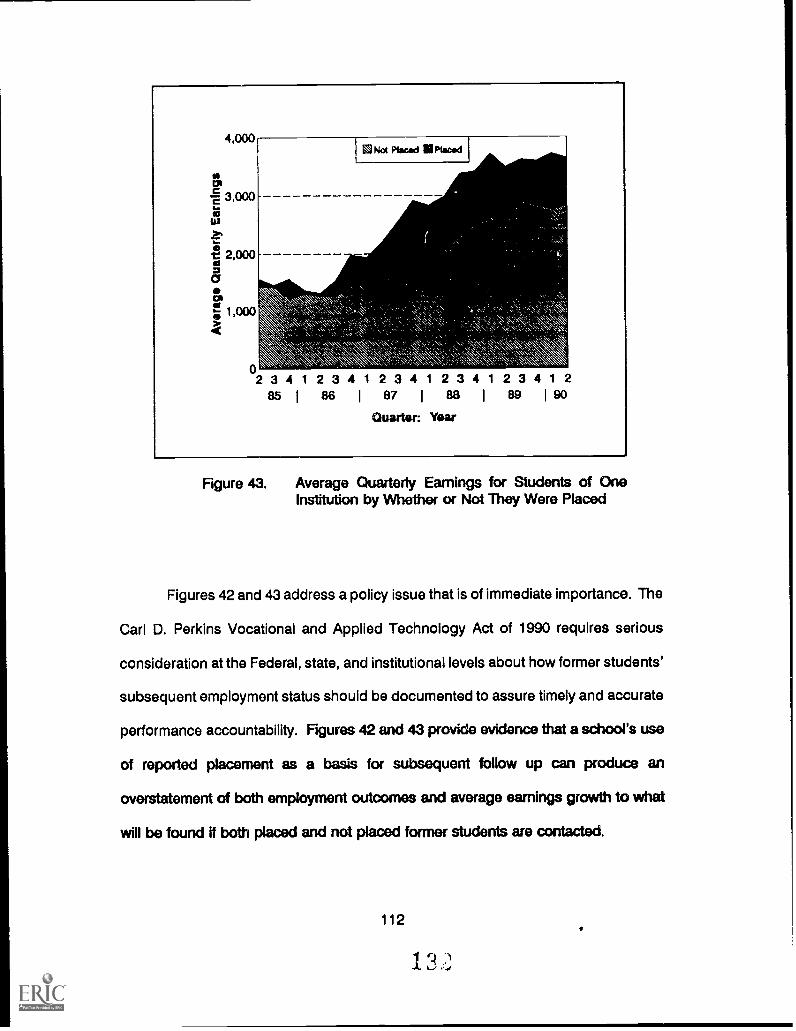
43. Average Quarterly Earnings for Students of OneInstitution by Whether or Not They Were Placed 112
xv
I.
INTRODUCTION
Postsecondary vocational education plays vital roles in preparing the country's
youth for today's job market and in retraining adult workers to meet the rapidly
evolving technological demands of the workplace. But today, perhaps more than ever
before, America is focusing on the cost-effectiveness of its educational programs.
How can the country compete in an ever more sophisticated global economy % Do
the current vocational education programs provide American workers with the skills
they need to find and keep Jobs and to earn attractive salaries?
To answer these questions, to provide "consumer rights" information required
by recent legislation, and to meet increasing demands for public accountability,1 a
reliable, cost-effective, and accurate method of tracking the outcomes of educational
programs must be used. This study investigated how existing, readily available wage
records could be used to provide timely and accurate information on the employability
and earning power of former students.
Purpose of the Study
To advance public understanding of education's contribution to individual
employment opportunity and to the Nation's economic viability, this study addresses
two key questions:
1. How can state Unemployment Insurance (UI) wage records and relatedstate and Federal administrative data sources be assembled to satisfy
2 .)
the needs of various constituencies In a timely, cost-effective, andreliable manner?
2. How can this information be presented to satisfy informational needson education outcomes, while protecting the rights to confidentiality offormer students and their employers?
The report presents the findings of a two-state demonstration project that used
State Employment Security Agency (SESA) Unemployment Insurance (UI) wage
records and other state and Federal data bases to learn about the employment and
earnings outcomes of former students of participating institutions. One state, located
near the Nation's capital, features a high presence of Federal personnel, both civilian
and military, and individuals who are employed in adjacent states. The other, a
midwestern state, appears to have a population less mobile in working across state
lines.
The findings reflect the fact that this was a demonstration project. It was
designed to illustrate how state wage data and other existing administrative records
can be used to assess the employment experiences of students participating in
postsecondary vocational training programs. The results presented are based on the
data available from the participating institutions and do not necessarily represent
actual conditions across all institutions in the states studied or nationwide. The
analyses presented may pertain to former students of one institution, one curriculum
program, one state, or both states. The results of the demonstration project are
illustrative; they are samples of the types of analyses that can be conducted.
Within the two demonstration states, the project collected data about former
students of community colleges and proprietary schools that volunteered to
participate. The report does not identify these institutions as anonymity was a
2
2
promise given to all school administrators for participation. In the eastern state, there
were five cooperating community colleges with 1,631 students and eight participating
proprietary schools with 3,900 students. In the midwestern state, there were
nine cooperating community colleges with 4,778 students and six participating
proprietary schools with 1,195 students. Altogether, 28 institutions were involved in
the demonstration project and 11,504 student records were available for analysis.
During the late 1980's, there was growing concern about accountability In
postsecondary vocational education. Prospective students and their parents wanted
evidence of how former students had fared in the workplace. Executive managers
within the public and private postsecondary systems wanted practical ways to keep
in touch with the market for their "product" (i.e., students who have acquired new skill
competencies at their institutions), in part, to make decisions about the future funding
of programs.
Further impetus to this trend comes from several sources of Federal policy.
The Carl D. Perkins Vocational and Applied Technology Act of 1990 requires each
state receiving funds under the Act to implement a statewide system of performance
measures for both secondary and postsecondary vocational education. These
systems of standards and measures are to be activated by October 1992. Evidence
of former students' subsequent employment is a permissible measure of performance
that might accompany required measures of learning and competency gains. The
reauthorization of the Higher Education Act of 1965 addresses the improvement of
program integrity through better state oversight. Approaches include giving more
attention to job placement rates for students in schools providing vocational training.
In addition, the Federal and state "report card" and industry-specific skill standard
3
features of the America 2000 initiative will focus more attention on former students'
subsequent employment status.
This report provides useful tools and information that can help policymakerLI,
educators, and practitioners gather the information they need to meet these various
requirements.
Policymakers can use the research findings to determine the feasibility of
linking school records with existing wage records to:
measure the performance of institutions providing job and vocationaltraining;
determine employment and earnings outcomes of former vocationalstudents;
assess changes in the performance of vocational education studentsover time; and
assess the performance of various programs and categories ofstudents.
Practitioners can use the procedures in this report to:
track the placement outcomes of students;
evaluate the effectiveness of the curriculum; and
make adjustments in the curriculum or placement and counselingactivities in light of employment experiences.
The study documents a practical way to build upon state-level efforts2 that are
already under way across the country. Unique features of the demonstration project
that complement these efforts, but go beyond them in scope include:
the inclusion of proprietary institutions (i.e., private career schools);
the introduction of "external factors" to put employment and earningsoutcomes into the context of local circumstances beyond the controlof school administrators;
4
development of multiple presentation formats to meet the needs ofdifferent users of the information, while protecting the anonymity offormer students and employers; and
access to more than four years of wage records for one of theparticipating states, which allowed investigation into long-termoutcomes that others have been unable to address.
Caveats
The report specifically focuses on the use of state UI wage records as a
method to determine employment and earnings outcomes for former students. The
data that are introduced in the report include only former students in selected public
community colleges and private career schools in the two demonstration states.
However, the approach can be followed with little modification to assess employment
and earnings outcomes for former students in high schools, four-year colleges, and
even work-site learning activities.
State UI wage records do not contain information on four potentially important
classifications of wage earners: 1) Federal government employees; 2) self-employed
individuals; 3) agents who are paid on a commission basis only (i.e., they receive no
salary); and 4) people who work outside the state in question. However, the
utilization of additional data bases can be used to fill in some of these gaps. In this
demonstration project the following additional data sources were used:
U.S. Department of Defense file data for personnel entering the militarybetween FY85 and March 1990;
U.S. Office of Pe, sonnet Management file data for Federal civilianemployees employed during 1990; and
adjacent state UI wage records data for employees covered by thatstate's statutes (in one demonstration state only).
2
5
,,r
The term "employment rate" is used throughout this report to refer to the rate
of employment of former students for whom wage records were found. The authors
acknowledge that this "employment rate" does not include the categories of workers
described above.
Why Use Existing State UI Wage Records?
The prevailing method for determining postprogram employment and earnings
measures is by surveying the graduates. Teachers and school administrators are
often asked to determine employment affiliation and starting wage rate at the time of,
or shortly after, each student's departure. Critics of this approach argue that teachers
and school administrators have a powerful incentive to report only favorable
outcomes. Student alumni surveys are sometimes used, but these are often subject
to low response rates and well-known inaccuracies in self-reported earnings, such as
higher response rates by employed alumni.
An alternative approach, Unemployment Insurance (UI) wage records, is
demonstrated in this project. UI wage records consist of quarterly wage reports
submitted by each employer who is required to comply with a state's unemployment
compensation law. For each covered employee, an employer is required to report the
employee's social security number and the total amount of earnings during the
quarter. The employer also reports his/her own unique employer identification
number, geographic location, and industry affiliation. U! wage records are collected
and maintained by the State Employment Security Agency in each state except
Massachusetts and New York, which do not require employers to report this
information until a claim to receive unemployment benefits is filed.
6
or-
The study revealed four significant advantages to linking school information
on former students with state UI wage records:
Completeness of records. The state UI wage records containemployment and earnings data on about 97 percent of all employees(except in Massachusetts and New York at the present time.) Thiscontrasts with the low response rates and consequent nonresponsebiases often obtained through alumni surveys.
Ease of linkage. The social security number of students Is the onlyrequired identifying element for record linkage.Cost effectiveness. Access to these data sources for postprogramdata collection provides a cost-effective alternative to time consuming,low response methods such as student surveys. State officials of astate using UI wage data supplemented by other sources reported thatthe cost for obtaining outcome information had been reduced from$17.00 to $3.00 per student.
Availability of data for longitudinal analyses. Data are available byquarter and for a period of at least four years, thus, administrators mayconduct short-term and longitudinal analyses.
Timeliness. A quarter's wage record data are generally available withinfour to six months.
What Did the Study Reveal About the Workplace Experiences of Former Students?
The report illustrates In detail how the data can be used to examine trends
regarding former students in the workplace. Particular data elements have been
chosen for display based on their relevance in satisfying frequently encountered
consumer requests for information. Their purpose is to illustrate what can be done
using state Ul wage record files and other available data bases.
It should be noted that for the purposes of the demonstration project, all
follow-up on students was done from the time that they first enrolled in a program.
In actual practice, the time frame for at least some of the analyses would probably be
from the point of program completion.
7
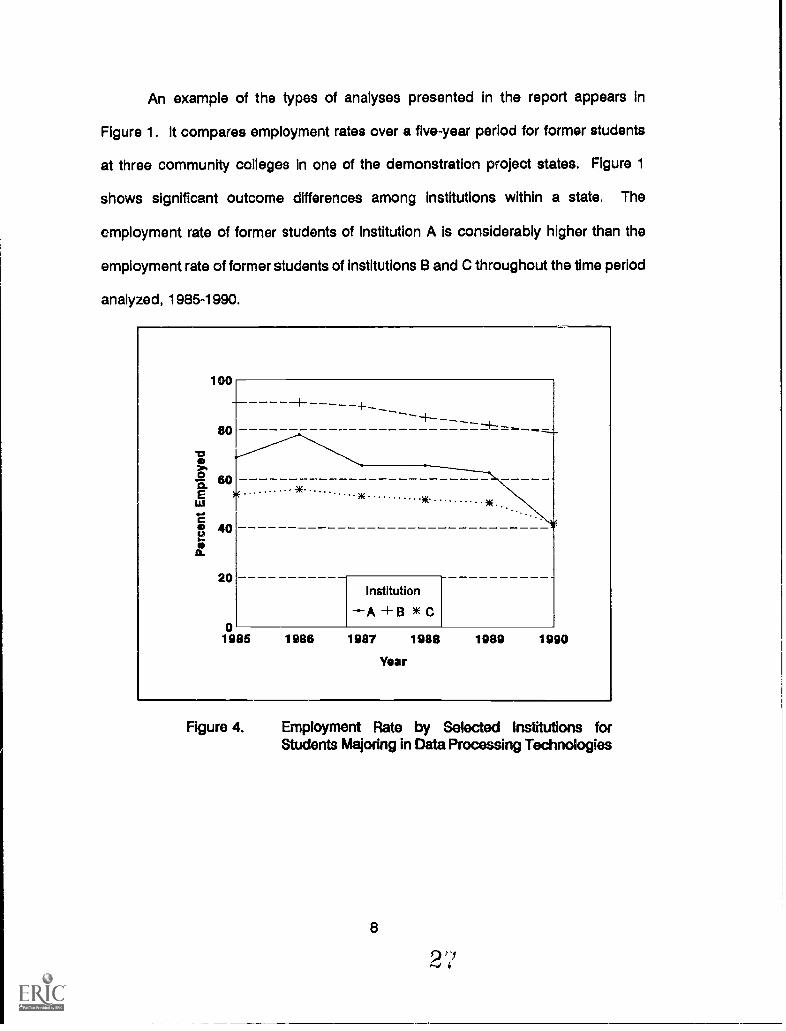
An example of the types of analyses presented in the report appears In
Figure 1. it compares employment rates over a five-year period for former students
at three community colleges in one of the demonstration project states. Figure 1
shows significant outcome differences among Institutions within a state. The
employment rate of former students of Institution A is considerably higher than the
employment rate of former students of Institutions B and C throughout the time period
analyzed, 1985-1990.
100
--- -+--- - - - +--80
60,
.. )1(
40
20Institution
--A +B )C0
1985 1986 1987 1988 1989 1990
Year
Figure 4. Employment Rate by Selected Institutions forStudents Majoring in Data Processing Technologies
8
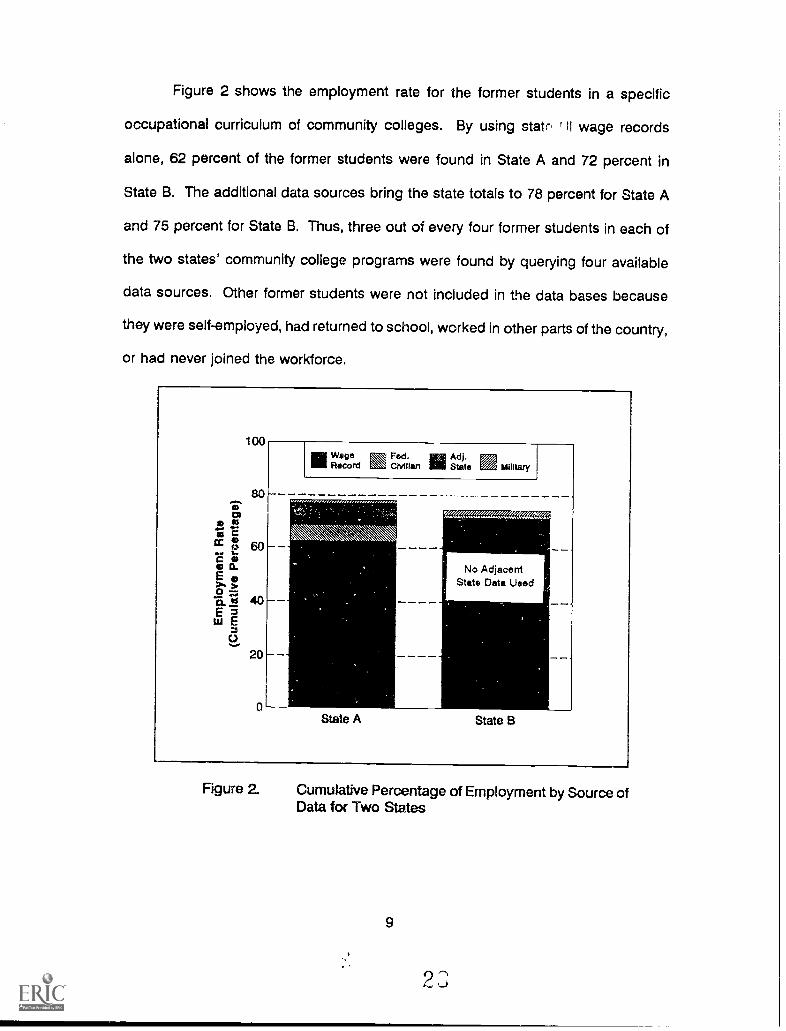
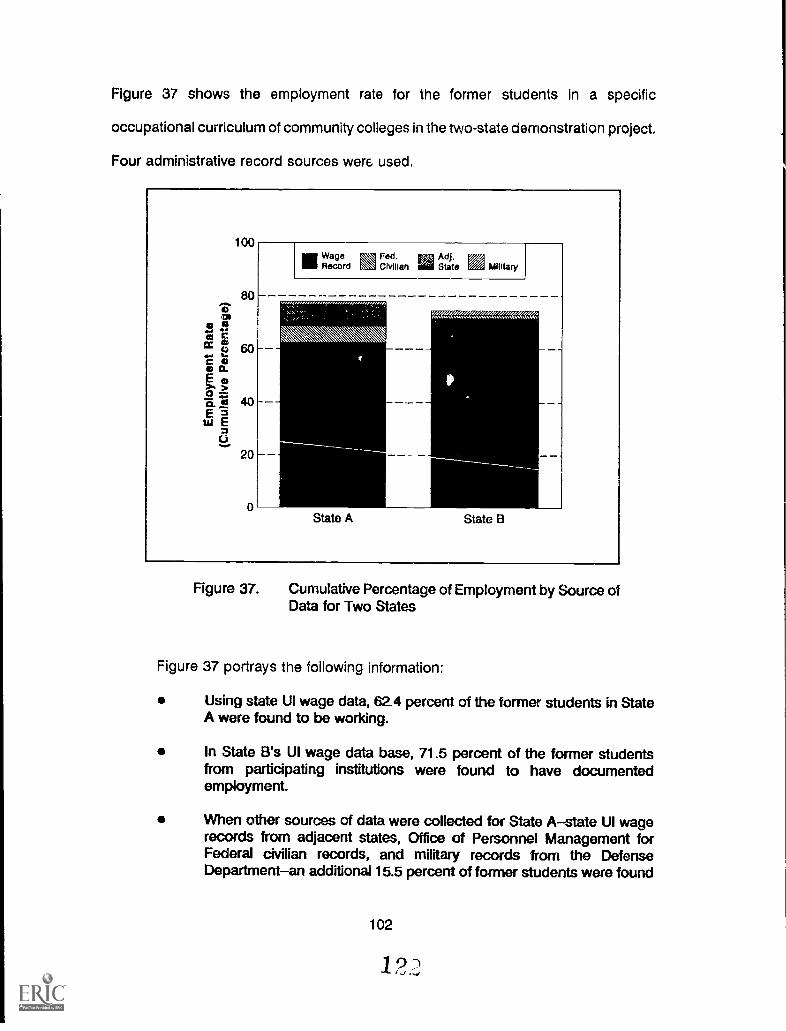
Figure 2 shows the employment rate for the former students in a specific
occupational curriculum of community colleges. By using statr, 111 wage records
alone, 62 percent of the former students were found in State A and 72 percent in
State B. The additional data sources bring the state totals to 78 percent for State A
and 75 percent for State B. Thus, three out of every four former students in each of
the two states' community college programs were found by querying four available
data sources. Other former students were not included in the data bases because
they were self-employed, had returned to school, worked in other parts of the country,
or had never joined the workforce.
Ss'
a
CC 8L.
erag0
sts
EE
100
80
60
40
20
0
mi WageMO Record s'x
Fed. En- Adj.CMIIan State , Military
\\.`
State A
No AdjacentState Data Used
State B
Figure 2. Cumulative Percentage of Employment by Source ofData for Two States
9
Two other sources of administrative data, Social Security Administration (SSA)
information and Internal Revenue Service (IRS) Information, have weaknesses that limit
their use in investigations of education postprogram outcomes. A serious weakness
of both sources is the substantial delay in obtaining the data. Typically, It takes three
to four years before the files are available in a form usable by analysts. In addition,
unit-record data cannot be released from either data set. Additional limitations of the
SSA files are that earnings above the taxable maximum are not reported and the data
are available on an annual basis only compared to the quarterly data available in state
UI wage records. An additional weakness of IRS data is that earnings from a specific
job or employer cannot be isolated.
Expanding the Picture
Existing wage data allows a "snapshot" of the former students' employment
and earnings levels at a particular time, or a tracking of the students' employment and
earnings over a period of time.
The Snapshot. Through the demonstration project, the school records of
former students linked with UI wage records provided data to determine:
employment status of former students from both public and privatepostsecondary schools;
employment status of former students at program exit by type ofinstitution, placement, and degree status;
earnings of former students at job entry;
10
2
employment and earning status by type of program completed and fornoncompleters; and
employment and earnings status at program exit by gender, race, andage.
The Long-Range View. With historical data found in state Ul wage records,
analyses of long-range outcomes can be ascertained for former vocational education
students. These include:
earnings gains over a five-year period;
employment rates over a five-year period;
long-term employment rates by institution, program, and state;
long-term outcomes by gender, race, or age group; and
the affect of local economic conditions on long-term employment andearnings.
The Background. Local labor market conditions can greatly influence the
types of jobs secured and job earnings. Changes brought on by a recession, plant
closings, reductions-in-force, or new requirements for specific occupations may not
affect all areas of a state equally. These changes may also affect employment and
earnings differently.
Because it may be misleading to release program- and school-specific
information without explaining differences in student populations, school programs,
and local economic conditions, the demonstration project incorporated data on those
external factors that are beyond the control of vocational educators. These factors
Included employment/unemployment rates and growth level as measured by the
number of building permits issued.
11
J
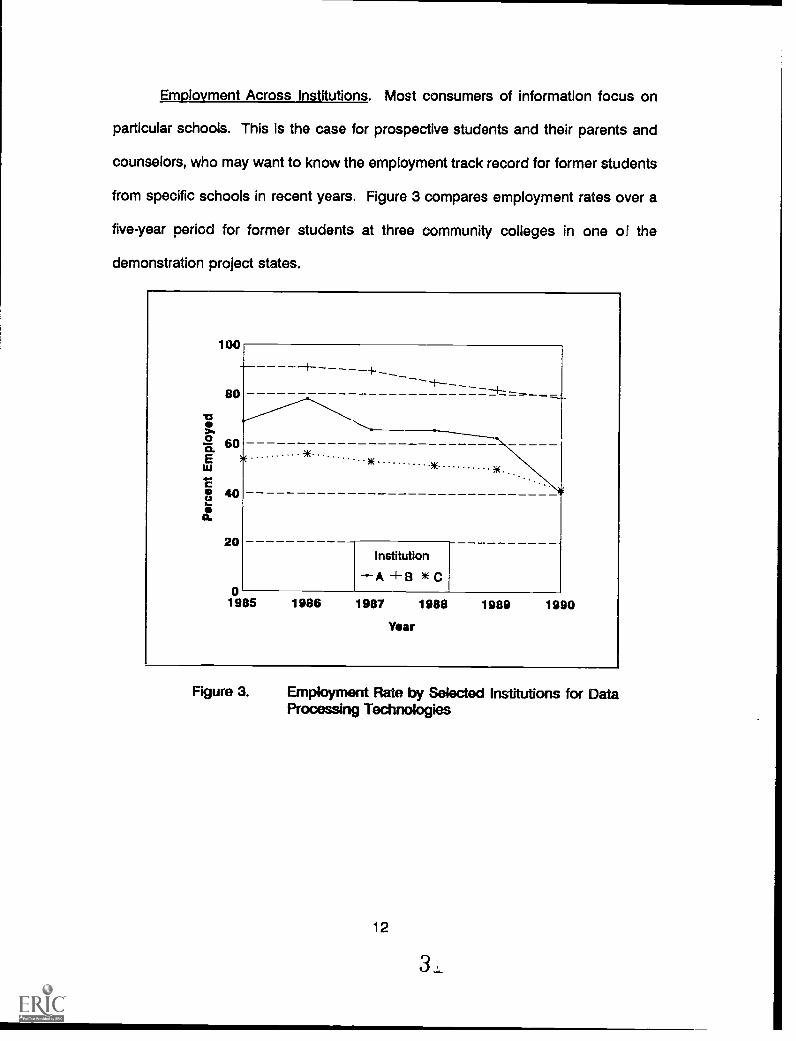
Employment Across Institutions. Most consumers of information focus on
particular schools. This Is the case for prospective students and their parents and
counselors, who may want to know the employment track record for former students
from specific schools in recent years. Figure 3 compares employment rates over a
five-year period for former students at three community colleges in one of the
demonstration project states.
100
80
60 .........
40
20
....... .. ......... )1(
Institution
A B C01985 1986 1987 1988 1989 1990
Year
Figure 3. Employment Rate by Selected Institutions for DataProcessing Technologies
12
Figure 3 reveals significant outcome differences among institutions within a
state. For example, the employment rate of former students of Institution A is
considerably higher than the employment rate of former students of Institutions B and
C throughout the time period analyzed, 1985-1990. However, care must be taken not
to draw conclusions too quickly from such evidence. The differences in employment
rates might be explained by influences such as local economic conditions. Data such
as those shcwn in Figure 3 should be used as a starting point for investigating
accountability, not as a conclusion of such investigations.
Relationship of Certificate Completion to Employment and Earnings. Figure 4
traces five-year paths of documented employment for two groups of former students
from one postsecondary institution--those who received a certificate and those who
were not awarded a certificate. Figure 4 shows that persisting to the award of a
certificate is strongly associated with employment prospects. An important strength
of the archival approach, which combines school-based information about former
students with subsequent employment and earnings information about these same
people is that in-depth inquiries can be initiated based on preliminary results such as
those shown in Figure 4.
13
I
100
90
Tsoa..2 80a.EEU
C.8 70a...
a60
50
-.- Certificate
*No Certificate
1985 1986 1987 1988
Year
1989 1990
Figure 4. Employment Rate for Students of One Institution byWhether or Not They Received a Certificate
Figure 5 traces quarterly earnings levels for these same students. In 1986, the
average quarterly earnings of those students who had been awarded a certificate
were slightly higher than their counterparts who had not received a certificate. The
difference in earnings of these two groups widened over time.
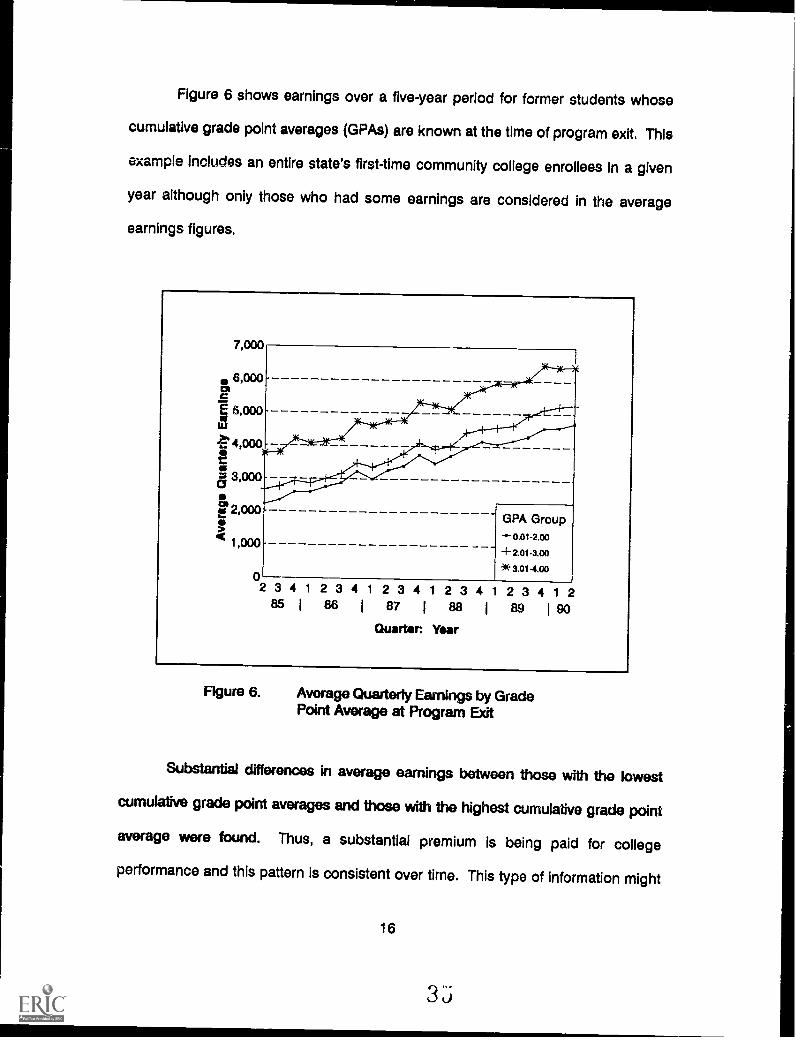
Figure 6. Average Quarterly Earnings by GradePoint Average at Program Exit
Substantial differences in average earnings between those with the lowest
cumulative grade point averages and those with the highest cumulative grade point
average were found. Thus, a substantial premium is being paid for college
performance and this pattern is consistent over time. This type of information might
16
be useful to a prospective student about the potential benefits of time and effort in
academic pursuits.
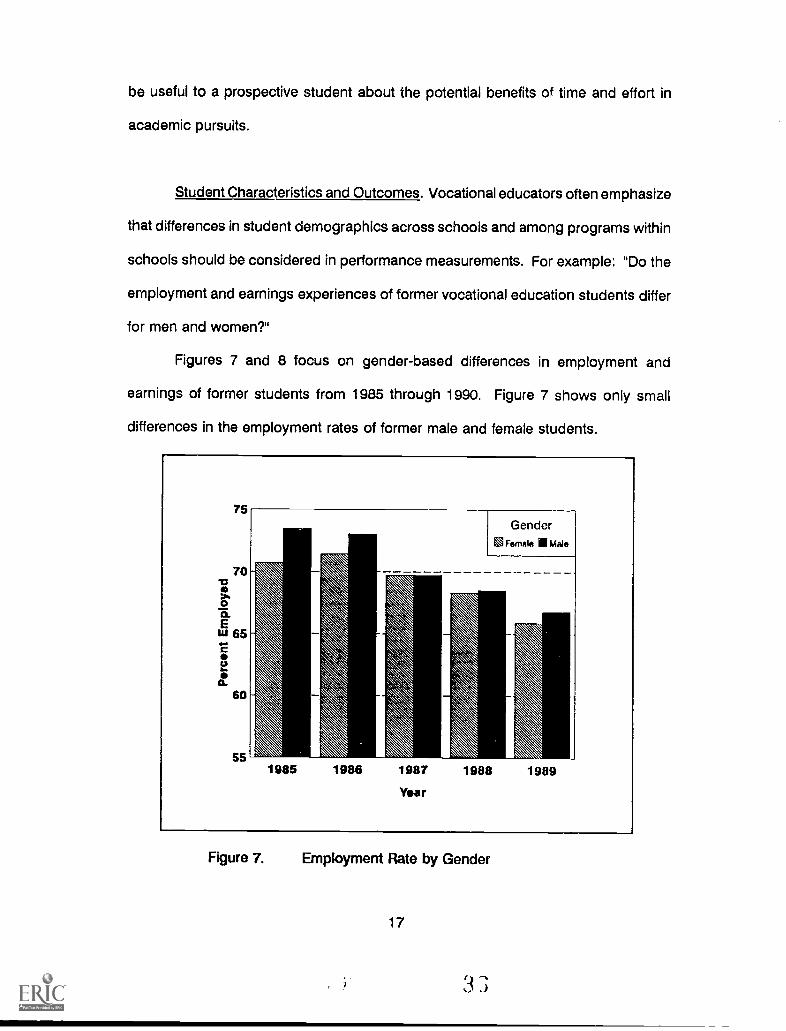
Student Characteristics and Outcomes. Vocational educators often emphasize
that differences in student demographics across schools and among programs within
schools should be considered in performance measurements. For example: "Do the
employment and earnings experiences of former vocational education students differ
for men and women?"
Figures 7 and 8 focus on gender-based differences in employment and
earnings of former students from 1985 through 1990. Figure 7 shows only small
differences in the employment rates of former male and female students.
75
70
14.1 65
60
55
\1
moo
GenderFemale Ili Male
1985 1986 1987 1988 1989
Year
Figure 7. Employment Rate by Gender
17
Earnings differences between male and female students were much more
dramatic. The earnings of women started at a much lower level and remained so
through the five-year period shown in Figure 8. Thus, programs with higher numbers
of female students may demonstrate lower earnings outcomes than programs with
large percentages of male students.
7,000
6,000
E 5,000es
4,000
a 3,000
g 2,000
1,000
02 3 4 1 2 3 4 1 2 3 4 1 2 3 4 1 2 3 4 1 285 I 86 I 87 I 88 I 89 I 90
Quarter: Year
GenderMaM
Fernski
,`",`"
Figure 8. Average Quarterly Earnings byGender
18
One factor that may be Influencing these differences in earning power is full-
or part-time employment status. State UI wage data records reflect both full- and part-
time employment earnings without distinction. Generally, in labor force data, women
are found to work part time more often than men; however, this could not be
substantiated with the demonstration project data.
As the Economy Goes . . . The economic downturn in 1989 clearly affected
the employment rates of former students. Since the demonstration project did not
collect data past the first two quarters in 1990, this report does not explore the full
effect of the recession on former students.
However, Figures 9 and 10 provide illustrations of the economic effect on 1984
community college business and commercial technology enrollees. In an attempt to
maximize the difference in local economic conditions, the home counties of the
community colleges in one state were arrayed along a continuum of economic
strength--in this case measured by changes in building permit issuancewith the
highest and lowest quartiles compared.
19
100
S
40
20
Counties
Loweratones
Upper--)1E-
Qum OW
3 4 1 2 3 4 1 2 3 4 1 2 3 4 1 286 I 87 I 88 I 89 180
Quarter: Year
Figure 9. Employment Rates of 1984 Community CollegeBusiness and Commercial Technology Enrollees bythe Growth Level of the County in Which theCollege is Located
Figure 9 shows that low-growth counties consistently have less employment
than high-growth counties. It also shows a downward pattern in the employment rate
of former students beginning in the final quarters of 1989.
20
3'i)
6,000
5,000
4,000co
3,000
2,000
1,000
3 4 1 2 3 4 1 2 3 4 1 2 3 4 1 2
86 1 87 88 1 89 1 90
Quarter: Year
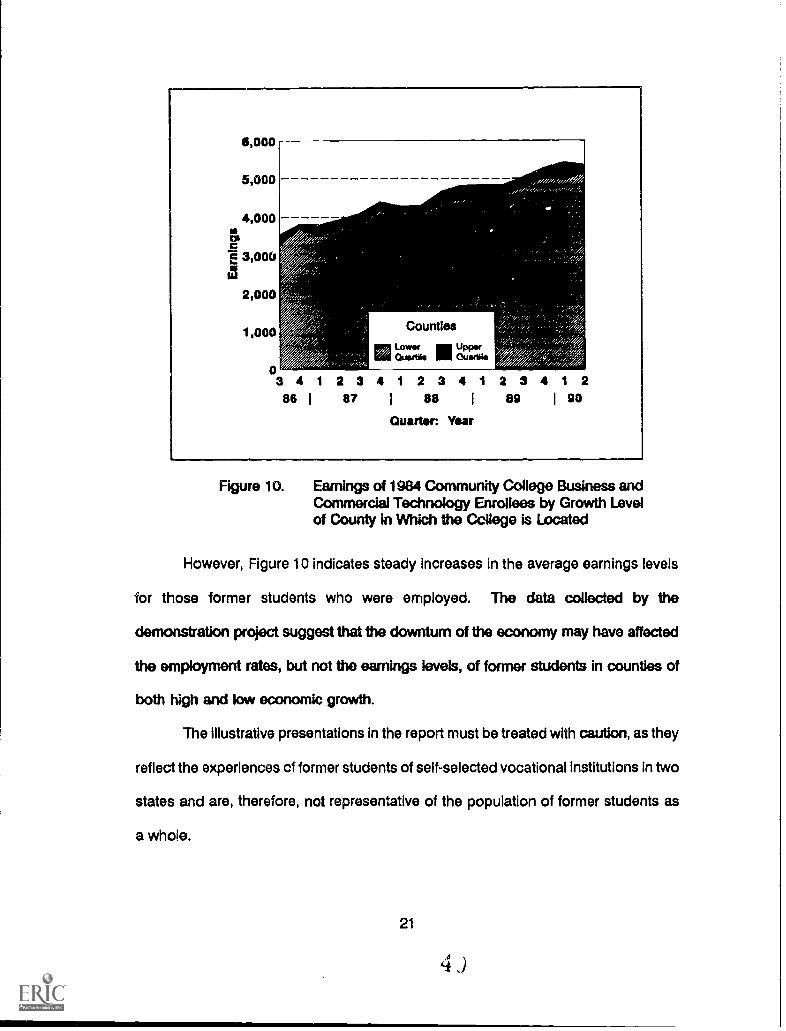
Figure 10. Earnings of 1984 Community College Business andCommercial Technology Enrollees by Growth Levelof County in Which the College is Located
However, Figure 10 indicates steady increases in the average earnings levels
for those former students who were employed. The data collected by the
demonstration project suggest that the downturn of the economy may have affected
the employment rates, but not the earnings levels, of former students in counties of
both high and low economic growth.
The illustrative presentations in the report must be treated with caution, as they
reflect the experiences of former students of self-selected vocational institutions in two
states and are, therefore, not representative of the population of former students as
a whole.
21
4 ,)
In summary, the strength of using existing wage data sources lies in the long-
term perspective gained for data analysis and the ability to relate information about
students, schools, programs, and economic factors to students' employment and
earnings.
The remainder of this chapter provides the following information to help the
reader:
Structure of the Report
How to Use the Report
Structure of the Report
The primary purpose of the report is to present the findings of a demonstration
project that tested the concepts and applications of linking student records using
social security numbers with state UI wage and other data sources. The report also:
shows how using existing wage data bases will meet the needs ofpolicymakers, practitioners, institutional managers, and prospectivestudents;
provides the necessary step-by-step processes for decisionmaking andfor developing procedures to use existing data sources; and
discusses the limitations of the recommended data sources.
The report is divided into six additional chapters:
II The Context
III Consumers, Vocational Education, and Policymakers
IV Testing the Concepts
V Findings of A Demonstration Project
VI Which is Better? Point-in-Time Outcomes versus the LongitudinalPerspective
VII Five Steps for State Implementation
22
II
III
Chapter Two: The Context provides the background of the public's
renewed interest in employment and earnings outcomes in an
education context. It also gives the reader the historical perspective
for record linkage.
Chapter Three identifies the needs of various audiences such as
policymakers, prospective students, and administrators of educational
institutions for employment and earnings information.
IV Chapter Four describes the concepts tested by the demonstration
project with a thumbnail sketch of the data sources and elements
used.
V Chapter Five presents the findings from the two-state demonstration
project, organized around policy-oriented questions, to illustrate how
wage data can be used and presented.3 The model used builds on
pioneering efforts in several states but adds two major dimensions-
student information from private proprietary schools and information on
external factors such as local economic conditions beyond the control
of educators and policymakers.4
VI Chapter Six provides an answer to the question: "Which is Better-
Point -in -Time versus Longitudinal Perspective?"
VII Chapter Seven provides five steps for state implementation of a system
to link school-based information with state UI and other state and
Federal wage data records. These steps are:
Plan and Determine Data Priorities
Step One explores issues for consideration in planning and
determining data priorities within a state's unique governance
23
structure, statutory authority, regulatory framework, and
institutional mix.
Icentify State and Federal Administrative Data Sources
Step Two Identifies and provides an overview of the various
state and Federal wage data sources investigated.
Make Data Collection Decisions
Step Three addresses data collection issues that must be
considered in the early stages of record linkage.
Develop Data Processing Procedures
Step Four focuses on data processing procedures.
Conduct Data Analysis
Step Five discusses procedures for translating data analysis to
consumer information.
How to Use the Report
The report contains information of value to policymakers, state and local
administrators, practitioners, and consumers of postsecondary vocational education.
Readers should begin by taking a tour of the report. The chapters of the report are
in a logical progression from legislation to research to practice in the real world.
Chapters Two and Three give the reader an understanding of the policy issues
that set the stage for the demonstration project. Chapter Four describes the
processes and data sources used by the demonstration effort. Chapter Five presents
the project's findings and is the heart of the report. It focuses on the issues of
concern to policymakers; however, practitioners will learn from reviewing the
24
presentation of the ..,:ata and the results of the analyses. Chapter Six provides a
profile of the strength of the longitudinal perspective. Chapter Seven is written with
the practitioner in mind, but the policymaker will benefit from reviewing each step
discussed to determine the feasibility for state UI wage record linkage in respect to
state statutes, regulations, and procedures already in place.
Extensive endnotes provide references for deeper investigation into selected
topics. An appendix discusses the differences between outcome measures and
performance standards, and alerts readers to challenges that are likely to arise in the
use of these measures.
25
4
II.
THE CONTEXT
Chapter Two discusses the context in which the demonstration project was
designed and implemented. It begins with a historical perspective and continues with
a look at the changing legislative environment and factors influencing the use of state
Unemployment Insurance (UI) wage data.
Historical Perspective
Traditionally, student performance in the labor market has been gauged by the
collection and reporting of outcome measures such as initial job placement
Information. Few studies focused on longer-range outcomes such as job retention
and earnings growth.
During the 1930's, several studies noted that the skills of the American
workforce were falling behind those of workers of other industrialized nations.5 In a
global economy, sustained growth depends on a highly skilled workforce. These
studies resulted in a greater emphasis on accountability in education for the
performance of former students in the labor market. Now, more than ever before,
educators and policymakers need to be able to accurately assess and report the
performance of former students in the labor market over time. Information is needed
about both the initial job placement and the long-term employment of former students.
26
A state's UI wage records are a cost-effective source of information about
employment and earnings information for many former students. These administrative
data are generally maintained by the unemployment compensation division within the
State's Employment Security Agency (SESA). These data have not been extensively
used in the past due to concerns about privacy and workload.
Congress passed the Deficit Reduction Act in 1984 which plays a key role In
defining today's issues about using existing state Ul wage data and the context within
which SESA administrators have been struggling to find an appropriate balance
between their own agency's interests, the need to protect the confidentiality of former
students and their employers, and broader public concerns about education.
Deficit Reduction Act of 1984
This Act stipulated that:
. . . employers in [each] State are required, effectiveSeptember 30, 1988, to make quarterly wage reports toa State agency (which may be the agency administeringthe State's unemployment compensation law)6
This Act was intended to facilitate the verification of income and eligibility for
selected Federal benefit programs.' By 1984, three-fourths of the states were already
collecting quarterly wage reports in support of their state-authorized and administered
unemployment compensation programs. Today, as a direct result of this
Congressional mandate, all states (except Massachusetts and New York which
comply with the requirement through a state agency other than a SESA) collect UI
data.8
27
The Federal Income and Eligibility Verification System (IEVS) mandate requires
each state to provide stipulated data elements in support of Federal programs
including Aid to Families with Dependent Children, Medicaid, Food Stamps, Child
Support Enforcement, and Health and Human Services. Congress's mandate for
third-party access to these records for income verification and eligibilitydetermination
purposes set the stage for subsequent deliberations within SESAs about how to
respond to third-party requests for further access to the .Jrninistrative records. In
every state, there are some people who object to the use of these data to gather
evidence about the outcomes of educational programs.
America 2000
"America 2000h is not a Federal program but a national strategy designed to
accomplish by the year 2000 the six national education goals developed and
presented by the President and the state governors as a result of the 1989
Educational Summit in Charlottesville, Virginia. Two parts of this strategy announced
on April 18, 1991, "Better and More Accountable Schools" and "Creating a Nation of
Students," call for:
national and state report cards on how well education is doing, and
the development and measurement of job-related (and industry-specific) skills standards built around core proficiencies, resulting in theaward of "skill certificates."
The "America 2000" strategy, along with legislation in 1990 mandating
standards and measures of performance for pc-atsecondary vocational education
programs, focuses on the need to measure educational outcomes.
28
Legislation in the 1990's
America 2000 provides a strategy for La future, but the Carl D. Perkins
Vocational and Applied Technology Act of 1990 is the event that has triggered the
most widespread interest in the use of state UI wage records and need for a report
of this type. Specifically, this law states that:
. . . each state board receiving funds under this Actshall develop and implement a statewide system of corestandards and measures of performance for secondaryand postsecondary vocational education programs.9
To comply with this law, state boards must implement at least one of four
permissible measures of performance in addition to measures of learning and
competency gains. One permissible measure is "placement into additional training
or education, military service, or employment."10
The Perkins Act further encourages vocational educators to understand what
is happening in Job Training Partnership Act programs by requiring that:
. . . in developing the standards and measures includedIn a system developed under subsection (a), the Stateboard shall take into consideration(1) standards andmeasures developed under job opportunities and basicskills training programs established and operated undera plan approved by the Secretary of Health and HumanServices that meets the requirements of section402(a)(19) of the Social Security Act; and (2) standardsprescribed by the Secretary of Labor under section 106of the Job Training Partnership Act."
Accurate and cost-effective sources for the collection of outcomes data can
also facilitate analyses of results across multiple program areas. For example, there
is increasing interest among states in monitoring the transitions of program
participants among different education, employment, and assistance programs (e.g.,
welfare, Food Stamps, unemployment insurance) over time.
29
There is also a spreading awareness that advice to "get a skill and get a good
job" no longer suffices to protect a worker from exposure to a high risk of the vagaries
of the job market. The traditional once-in-a-lifetime movement from school to work
without worry of layoff has been transformed into a complex mix of school-work-
retraining-unemployment combinations. In addition to state accountability, an
important reason for releasing this report at this time is to promote the use of
available administrative data sources to investigate these dynamics of the labor
market.
Further impetus for the use of state UI wage records comes from the
reauthorization of the Higher Education Act of 1965. This statute addresses the
improvement of program integrity through better state oversight. Approaches include
giving more attention to job placement rates for students in schools providing
vocational training.
Participants' Views of Accountability Issues
"I don't like the idea of being compared to somebody else."12 This recent
statement by a high school principal was made following the public release of school-
by-school performance levels to 13 performance standards included In one state's
two-year-old School Performance Program. A county superintendent of schools adds,
'The state department [of education] has overlooked some very important indicators
of the quality of services provided kids, things that you can't quantify for a report
card."13 The State School Superintendent counters that "for years, the public has
been asking, 'are we getting our money's worth?' I believe we must have this quality
control dimension if we're to convince the public that the system is worthy of its
30
resources."14 The Chairman of the Board of a major corporation in another state
echoes this sentiment:
The public schools lack two critical elements that force business toImprove and deliver value--the pressure of competition and thedemands of consumers in the marketplace. Any monopoly withoutdemanding customers will never reform itself.15
These statements offer a participant's eye view of the accountability process
from four perspectives--a school principal, a county superintendent, a state school
superintendent, and a business executive. Each makes valid points that need to be
considered in any system designed to use administrative data to determine the
employment and earnings outcomes of former students. In the report are cautions
given on the interpretation of data and technical considerations, some of which are
given to satisfy legitimate criticisms or to raise new issues that must be taken into
account.16
Summary
To help address the information needs for providing "consumer rights"
information and for program accountability, this report explores the use of existing
state and Federal administrative data, especially state UI wage records, to learn about
the workplace experiences of former students and the external factors that influence
these experiences. Each of the practical considerations that must be addressed is
covered in Chapter Seven.
31
5J
CONSUMERS, VOCATIONAL EDUCATION ADMINISTRATORS, ANDPOUCYMAICERS: QUESTIONS THAT CAN BE ANSWERED
WITH WAGE RECORD DATA
Employment and earnings information holds value for providing "consumer
rights" information, for determining performance outcomes, and for developing future
policies. (See Figure 11). This chapter discusses different types of informational
needs of various consumers and individuals who might oppose using administrative
data for follow up on former students. It provides cautions about the restrictions on
use of state Ul and other administrative wage records. The interests and information
needs for three key groups--consumers such as prospective students and their
parents, administrators of education institutions, and policymakers--are explored in
detail.
Consumers
Prospective students and their parents want to know what kinds of results they
can expect from investments of time, money, and effort into education. A student may
have questions about a particular course of study, employment opportunities in a
specific occupational field, and future earnings potential. State UI and other
administrative sources can answer many of the questions prospective students might
ask, particularly when the data are linked with the records of the educational
institutions.
32
CONSUMERS, VOCATIONALEDUCATION, AND POLICYMAKERS
PolicyDevelopment
ProgramAssessment
ConsumerRights
Information
InstitutionalPlanning andManagement
Figure 11. Uses of Existing State and Federal Data Sources
33
5 iJ
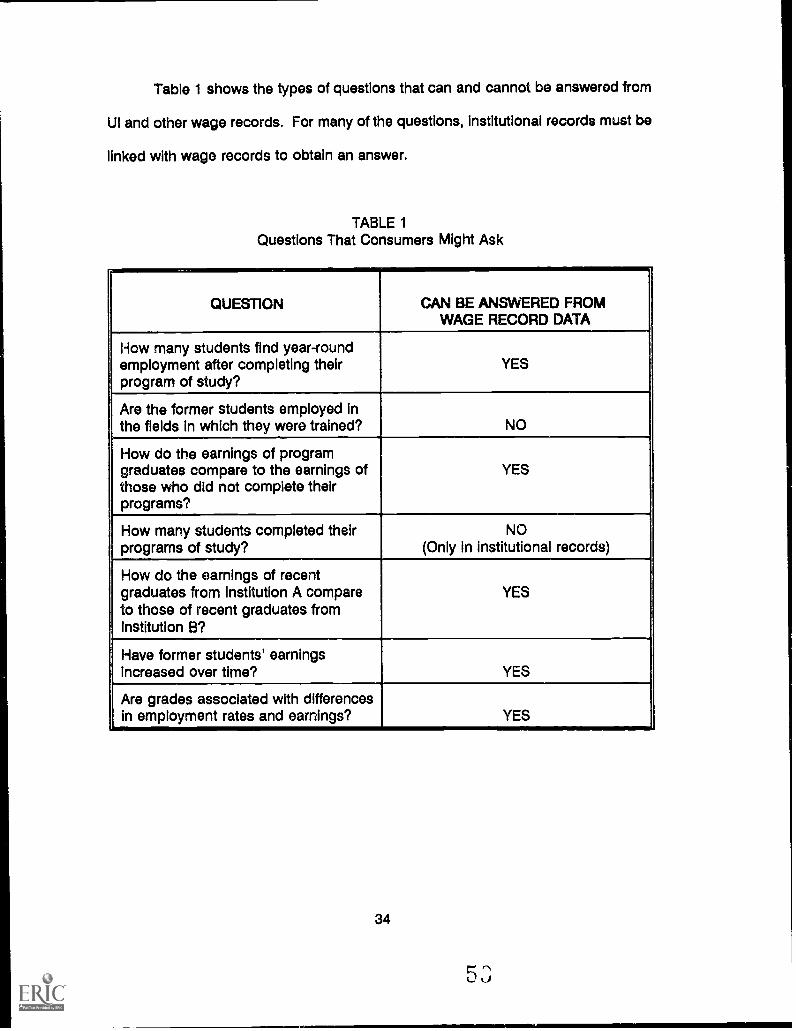
Table 1 shows the types of questions that can and cannot be answerod from
UI and other wage records. For many of the questions, institutional records must be
linked with wage records to obtain an answer.
TABLE 1Questions That Consumers Might Ask
QUESTION CAN BE ANSWERED FROMWAGE RECORD DATA
How many students find year-roundemployment after completing theirprogram of study?
YES
Are the former students employed inthe fields in which they were trained? NO
How do the earnings of programgraduates compare to the earnings ofthose who did not complete theirprograms?
YES
How many students completed theirprograms of study?
NO(Only in institutional records)
How do the earnings of recentgraduates from Institution A compareto those of recent graduates fromInstitution B?
YES
Have former students' earningsincreased over time? YES
Are grades associated with differencesin employment rates and earnings? YES
34
5 3
Vocational Education Administrators
Administrators of vocational education institutions can use employment and
earnings information for institutional planning and management decisionmaking. State
UI and other data sources can help to answer the following questions that may be
asked by administrators, program managers, and instructors as they make decisions
about education programs.
What are employment and earnings data at particular points in astudent's participation in a programat enrollment, while enrolled, andat departure?
Do the employment and earnings outcomes over time of programcompleters indicate a need for changes in specific programs?
How do student demographics affect employment and earning ratesamong programs? For the school?
Does employment and earnings information for those students who donot complete their programs reflect a need for improvements inprogram content or student services?
Do employment and earnings data suggest the need to assess relatededucational services such as career counseling or job placementassistance?
For those students employed at enrollment, what are the initial andlong-term earnings gains after program completion?
Should changes in the curricula of various programs be made basedon an assessment of the performance of program completers?
How do student intentions at enrollment affect student performance inthe workplace?
What are the weakest programs based on employment and earningsdata? Are there special circumstances such as economic factors thatmay explain some of these weaknesses?
Administrators may be more inclined to enthusiastically participate in the
process of record linkage when the benefits of employment and earnings data relate
35
to their responsibilities for decisions about initiating new programs or modifying
current programs. Longitudinal data provides the information they need to analyze
trends among occupational programs and to investigate the employment and
earnings experiences of special groups of students (e.g., women, ethnic minorities,
and older students) who may benefit from related support services such as career
counseling, tutoring, or job search assistance.
Record linkage with UI and other wage data cannot tell school administrators
how satisfied employers are with the job skills of former students, or how satisfied
former students are with the program content and teaching techniques used by the
school's instructors.
Policymakers
The state is the focal point for the data collection and dissemination approach
presented in this report. Thus, policymakers who must finance training and implement
appropriate reporting systems may be interested in the types of questions state UI
wage records will help them to answer. For example:
What is the employment status of former postsecondary vocationaleducation students in the state? Among institutions? Amongprograms?
What are the long-range outcomes (e.g., job retention and earningsgrowth) of former postsecondary vocational education students?
What are the average earnings of former stuients at job entry byselected program within an institution, or among institutions across thestate?
What are the employment and earnings experiences of completers andnon-completers of the same program of study?
Does the grade point average of former students affect long-termearnings gains?
36
5 5
What are the employment outcomes for completers of differentoccupational programs by selected Institution and among institutionswithin the state?
Do employment and earnings outcomes differ for day and eveningstudents?
What income growth do those students employed at enrollmentexperience over time?
The strength of using wage record linkage lies in its ability to provide
information about job retention and earning gains of former students over a much
longer period of time than placement information at program exit, without requiring
local institutions to perform time-consuming, expensive surveys of former students,
often with disappointingly low response rates. Existing wage data can vastly
improve the quality and quantity of information on employment and earnings
outcomes available to policymakers for decisionmaking. Chapter Five provides
answers to many of the questions listed above for former students in the two states
participating in the demonstration project.
Summary
In conclusion, although substantial progress has been made in establishing
a set of guidelines that will promote wider availability of these wage mcords, steps
remain for states to take before the full potential of the approach is realized.17 The
states can be aligned along a continuum of progress to date in establishing
consolidated multi-agency approaches to record linkage.18
A primary goal in this report is to provide each state with accurate information
about what has already been done and what is currently possible as well as how to
protect the confidentiality of former students and their employers. Chapter Seven of
37
this report delineates five steps that describe the process and the procedures for
taking an interagency approach to record linkage and for protecting student
confidentiality.
38
5".
IV.
TESTING THE CONCEPTS
Chapter Four introduces the concepts tested by the demonstration project as
well as the data elements and sources used. Two of the key concepts tested by the
demonstration project were first raised in the Introduction. These concepts are:
1. State Unemployment Insurance (UI) wage records, and related stateand Federal administrative data sources, can be assembled to satisfythe needs of various constituencies in a timely, cost-effective, andreliable manner.
2. This information on education outcomes can be presented in a usefulformat, while protecting the rights to confidentiality of former studentsand their employers.
To test these concepts, the project tapped existing state and Federal
administrative data sources related to two states. One state, located near the national
capital, is characterized by a particularly mobile workforce that frequently crosses
state lines, and by a high level of Federal personnel (both civilian and military). The
other, a midwestern state, has a less mobile workforce, with little crossing of state
lines. Volunteer institutions in these two states were solicited to participate in the
demonstration effort. Both community colleges and proprietary institutions in each
state agreed to be involved in the project. Since the institutions involved were self-
selected, the results reported in this part are illustrative and may not be statistically
representative of all institutions within each state, or of former postsecondary
vocational education students nationwide.
39
r mJ,.,
The study examined the feasibility of using State Employment Security Agency
(SESA) Unemployment Insurance (UI) wage records with other existing Federal and
state wage data bases to answer the following questions:
What Is the employment status of former postsecondary vocational
education students?
What are the long-range workplace outcomes such as job retentionand earnings growth of former students?
Can performance measurements such as placement rate and training-related placements for institutions and programs be obtained from theuse of state UI and other administrative data bases?
The administrative data sources referred to in this report are employment and
earnings information that is already being collected for purposes other than for follow
up of former students. Step 2 of Chapter Seven gives details about each of the
administrative data sources pursued in the study and how each one can and cannot
be used.
The demonstration project sought to answer these additional questions:
What will the data and subsequent analysis reveal that is not alreadyknown from placement information gathered by vocational educationinstitutions?
Can employment and earnings information help create discriminatingconsumers?
Can these data improve quality control within the education sector?
Can overlooked indicators and hidden influences on outcomemeasures such as economic factors be added?
Can the practice of performance measurement be improved throughgreater reliance on existing wage data sources?
With the incorporation of several unique features designed to help answer
these questions, the demonstration project:
addressed elements beyond the control of vocational educators, bytaking into account the influence of external factors--economicindicators that may affect employment and earnings outcomes;
enlarged the universe of former students beyond that used in pastefforts undertaken at the state level, by including both public andprivate postsecondary vocational education institutions; and
provided a long-range view of workplace experiences of formerstudents, through access to over four years of wage records for oneof the participating states.
The manner of presentation of the data and findings in this report reflects the
fact that this was a demonstration project, rather than a pure research and evaluation
study. The demonstration project collected data about former students of volunteer
institutions within the two participating states. The data presented in Chapter Four
may represent former students of one institution, one state, or both states. Refer to
the discussion of each individual topic to ascertain which group is being referenced.
The next sections introduce data sources and the core of data elements
utilized by the demonstration effort.
Data Sources
The demonstration project consolidated several different administrative data
sources into a single format, called a comprehensive data platform. Step 5 of Chapter
Seven explains how to build a data platform. Chapters Five and Six demonstrate how
the use of a variety of data sources adds to the richness of the analysis and to final
results.
Altogether, 22 sources of existing administrative data sources were assembled
and analyzed to answer the proposed questions. The findings of the demonstration
project reflect the following data sources:
41
6)
Individual student data for all participating postsecondary vocationaleducation institutions in two states;
Specific curricula data for all participating postsecondary vocationaleducation institutions in two states;
State UI wage records data for employees covered by state law;
Adjacent-state UI wage records data for employees covered by that
state's statutes;
U.S. Office of Personnel Management file data for Federal civilianemployees employed during 1990; and
U.S. Department of Defense file data for personnel entering the militarybetween FY85 and March 1990.
Institutional data were acquired from private career schools, a State Board for
Community Colleges, and a State Higher Education Coordinating Board. All
participating institutions did so on a voluntary basis, with full confidentiality to protect
individuals and institutions. In the eastern state participating in the demonstration
project, there were five cooperating commurbity colleges with 1,631 students and eight
participating proprietary schools with 3,900 students. In the midwestern state, there
were nine cooperating community colleges with 4,778 students and six participating
proprietary schools with 1,195 students. Altogether, 28 institutions were involved in
the demonstration project and 11,504 student records were available for analysis.
The next paragraphs give an overview of each data source used in the
demonstration project. Step 2 in Chapter Seven of this report discusses each data
source in detail.
42
6
State UI Wage Records
State UI wage data are generally maintained by the unemployment
compensation division within each state's employment security agency. Each
employer who is required to comply with a state's unemployment compensation laws
submits a quarterly wage report. By the mid-1980's, three-fourths of the states had
committed to the collection of these earnings records for the routine administration
of unemployment compensation programs.
In 1984, Congress mandated that all states collect quarterly earnings
information from employers, beginning no later than October 1988, to facilitate the
verifimion of income and eligibility for selected Federal benefit programs. As of
March 1992, only Massachusetts and New York did not collect this information
through their State Employment Security Agencies, with legislation pending in
Massachusetts to do so.
Chapter Seven of the report describes State Employment Security Agency
(SESA) wage record data in depth. Here, the following essentials are noted:
Employer coverage requirements and the definition of reportableearnings are determined by each state, although there is substantialuniformity among the states.
Each employee's total quarterly earnings are reported by socialsecurity number, and with the employer's own unique identificationcode.
Industry and geographic codes are usually found in a separate filemaintained by each State Employment Security Agency, and care mustbe exercised to understand how to interpret these with respect to anindividual employee.
Only a few states collect information about the number of hours orweeks an employee worked during a quarter.
Only Alaska collects occupational detail about reported employment.
43
Employers are required to report within one month following the end of a
quarter, and the State Employment Security Agency is required to have these data
available for unemployment compensation program administration by the beginning
of the following quarter. This means that, in principle, a quarter's wage record data
are available three months after that quarter ends. Depending on how and when
access to these records is requested, a four- to six-month lag should be expected.
Readers need to be aware of the limitations of State UI wage data. State UI
wage racords do not generally include occupational or wage rate information.
Therefore, one cannot determine if students are employed in the field in which they
were trained. Although wage records contain employer's Standard Industrial
Classification (SIC) codes, these do not translate directly into the Classification of
Industrial Program (CIP) codes often used by vocational education institutions. For
example, the SIC code for IBM would not indicate if an individual employee were a
computer programmer, a secretary, or a janitor. To address this limitation of State UI
wage data, Florida supplements it with an employer survey.
The demonstration project contacted a total of five State Employment Security
Agencies (SESAs), three of which were in adjacent states to one of the states
participating in the demonstration project, for Ui wage data records. Data were
available from the SESAs for all quarters from 1985 through 1990, and in some cases,
for the first three quarters of 1991. Most of the data presented in this report cover the
years 1985 through 1990.
State UI wage data address two questions frequently asked about
postprogram employment and earnings outcomes:
Do former students work in the state where they attended school?
How much do they earn each year?19
State UI wage data can be used to conduct a variety of Interesting analyses. Many
topics of analysis using state UI data are discussed in Chapter Five on the project's
findings.
Adjacent State UI Wage Records
Adjacent state UI wage records refers to covered employment in a state
adjacent to the one that houses the educational institutions under study. Adjacent
state UI wage records data are available for employees employed in a quarter or in
a combination of quarters. Whether the adjacent state will respond to a request to
cross-match social security numbers of former students from another state to their
records may depend on the adjacent state's statutes, regulations, and procedures
regarding data confidentiality and security.
Chapter Five presents data from three states adjacent to one of the
demonstration project's state. Linking with records across state boundaries does not
have to occur with the same frequency as in-state matching.2° For postprogram
purposes, if a stable percentage of out-of-state employment is observed for a chosen
unit-of-analysis, then this figure can be used until a need to verify the continuing
accuracy of the number arises. The practicality of this approach depends upon the
intended use of the resulting estimates. The need for accuracy must be weighed
against the additional costs of obtaining these data.
45
The demonstration project foun4: ,;-"mat almost seven percent of the former
community college students in one participating state were found working in an
adjacent state six years later. This fact indicates the practical importance of
considering the development of interstate agreements for this type of data sharing.21
(See Table 2 in Chapter Five.)
U.S. Office of Personnel Management
The U.S. Office of Personnel Management was asked to provide only a
snapshot of Federal civilian employment status as of December 1990, because the
costs to provide data on earlier periods were prohibitive. (See Table 2 in Chapter
Four.) The percentage of former students who later become Federal civilian
employees will vary among specific curricula, schools, and even states depending
upon the location and occupational skill requirements of Federal employment
opportunities.
U.S. Department of Defense Manpower Data Center
The U.S. Department of Defense Manpower Data Center information in this
report covers any military enlistment from FY 85 through the second quarter of 1991.
The demonstration project found very few former students that later served in the
military. However, many enlistees join to qualify for educational benefits, so any
policymaker or practitioner who intends to trace postprogram outcomes for high-
school leavers would expect to find a higher level of military service than that shown
in this report.
46
There is an interesting but untapped potential in the linkage of military service
and postsecondary education student records. Little is known about the
transferability of military occupational assignments to civilian work settings. The
matching of military and school records permits an investigation of the ties between
military training and work experience, and subsequent postsecondary educational
pursuits.
Where Can Data on Students Be Found?
There are three sources for student records:
A few states have identifying information on students at the state level.This may be a statewide system for collecting data on students ofpublicly-funded institutions including community colleges and four-yearcolleges and universities.
The state agency responsible for regulating proprietary institutions mayhave data on these institutions' students.
Educational institutions have records on current and former students.
Chapter Five presents data on the 11,504 former students in the two
demonstration states. In the presentation of data, all cells with fewer than three cases
are censored to protect the identities of former students. Whenever there are fewer
than three cases for the particular unit of analysis, this type of censoring can help to
prevent identification of a particular student or institution.
It should be emphasized that the chief limitation in conducting reliable analysis
for the demonstration project was not related to the State UI record data. Rather,
difficulties stemmed from the incompleteness and incompatibility of student records
across the participating institutions.
47
Cti
Core of Data Elements
The manner in which Information about students can be gathered depends
upon the system used for keeping student records, state legislation, and regulations
regarding confidentialI y of records and data security. The essential data element
from school records is the social security number of the former student. This is the
identifier that will link school records to state UI wage data records and other data
sources. Refer to Step 3 in Chapter Seven for information on the legality of using
social security numbers, on protecting the confidentiality of students, and on other
important considerations that arise when using sodal security numbers for record
linkage.
To relate employment and earnings outcomes to student characteristics, the
demonstration project gathered the following data elements from institutional records:
gender, race /ethnicity, and date of birth. The marital status of students can also be
helpful, if available.
To compare outcomes among programs within an institution or among
institutions within a state, the demonstration project utilized the following data
elements:
date of school entry;
date of school exit;
program of study using CIP code (when possible);
competency scores;
grade point average;
completion status; and
type of degree earned such as a certificate or an associate degree.
48
5 '
The county of residence of former students is useful in relating workplace
experiences of former students to local economic conditions.
In summary, to analyze employment and earnings outcomes in relationship to
student characteristics, program of study, and institution attended, the demonstration
project used:
data elements such as prior education and the student's educationalgoal at the time of application for admission;
data elements that become available only during a student'senrollment, such as grades and competency scores;
data elements available only at the time of final program exit, such asgrade point average or degree obtained;
data elements on program of study; and
student data elements such as gender, race/ethnicity, and date of birth.
Student Demographics
In interpreting employment and earnings data, it is important to consider that
there may be differences in student demographics across schools and among
programs within the same school. The demonstration project illustrates how student
demographics can be taken into account when employment and earnings data will
be used for institutional management and policy purposes. Chapter Five further
discusses the effects of student demographics on employment and earnings
outcomes.
Data Elements and Adjacent State UI Wage Records
If a state establishes a performance standard for postprogram employment,
then both in-state and out-of-state employment data will be of interest to
49
policymakers, educators, and administrators. Other data elements such as industrial
affiliation, job retention, and earnings paths can be obtained from an adjacent state
through a generally more elaborate data acquisition effort. This effort will increase
costs for collecting and archiving longitudinal data as well as for standard data
processing.
External Factors
Local labor market conditions can greatly influence the types of jobs secured
and job earnings. Changes brought on by a recession, plant closings, reductions-in-
force, or new requirements for specific occupations may not affect all areas of a state
equally. These changes may also affect employment and earnings differently.
Because it may be misleading to release program- and school-specific
information without explaining differences in student populations, school programs,
and local economic conditions, the demonstration project incorporated in its study
data on those external factors that are beyond the control of vocational educators.
External factors are measures of local economic conditions and changes over
time that can affect employment and earnings outcomes. Educators have long
opposed attempts to use program evaluations based on student outcomes as
performance measures, citing the unfairness of blaming the education community
when economic conditions weaken. Industry and occupational changes, emerging
technologies, and the overall employment/unemployment dynamics in the local
economy may affect the employment and earnings of former students.
To account for external factors, the demonstration project incorporated data
on key local economic factors such as employment/unemployment rates, and growth
50
level of county by building permit issuance. Chapter Five explains how local
economic factors affect employment and earnings of the former students in the two
demonstration states. Step 3 in Chapter Seven provides procedures for collection of
data on external factors.
Summary
A broad range of data elements can be pursued and analyzed through linking
student records with the existing administrative sources discussed in this report. The
extent of the analysis that can be undertaken depends on the data elements selected
for collection. But, the social security number of every student must be provided in
order to link the student records with the state UI wage records and other data
sources.
Chapter Five follows and presents information on the workplace experiences
of former students in the two demonstration states, and policy questions and
implications raised by the project's findings.
51
7
V.
FINDINGS OF THE DEMONSTRATION PROJECT
Introduction
Chapter Four presents the findings of the two-state demonstration project on
the use of administrative wage records to determine the workplace experiences of
former students of public and private vocational education institutions. The findings
for each of the following topics of inquiry are discussed:
Employment and Earnings and Programs
Effects of Data Collection Decisions on Outcomes
Former Students at the Time of Initial Application
Enrollment Persistence and Employment Rates
Grades and Future Earnings
Outcomes and Institutions
Earning Gains of Former Students
Student Characteristics and Outcomes
Outcomes and the Local Economy
Lessons Learned
The findings of the project illustrate the experiences in the labor market of
former students of only those institutions that volunteered for the project, and
therefore may riot necessarily be representative of all former students within these two
states or of former students nationwide.
52
As mentioned in Chapter Four, a total of 28 institutions participated in the
demonstration project in the two states. In the eastern demonstration state, there
were five cooperating community colleges with 1,631 students and eight participating
proprietary schools with 3,900 students. In the midwestern state, nine community
colleges with 4,778 students and six proprietary schools with 1,195 students were
involved. A total of 11,504 student records were analyzed to present the findings in
this chapter.
The figures presented in this chapter represent actual data collected during the
two-state demonstration project. No data on former students reveals the identity of
any participating institution as all institutions were promised anonymity in return for
their participation in the demonstration project. Administrators received feedback only
on the former students in each of the occupational programs offered by their own
institutions. No administrator received information about any other school's former
students. Administrators also received no information that might reveal the identities
of former students of their schools. The demonstration project achieved this level of
student confidentiality by censoring all cells with fewer than three cases, and by
subsequently reviewing the resulting cross tabulations to assure that no former
student's identity could be ascertainec
Readers are encouraged to carefully consider each illustration in light of the
accompanying technical considerations and interpretive cautions. Policy and research
questions are presented for further consideration. As explained previously, data and
findings are sometimes presented in a different manner than in other kinds of reports,
since this was a demonstration project rather than a research study or program
evaluation.
53
7 2,
Employment and Earnings and Programs
Table 2 displays employment and earnings information for former students of
five participating community colleges in one state of the demonstration project. It
shows actual reported earnings figures for former students of all participating
community colleges using only state UI wage records. Table 2 reflects the following
six data sources:
Individual student and curricula data from each of five participatingcommunity colleges in one state; and
State UI wage records data for employees employed any one quarterof a year and for employees employed in all four quarters of a year.
Fall 1984 first-time enrollees in selected occupational programs make up the
universe in Table 2.22 Enrollment figures are fall 1984 enrollment totals. Two
occupational programs--Secretarial Science and Real Estate- -were selected to
illustrate important findings of the demonstration effort. The All Programs part of the
table includes all occupational programs offered by the five community colleges in the
fall 1984 semester.
Information on credit hours earned and highest degree received at the
community college is available, but neither is reflected in Table 2.23 The year 1987
was chosen as the first year to trace the postprogram status of former first-time24
community college enrollees in the Fall 1984 semester. Due to budget limitations,
data were collected for only four years.
Table 2 addresses two key questions about employment and earnings:
Do the former students work in the same state where they attendedschool?
How much do they earn each year?23
54
7j
TABLE 2Employment and Earnings by Program for 1984 Community College First-Time Enrollees
(All Participating Institutions In One State)
PROGRAM: SECRETARIAL SCIENCE (Enrollment: 275)
Year
State Wage Records (1)
# Employed Percent Mean # Employed Percent Mean
in some qtr. Employed Earnings all 4 quarters Employed Earnings
1987 180 65% $ 9,699 125 45% $ 11,901
1988 174 63% $ 10,665 109 40% $ 14,333
1989 162 59% $ 13,179 109 40% $ 16,989
1990 152 55% $ 13,466 93 34% $ 17,443
PROGRAM: REAL ESTATE (Enrollment: 142)
Year
State Wage Records (1)
# Employed Percent Mean # Employed Percent Mean
in some qtr. Employed Earnings all 4 quarters Employed Earnings
1987 93 65% $ 26,642 78 55% $ 29,471
1988 95 67% $ 26,239 71 50% $ 33,291
1989 90 63% T 29,068 68 48% $ 33,843
1990 88 62% $ 31,976 64 45% $ 37,815
ALL PROGRAMS: (Enrollment: 1631)
State Wage Records (1)
Year # Employed Percent Mean # Employed Percent Mean
in some qtr. Employed Earnings all 4 quarters Employed Earnings
1987 1084 66% $ 12,917 743 4.6% $ 16,308
1988 1073 66% $ 14,018 712 44% $ 18,372
1989 1010 62% $ 16,175 685 42% $ 20,488
1990 974 60% $ 17,297 589 36% $ 22,701
NOTES: (1) State employment figures were calculated using two rules. Rule 1 - include all enrollees with non-zero earnings In any one or more quarters of the year. Rule 2 - include only those enrollees withnon-zero earnings In all four quarters of the year.
55
Table 2 represents a composite of all five institutions because each one was
promised anonymity in return for participation in the demonstration project. The
results given to administrators of each community college were an Identical format,
but included only the former students In each of their own occupational programs.
The first three columns of Table 2 reveal the actual reported annual earnings
of former students with reported earnings during any one or more quarters In a
designated year. The second set of three columns displays the annual earnings for
only those former students with reported earnings in each of the four quarters of the
designated year. These two sets of figures (i.e., those employed all four quarters
versus those employed one or more quarters) paint remarkably disparate pictures for
both percent employed and mean annual earnings.
The findings on the employment and earnings outcomes of these 1984 first-
time enrollees of community colleges are:
1. The highest percent employed figures appear during the first year ofobservation for both the Secretarial Science curriculum and for AllPrograms, but not for the Real Estate program.28 The typical patternis to see a slow attrition of the percent employed figure over time, assome former students return to school, withdraw from the workforce,or leave the state to accept employment elsewhere.
2. With the single exception of a slight 1987-88 reduction in averaeearnings reported for former enrollees in the Real Estate curriculum,"all other former students' earnings show an increase over time.
3. From 17 to 23 percent more of the 1964 first-time enrolleeswere foundto be employed in any one or more quarters than were found to beemployed in all four quarters for the selected occupations.
4. The more stringent four-quarter earnings criterion lowers the numberof former students who are induded in the employment rate, onaverage, 20 percentage points.
56
5. Placement information at program exit, combined with follow-upinformation one quarter later, overstates by a substantial amount thenumber of former students who are employed year-round, at leastwithin the same state!. The reason for this overstatement is that theinformation is based on a single quarter.
The comparison of information obtained for one quarter in a year to that
obtained for four quarters is important because it casts doubt on the sufficiency of
snapshot information (i.e., information for just one quarter in a year) as a stand-alone
measure of postprogram employment status. Only the four-quarter criterion actually
answers the following questions:
Do former students find year-round jobs?
What do they earn annually?
Do their earnings improve over time?
Technical Consideration
For releasing information to the public, a rule of thumb might be to require
that pc rcent employed and average earnings figures always be drawn from the
same population and presented together. The reason why is apparent when the
two sets of columns (i.e., those for "employed in some quarter' versus those for
"employed in all four quarters") are compared. The percent employed figure can
be maximized by selecting reported earnings in any quarter. The average
earnings figure can be maximized by requiring that reported earnings appear in
each of the four quarters, perhaps with a further stipulation that a floor level of
earnings in each quarter must be reported. Release to the public of these two
figures would create an apples and oranges situation; misunderstanding is
guaranteed.
57
he+
Interpretive Caution
It is unwise to generalize about an expected pattern of employment over
time unless careful thought has been given to the relative weights of different
forces that are present in a particular setting. For example, if former students at
a community college continue on to a four-year college, then the percent
employed and average earnings figures may temporarily reflect this status (if the
students do not simultaneously work in covered jobs). Part-time employment
while in school, coupled with seasonal employment during the summer (and
perhaps over a Christmas break), creates a very uneven quarter-to-quarter flow of
earnings. This example highlights the importance of thinking through whether
more than one quarter of UI wage record data will be needed to provide accurate
answers to the questions being asked.
The Secretarial Science, Real Estate, and All Programs presentations in
Table 2 were chosen to demonstrate the importance of the unit-of-analysis issue.
The All Programs average reflects not only the two curricula shown, but also all
other occupational curricula not shown separately in Table 2. This means that
comparison of the All Programs results among institutions will reflect differing
enrollment distributions across the curricula, as well as other factors such as
student demographics.
Summary of Table 2
A summary of Table 2 appears in Figure 12. it lists the key "consumer rights"
questions that data from Table 2 answers, the key data elements used, the data
sources, and some important technical considerations and interpretive cautions.
58
SUMMARY OF TABLE 2
Key Questions Answered for "Consumer Rights" Information
What percent of students worked all four quarters during the
year?
What percent of students worked at least some quarter during the
year?
What were the mean earnings for students who worked all fourquarters?
What were the differences of employment and earnings outcomesamong programs?
Key Data Elements Used
Social security numbers of former students
Program data for each former student (date of entry, date of exit,degree received, etc.)
Data Sources
School-based
State UI wage records
Some Technical Considerations and Interpretive Cautions
Do not extrapolate findings from a limited data set for predictablepatterns over time.
A rule of thumb might be that the percent employed and averageearnings figures should always be drawn from the same cohort offormer students and presented together.
Figure 12. Summary of Table 2
59
'1
Findings with Additional Data Sources
Table 3 displays the information from Table 2 plus earnings data collected from
three additional sources. These sources are:
adjacent state UI wage records data for employees employed any onequarter during 1990;
U.S. Office of Personnel Management file data for Federal civilianemployees employed during 1990; and
U.S. Department of Defense file data for personnel entering the militarybetween FY85 and March 1990.
State U1 wage records were requested from three states adjacent to the one
where the community colleges were located. Additionally, data from the U.S. Office
of Personnel Management wage records and U.S. Department of Defense Manpower
Data Center were requested. With these additional data sources, new information on
the workforce experiences of these 1984 first-time enrollees in the five community
colleges was learned:
Approximately 6.7 percent of the 1,631 former community collegestudents were found to be working in one adjacent state six yearslater.
Nine percent of the former students who first enrolled in the fall of 1984were identified as Federal civilian employees as of December 1990.
Very few of the former community college enrollees had later militaryservice.
It should be noted that matching student records with adjacent-state UI wage
records does not need to occur with the same frequency as in-state matching. Also,
earnings data from the U.S. Department of Defense requires a more complex approval
process than determining if any former students were found in a cross-match of social
security numbers.
60
73
TABLE 3
Employment and Earnings by Program for 1984 Community College First-Time Enrollees
(All Participating Institutions)
PROGRAM:
SECRETARIAL SCI
(Enrollment:
275)
Own State Wage Records (1)
US Office of Personnel
Management (2)
US Dept of Defense
Manpower Data Ctr (3)
ADJACENT STATES
State 1
RECORDS
State 2
(4)
State 3
SS Employed
Percent
Mean
N Employed
Percent
Kean
Number
Percent
Mean
Began military svce
Number
Number
Number
Year
in some qtr
Employed
Earnings
all 4 qtrs
Employed
EarningsEmployed
Employed
Earnings
FY1985 - Mar 1990
Employed
EmployedEmployed
1987
180
65%
S9699
125
45%
S 11901
C
1988
174
63%
S 10665
109
40%
S 14333
1989
162
59%
S 13179
109
40%
$ 16989
1990
152
55%
S 13466
93
34%
S 17443
24
9%
S 19323
C (5)
19
6
PROGRAM:
REAL ESTATE
(Enrollment:
142)
Own State Wage Records (1)
US Office of Personnel
Management (2)
US Dept of Defense
Manpower Data Ctr (3)
ADJACENT STATES
State 1
RECORDS
State 2
(4)
State 3
0 Employed
Percent
Mean
Si Employed
Percent
Mean
Number
Percent
Mean
Began military svce
Number
Number
Nurrber
Year
in some qtr
Employed
Earnings
ell 4 qtrs
Employed
Earnings
Employed
Employed
Earnings
FY1985 - Mar 1990
Employed
Employed
Employed
1987
93
65X
5 26842
78
53%
S 29471
C
1988
95
67%
5 26239
71
50%
S 33291
1989
90
63%
S 29068
68
48%
$ 33843
1990
88
62X
S 31976
64
45%
S 37815
54X
$ 37383
CC
C
ALL PROGRAMS
(Enrollment: 1631)
Own State Wage Records (1)
US Office of Personnel
Management (2)
US Dept of Defense
Manpower Data Ctr (3)
ADJACENT STATES
State 1
RECORDS
State 2
(4)
State 3
# Employed
Percent
Mean
OR Employed
Percent
Mean
Number
Percent
Mean
Began military svce
Number
Number
Number
Yeur
in some qtr
Employed
Earnings
all 4 qtrs
Employed
Earnings
Employed
Employed
Earnings
FY1985 - Mar 1990
Employed
Employed
Employed
1987
1084
66%
5 12917
743
46%
S 16308
11
1988
1073
66%
5 14018
712
44%
$ 18372
1989
1010
62%
5 16175
685
42%
S 20488
1990
974
60%
S 17297
589
36%
S 22701
153
9%
S 26850
18
110
22
NOTES: (1) Own state employment figures calculated
using two rules.
Rule 1--include all enrollees with non-zero earnings in any one or more quarters
of the year.
Rule 2--include only those enrollees with non-zero earnings
in all four quarters of the year.
(2) Federal OPM statistics based on December 1990
data.
(3) U.S. Dept. of Defense Manpower Data Center
statistics based on fiscal year 1985 through March 1990 date.
(4) State 1 statistics include all enrollees employed at anytime between first quarter 1990 and second quarter 1991.
State 2 statistics
include all enrollees employed at any time between third quarter
1990 and third quarter 1991.
State 3 statistics include all enrollees
employed first or second quarter 1987.
(5) The letter "C" indicates that a cell has been censoredbecause fewer than three observations are found in this cell.
This is necessary to
k..)
comply with confidentiality requirements.
BE
ST C
OPY
AV
AU
BL
E8
The use of additional data sources including out-of-state information provides
a more comprehensive picture of the labor market experiences of the former
community college students. If a performance standard is established for employment
outcomes, then both in-state data (as shown in Table 2) and out-of-state data
(displayed in Table 3) would be of interest to policymakers and vocational educators.
A summary of Table 3 appears in Figure 13.
SUMMARY FOR TABLE 3
Key Question Answered
What was learned about the former community college studentswhen additional data sources were added to the data base?
Key Data Elements
Social security numbers of students
Program information on each student
Key Data Sources
Adjacent state UI wage data
U.S. Office of Personnel Management wage records
U.S. Department of Defense Manpower Data Center records
Key Technical Considerations and Interpretive Cautions
Matching student records with adjacent-state UI wage records doesnot need to occur with the same frequency as in-state matching.
Earnings data from the U.S. Department of Defense requires a morecomplex approval process than employment information (i.e.,whether any former students were found in a cross-match of socialsecurity numbers).
Figure 13. Summary for Tab e 3
63
oftagBMglesg&gicarggggas
The previous section demonstrated that the choice of collecting data from
either any quarter" or from "all four quarters" of wage data records affects the results
obtained for both employment rates and average earnings levels. Figure 14
addresses two related questions Important to determining and understanding former
students' employment and earnings:
Should a one-quarter or multiple-quarter approach be used forlongitudinal coverage?
If only one quarter Is represented, which quarter provides the mostreliable results?
As was concluded in the discussion in Table 2, it is clear that the choice of
criterion for documenting former students' employment in a designated year affects
the resulting reported level of employment for an institution or state. Figure 14
approaches the issue of year-round employment from an earnings perspective.
Consumer questions frequently focus on the annual earnings of former students in
specific occupational programs or institutions.
Current Practice
Some pioneers in the use of state wage record data calculate an "annualized"
earnings figure by requesting only one quarter of data, then multiplying this quarterly
earnings figure by four. The demonstration project tested the adequacy of this
approach by comparing the calculated "annualized" figure with actual annual earnings
based on four quarters of wage record data for one of the participating states.
Figure 14 shows the results of this test.
64
3,000
E2,500
co0-Ee 2,000ocOt 1,500=01 1,000N
Tscc 500c4
1 2 3 4 1 2 3 4 1 2 3 4 1 2 3 4
86 I 87 I 88 I 89
Quarter: Year
Figure 14. Difference Between Annualized Quarterly Earningiand Actual Annual Earnings
In Figure 14, the horizontal axis indicates quarterly data points beginning with
the first quarter of 1986 (1986:1) and extending through the fourth quarter of 1989
(1989:4)a four-year time span. The vertical axis measures the difference between
a calculated "annualized" earnings figure based on a particular quarter's wage record
data multiplied by four and the actual annual earnings figure, obtained by adding theI
65
earnings from all four quarters of that year. The following findings were derived from
Figure 14:
A 1986 annualized earnings figure calculated by multiplying first quarter1986 wages by four overstates the actual 1986 average annualearnings figure by $ 2,200.
Annualized earnings figures calculated in the same way using 1986:2,1986:3, and 1986:4 wage record data also overstate actual 1986average annual earnings by $1,500, $900, and $100 respectively. Itfollows that, for this state and for 1986, the first quarter is the worstchoice as a basis for calculating annualized earnings using thisformula, and the fourth quarter is the best choice.
The same quarter-to-quarter pattern prevails for each of the other three years of data
included In Figure 14.
There is an urgent need to conduct similar tests with comparable data for
other states, and for more recent quarters, to determine whether this pattern is
replicated across states and in different economic conditions. Figure 14 makes a
strong case for devoting attention to this issue as soon as possible.
Some pioneering states continue to use a single quarter of wage record data
for postprogram accountability purposes. Others continue to use one quarter of data,
but have recently changed which quarter they use. Still others are seeking guidance
about how to proceed. All policymakers and practitioners are advised to pay close
attention to the effects of data collection decisions on reported outcomes and to
support immediate attempts to replicate the tests demonstrated in Tables 2 and 3 and
Figure 14.
66
IMPORTANT NOTE
The remainder of this chapter mixes documented employment and
earnings data acquired during the demonstration project from volunteering
proprietary schools with that obtained from public postsecondary institutions.
The intent is to illustrate how employment and earnings outcomes can be
related to student, institution, and local economic data elements to meet a wide
range of consumer demands for information.
Most of these analyses are for a limited subset of the data, often for a single
institution. These illustrative presentations are not offered as a substitute for
appropriate statistical analysis.
Former Students at the Time of Initial Application
The types of information presented in the next three figures will be of interest
to prospective students and their families, school administrators and counselors at
both the secondary and postsecondary levels, and those program staff who are
responsible for system-wide accountability..
Figure 15 traces the employment rates of former students in one of the project
states, who are known to have either a high school diploma oi a general educational
development (GED) certificate prior to postsecondary enrollment.
67 E1
\,,,,,k '
',\
N\s .\\
Figure 15. Employment Rate by Previous EducationalAttainment
Figure 15 displays a divergence between the two groups in terms of
documented employment in the last three years of the five-year period. These data
show that:
By 1990, the end of the five-year period studied, a difference of16 percentage points emerged between the employment rate ofindividuals who had high school diplomas and that of individuals withGEM.
For former students with GEDs, the documented employment rate fellalmost 12 percentage points from 1988 to 1989 and another8 percentage points by 1990.
68
A longitudinal comparison of earnings, which is not shown here, reveals no
consistent long-term difference over the five-year period between those who received
a high school diploma and those who received a GED certificate. This suggests that
the underlying difference may lie in participation rates in the labor market, rather than
in earnings differences among those who do work. This is obviously an important
policy issue that warrants continued investigation.
The data in Figure 15 also suggest that the weakening of the economy
affected the employment rates for these former students. For example, the
employment rate of former students with a GED fell from 78.9 percent in 1988 to 59.2
percent in 1990, a significant drop for this group of former students.
Students' Goals and Outcomes
Figure 16 relates the employment pattern of former students' to their stated
goal at the time of enrollment, which was extracted from the administrative records of
cooperating institutions in the demonstration project. The project examined three
student goals:
to take a course without pursuing a degree;
to earn a certificate; or
to earn an associate degree.
69
100Entrance Goal
Take Course Earn Earn AssociateNo Degree I Certificate Degree
401985 1986 1987 1988 1989 1990
Year
Figure 16. Employment Rate by Educational Goal at Time ofEntry to the Institution
Figure 16 shows the following:
The highest employment rate 77.8 percent was found in 1986 forthose former students who had the goal of earning a certificate atprogram entrance.
Over 75 percent of those former students whose goal at programentrance was to earn an associate degree were employed in 1986.
For those former students taking a course with no degree plans,almost 68 percent were found to be employed in 1986.
The paths of documented employment shown in Figure 16 suggest the value
of linking information about community college enrollment with information about
subsequent enrollment in four-year colleges and universities in a state. The lower
employment rate for thcze who planned to pursue an associate degree compared to
70
9J
those who planned to earn a certificate may be explained by their higher probability
of continuing on to pursue additional postsecondary education. Based on the data
that are presented in Figure 16, this is pure speculation, but the availability of
additional higher education data would permit testing of this hypothesis.
Educational Goal
Take Earn Earn Associate--4--Courts Csdific.als °ogres
02 3 4 1 2 3 4 1 2 3 4 1 2 3 4 1 2 3 4 1 2
85 86 I 87 I 88 I 89 I 90
Figure 17. Average Quarterly Earnings by Educational Goal atTime of Entry to the Institution
Figure 17 displays earnings outcomes of the same group of former students
with the same classifications of stated goals as described for Figure 16. The revealed
pattern is consistent with the speculation stated in the previous paragraph. The
members of each "educational goal" group enjoyed increased average earnings
overtime, with no crossover patterns. The earnings of those desiring an associate
71
degree were lower than those of the other two groups-possibly because of time
spent In continued education.
Figure 17 demonstrates why knowledge of previous and concurrent
employment is important in examining particular types of policy issues. The intent of
the student at program entrance may have a greater impact on employment and
earnings outcomes than has been previously acknowledged. These findings indicate
that policymakers should consider the following:
Course takers without a degree goal are likely to be seeking aspecialized skill
Those students who seek a certificate are likely to enter full-timeemployment soon after program exit.
Some of those who seek an associate degree will combine work andschool while doing so, and some will continue on to pursue a four-yeardegree.
Average rates of documented employment and earnings, which do not take
these types of differences into account, will be less reliable as guides to decision
making by future students, policymakers, and school administrators.
Together, Figures 15, 16, and 17 suggest why and how longitudinal
information might be used within a single institution, school system, or state to
develop refined uses of information that is available even before students are admitted
to a postsecondary institution or program. The observed deterioration in employment
rates for 1989 and 1990 noted In each of the figures coincides with the softening of
local economies in both of the demonstration project states. This suggests that
longitudinal data measures the susceptibility of former students to fluctuations in
employment opportunity.
72
Enrollment Persistence and Employment Rates
Enrollment persistence figures provide a look at what happens between the
time students enroll in a program and the time they leave. Most of the figures in this
section on enrollment persistence use the employment and earnings data extracted
from state UI wage records. Figures 18, 19, and 20 illustrate why changes that have
occurred in the demographic mix of postsecondary enrollments increase the
importance of inquiries about enrollment persistence.
Figure 18. Subsequent (Continuing) Enrollment of 1986 First-Time Community College Enrollees
Figure 18 shows the percentages of fall 1986 first-time enrollees in five
community colleges in one of the demonstration project states who subsequently re-
enrolled in the fall semesters of 1987, 1988, and 1989. Underlying what is shown in
73
Figure 18 are data elements that would permit us to determine demographic
characteristics such as gender, race, age, and marital status of students who remain
in school and those who do not. These findings can then be related to subsequent
employment and earnings outcomes.
Figure 19 shows longitudinal enrollment data that reveal important differences
in persistence rates for former white and non-white students. Readers who are
familiar with postsecondary institutional research literature have seen similar evidence
accumulating throughout the 1980's.
Figure 19. Subsequent Enrollment of 1986 First-TimeCommunity College Enrollees by Racial Group
74
: - : :
Z : Z :
I s
:
:
p\r
: :
: :
Z -
. : :
Program Completers and Employment
Figures 21 compares employment rates for all former students in the
demonstration project's data base who have completed a program of study to those
who attempted but did not finish.
60
55
i,500E 45
t 4°
a- 35
30
251985
MEProgram
Completed
ProgramNot Completed
1986 1987 1988
Year
1989 1990
Figure 21. Employment Rate for Completers and Non-Completers of a Program of Study
For all years, the employment rate for completers is greater than the rate for
non-completers. While both groups appear to have been affected by the recession
that began in 1989, the non-completers appear to have k -.1n more severely affected.
76
-u
Grades and Future Earnings
Figure 22 examines average earnings levels of former students over time by
cumulative grade point average (GPA).
7,000
6,000a)
E 5,000
.t 4,000
0O 3,000
alg 2,000
1,000
GPA Group+0.01.00+2.014.00*3.014.00
02 3 4 1 2 3 4 1 2 3 4 1 2 3 4 1 2 3 4 1 2
85 1 86 1 87 1 88 1 89 1 90
Quarter: Year
Figure 22. Average Quarterly Earnings by Grade Point Averageat Program Exit
As Figure 22 shows, earnings increased steadily over a five-year period for all
former students whose GPAs were known at the time of program exit. Substantital
differences in average earnings between thosewith the lowest cumulative grade point
averages and those with the highest cumulative grade point average were found.
Thus, a substantial premium Is being paid for college performance and this pattern
is consistent over time. This type of information might be valuable to a prospective
student Investigating the benefits of time and effort in academic pursuits.
77
Fringe Benefits
The longitudinal approach is ideally suited for the more refined analysis that
is necessary to discover reliable predictors of earnings differences. However, state
UI wage records document only money earnings, and in some cases the money
equivalent of a few types of in-kind payment. Fringe benefits, which now commonly
exceed 30 percent of total compensation, are not included. As contract and
temporary employment become more common, the unevenness of this aspect of
compensation differences can be expected to grow. This means that measurement
challenges will increase as well.
Using Data in Decision Making
This chapter has focused on consumer interests in relating employment and
earnings information to what is known at particular points along a student's
participation in postsecondary education--at the time of enrollment, while enrolled, and
at the time of departure (Figures 15-22). The types of student, counselor, or
administrator decisions that are made at each of these stages are quite different. For
example:
Students may decide to complete their programs of study, since thoseformer students who did so had higher rates of employment.
Since former students who had higher GPAs at program exit earnhigher salaries, prospective students might decide that studying andmaking higher grades may "pay off' in the long term.
Counselors who have reviewed these data may decide to offercounseling sessions to students with low GPAs to determine whatfactors might be affecting their academic work.
78
Administrators may view the relationship between earnings and GPAas an indicator of a need for increased services, such as tutoring orremedial classes, to help students improve their chances of higherempioyment and earnings levels in the labor market.
The remaining sections of this chapter present data collected during the
demonstration project illustrating other strengths of longitudinal data from existing
wage records--the ability to relate information about student characteristics,
institutional and program factors, and local economic conditions to students'
employment and earnings.
Outcomes and Institutions
Figure 23 compares employment rates over a five-year period for former
students at three community colleges in one of the demonstration project states.
These former students were all enrolled in Data Processing Technology programs.
Figure 23 reveals significant outcome differences among institutions within a
state. However, care must be taken not to draw conclusions too quickly from such
evidence. The differences in employment rates might be explained by influences such
as local economic conditions. Data such as those shown in Figure 23 should be
used as a starting point for investigating accountability, not as a conclusion of such
investigations.
79
100
80
- - - - +
60 ------. ..... ......
40
20Institution
A -1-13 C
01985 1986 1987 1988 1989 1990
Year
Figure 23. Employment Rate by Selected Institutions for DataProcessing Technologies
The findings for these three community colleges in one state include:
The employment rate of former students of Institution A is considerablyhigher than the employment rate of former students of Institutions Band C throughout the time period analyzed, 1985-1990.
The employment rate of former students from Institution A increasedfrom 1985 to 1986. However, it then dropped and leveled off until1989, when it began a steep decline, dropping almost 20 percentagepoints by 1990.
The employment rate of former students from Institution B was over 80percent until 1990, when it dropped slightly below 80 percent.
The employment rate of Institution C's former students never reached60 percent during the five years examined, and by 1990 had fallendramatically to about 40 percent.
80
10i
The evidence of Figure 23 indicates that former students of Institutions A and C were
far more significantly affected by the economic downturn of 1989 and 1990 than were
former students of Institution B. Thus, such factors as course content, competence
of the instructors, and grades of the former students may have had little to do, in this
particular case, with the decrease in employment rates in 1989 and 1990.
Outcomes and Occupations
Figure 24 compares employment rates over a five-year period for former
students in three different specializations within the Data Processing Technologies
curriculum at a single community college.
100
80
60
40
20
0
Data Processing Specialization
Genteel Computer DP Equipmentt)P *- Programmer a
latent
1985 1986 1987 1988
Year
1989 1990
Figure 24. Employment Rates by Selected Data ProcessingSpecializations for One Institution
81
Figure 24 demonstrates how ei ,floyment outcomes may differ among
specializations within a single curriculum at an institution. For example:
Although former students from the General Data Processingspecialization enjoyed an increase in employment rate from 68.8percent in 1985 to 78.1 percent in 1986, the rate began to decreasethereafter, culminating in a steep drop of 22 percentage pointsbetween 1989 and 1990.
For former students in the Computer Programmer specialization, theemployment rate was 54.4 percent in 1985 and 45.1 percent in 1990.
The highest employment rate for former students in the DataProcessing Equipment Maintenance group was 60 percent in 1989.But by 1990, this rate had fallen to 45 percent.
Technical Consideration
The discussion of Figures 23 and 24 reinforces a point made earlier--the
choice of unit(s) of analysis predetermines the types of findings that can arise.
For management decisions at the curriculum level, presentation at the aggregate
program level will be less useful. However, practitioners and policymakers must
remember that the approach used here requires strict protection of the anonymity
of all former students and their employers. The smaller the unit of analysis such
as a particular semestn's degree recipients in a single school's curriculum
specialization the more likely it is that censoring of some types of data
presentations may be necessary.
82
10
Earning Gains of Former Students
Figures 25 and 26 provide a context for further consideration of two issues
presented In the previous section: (1) the careful interpretation of the data, and (2)
the unit(s) of analysis chosen.
Figure 25 shows the five-year earnings paths for the former students Included
in Figure 24 in the previous section. These were students in three different Data
Processing Technologies specializations within one community college.
7,000
so 6,000
.1.- 5,000
Ir. 4,000
a02 '3 000=
Es 2,000
1,000Data Processing Specialization
General Data Computer DP EquipmentProcess. 1 Programmer Ma Int.
02 3 4 1 2 3 4 1 2 3 4 1 2 3 4 1 2 3 4 1 2
85 I 86 87 1 88 I 89 I90Quarter: Year
Figure 25. Average Quarterly Earnings for Data ProcessingTechnologies
83
1_ r'
In Figure 25, the earnings paths of the three groups converged toward the end
of 1989 and the beginning of 1990. When this pattern is considered in the context
of the documented employment paths shown in Figure 24, it appears that any
difference in outcomes occurred in labor force participation rates, rather than in the
earnings of those who were working.
Prospective students may want occupational information, so they can
determine whether there are differences in relevant employment opportunities for
those who pursue particular curriculum specializations. As noted previously,
occupational detail is not available in the existing administrative data bases used, but
the program of study is available in student records and can be used for
presentations of related data.
Differences Between Day and Night Students
Figure 26 traces the difference in the earnings paths between former day and
evening students in the Office Specialist Program at one community college. For
every quarter, the earnings of evening students are considerably higher than the
earnings of daytime students. The difference in earnings paths is unlikely to be
attributable to whether the sun was up or down! Student differences may be one
reason for the earnings differences. However, differences in the faculties of daytime
and evening courses may also be the reason.
84
3,500
3,000
E 2,500is
2,000
Oa 1,500
Et 1,000
500
02 3 4 1 2 3 4 1 2 3 4 1 2 3 4 1 2 3 4 1 2
85 1 86 1 87 1 88 1 89 1 90
Quarter Year
Figure 26. Average Quarterly Earnings by Time of Attendance(Daytime/Evening) for Office Specialist Program
For example, there might be greater use of adjunct faculty members for
evening courses, which could translate into improved placement opportunities for
students. Also, evening students are often considered by faculty as being more
serious about an education because they come to class after working all day. Thus,
different expectations of the two groups of students may come into play in this
situation.
85
1 ft
Reporting Differences
Three conclusions arise from the proceeding discussions on outcome
measures related to institutions and programs:
1. Differences in reporting practices between public and privatepostsecondary institutions, and among states, make it difficult toconduct straightforward comparisons among these different reportingentities. This suggests that a common core of data elements shouldbe proposed, which would permit more routine tabulations ofinformation for "consumer rights' purposes.
2. The repeated cautionary statements should remind policymakers andpractitioners that proper interpretation of long-term data may not beeasy, particularly if funding and program continuity are affected.
3. Training and education for institutional managers and consumers willbe necessary to assure the proper use of the information that willbecome available through existing data sources.
Student Characteristics and Outcomes
One of the most consistently heard concerns from school administrators on
performance measurement is that no account is taken of differences in student
demographics across schools and even among programs within institutions. This
section indicates why these concerns should be heeded.
Gender
Figures 26 and 27 display the differences in employment and earnings
outcomes for former male and female students from 1985 through 1990. Figure 26
shows only small differences in the employment rates of former male and female
students.
86
1 r1
75
701,Saa.
w 65
0re"
60
551985 1986
GenderFemale M
1987
Year
1988 1989
Figure 27. Employment Rate by Gender
Earnings differences between male and female students were much more
dramatic. The earnings of women started at a much lower level and remained so
through the five-year period shown in Figure 27. Thus, programs with higher numbers
of female students may demonstrate lower earnings outcomes than programs with
large percentages of male students.
One factor that may be influencing these differences in earning power is full-
or part-time employment status. State UI wage data records reflect both full- and part-
time employment earnings without distinction. Generally, in labor force data, women
are found to work part-time more often than men; however, this could not be
substantiated with the demonstration project data.
87
7,000
$ 6,000
5,000
.474,000
0 3,000
if 2,000
1,000
02 3 4 1 2 3 4 1 2 3 4 1 2 3 4 1 2 3 4 1 2
85 1 86 I 87 1 88 1 89 (s0Quarter: Year
Figure 28. Average Quarterly Earnings by Gender
Interpretive Caution
Recall, in interpreting these figures, that both full- and part-time
employment is reflected. One method of eliminating this ambiguity is to establish
the equivalent of full-time full-quarter employment at the minimum wage as a
threshold for inclusion in a presentation of this type. In the general workforce,
woman have a higher level of part-time employment than men. This fact may be
influencing the earnings paths shown in Figure 28, but existing wage data
sources cannot tell us whether employees are working full- or part-time.
Race/Ethnicity
Figures 29 and 30 track employment rates and average earnings growth for
former black and white students. Figure 29 shows that black students had lower
documented employment rates than their white peers throughout the five-ear period.
For instance, in 1985, two-thirds of the black students were employed, while three-
fourths of the white students held jobs. Both groups were affected by the economic
downturn in 1989, but the black students' employment rate fell further during this
period than the employment rate of the white students.
100Race
Black ig while90
80
70
60
50
40 \\1985 1986 1987 1988 1989 1990
Year
Figure 29. Employment Rate by Racial Group
The Information, conveyed in Figure 29, raises three management-related
questions about race and employment. These questions are:
(1) Is the difference between white and black students due to racialdiscrimination in the workplace?
89
(2) Is the difference due to where the former students went to college orwhat courses they took?
(3) Or, Is the difference due to previous work history and educationalexposure prior to entering postsecondary education?
6,000
& 5,000
ifig 4,000
3,000
0812,000E.3
1,000
02 3 4 1 2 3 4 1 2 3 4 1 2 3 4 1 2 3 4 1 2
85 I 86 1 87 1 88 1 89 190
vkk \\\
\Ns \
Quarter: Year
Figure 30. Average Quarterly Earnings by Racial Group
Figure 30 uses demonstration project data to document what has been shown
many times in other settings. The earnings of the black students failed to match the
earnings level of their white peers at any time from 1985 to the second quarter of
1990. The differences between the earnings of the two groups also increased over
the period examined. The questions asked in the previous paragraph apply to
earnings as well.
90
1 i
Finally, concluding the discussion of demographic factors, Figures 31 and 32
display age-related differences in documented employment and earnings of former
students.
Age
Figure 31 shows that older students (aged 35 plus) had lower employment
rates than their younger classmates. This fact suggests that both prior and
concurrent employment information may help in addressing some related policy and
management questions. For example:
Did older students have lower employment rates because they weremore likely to have been terminated from a prior job?
Were these older students women who had been out of the labor forceraising a family so that they had had little recent work experience orpractice in job seeking?
Were these older students mostly retirees who had decided to obtaintraining for a second career?
91
100Age Group
< 25 + 25-34 35 pita
90
80
70
-----........ *. .....60
501986 1987 1988 1989 19901985
Year
Figure 31. Employment Rate by Age at Time of Enrollment
These questions cannot be answered through existing wage data alone.
However, sources such as counselors or instructors familar with students'
backgrounds or surveys at the time students apply could provide supplemental
information that might help clarify the factors affecting the relationship between age
and employment rate. Institutional managers may need to ask questions about
whether older students are receiving the help they need to find employment, or if age
discrimination is a factor in the local labor market?
92
8,000
O
E 6,000
r 4,000as
0
o 2,000
02 3 4 1 2 3 4 1 2 3 4 1 2 3 4 1 2 3 4 1 2
85 / 86 87 1 88 f 89 1 90
31(
is( is; .1E
. 34( .3K .
4E
. -4--+
Age Group25 +25-34 )$E 36 plus
Quarter. Year
Figure 32. Average Quarterly Earnings by Age at Time ofEnrollment
Figure 32 shows that older students had higher average earnings than their
younger classmates. At no time during these five years did the earnings paths cross
or diverge. Thus, those older former students who were employed receive higher
earnings than younger students.
Together, Figures 27 through 32 emphasize the importance of recognizing and
taking into account demographic differences in student constituencies when
employment and earnings outcome measures are used for management and policy
purposes. Policymakers and managers are encouraged to remember that
combinations of these data elements must be considered in order to discover the
reliable patterns Influencing the employment and earnings of former students.
93
1 3
Outcomes and the Local Economy
Another concern often heard from school administrators is how unfair it is to
blame the education community for the difficulties of the broader community when
economic conditions weaken. The final illustrations of employment and earnings
outcomes in this chapter address this concern.
Local Economic Factors
Figures 33 through 36 illustrate the influences of local economic conditions on
employment and earnings outcomes. The basic format for each set of these
presentations is the same. Figures 33 and 34 present data for former Business and
Commerce Technology majors at several community colleges in one of the
demonstration project states.
Figure 33. Employment Rates of 1984 Community CollegeBusiness and Commercial Technology Enrollees bythe Growth Level of the County in Which theCollege is Located
Figure 33 shows that low-growth counties consistently have less employment
than high-growth counties. It also shows a downward pattern in the employment rate
of former students beginning in the final quarters of 1989.
95
115
1 1
1 1 1
-'/,:,4,,;'
1 1 1;
, ,, % , ; , , '' //// /f14/,'";'' V V , ',".- .., ' '
changes in building permit issuance--and the highest and lowest quartiles (i.e., leaving
out the middle half of the distribution) were compared.
Figures 35 and 36 present data about former students in the same community
colleges who were Health Services and Paramedical Technologies majors. The intent
of these sets of figures is to relate documented employment rates and earnings paths
over time to changes in local economic conditions.
100
80
60
40
20
03 4 1 2 3 4 1 2 3 4 1
86 87 88
CountiesUpper Quartile
Lower Quartile
Quarter/Year
2 3 4 1 2
89 90
Figure 35. Employment of 1984 Community College HealthServices and Paramedical Technology Enrollees byGrowth Level of the County in Which the CommunityCollege Is Located
Figure 35 again shows that the weakening of the economy in 1989 and 1990
affected the employment rates of former students in health care occupations in both
the high and low growth counties. However, Figure 36 shows that the average
97
earnings of those who were employed increased substantially throughout the time
period.
6,000
to 5,000CCel 4,000
3,000
a& 2,000f!
1,000
--f-
CountiesLower Quartile
+Upper Quartile0
3 4 1 2 3 4 1 2 3 4 1 2 3 4 1 286 I 87 I 88 I 89 I 90
Quarter/Year
Figure 36. Earnings of 1984 Community College HealthServices and Paramedical Technology Enrollees byGrowth Level of the County in Which the CommunityCollege Is Located
More refined adjustments for economic conditions, and a broader range of
such conditions, will be included in research that is already underway for the National
Assessment (I Vocational Education.
Summary
The figures that have been presented in Chapter Five combine a wide range
of data elements obtained from individual schools, state higher education coordination
98
113
authorities, State Employment Security Agencies, the U.S. Office of Personnel
Management, and the U.S. Department of Defense. Particular data elements have
been chosen for display based on their relevance in satisfying frequently encountered
consumer requests for information. In this process, other high priority needs of
individual readers have undoubtedly been overlooked. There is a growing need for
a continuing dialogue about the capabilities of the longitudinal approach and the
information needs of consumers.
The next section offers a list of the lessons learned during the demonstration
project.
99
11D
Lessons Learned
The demonstration project taught these important lessons about the data
elements contained in institutional records, external factors, and diagnostic tools:
1. Data Elements
There is Me uniformity in the data elements that schoolsmaintain about their students and the occupational preparatoryprograms in which they participate. This limits the extent towhich appropriate statistical techniques can be used toproduce reliable estimates of the relationships between thesedata elements and postprogram outcomes.
These differences can be reduced by encouraging voluntarycooperation in moving toward a core of uniform data elementsthat will permit more useful estimates to be produced .29
2. External Factors
Each SESA collects useful indicators of local economicconditions and changes in these conditions, which it uses forits own reporting purposes.
A SESA should be seen as an important partner in the designand day-to-day management of a performance measurementprogram. The nature of this partnership will depend upon statestatutes, regulations, and often, the ability of the staffs ofdifferent agencies to communicate with each other.
The expertise and resources of the SESA should be used ifthey are offered, but substantial responsibility by the researcherwill probably be necessary.
3. Diagnostic Tools
Treat statistical resits as 'Working estimates' at all times.Remain flexible in working with all parties involved toincorporate their ideas when it is feasible to do so.
Use statistical estimates as a diagnostic tool, but do no relyupon them as a stand-alone justification for action.
100
1 2 J
VI.
WHICH IS BETTER?POINT-IN-11ME OUTCOMES VERSUS THE LONGITUDINAL PERSPECTIVE
Chapter Six discusses the strengths and weaknesses of documenting
employment at a certain point in time and the king -term approach to employment
outcomes. The ultimate choice will be driven by such considerations as timeliness
of reporting, availability of occupational detail, coverage of outcomes other than in-
state employment, and interest in the status of former students who are not found by
using a particular approach.
Figures 37 through 43 illustrate why multiple sources of administrative records
will often be desirable to satisfy particular "consumer rights" information needs. These
figures represent actual data collected during the two-state demonstration project.
Seven figures based on these data are presented In this chapter. These figures are
intended to stimulate the curiosity of policymakers and practitioners about the
availability, and substantive strengths and weaknesses, of the various data sources.
Discussion of each data source is provided in Chapter Seven of this report.
Point-in-Time Employment
Traditional methods of collecting employment information about former
students--including face-to-face exit or follow-up interviews, and mail or telephone
surveys--often provide only a "snapshot" of this important postprogram outcome.
101
Figure 37 shows the employment rate for the former students in a specific
occupational curriculum of community colleges in the two-state demonstration project.
Four administrative record sources were used.
100
a2C
CC t 6011.
EoTx la 40Ew EU
20
NMWage
RecordFed. UM, Adj.CMIIan State
Ff/y
Military
State A State B
Figure 37. Cumulative Percentage of Employment by Source ofData for Two States
Figure 37 portrays the following information:
Using state UI wage data, 62.4 percent of the former students in StateA were found to be working.
In State B's UI wage data base, 71.5 percent of the former studentsfrom participating institutions were found to have documentedemployment.
When other sources of data were collected for State Astate UI wagerecords from adjacent states, Office of Personnel Management forFederal civilian records, and military records from the DefenseDepartmentan additional 15.5 percent of former students were found
102
12,
to be employed. These additional records brought the documentedemployment rate up to 77.9 percent.
When additional data were included for State B, an additional3 percent of the former students were located in these data bases;bringing the employment rate up to 75 percent
No UI wage data was sought from the states adjacent to State B so itis not known how many of the former students might be travelingacross state lines to their employment site.
In Figure 37, the building blocks of each of the two state's employment rates
are only an approximation of a "snapshot" of the former students' employment status
at a particular point in time. This is mentioned for two reasons. First, the
demonstration project's budget and time limits prohibited a precise matching of time
coverage for each of the four administrative data sourcesstate UI wage records, UI
wage records from adjacent states, U.S. Office of Personnel Management records,
and U.S. Department of Defense personnel records. This lack of precision can be
reduced when a longitudinal approach is routinely employed. Second, the reason for
urging caution is that adjacent state information about former students' employment
status was only sought for one of the two demonstration project states. For both of
these reasons, Figure 37 should be viewed as an illustration of the importance of the
building-block approach, not as a precise measurement of what will be found in any
future replication of this approach in any one state.
Figure 37 reveals that three out of every four of each of the two state's former
students in a specific program in one community college were found two or more
years later by querying four available data sources. However, the relative importance
of each of the data sources that contribute to these similar totals is quite different.
103
123
More is said about postprogram data collection in the Appendix, which points
out that coverage decisions might differ depending upon whether the inforr,.ation will
affect funding decisions, or curriculum approval/continuation decisions. Steps Two
and Three in Chapter Seven should answer most questions about the timeliness,
availability, accuracy, and cost of each data source discussed in this chapter.
Data Source Mix by Type of Institution
Many states, and the Federal government, are actively considering ways to
improve the accountability of both public and private postsecondary providers of
occupational eaucation to prospective students. Figure 38 addresses this issue by
illustrating that employment outcomes for former students' can be documented for
both public and private postsecondary institutions. However, the data sources in
which former students' earnings show up may vary between the types of institutions
within any given state.
As can be seen from Figure 38, more students from community colleges were
found in the state UI wage records than were former students of proprietary schools.
Figure 38 displays data collected from participating proprietary schools and
community colleges in one state.
104
1
100
80
20
MIWageMI Record
Fed. im Adj.Civilian ME State
, Military(DOD)
Proprietary Schools Community Colleges
Figure 38. Cumulative Percentage of Employment by Source ofData by Type of Institution
Data Source Mix Across Institutions
Most consumers such as prospective students and their parents, and high
school counselors want to know what the employment track record of former students
has been for specific schools. Figure 39 illustrates how such requests for information
might be met using the administrative data sources. The differences in the
contribution of various data sources we revealed within the employment rates of
former students in one occupational program in participating community colleges in
one of the demonstration states.
105
1 9
100
80
60
40
20
0a b
Institution
d
Source of DataState UI Wage Records Additional Sources
e
Figure 39. Cumulative Percentage of Employment by institution
Figure 39 breaks out the total rate of employment for one state's former
community college students from Figure 38 into college-specific sources of such
documentation. The following was learned about the data sources:
In one state, 60 percent of the former students who were found in thestate's own wage records five years after the students' initial enrollmenthad college-specific employment rates ranging from a low of45 percent to a high of 74 percent, a 29 percentage point range.
When all four administrative data sources are considered, this29 percentage point range is more than halved, to only 14 percentagepoints, with a spread from a low of 67 percent to a high of 81 percent
The former students from various institutions are found in differentproportions among the types of data sources.
106
12,3
This last finding is not surprising, but it serves as a very visible warning flag
that sole reliance on any one source of information must be treated with caution.
Summary
Two conclusions emerge from Figures 37, 38, and 39:
The overall similarity of employment rates between the two states,between public and private postsecondary institutions that offeroccupational education, and among public community colleges,suggests that wider use of these administrative data sources iswarranted.
The relative importance of each data source varies across differentunits of analysis such as states, institutions, and types at institutions.
The Longitudinal Perspective of Employment and Earnings
Figures 37, 38, and 39 focused on point-in-time or "snapshot" uses of the
administrative data sources, whicn address certain types of consumer questions
about former students' subsequent employment status. Figures 40 and 41 reflect a
longitudinal perspective, which is designed to answer different types of questions
about former students' employment and earnings.
Relationship of Certificate Completion to Employment and Earnings
Figure 40 traces employment rates over five years for two groups of former
students from one postsecondary institution--those who received a certificate and
those who were not awarled a certificate. A total of 322 former students enrolled at
different times between January 1986 and May 1987. Their program of study lasted
approximately seven months. Over three-fourths of the enrollees satisfactorily
107
1 9 -1
completed their program. Accurate records on the completion of a certificate or
degree are essential for the conduct of this type of analysis.
The data show that those students who received a certificate had an
employment rate higher than those students who did not receive a certificate for four
out of the five years examined.
100
___.x.-
80___ _
3K ,--A,
......... ...
.....
70.....X
501985
Certificate*No Certificate
1986 1987 1988 1989 1990
Year
Figure 40. Employment Rate for Students of One Institution byWhether or Not They Received a Certificate
Earnings and Degrees
Figure 41 traces quarterly earnings levels for those former students who
appear in one participating state's UI wage records. There is no distinction between
Figure 41. Average Quarierly Earnings for Students of OneInstitution by Whether or Not They Received aCertificate
In 1986, the average quarterly earnings of those students who had been
awarded a certificate were slightly higher than their counterparts who had not received
a certificate. The difference in earnings widened over time.
Relationship of Placement Status to Employment and Earnings
Figures 42 and 43 complete this comparison of data collected in the two-state
demonstration project. Particularly at the secondary school level, vocational
educators have a long-standing commitment to using placement information as a
measure of postprogram accountability.
109
1
Figures 42 and 43 use a measure of placement that was included in one
demonstration project school's records. They offer one more reason why a
longitudinal perspective based on administrative records might be desirable-both
documented employment rates and average earnings levels over time differ between
those who had been reported as placed and those reported as not placed in the
school's records. In this particular case, the "placement" data element only indicates
that the school knew that a job had been found; not that the schools own placement
efforts had discovered the employment opportunity.
Figure 42 reveals that those who are recorded as `placed° in the school's files
have a higher level of documented employment over the next five years, when
compared to those who are not reported as placed in the school's records. In Figure
42, the 1985 pre-program completion "snapshot" reveals an identical documented
employment level of 64 percent for both the placed and not placed groups of former
students. But, if the population of those who were reported as placed then becomes
the basis for subsequent follow-up efforts initiated by a school, a distorted
understanding of longer-term employment will emerge. The longitudinal approach
is not affected by this source of bias.
110
133
100
0go
70
C
1985
Placed s Na Placed
1986 1987 1988
Year
1989 1990
Figure 42. Employment Rate for Students of One Institution byWhether or Not They Were Placed in a Job
Figure 43 makes the same point, but this time from a longitudinal earnings
perspective. Again, the initial pre-program completion period's "snapshot" of average
quarterly earnings does not reveal much difference between the placed and not
placed groups. But over time, the average earnings of the two groups diverge.
111
13_
II I
11 a
I
'5 5,
.555 5 5,\
: .
t
. . .
t -
: t
: :
. :
: :
:
:
It II
0:
S
: ! I
0 : :
: " :I..
: : : Z
: :
.
If - I :
0, A 1111: . : f '
t : is . I.:
$ 1 : 111,2 : : : :
I 1 0 : : 1,0
I JIj
.: Ii I : : IPS . :
:1
A Profile of the Strengths of the Longitudinal Approach
Figures 37 through 43, and the accompanying text, provide practitioners and
program analysts with an incentive to continue through Chapter Seven as required
background before initiating action in determining what method to use to document
employment outcomes for postsecondary vocational education students. No one
should endorse or reject the longitudinal approach to advancing the understanding
of former students' employment and earnings without an overview of the actual
content of the each administrative data source which is provided in the following
chapter.
In summary, the strengths of the longitudinal approach include:
The longitudinal approach, which combines school-based informationabout former students with subsequent employment and earningsinformation about the same group, allows for in-depth inquiries basedon preliminary results.
The longitudinal approach is ideally suited for multivariate analysis thatis necessary to discover reliable predictors of employment andearnings differences.
Longitudinal data can be used to measure the susceptibility of formerstudents to fluctuations in employment opportunities in the localeconomy.
Longitudinal data provide a true "accounting" of former studentsincluding students recorded as placed and nonplaced in schoolrecords.
113
1 3 t:
VII.
FIVE STEPS FOR STATE IMPLEMENTATION
Introduction
Chapter Seven provides five steps for state implementation for linking student
information with existing wage data bases. Through interagency agreements, a
cooperative effort can be forged for determining employment and earnings outcomes
for former postsecondary vocational education students. This description of a step-
by-step process will be helpful to practitioners, program analysts, and educators who
have had little experience in working with certain key agencies and in using existing
wage data records.
This study examined a way to reduce the cost of data collection by using
existing state and Federal administrative data sources, while improving the ability to
monitor employment and earnings ir:ormation over time. Chapter Seven shows how
to reduce costs and improve the quality of the outcomes information by using these
existing sources of data. Additionally, this approach will relieve teachers and
administrators within the vocational education system of the burden of collecting
follow-up information.
Chapter Seven also details what was learned during the demonstration project
about the use and limitations of existing administrative data sources. Here, the term
"administrative data" covers any employment and earnings information that is already
collected for a purpose other than for follow-up purposes for former students. Four
114
1 3
existing data bases warrant serious attention as sources of employment and earnings
information:
1. State Employment Security Agency Unemployment Insurance (UI)wage records;
2. U.S. Office of Personnel Management Federal civilian employeerecords;
3. U.S. Department of Defense military enlistment records; and
4. U.S. Postal Service employee records.
Two other possible administrative sources of employment and earnings data
the Social Security Administration and the Internal Revenue Service--are also
addressed in Chapter Seven.
Chapter Seven offers useful tips and techniques for collecting, processing, and
analyzing existing wage data. Other approaches such as telephone and mail surveys
of former students can be used to collect other types of postprogram information that
will supplement state UI wage and other data sources. For example, Florida's
Education and Training Placement Information Program combines employment and
earnings Information obtained from Florida's Department of Labor and Employment
Security with occupational details collacted through a survey instrument that is mailed
directly to selected employers of former students. Program staff can then follow up
with a telephone contact when necessary.3°
Some interesting Information not found in existing administrative files include:
occupational details such as years of experience;
position classification;
non-wage benefit coverage;
promotion patterns;
115
employer opinions about the specific strengths and weaknesses ofnew hires; and
former students' opinions about their educational experience.
Decisions about the importance of these other postprogram outcomes should
not affect inquiries about the feasibility of obtaining reliable employment and earnings
information from existing data sources.
Chapter Seven also provides a conceptual framework to show all the different
pieces of the puzzle that pollcymakers, educators, and practitioners in a state must
be aware of as state implementation for record linkage progresses. Table 4 displays
this framework.
116
13-0
Fed
eral
Sla
te, a
nd L
ocal
LA
WS,
Reg
ulat
ions
, and
Pot
icie
s
Fed
eral
Car
l D. P
erki
ns V
ocat
iona
l and
App
lied
Ted
-oto
logy
Act
of 1
993
Stu
dent
Rig
ht-t
o-K
now
and
Cam
pus
Sec
urity
Act
of 1
990
Hig
her
Edu
catio
n A
ct o
f 196
5
TA
BLE
4C
once
ptua
l Fra
mew
ork
for
Sta
te Im
plem
enta
tion
Sta
b Sta
b S
tatu
tes
Adm
inis
trat
ive
Reg
ulat
ions
and
Pro
cedu
res
Sta
b Li
cens
ors
Reg
ulat
ions
Inst
itutio
nal P
olic
ies
Adr
rinis
tart
ivei
Pro
cedu
res
Con
fiden
tialit
y A
ssur
ance
s an
d
Tra
ditio
ns
Des
ign
Fac
tory
Gov
erna
nce
and
Org
aniz
atio
n, A
dmin
istr
atio
n, a
nd U
ser
Nee
ds
rove
man
ce a
nd O
rgan
izat
ion
Sta
b O
vers
ight
Age
ncie
s
Typ
es o
f Sch
ools
(C
omm
unity
Col
lege
s,P
ubic
Voc
atio
n/T
echi
cal S
choo
ls a
nd
Pro
prie
tary
Inst
itutio
ns)
Lice
nsin
g B
oard
s
Fun
ding
Adm
inis
trat
ion
Sta
ndar
dize
d D
efin
ition
sD
ata
Sou
rces
Sta
ndar
dize
d C
ompu
tatio
n P
roce
dure
sP
roce
dure
s on
Typ
es o
f Inf
orm
atio
nC
olle
cted
Sur
vey
Pro
cedu
res
Sta
lf an
d F
acili
ties
Mon
itorin
g an
d A
sses
smen
t Pro
cess
es
Use
r N
eeds
Sta
te le
vel P
oky
and
Pla
nniig
Dev
elop
men
t
Mea
sure
men
t of P
erfo
rman
ce O
utco
mes
Con
sum
er R
ight
s In
form
atio
n
Inst
itutio
nal M
anag
emen
t and
Pla
nnin
g
Fiv
e K
ey S
teps
1. P
lan
and
Det
erm
ine
Dat
a P
riorit
ies
2. Id
entif
y F
eder
al a
nd S
tart
s A
dmin
istr
ativ
eD
ata
Sou
rces
3. R
evie
w D
ata
Col
lect
ion
Issu
es
4. D
evel
op D
ata
Pro
cess
ing
Pro
cedu
res
5. C
ondu
ct D
ata
Ana
lysi
s
4
.1 3
Conceptual Framework for State Implementation
A conceptual framework helps practitioners, program analysts, and
policymakers to see the many factors that impact on implementation of record
linkage. These include:
Federal, state, and local laws, regulations and policies;
Governance, organizational, and administrative factors; and
User needs such as "consumer rights" information, measurement ofperformance outcomes, policy planning and development, andinstitutional planning and management.
Federal, State, and Local Laws and Regulations
Chapter Two discussed several key Federal laws that brought about the
interest in record linkage. These were: the Carl D. Perkins Vocational and Applied
Technology Education Act of 1990, the reauthorization of the Higher Education Act
of 1965, and the Deficit Reduction Act of 1984. These laws brought to the forefront
the need for various kinds of information on vocational education to measure program
performance and to provide prospective students with answers to questions on the
potential benefits of different occupational training programs. The Deficit Reduction
Act initiated the use of state UI wage data to verify income and eligibility for selected
Federal benefit programs.
State legislation also may require the assessment of the performance of
vocational programs delivered by publicly funded educational institutions. For
exr.mple, the Florida legislature enacted the Vocational Placement Standard Law in
1984, which required that funding of all public vocational education be performance
based.31 A specified placement rate must be achieved by programs in order to
118
1 3 Li
retain state funding. In general, the statute requires all public schools providing
vocational programs to report annually to the state on enrollments, completions, and
training-related placements. Continued availability of employer wage reports for
assessing the performance of vocational programs is a requirement of this Act. It
also provides specific rules regarding confidentiality of records. Florida's Education
and Training Placement Information Program uses state UI wage data along with
information provided by institutions to determine the performance of all publicly
funded vocational programs in the state.
A review of the trends in state policy found that the pace of change is
quickening, especially for policies on the collection of performance data on education
programs. So, it is essential that state statutes and regulations be reviewed for their
applicability to record linkage. Also, knowledge of local institutional traditions and
procedures to protect student confidentiality is helpful.
Governance and Organization
From a state survey conducted by Research and Evaluation Associates in
1990, it was found that there is no typical state agency with responsibility for
vocational education.32 Governance of secondary and postsecondary vocational
education is commonly divided among a variety of state agencies. Within the
postsecondary sector, there may be different agencies responsible for programs
offered through vocational-technical institutes and community colleges. Almost
always, proprietary schools are overseen through separate state entities, and
frequently, by multiple licensing boards corresponding to different occupational areas.
119
14 .)
Governance comes into play in record linkage because the involvement of
numerous agencies limits the ability of states to develop comprehensive policies that
apply equally to all institutions, public and private, offering postsecondary vocational
training. Only eight states administer all three components of postsecondary
vocational education (e.g., community colleges, vocational/technical institutes, and
proprietary schools) through a single state agency.33 Moreover, to the extent that
state policies exist, the most ambitious efforts in data collection have been undertaken
in the public sector.
In conclusion, the number of state agencies and local organizations involved
in providing vocational education will affect state-level implementation of record
liokage.
Administration
The state survey, conducted before the demonstration project began, identified
several issues concerning the lack of standardized definitions in data collection on
education program outcomes.34 Most states collect some information about
program outcomes, with the most frequently collected outcome measure being the
number of students who complete a training program. Whether program completers
are placed in jobs is collected by 33 states for public schools and 21 states for
proprietary schools. Most states have developed a standardized definition for a
program completer. The most common definition used is:
An individual who completes all program requirements and is awardeda degree, diploma, or certificate.
However, in many states, information is only collected on recipients of associate
degrees from public institutions.
120
IL
Even fewer states have standardized definitions for measuring job placement,
and all of these states limit data collection on placement to program completers. The
computation of a completion or placement rate requires at least two components:
1. A definition of a completer or a job placement;
2. Agreement on the base to which the number of completers orplacements is to be compared.
The survey responses showed that establishing a base number for completion
and placement rates and obtaining appropriate data appear to be areas in which
states are experiencing difficulty. Presently, only about half of the states compute
placement rates. The primary difficulty is in determining which categories of
unemployed persons to exclude from the calculation (e.g., those not seeking
employment, or who do not use the school's placement service). Another area of
concern is how to get information on the number of former students who are self-
employed or have started their own small businesses.
During the past two years, state policies on outcome measurement have
rapidly changed regarding assessment of student outcomes. In implementing a state-
wide accountability system on postprogram outcomes, it becomes important to have
established standardized definitions for key performance indicators so that information
being given to consumers and oversight agencies is consistent, especially if these
measures are used in making funding decisions.
User Needs
Chapter Three discussed some of the information needs of prospective
students, policymakers, and institutional managers about the employment and
earnings outcomes for former students. While the needs of these groups may be
121
1
slightly different in each state, a review of Chapter Three will be useful before reading
the information provided in each of the sections on the five steps. Also, refer to the
Appendix for a discussion of outcome measures versus performance standards.
Overview of the Five Steps
Chapter Seven includes the following five steps for state implementation:
Step 1. Plan and Determine Data Priorities;
Step 2. Identify State and Federal Administrative Data Sources;
Step 3. Make Data Collection Decisions;
Step 4. Develop Data Processing Procedures; and
Step 5. Conduct Data Analysis.
Each step discusses information on the topic, gives strategies for
accomplishing key tasks, and provides tips on pitfalls to avoid. Whether a state is
"starting from scratch," or refining or modifying a current postprogram information
system, the following five steps offer help and guidance on:
the many nuances of the data sources;
possible solutions to problems that may arise; and
benefits to prospective students, policymakers, and educators of thiscost-effective method.
Step 1 on the planning process follows.
122
1. A
Step 1.
PLAN AND DETERMINE DATA PRIORMES
Step 1 discusses key factors that must be considered in planning for state
implementation of record linkage. Suggestions are given on how to start working with
the State Employment Security Agency (SESA) and on preparing an interagency
agreement for formally establishing a relationship with the SESA for record linkage.
Start With a Few Key Agencies
The two-state demonstration project undertaken involved the acquisition and
consolidation of 22 data sources. These were acquired from private career schools,
community colleges, a State Higher Education Coordinating Board, the U.S. Office of
Personnel Management, the U.S. Department of Defense, and five State Employment
Security Agencies. There were many differences in the data element content and in
school-based records as well as employment and earnings records. But, it is not
recommended to start off with such a large number of different data sources.
Florida's Education and Training Placement Information Program has
cautiously expanded the number of Federal, state and local data sources that they
handle. With the demonstration project and Florida, the project managers had many
years of experience learning about and working with the agencies that collect these
existing wage records, and about the peculiarities of each data source.
It is advisable for staff of those states "starting from scratch" to establish a
solid foundation of trust with a few key agencies before expanding to a more
123
1A
ambitious juggling of multiple interagency agreements and data sources. Trust with
each agency can build through responsible action and learning about the agency's
priorities and procedures. Some examples of how to start working with SESAs are
given below.
Before approaching a SESA, it is important to obtain and become familiar with
the current confidentiality provisions of the Federal and state statutes that the SESA
will use to reach a decision on a request for access to state UI wage records. This
familiarity will serve two quite different purposes:
It will demonstrate to the SESA the requester's seriousness of purposeand professionalism.
It will protect both parties from haggling over issues that could, andshould, have been dealt with before an initial request is evensubmitted.
One important fact that will emerge from a review of the SESA's statutory and
regulatory requirements is that any administrative records that are provided in
response to a request from an external party will remain the property of the SESA.
Specific requirements will be included in any agreement to transmit data that spell out
how the data are to be stored, and when and how the records are to be destroyed
or returned to the SESA (without retaining unauthorized copies). Another important
aspect of this retention of ownership is that any modification of intended use of the
data must be agreed to in writing ahead of time. According to the U.S. Department
of Labor's proposed regulations in the March 23, 1992 issue of the Federal Register,
a violation of this provision is cause for revok!ng an agreement and Immediately
relinquishing the data to the SESA.35
124
was conducted. Redisclosure by the organization receiving the Information is subject
to the same restrictions under FERPA as the original disclosure.
Review State Statutes Regarding Confidentiality and Data Security
First, determine whether a former student's social security number can be
legally used within the state to link school and state UI wage records. Legal counsel
should be involved at this early stage for two reasons:
It is important to accumulate a paper-trail of consistent legalinterpretations.
It will save time later in the process if there is an informed legal staffperson who understands the content and context of an interagencyagreement with the SESA.
There may be state laws or administrative regulations that prohibit the use of
a social security number as a personal identifier on administrative records, or that
restrict the use of such an identifier in performing record linkage. A state prohibition
against the use of a former student's social security number need not be a cause for
despair. There are practical approaches that may be available to handle such
potential barriers. For example, it might be permissible to establish a unique proxy
identifier that serves the immediate need without revealing the social security number
of the former student.38 This is usually known as a "dummy" code, which is retained
in a secure buffer file, so no unauthorized person can obtain the original social
security number.
Note that for "dummy" identifiers, a simple scrambling algorithm will not offer
the level of security that is required because the scrambling system might be
126
Learn and Respect Compliance Requirements
The consolidation process that will be described in the five steps in Chapter
Six only involves linking selected data elements from two or more data bases through
a common data element--in this case, a former student's social security number
and/or an employer identification number--with no'direct or indirect effect on a specific
individual's rights, benefits, or privileges.36 Under no circumstance should research
or program evaluation data requests be mixed with those that target specific
individuals for sanctions or other actions that would affect their personal rights,
benefits, or privileges.37
Moreover, an educational agency or institution's disclosure of a student's
social security number to obtain further information to evaluate and improve its
Instructional program would constitute disclosure of personally identifiable information
and would be subject to the requirements of the Family Educational Rights and
Privacy Act (FERPA) if the educational agency or institution were receiving funds
under a covered educational grant program such as the Carl D. Perkins Vocational
and Applied Technology Education Act. However, if the disclosure is made to an
organization conducting studies for, or on behalf of, the educational agency or
Institution, the educational agency or institution may disclose personally identifiable
information from an education record of a student without the otherwise required prior
consent. However, the agency or institution may only disclose information if the study
is conducted in a manner that does not permit personal identification of parents and
students by individuals other than representatives of the organization and the
information is destroyed when no longer needed for the purposes for which the study
125
deciphered. Also, note that the buffer file must be retained if there is a possibility that
a future update of the linked records may be requested.39
In the event that a current state law represents a true barrier to immediate
action, there is still an approach that might be worthwhile. A start might be to
circulate an issue paper among officials in the executive or legislative branches of
state government to determine if there is sufficient interest to pursue an executive or
legislative remedy.4° It is likely that there will not be an immediate active interest.
Instead, it may be necessary to inform key parties about successful related activities
in other states. The endnotes to this report should prove useful in undertaking this
task.
Support might also be promoted through carefully selected examples of how
the desired data can be used to save money and improve management effectiveness
without compromising confidentiality of former students nor organizational rights and
privileges.
Plan Interaaency Agreement with State Employment Security Aaencv (SESA1
If record linkage using a former student's social security number is a
permissible activity In the state, then an agreement will need to be negotiated with the
SESA. The agreement will need to incorporate the requirements that arise from what
is commonly known as the Buckley Amendments:" These provisions will stipulate
that the recipient of the individual student records (whether obtained on paper or
electronic media) understands the requirements of the Buckley Amendments
regarding the confidential nature of student records--including conditions, prohibitions,
and penalties associated with identity disclosure.42
127
1 e 3
It is recommended that the agreement follow the requirements In the U.S.
Department of Labor's proposed regulations. In particular, attention should be paid
to Section 603.14, which appears on page 10081 of the Federal Register issued on
March 23, 1992.
As suggested above, legal counsel should be involved at the beginning so
there are no surprises midway through the negotiation of an agreement. Each agency
can be expected to have "boiler plate" sections that serve as uniform templates for
many types of agreement. There also may be state- and agency-specific assurances
and certifications that must be included.
The following generic sections of a typical agreement are highlighted:
Introduction
An Introductory section identifies the agencies involved in theagreement.
it establishes that each agency has certain data that, when combined,promise to advance a specific purpose as in this case, to provideInformation that Improves consumer and management understandingof selected outcomes of vocational education programs.
Purpose and Justification
If there is a statutory basis for the proposed record linkage, then citeit in this section. This may be a state law that requires accountabilityfor vocational education, such as in Florida. If the effort relates to theaccountability requirements of the Carl D. Perkins Vocational andApplied Technology Education Act of 1990, then this Act should benamed.
Regardless of the statutory basis, this section of the agreement shouldelaborate on the overall purpose stated in the introductory section. Itshould indicate how the purpose will be met. For example: ". . .bygenerating aggregated statistics that will be used in describing theemployment experiences of students after participating in a vocationaleducation program."
128
It may be desirable to include statements that relate to the cost-effectiveness of collecting data by record linkage, rather than bytraditional means.
Implementation and Record Exchange
This section will include information that outlines how the recordlinkage will actually be initiated. For example, the agreement mightstate that the SESA will be contacted in advance to inform them aboutthe expected volume of student records and anticipated date of thesubmission.
An explicit statement should outline how the data are to beexchanged, such as by providing computer tapes or cartridges,or by accessing electronic files.
A statement should be included that indicates exactly what data will beprovided by the agency desiring the record linkage and what dataelements will be added by the SESA.
Security, Confidentiality, and Public Release
A section that acknowledges the applicable state and Federal lawsconcerning the confidentiality of student records, as well as restrictionson the use of the state UI wage records must be included. The U.S.Department of Labor's proposed regulations should be used forguidance in this regard.
Language should be included that stipulates that the SESA willnot duplicate any information from the student record file. Oneway to assure this is to only provide the SESA with each formerstudent's social security number.
A requirement should be included that when the job is complete,duplicate tapes or files will be disposed of or purged.
Security arrangements while the data are in the possession ofeach party should be spelled out.
If there are requirements that stipulate thresholds of aggregation for therelease of data resulting from individually identifiable data, then theseshould be included in this section.
129
15i
Additional Information
a Other sections will define the following terms:
* duration of the agreement;* whether and how it may be renewed;* conditions of termination;* sanctions; and* provision for the reimbursement of costs.
One of the reasons the U.S. Department of Labor has published proposed
regulations to control the release of confidential records is that a multiplicity of uses
is tempting once the data has been acquired. The data can be used to respond to
Increasing demands for consumer information that are one key focus of this report,
and/or the data can by drawn upon for performance measurement and program
accountability. Practitioners are urged to resist the temptation to seek multiple-
purpose access to state UI wage records. An unblemished record of responsible use
of these administrative data needs to be built. One intentional or unintentional act of
noncompliance with state and Federal rules may have irreversible consequences, and
even national repercussions.'"
Determine Priorities for Data Collection
tt is important for states to determine what the priorities are among the many
data elements that can be collected. As mentioned earlier, the essential data element
from school records is the social security number of the former student. This Is the
identifier that will link school records to state UI wage data and other administrative
data sources. If the social security number can be legally used in the state for record
linkage, then decisions about data collection and analysis are on the agenda.
Refer back to Chapter Three for some typical questions on which the various
user groupsconsumers, policymakers and institutional managers--may want to focus.
130
Prioritize the questions, but remember many of the same data elements can be
utilized to answer questions of interest to different groups. The types of analyses that
a state wishes to conduct will also determine data priorities.
For example, to relate employment and earnings outcomes to student
demographics, the following data elements are needed from institutional records:
sex, race/ethnicity, date of birth, and marital status, if available. Some other
interesting data elements include:
family financial status at enrollment;
single-parent status;
limited English language proficiency;
disability;
need for remedial services; and
veteran status.
All of these would contribute to a richer understanding of factors beyond mere
curriculum exposure that may influence postprogram outcomes.
To compare outcomes among programs within an institution or among
institutions within a state, the following data elements from institutional records are
useful:
prior education of student at admission;
date of school entry;
date of school exit;
program of study using Classification of Instructional Programs (CIPcode) when possible;
competency scores;
grade point average;
131
L. 5
completion status; and
type of degree earned such as certificate or associate degree.
The county of residence of former students is useful In relating workplace
experiences of formers students to local economic conditions such as unemployment
rates, growth patterns, etc. (Review Chapter Four for the core of data elements used
by the demonstration project.)
It is important to determine data priorities before requesting Information from
the administrative data sources discussed in the steps below. Also, decisions must
be made about which and how many quarters of data will be requested. Costs of
data collection and processing by these administrative sources will be a factor here.
If data are sought from adjacent states, the cost for this additional data collection and
processing will also need to be factored into the total cost.
Step 3 should be carefully studied to:
learn about recommended data elements for collection; and
determine the feasibility of obtaining some of the desired dataelements.
Remember it is easier and usually less costly to ask for what is needed up
front, rather than submit a second request that could have been completed at the
same time as the first one.
Summary
Planning is a key step in implementing the record linkage approach to determining
workplace outcomes for former vocational education students. Learn from what was
accomplished by the demonstration project described in this report and by ongoing
efforts in several states. State staff will benefit from considering the lessons learned
132
from these early efforts in linking school and state UI wage records before making
decisions on appropriate actions to take towards state implementation. A planning
checklist is provided for the reader's use on the following page.
133
15
Planning Checklist
Practitioners, program analysts, and other state staff can use the following list for
step-by-step planning of the state implementation of record linkage.
Obtain and become familiar with the current confidentiality provisionsof Federal and state statutes that the SESA will use to reach a decisionon the request for access to state UI wage records. Be sure tocarefully review the U.S. Department of Labor's proposed regulationsissued March 23, 1992 in the Federal Register on the release of wagedata records.
Learn about the compliance requirements of other administrative datasources.
Obtain legal counsel if needed to determine whether a former student'ssocial security number can be used to link records with state UI wageand other data sources.
If record linkage is a permissible activity in the state, then begin to planfor an interagency agreement with the SESA.
Research the following topics for inclusion into the interagencyagreement:
* how the data are to be exchanged;* what data elements are to be requested;* how data will be stored;* when data will be returned to the SESA;* what security arrangement will be followed when data are in
possession of either party;* conditions of termination of agreement; and* reimbursement of costs.
Determine data priorities and types of analyses to be conducted.
Review information in Step 3 on data elements and then determine thedata elements to be requested from institutional records.
Decide about which and how many quarters of data will be requestedfrom the various administrative data sources. (See the section entitledEffects of Data Collection Decisions on Outcomes in Chapter Ave.)
Determine whether external factors such as economic conditions willbe considered and from what sources this information will be sought.
134
Step 2.
IDENTIFY STATE AND FEDERAL ADMINISTRATIVE DATA SOURCES
Background
As has been discussed, there are many possible ways to record postprogram
employment and earnings measures. Step 2 presents detailed information about
existing state and Federal administrative data sources that may be available to state
agencies for follow up of former postsecondary vocational education students. Before
pursuing this approach, practitioners and policymakers need to be aware of basic
information about each data source, the strengths and weaknesses of each, and the
process for requesting access to the data. But first, some of the limitations of the
current methods of collecting follow-up data are noted, and some of the reasons to
link with administrative data sources are presented.
As mentioned earlier, teachers and school administrators are often asked to
determine the placement status and starting wage rate at the time of the student's
departure. Student alumni surveys are sometimes used, but these are often subject
to low response rates, inaccuracies in self-reported earnings, and higher response
rates by employed alumni, compared to those not working.
Some of the problems that arise from these current methods of collecting post-
program outcomes data include:
Nonresponse biases. A nonresponse bias occurs when informationobtained from those who are found and respond is not representativeof the information that would have been collected if all former studentshad been contacted. This bias is particularly serious when these dataare to be used for performance-based resource allocation purposes.
135
1L U
Measurement error. The measurement error problem arises whenrespondents are unable or unwilling to provide accurate information.
Low Response Rate. The lower the response rate the greater thelikelihood of measurement error and non-representativeness ofreported findings. Attempts to reduce the number of nonrespondentsmay significantly increase data collection costs.
Reduced anonymity. Follow-up strategies often reduce anonymity andrequire a more intensive effort on the part of staff.
Difficulty in locating. Former students who are not living in the localgeographical area are likely to be more difficult to find.
In the demonstration project, extant state and Federal administrative data
sources are examined as a way to reduce the cost of data collection, while realizing
an improved ability to monitor employment and earnings information over timea rare
opportunity to simultaneously reduce cost and improve quality of Information! As
mentioned previously, the term 'administrative data' covers any employment and
earnings information that is already collected for a purpose other than the intended
follow-up use.
Only extant data are required in this approach. Telephone, mall, or (n- person
contacts with former students to collect supplemental or other types of postprogram
information can be undertaken in addition to the use of existing administrative data,
if so desired.
Step 2 provides details about the following administrative data bases:
State Employment Security Agency Unemployment Insurance (UI)
wage records;
U.S. Office of Personnel Management;
U.S. Department of Defense Military Enlistment Information;
U.S. Postal Service;
Social Security Administration Information; and
Internal Revenue Service Information.
Information on each data base includes the type of wage information reported,
kinds of employees included, and the reporting schedule. These are important points
that practitioners must know before making decisions for state implementation.
State Employment Security Agency Unemployment Insurance WO Wage Records
Two reactions are often heard when the topic of UI wage records is
introduced. One reaction is that previous attempts to work with State Employment
Security Agency (SESA) personnel were unsuccessful and there isa lack of motivation
to try again. Two, UI wage record data are confidential and cannot be shared with
anyone.
Recent events should encourage those who have been turned away in the
past to try again. The Unemployment Insurance Service in the Employment and
Training Administration of the U.S. Department of Labor has been working with the
Interstate Conference of Employment Security Agencies, and with individual state
agency administrators and other interested parties, to grapple with the complex legal
and administrative problems that arise in responding to third-party requests for access
to confidential administrative records:*
The U.S. Department of Labor issued proposed regulations for comment in the
March 23, 1992 Federal Register. These proposed regulations should be studied
carefully before pursuing discussions with the SESA.
Many states have amended applicable statutes and administrative regulations
to permit more widespread access to these files, without compromising the
137
confidentiality provisions. For example, Florida and Oregon each passed laws
mandating the use of State UI wage records for documenting employment and
earnings outcomes. In its administrative documents, Ohio specifically refers to the
use of these data for the same purposes. These states, and others, have developed
interagency agreement documents, which codify and routinize the rules for handling
requests for information."
Having said this, practitioners should keep in mind that the state
unemployment compensation divisions of SESAs have been affected by the combined
pressures of high UI claim loads, introduction of extended benefit coverage, and
budget and personnel restrictions. Publication of the U.S. Department of Labor's
proposed regulations for the release of confidential agency records on March 23,
1992 have heightened the agencies' concerns about the linking of records. State staff
should keep these concerns in mind as they talk with UI staff and be sensitive to their
concerns.
Information Reported
For each %.-;overed employee, an employer is required to report: (1) the
employee's social security number and (2) the total amount of earnings during the
quarter.47 Employers also report their own unique employer identification number,"
geographic location,49 and industry affiliation.50
No information about specific occupations is available in the State UI wage
record reporting system.51 The Unemployment Insurance Service in the Employment
and Training Administration of the U.S. Department of Labor, and individual SESAs,
generally oppose this addition for two reasons:
138
I F.'
(1) It would be costly to both the reporting employers and to the SESAsto comply with this additional reporting burden; and
(2) They question the quality of information that would be received.52
Employee Coverage
Each employer who is required to comply with a state's unemployment
compensation law submits a quarterly wage report. Employercoverage is defined by
state law, so many minor differences show up among the states. There are four key
groups of wage earners not included in state UI wage data for a particular state:
(1) self-employed people;
(2) employees who are paid on a commission basis only (i.e., they receiveno salary);
(3) Federal government employees; and
(4) people who work outside the state in question.53
The first three groups--self-employed persons, people working on commission
and Federal government employees--combined make up no more than 3 percent of
the labor force nationwide.
Policymakers and others considering the future use of state UI wage records
for education outcome measurement purposes should answer two questions about
these coverage limits:
How will the four groups of workers not included in state UIwage dataaffect the accuracy of the intended use of the records?
Is there a practical way to complement the wage record data with otherinformation to compensate for any unacceptable gaps that areidentified?
139
1 6 .)
Step 3 offers assistance in answering mese questions. Practitioners must then
add details about their own state's coverage provisions and about the specific
intended use of the information.
Reporting Schedule
The quarterly report of employment and earnings information is required to be
submitted to the SESA within one month of the end of a quarter.54 The SESA then
has two additional months to process the data before it must be available for internal
administrative use in managing the state's unemployment compensation program.
This means that, in principle, the state UI wage records are available for use with a
one-quarter lag.55 However, each of the SESAs has many data processing demands
that affect its capacity to respond to external requests for data. Thus, delays
sometimes occur in the release of these files.
Among the questions that must be answered by any ,ne who is contemplating
asking a SESA to provide wage record information are:
1. Which of the four quarters of state UI wage records should be
requested?
2. How many years of data, past and future, should be sought?
3. How soon after the state UI wage records become available are theyreally needed for the intended purpose?
Aspects of each of these questions are examined in Step 3.
140
1 6 ,1
Why Use State UI Wage Records?
The study revealed four significant advantages to linking school Information
on former students with state UI wage records:
Completeness of records. The state UI wage records contain earningsdata on about 97 percent of all employees (except in Massachusettsand New York.) This contrasts with the low response rates andconsequent nonresponse biases often obtained though alumnisurveys.
Ease of linkage. The social security number of students is the onlyrequired identifying element for record linkage.
Cost effectiveness. Access to these data sources for postprogramdata collection provides a cost-effective alternative to time consuming,low response methods such as student surveys. State officials of astate using UI wage data supplemented by othersources reported thatthe cost for obtaining outcome information had been reduced from$17.00 to $3.00 per student.
Availability of data for longitudinal studies. Data are available byquarter and for a period of at least four years, thus, administrators mayconduct short-term and longitudinal analyses. Availability of long-termdata may vary from state to state.
Timeliness. A quarter's wage record data are generally available withinfour to six months.
Thus, the use of state UI wage data for tracking the workplace experiences of
former vocational education students should be given careful consideration.
Information in the following sections provides an overview of the other administrative
data sources.
U.S. Office of Personnel Management
The U.S. Office of Personnel Management (OPM) maintains employment and
earnings files for all Federal civilian employees. The Office of Workforce Information
in the Personnel Systems and Oversight Group of the U.S. Office of Personnel
141
162
Management reviews external requests for access to information about Federal
government civilian employees. The Office of Workforce Information maintains two
files:
(1) A Central P( 'sonnet Data File, which is a cross-section or snapshotmeasurement of employment at a particular point in time; and
(2) A Released Dynamics File, which offers an opportunity to conductlongitudinal investigations.
To date, only the demonstration project and Florida's Education and Training
Placement Information Program are known to have requested unit record information
from OPM for educational outcomes documentation purposes. In anticipation of
others following in these footsteps, there is an urgent need to design and implement
a procedure that wouH standardize and consolidate future requests for such
information, so as to minimize any burden on OPM. If this is not accomplished in the
near future, then OPM may be forced to deny all requests, because a large number
of independently submitted requests cannot be processed in an ad hoc sequential
manner.
Information Reported
The demonstration project and Florida's Education and Training Placement
Information Program limited the request to OPM to the following data elements:
Federal employing agency;
state, county, and city of duty station;
occupation; and
salary,"
142
162,
Many other data elements are Included in the Central Personnel Data File and
in the Released Dynamics File. Some of these data elements might be relevant to the
study of employment and earnings. However, OPM is not required under the
Freedom of Information provisions to release these other data elements on a unit-
record (e.g., identifiable employee) basis as they are with the four data elements listed
above.
Employee Coverage
All Federal government civilian employees are covered.58 The Central
Personnel Data File records only an employee's status during the quarter in question.
The Released Dynamics File offers an opportunity to retrieve information about all
previous Federal government civilian employment positions held. Coverage of any
extended number of years would be expensive, since information for each quarter
must be extracted separately.
Reporting Schedule
There is at least a six-months lag in the availability of information from the
"current" Central Personnel Data File. Since the Released Dynamics File includes only
previous quarters of data, there is no additional delay involved in acquiring information
from this file.
U.S. Department of Defense Military Enlistment Information
The U.S. Department of Defense maintains a Manpower Data Center facility in
Monterey, California. Personnel data for each of the military services are archived in
143
Monterey. Requests for information about military enlistees are reviewed by the Data
Center's administrators, who are headquarter ad in Alexandria, Virginia. Earnings data
require a more complex approval process than employment information. Upon
approval from the Data Center's administrators, requests are then forwarded to the
facility in Monterey for processing.
Again, following Florida's lead, data items that were requested from this Data
Center by the demonstration project included:
branch of military service;
military occupational specialty code; and
date of enlistment.
Other data items are available, such as duty station, rank, and training
obtained within the military. However, these items are less pertinent to studies of
employment and earnings.
The same caution that was mentioned with respect to burdening the U.S.
Office of Personnel Management with independent data requestsapplies here as well.
A consolidated approach needs to be investigated.
U.S. Postal Service
The U.S. Postal Service maintains its own employment data base for all
U.S. Postal employees. This data base is similar in structure and content to the data
base maintained by the Office of Personnel Management (OPM). This data base was
not used during the demonstration project, but has been regularly used by Florida's
Education and Training Placement Information Program. At present there is no
charge for access to this data base, but a charge may be implemented if demand
144
16,-;
exceeds an easy ability to provide response. The data base is updated on a
continuing basis. When requesting information from this data base, the time period
for matching must be specified.
This data base contains information that is similar to that maintained by OPM
for Federal civilian employees. It includes postal location, pay grade, and
occupational title.
This data base includes all U.S. Postal Service employees. In Florida,
approximately half as many former students were found to be postal employees as
Federal civilian employees. This ratio can be expected to vary across states.
Provisions of the Computer Matching and Privacy Act of 1988 (P.L. 100-503; 5 USC
552a) govern access to this data base, as with other Federal data bases.
Social Security Administration Information
Many people do not distinguish between the state-specific SESA wage record
data source and the Federal government's Social Security Administration collection
of annual earnings information.
Baj and Trott report that:
...among administrative data sources, the earnings filesmaintained by the Social Security Administration (SSA)pose the most serious challenge to UI wage record filesas a source of longitudinal data. However, there areserious drawbacks to the use of SSA files. Since SSArecords report only [truncated] annual earnings,analyses of the postprogram trends of employment andearnings must focus on the year-to-year changes in themeasures. Furthermore, since earnings above thetaxable maximum are not reported, statistics generatedfrom SSA data can be biased.
The most critical weakness of the SSA earnings files isthe substantial delay in obtaining the data. Typically,
145
the data are three to four years old before they arereleased in a form that analysts can use. Even then, aconsiderable amount oi time is required to compile andanalyze the data before evaluation results can bepublished5s
The Social Security Administration, by policy, does not release unit-record
information. Requests must be submitted in blocks of social security numbers based
on a predetermined table shell design and analytical plan. Once the request is
submitted, these aggregation decision rules cannot be reversed. This means that
when preliminary analysis offers hints about further queries that might be desirable the
aggregated data represent a barrier to pursuing the preferred diagnostic.
Internal Revenue Service Information
Earnings information extracted from individual Federal tax returns has been
used to Investigate education postprogram outcomes. This data source has the
advantage of covering all income, whether or not the former student worked in the
state of previous school attendance. However, as with Social Security Administration
information, there are several limitations:
unit-record data cannot be released;
a substantial delay in availability (estimated to be three to four years);
firm and industry information are not available; and
perhaps most importantly, earnings from a specific job or employercannot be isolated.
Summary
In summary, Step 2 provided the details on each administrative data base that
is currently under consideration for linkage to determine employment and earnings
outcomes for postsecondary vocational education students. As can be seen, each
data base has its strengths and weaknesses, the availability of data varies as well as
the length and requirements for requesting linkage with these data bases through
social security numbers of former students.
Step 3 follows and provides information on key data collection issues. These
issues include important guidelines on data elements, confidentiality of student and
employer records, and determination of external factors to consider for data collection.
147
1 7;
Checklist for Data Sources
State staff and others should be familiar with the following aspects of each
data source:
State Unemployment Insurance (UI) wage records
* Information reported by employers* Employers required to report* How often reporting occurs* How to request access to data base
U.S. Office of Personnel Management Data
* What files are maintained* Who is covered in files* What information Is provided* How often reporting occurs* How to request access to data base
U.S. Department of Defense Military Enlistment Information
* What information is contained in the files* How to request access to data base
U.S. Postal Service
* What information is contained in files* How to request access to data base
Social Security Administration Information
* What information is contained in files* How to request access to data base
Internal Revenue Service Information
* Information in files* How to request access to data base
148
Step 3.
MAKE DATA COLLECTION DECISIONS
Background and Overview
During the past two years colleagues in four states (Colorado, Florida,
Washington, and Wisconsin) have published reports that describe the use of SESA
UI wage records for vocational education follow-up purposes.6° Colorado's
Community College and Occupational Education System has developed a
consolidated longitudinal data base that includes:
Both secondary and postsecondary occupational student records;
Colorado Commission on Higher Education student records for thosewho have gone on to a public college or university in the state; and
Colorado Department of Labor and Employment wage records.
Florida's Education and Training Placement Information Program has
consolidated these three types of sources of unit-record information, plus additional
sources including Job Training Partnership Act (JTPA) and Department of Correction
records, and U.S. Office of Personnel Management, U.S. Department of Defense, and
U.S. Postal Service personnel information.
Washington's State Board for Community and Technical Colleges has
conducted a cross match of its vocational preparatory program completers and
Washington State Employment Security Department UI wage records, and has
conducted sample surveys of these completers and selected employers.
The University of Wisconsin's Vocational Studies Center performed cross
matches of postsecondary vocational/technical education program completers with
both Wisconsin Department of Revenue (state income tax) and Wisconsin Department
149
1 7
of Industry, Labor and Human Relations wage records. It also extracted a comparison
group from U.S. Census data.
Other states can learn from these pioneering efforts. Refer to the endnotes for
names of reports issued by these states for further information. To take advantage
of these pioneering statewide efforts, a consortium of five states (Colorado, Florida,
Maryland, Missouri, and Washington) has been established in support of the National
Assessment of Vocational Education mandated by the U.S. Congress. The outcome
of the ongoing dialogue between the five member states of the consortium and the
University of Baltimore's Regional Employment Dynamics Center may serve as a
model for others in the future. In Colorado, Florida, Missouri, and Washington state
the lead partner in the consortium is a state education agency, which in turn
maintains a formal agreement with its State Employment Security Agency (SESA). In
Maryland, the SESA took the lead in establishing a relationship with partners from the
education community.
Each state will have to make certain decisions before and during the
implementation phase of record linkage. Before reviewing essential data collection
issues, the unique features of the demonstration project should be noted.
Practitioners may wish to include some or all of these unique features in the
implementation phase in their state.
150
Features of the Demonstration Project
Unique features of the demonstration project which complement the individual
state efforts described above, but go beyond them in scope, include:
The introduction of "external factors" (e.g., measures of local economicconditions and changes in these conditions over time) to putemployment and earnings outcomes into the context of localcircumstances that are beyond the control of vocational educators;
Development of multiple presentation formats to meet the needs ofdifferent potential users of the information, while protecting theanonymity of former students and employers ;61
Access to more than four years of wage records for one of thecooperating states, which permitted investigation of topics that othershave been unable to address; and
The inclusion of proprietary institutions (i.e., private career schools).
To establish a comprehensive merged data base, the demonstration project
adopted Florida's basic approach.62 A core data file was assembled that included:
Unit-record (i.e., school-based transcript) information for discretecohorts of former students in public63 and private" postsecondaryoccupational programs;
Within-state UI wage records covering multiple years of postprogramemployment and earnings;65
Military enlistment data; and
Federal civilian employment information.
Following the state of Washington's lead,66 State UI wage records for
adjacent states were incorporated.
Measures of local economic conditions were added to these replication steps
to permit investigation of the effects of external factors on the former students'
employment and earnings outcomes.
151
Data Elements From Educational Institutions' Records
Lessons learned from the demonstration effort are described in this section
with the following cautions:
Both public and private postsecondary institutions maintain uniquerecord-keeping systems; this situation simultaneously creates problems(e.g., noncomparable data sets) and opportunities (e.g., unique dataanalyses not available for all institutions); and
The availability of state wage record data elements, and other externalfactors information, from a SESA may be constrained by state laws andadministrative regulations.
Institutionai Records
The governance of public and proprietary education is unique in each state.
Even when the topic of interest is limited to occupational programs, two or more
governing bodies are likely to be involved. Students in an occupational preparatory
course at a public community college, at an area vocational-technical school, and at
a private career school, almost always appear in different administrative data systems.
It is, therefore, necessary to match students with the various institutions; and to
achieve an unduplicated count, since a student may have been enrolled in more than
one type of institution during the period of examination. Private career schools are
subject to less uniform reporting requirements than publicly funded institutions in
many of the states. This means that fewer common data elements will be found for
proprietary schools.67
Social Security Number
The one data element that must be included in each student record, public
and private, is an accurate social security number. Without this Identifier, It is
152
impossible to link student records with SESA UI wage, Federal civilian employee or
military personnel files,68 or with the U.S. Postal Service records.
A first step in data collection is to determine whether a former student's social
security number can be used in the state for linking administrative records. As noted
in Step 1, legal counsel is advisable in the early stage for two reasons. If record
linkage using a former student's social security number is a permissible activity, the
next action is to determine whether individual students records include the numbers,
and if so, at what level the numbers are held (i.e., the institutional, district, or state
level). If they are included in records maintained at one or more of these
organizational levels, then determine at which level the files are electronically
accessible.
Florida's Education and Training Placement Information Program has
accumulated the most day-to-day practical experience in handling issues around
social security numbers. The issues that must be successfully resolved are how to:
1. ensure mandatory recording of an accurate social security number foreach student;
2. transmit the numbers to the office responsible for linking studentrecords with SESA UI wage and other employment data sources; and
3. perform routine editing and auditing procedures to assure anacceptable level of accuracy of the numbers.
Mandatory entry of social security numbers on student records can be
achieved through legislative or administrative means. An advantage of the legislative
approach is that it insulates administrators within the education community from
pressure to grant exceptions (e.g., allowing alternative student identification systems),
which then lowers the quality of the resulting outcomes. However, when pursuing the
153
17
legislative route, loss of control of the initiative can easily happen as political
compromises are made.
Inevitably, some students will not give accurate social security numbers.
Currently, school administrators have little incentive to verify that a reported number
is the student's own, and not that of a friend or relative. This has been a common
sense response to awareness that accuracy of numbers has not mattered in most
cases. In the past, administrators have asked the question: "Why overinvest in time
and effort to ensure accuracy of the numbers when there is no expected payoff to this
commitment and no sanction for noncompliance?"
In many instances, management practice does not reward high quality in
reported data or punish low quality in data collection. Under these circumstances it
may be easier to introduce a new mandatory reporting of student social security
numbers, where no such requirement existed before, than it will be to raise the
accuracy level of the reporting requirement that is already in place. In either case,
there must be a clear message conveyed to administrators and students of the
importance of this requirementdetermination of future employment and earnings
outcomes depends upon it.
To return to a point made earlier: some parties may fear any accountability
system and seek to sabotage the collection of accurate information. Therefore,
auditing procedures should be developed and maintained to Improve the accuracy
of the social security numbers needed to link student records and administrative data
bases.
154
Missing Social Security Numbers
Missing and inaccurate social security numbers are unlikely to be randomly
distributed among students. Students without work experience are less likely to have,
or to know that they have, a social security number.7°
Most people have become used to responding to almost casual requests for
their social security number. The crucial hurdle for successful mandating of a new
requirement to provide this information is to win over the minority who oppose
voluntary compliance. It is important to offer appropriate staff training to those who
will actually make the request--probably classroom teachers requesting the
information from studentsbecause these individuals must be convinced about the
importance of accuracy of the data to enhance accuracy of the data collection
effort.71
Student Consent
A possibly powerful complement to staff training is to ask each student to
return a signed informed consent form. This form can be designed to describe
exactly how the social security number will be used. Completion of such a form
provides a release for the use of student information under specified conditions
described by the consent form. This is one way to assure each student that their
identity will always remain confidential in postprogram performance measurement
investigations. The downside risk of this approach is that it will frighten some
students, who would have offered passive informed consent72 for the use of their
social security number, into refusing to sign. Obviously, this protective approach can
only be used with respect to current or future students.
155
The approach described in this report for determining postprogram outcomes
does not require student consent, but such consent may be valuable in securing
cooperation from necessary participating agencies (e.g., a state department of
education or a SESA). However, before collecting signatures on consent forms, one
is urged to seek the opinion of legal counsel about both time and scope limits on the
use of informed consent forms. The cost of such a data collection effort must also
be weighed against the potential benefits that are derived.
Curriculum Coding
A particularly difficult challenge facing policymakers and practitioners,
especially for performance-based funds allocation purposes, is program definition.
Programs with the same program content may have completely different titles, and
programs with the same title may have different content and scope requirements.
The U.S. Department of Education recently released a 1990 revision of the
Classification of Instructional Programs (CIP). A "cross-walk" was provided by the
Education Department that permits users to map data coded from the 1985 CIP into
the 1990 CIP classifications. The CIP is a six-digit coding system. At the six-digit
level, substantial uniformity among programs coded within a given cell is alleged.73
A teacher, program coordinator, or school administrator might find the full six-digit
detail useful. Most higher levels of management could be expected to want some
aggregation of six-digit CIP codes.74
Selection of a unit of analysis must ultimately be determined by the application
that is intended for the data collected. No single practical rule can be stated here.
If the employment and earnings information is to be assembled for dissemination to
156
current students, and to their counselors and families, then data for a particular school
and CIP code may be appropriate, since this is the frame of reference for the
student's decision making. It may also be important to report findings along specific
dimensions that summarize data across students (e.g., by sex, ethnicity, and previous
educational attainment).
Chapter Five's treatment of "external factors" highlights the factual basis for
concerns that comparisons among schools, and between programs within schools,
too often ignore differences in student demographics and labor market conditions,
which should be considered in the management's documentation of postprogram
outcomes.
The objective in choosing a coding-level for curriculum content is to achieve
an acceptable level of homogeneity with respect to the specific intended use of the
data. That is, it is important that only like programs (on whatever unit of analysis is
selected) are aggregated and reported when providing data relevant to that unit of
analysis. The goal is to head off later charges that apples and oranges have been
compared.75 Too frequently, importance is attributed to what has been measured,
rather than deciding what is important beforehand and then measuring it.
The amount of thought that goes into choosing a curriculum coding level
should be a direct function of the range of consequences that might be expected to
result from different approaches. Historically, those at both ends of compliance
reporting systems have understood that heavy investments in assurance of accuracy
were unwise. In isolated cases, where actual management decisions have been made
on the basis of these figures, accuracy has been given greater weight.76
157
Unfortunately, the CIP coding system is rarely used by private career schools.
The autonomy of these schools translates into the absence of any uniform curriculum
coding scheme. This diversity can be expected to begin to collapse into some
common approaches as more states move to impose mandatory reporting
requirements on these schools. The newly established Career College Association
can be expected to hasten this movement. This is not to say that quick and complete
uniformity of reporting should be expected. Many of the career schools are quite
small. Many do not have automated record keeping systems.
Student Demographics
Student characteristic dataparticularly gender, race/ethnicity, and ageare
important for postprogram outcomes purposes. Without these data elements, it is
difficult to interpret former students' employment and earnings histories, which in turn
might feed back into administrative decisions about applicant recruitment, counseling,
and support services.
Additional information about the following characteristics will contribute to a
deeper understanding of factors that influence postprogram outcomes:
single-parent status;
limited English language proficiency;
disabilities;
veteran status;
financial aid eligibility and receipt;
high-school graduation or GED;
158
documented need for remedial services; and
receipt of remedial services.
The objective in deciding how much demographic information to collect is
identical to the process of thinking through how curriculum codes should be chosen.
This question must be answered: 'What data elements are needed to organize and
interpret the information to meet the informational needs of the different
usersconsumers, vocational educators, and policymakers?"
Decisions about the collection of specific demographic data elements may be
constrained by law, administrative regulation, or tradition. Even when such
constraints are not encountered, anyone who proposes to organize and release
postprogram outcomes information must be sensitive to possible consequences. For
example, good intentions to publicize continuing segmentation of employment and
gaps in earnings between men and women, or among ethnic groups, might increase
the resistance that is encountered to the entire data collection and dissemination
activity. Many educators plead that racial and gender-based disparities in
employment and earnings cannot fairly be laid at the doorsteps of their programs,
which are of little consequence relative to the influences of other social institutions
including each student's home and work environments.
Decide what realty should be accomplished with a postprogram outcomes
documentation system, and then design data collection and dissemination efforts to
meet these goals alone. Postmortem dissection of past failures to introduce aria
sustain a postprogram measurement system usually reveals few strategic elements-
too ambitious, under-funded, casually managed, poorly marketed, and with
inadequate feedback loops that would promote timely revision.
1597
Substantial lead time is normally required to introduce new data elements Into
a statewide reporting system. Subsequent auditing is necessary to assure adequate
maintenance of quality standards. This is a particularly serious problem in the
education arena, because so much data has been collected without any apparent
use. When those who are asked to submit data know that quality does not matter,
they would be foolish to throw money away In quality assurance activities. It will not
be easy to overcome this historical record. At least temporarily, significant
investments in quality assurance must be made.'"
Summary of Institutional Information
Most schools' information systems have been designed to document
transactions (e.g., enrollment, attendance, and sometimes completion), and within-
school achievements (e.g., test scores, grades, and maybe competency attainment).
For most of these schools, serious and sustained measurement of postprogram
outcomes will be a new undertaking. Course-load and grade information can be
correlated with concurrent employment data, which has become much more important
in the administration of postsecondary education as adult enrollments have grown.
Unfortunately, the timing and motivation for this new activity could hardly be
worse. The typical motivation will be a lop down" directive from administration telling
the schools that they are required to comply. Unfortunately, the timing is concurrent
with widespread cuts in funding of local education activities in most states. This
coincidence of requiring improved outcomes with less input is not conducive to
enthusiastic cooperation.
160
1 i
This conclusion is precisely why maximum reliance on already available
administrative records should be endorsed. In this way, local school administrators
may not have to shoulder any additional reporting burden--if student social security
numbers and other desired data elements are already being reported to the state. All
employment and earnings outcomes can then be determined at the state leve1.78
SESA UI Wage Records
Details about state UI wage records were introduced in Chapter Four and Step
2 of Chapter Seven. In this step, more advice is offered about how to decide whether
State UI wage records should be sought, and then how to proceed if the decision is
affirmative.
Every SESA has experienced extraordinary institutional tension throughout its
existence. During the past 10 years, this turbulence has been exacerbated as funding
has decreased and the agency's mission has been redefined. Currently, the
unemployment compensation divisions within the SESAs are attempting to deal with
growing claimant loads. This translates into severe pressures on each of the SESA's
data processing units. A top priority of the SESAs has always been to issue
unemployment insurance checks in a timely manner.
A SESA's Data Processing Priorities
The day-to-day management of UI claims processing depends in IDEA upon the
quality of the SESA's administrative records. The state UI wage record file that was
described in Step 2 exists primarily to permit timely retrieval of accurate information
about a claimant's recent earnings, so an eligibility determination can be made for
161
1
unemployment insurance benefits. The quality of this file depends upon voluntary
employer compliance with reporting requirements and the SESA's auditing and
enforcement practices.
Each state unemployment compensation law is unique to that state. Each
SESA is affected differently by the flow of administrative funds and management
decisions that are made with respect to the allocation of these funds. It is impossible
to generalize here about the quality and availability of a SESA's administrative records.
Both late reporting and nonreporting by covered employers does occur in every state.
These two facts have different implications for the education community.
Late Reporting by Employers
Late reporting means that an employer fails to submit a required quarterly
report of employee earnings within the one-month period specified in the law. The
importance of this factor is that any state agency that proposes to request wage
record information should ask the SESA personnel how the timing of the request will
be affected by late reporting.
Nonreporting by Employers
Nonreporting means that an employer fails to submit a required quarterly
report of employee earnings. The SESAs have become quite sophisticated in
reducing tha incidence of noncompliance, largely through automated cross-matching
of records with other state agencies (e.g., tax authorities and business licensing
agencies). There Is a well-known pattern in nonreporting related to the size of the
firm. Small new business start-ups are more likely to fail to submit the required
162
reports.79 Financially vulnerable businesses are also known to have a higher
incidence of nonreporting than other businesses, for obvious reasons. Again,
practitioners and program analysts must think through how nonreporting will affect
whether and how state UI wage records will be used.
Reporting of Employer Identification Number
Every employer who has an established unemployment compensation account
with a SESA has a state-specific employer identification number.8° This number
accompanies each wage record that is maintained in a SESA's data processing
system, so a claimant's recent job history can be easily retrieved.
There are many nuances to the maintenance of employer identification
numbers by a SESA. A state's experience rating practice, which may impose a higher
unemployment compensation tax on firms whose former employees have a high
incidence of claim filing, can create an incentive for a business (e.g., a small
construction contractor) to close an existing account and establish a new account
under a different name. The SESAs have well-established procedures to guard
against such practices.
Each SESA has a codified procedure for creating what are called parent-child
and predecessor-successor codes. Parent-child codes refer to a company's
headquarters and subordinate facility. Predecessor-successor codes refer to
sequential ownership circumstances. Each must be understood if there Is an interest
in tracing retention with a particular employer over time.
In special circumstances, such as longshore employment, some construction
work, agricultural crew work, and employment by a temporary help agency or
163
employee leasing firm, an employee will be reported by an umbrella organization
which limits any ability to determine what the actual work-site assignment has been.
Work-Site Location
Employers who operate more than one work site in a state are usually
permitted to choose between reporting employment of all employees at all sites using
a single headquarters geographic code, or using a work-site code that actually
indicates where each employee works.81 Employers are also permitted by most of
the SESAs to report using the address of their accounting firm, legal counsel, or
service-bureau that processes their quarterly reports on their behalf.
Employee Identification
Everything that was disci ssed in the Social Security Number section of this
step applies to employers. Large employers who submit their reports to a SESA
electronically, or on tape or disk, create less of a risk of error than do smaller
enterprises that submit their reports on paper. Most of the SESAs conduct periodic
audits of the accuracy of employer reports, so state education staff can ask about
accuracy of employer reporting to the SESA before deciding how to proceed.
Earnings
It has already been noted, in Step 2, that each state unemployment
compensation law reflects minor differences in what earnings are covered. Wages,
commissions, and bonuses82 are covered in every state, so the core money
compensation components are included. Non-wage benefits, which are extremely
164
uneven across employers, and even among jobs within employing establishments, are
not included. It must be ascertained exactly what is included in an employer's
reported earnings figure in a particular state.
Multiple Wage Records
In many cases more than one wage record will appear In a given quarter for
a particular former student. This means that the person worked for more than one
covered employer in the state during that three-month interval. Remember, a wage
record is specific to one employer and one employee!
When more than one wage record appears in a quarter for a particular person,
this may represent one of the following scenarios:
sequential employment without interruption, such as one job followedimmediately by a new Job without any time lapse in between;
sequential employment with time between jobs; or
overlapping employment when more than one job is heldsimultaneously.83
The question needs to be asked: Does the appearance of multiple wage
records in a quarter represent an interpretive problem in determining the employment
and earnings outcomes of vocational education programs?
Full- and Part-Time Employment
What you see is what you get In a SESA's administrative records. With a few
exceptions," it is not possible to determine how many hours per week and how
many weeks a person worked during the reporting period. This means it is not
possible to derive an hourly wage rate equivalent from the earnings figure.
165
1
Other Administrative Data Elements
A wage record Is only a record of earnings during a specific quarter that is
related to a particular employer. For some purposes, practitioners and program
analysts may be interested in knowing the following:
industrial affiliation(s) of former students;
size of the firms in which former students are working; or
changes in the levels of employment within firms or industries withwhich former students have been employed.
It zS important to remember that you only get what you ask for when a request
is submitted to a SESA. If any of the above-mentioned types of data elements are
needed, then they must be requested. Be aware, though, that each additional data
element requested translates into more difficulty for a SESA in satisfying the request,
higher cost for data processing, and probably a longer delay in receiving the data.
SESA administrators are particularly skeptical of "laundry-list" requests that do not
reflect careful prior thought about what will be done with the information once it is
received. Future requests may require an explanation of exactly how the individual
data elements will be used, and what the nature of the proposed public release of
information will be. Step 4 offers specific suggestions about how to prepare for a
rigorous review of a proposed use of a SESA's administrative records.
Confidentiality of State UI Wage Records
This topic has been reserved for the end of the section on SESA UI records,
so readers have the full array of other data issues clearly in mind when this is read.
Every state unemployment compensation law prohibits a SESA from revealing any
individual or employing establishment identity to the public. There can be no
166
exceptions to this statutory requirement, because to do so would damage the SESA's
credibility and continuing need to collect accurate information in support of its own
administrative responsibilities.
Any agency that intends to request individual unit-record information from a
SESA must be prepared to assure the SESA that it can satisfy the request with
complete confidence that both the letter and the spirit of the confidentiality stipulation
will be upheld. Step 1 described the ongoing efforts by the Unemployment Insurance
Service in the U.S. Department of Labor's Employment and Training Administration,
the Interstate Conference of Employment Security Agencies, the individual SESAs, and
some governors and state legislatures, to create practical ways that reasonable
requests for access to administrative records can be honored.
SESA Data: A Final Statement
Readers should not despair about the complexities of a SESA's reporting
system as discussed in this step. The many exceptions to the rule are mentioned to
be sure that each practitioner knows what questions to ask SESA personnel. An
overwhelming percentage of all quarterly wage reports are submitted on time,
accurately, with a consistent employer identity, and with a single work-site code.
Model legislative language, regulatory directives, management documents, and
predecessor experiences are now available to any reader. SESA administrators can
be expected to be most responsive to thoughtful requests that reflect an
understanding of the SESA's delicate position. For the record, a universal expectation
concludes this section -SESAs require reimbursement for the costs that are incurred
in responding to third-party requests for data retrieval.
167
1
Data Elements for External Factors
The term "external factors" was defined earlier as measures of those forces that
are thought to affect employment and earnings outcomes, but over which educators
and administrators exercise little or no control. External factors are valuable to any
postprogram outcomes system because they allow the outcomes to be considered
in the context of those influences that are beyond the control of educators. Such
considerations are of particular importance if irreversible curriculum choices by
students are affected by the outcomes data, if decisions about curriculum continuity
are involved, or if public awareness of school comparisons is intended.
Chapter Five described how external factors were considered by the
demonstration effort. Choices among possible data elements for external factors will
be driven by the use Intended for the postprogram measures. Indices of changes in
the overall level of economic activity might suffice, if the goal is to offer school
administrators a hold-harmless protection against the loss of Job opportunities that
accompanies a recession. Even this aggregate approach must be given geographic
specificity, since all school districts are not affected uniformly by the ebb and flow of
the Nation's economic vitality. Unfortunately, the smaller the geographic area that is
chosen, the more difficult it is to find timely and accurate data to reflect the changes
In local economic activity. Practitioners are advised to contact the labor market
analysts at the SESA for further Information about what sources of economic
information are available.
If the intended use of employment and earnings information Is to offer
students, counselors, and family members an accurate "feel" for future prospects if a
particular choice of curriculum is made, then the selection among external factors
168
becomes more difficult. In this case, what is sought is a reliable translation of the
historical record into future opportunities. Here, changes in the mix of employment
opportunities takes precedence over changes in the level of employment. A SESA
is a good place to start to become informed about what labor market information is
available. Another agency to contact is a State Occupational Information
Coordinating Committee (SOICC) to learn about the resources and information they
have on future occupations and changes in the labor market.
Many changes of traditional industrial relations practices are occurring, which
threaten the relevance of some existing data series. An increasing number of
companies are collapsing the number of job classifications that apply to their
production work force. This practice blurs previous sharp distinctions among
occupational definitions, which increases the difficulty of tracing the extent of overlap
between the content of an occupational curriculum and a particular work setting85
If the intended use of employment and earnings information is to establish a
performance standard, then particular care should be exercised in the selection of
external factors. The JTPA experience may be very helpful as a continuing refinement
of individual factors and measurement techniques.
One point cannot be overemphasized- -the purpose for establishing
performance standards should be dearly stated, so that all affected parties know how
much importance to give to individual measures. The Appendix offers more
information about outcome measures and performance standards.
169
AREgastlialarasiglignMws
The purpose of this section of the paper has been to sensitize readers to data
collection issues. The important points to remember are that:
Unthinking reliance on a cookbook approach is virtually certain toresult in a short-lived postprogram outcomes system.
There are many state-specific differences in both data availability andthe intended uses of data.
Each SESA, which may be a valuable source of assistance, has Itsown priorities that take precedence over third-party requests forcooperation.
There is no substitute for thoughtful preparation of a strategy thatclearly lays out why postprogram employment and earningsinformation is sought, what other information is needed to properlyinterpret these data, and how the adjusted information is to bereleased to the public.
Step 4 offers advice on data processing issues.
Step 4.
DEVELOP DATA PROCESSING PROCEDURES
Introduction
Data processing capabilities are even more idiosyncratic than data availability.
Individual schools, school districts, state departments of secondary and
postsecondary education, higher education coordinating boards, private career
schools, the SESA, and other potential sources of external factors data, represent
unique data processing challenges.
Having said this, there are common data processing issues that each such
initiative must deal with and resolve. These include:
integration of systems, so information that is transferred among unitscan be processed in a routine manner;
timeliness of movement of information among the various players (i.e.,place in the queue of each agency's priorities, and maintenance of atightly knit sequence of steps among these agencies);
assignment of responsibilities among agencies when more than onemight satisfy a need;
determination of funding arrangements among participating agencies;and
completion of required interagency agreements.
Integration of Systems
During the two-year demonstration project, 22 independent sources of unit-
record data were processed--probably more than would be encountered in a typical
single-state system. The data processing facility used in this project permitted
acceptance of data in many different forms.86
171
1 9 2
Nevertheless, two instances arose in which the data received could not be
processed in its transmitted form. In one case, an obsolete disk-pack received from
a career school could not be accommodated. The school had no way to transfer the
historical records from this medium to a more current system. Luckily, the school had
retained a hard-copy printout of the student records. Standard, and costly, data-entry
was then required to handle this information. In the other case, a contemporary
cartridge medium for storing data was used, since the transmitting agency assumed
it was in standard use elsewhere. The required information had to be rerun using a
traditional tape medium. Even with a common medium, there are formatting
differences among available operating systems."
The data processing flexibility and security available for the demonstration
study are unlikely to be found in many bureaucratic settings. The day-to-day priorities
of data processing staff members, and equipment and software limitations, can be
expected to interfere with the timely and cost-effective completion of necessary data
processing steps. This adds one more incentive for thinking through what data
elements are required, when they are needed, and to what extent processing will
suffice.
The most important advice that can be given is to not take anything for
granted. Do not make assumptions about:
how requested data might be transmitted;
when it will be sent;
what charge will be assessed;
what documentation will be included; and
what quality assurance will be offered.
172
Specify each of these aspects of the request in writing at the outset.
Increasingly, the other party will require that these features of a request be spelled out
anyway, so be prepared.
It is always important to be sensitive to the burden that is placed on a data
processing unit when a third-party request for information is submitted. Special-
purpose programming requirements should be justified. Maybe a "dump" of records
can be accepted, and the desired data fields can then be extracted for analytical
purposes.88
Data processing units are subject to their own agency's fluctuations in the
timing of demands for service. Taking the following action steps will help to speed
the process along:
1. Make an effort to find out when the demands on an agency areheaviest, and avoid these times when requesting cooperation,
2. Specify a realistic deadline when the data are needed. Be sure thatthe data processing unit understands that this is a mal deadline, whichRs into a sequence of activities, so the staff takes the delivery dateseriously.
3. When flexibility is possible, tell the data processing unit thisthey willappreciate the breathing room, and may remember when a tighterdeadline is necessary in the future.
4. Do not hesitate to check with a data processing unit to be sure thatthe request was received, that all responsibilities have been met (e.g.,up-front provision of a tape to be used for data transmittal), and thatno unexpected glitches have arisen. When priorities do get shuffled,remember that the data processing unit is usually a subordinate playerin this exercisedo not take frustrations out on them, and do notexpect them to take the time to alert third-party requestors to a revisedschedule.
Waiting for the phono to ring, or for the mail to arrive, is an often repeated
mistake that cannot be easily explained to one's own superiors.
173
19
Data processing technologies and costs are in continuous turmoil. Vendors
come and go. It is impossible to anticipate what the range of configurations may be
within just a few years. However, it is very important to keep informed about this
progress, so that a cooperating partner's adoption of a new processing capability with
trickle-down effects on the activities does not come as a surprise.
Interdependencies in Data Flows
The reader may not have to juggle 22 data sets, as was necessary in the
demonstration project, but it will always be necessary to exercise limited control over
the various players whose cooperation is essential to success. It is not unreasonable
to calculate the lead time that is thought to be necessary to obtain a specific set of
records, and then double this figure! Even when a consistent track record of on-time
delivery has been enjoyed in the past, this performance cannot be counted on to
continue into the future. Today's state and local budget demands offer an unfortunate
example of this principle--organizational capabilities to service third-party requests are
being compromised throughout the nation.
There are two specific actions can be taken in an attempt to keep a cap on
the number of disappointments that arise:
Create a flow-chart of the different steps that are involved in obtaining,processing, analyzing, writing-up, and releasing information.a2 Sharea draft of this flow-chart with others to assure accuracy. Attach timelines to the flow-chart and allow buffers, or cushions, that absorb theimpacts of unexpected delays.
Be sure that each of the cooperating parties knows where they fit inthe overall scheme of things. This does not mean that the time-datedflow chart should be shared with everyone - particularly if it revealsthe allowances that have been made for missed deadlines! But eachplayer should understand that he or she represents just one stationalong a complex assembly line.
174
Having said the above, do not expect these players to be as concerned about
the deadlines as the person making the requestthey have their own priorities and
incentives. Remain alert to possible domino effects. A legislative, judicial, or
administrative action might change the content, or the timing of availability, of a
source of data. This will affect the timing, and even the practicality, of moving this
source along to the next processing step. Seasoned managers cite a fear of this
domino effect as a reason for their reluctance to give up tightly controlled (I.e., largely
autonomous) information flows.
Assignment of Responsibilities
There are at least two important questions to answer before deciding what
institutional roles should be served by which agencies. One obvious question is:
What agency is most qualified to provide this service? Here, the word qualification
covers both an agency's willingness and ability to perform.
In one of the states that cooperated in the demonstration project, there were
three possible ways to obtain unit-record information on former community college
enrollees:
(1) each community college;
(2) the state's community college board; and
(3) the state's higher education coordination authority.
The actual data elements available through each of these three sources are, in
principle, roughly the same.° It is obviously less costly to acquire common data
elements from a single state source, when this opportunity is available. However, this
is likely to require an institution-by-institution consent to permit the request to be
175
honored. This is another reason to do careful homework ahead of time, so one-time
opportunities to gain approval are not missed.21
Funding Arrangements
A SESA will require a signed agreement that guarantees payment for costs
they will incur in responding to a request for administrative records. Many variables
affect the billing amount, including whether administrative and programming costs are
included. During the demonstration project, a cooperating SESA submitted a bill of
$300 for a one-time match of the social security numbers of former students against
the SESA's five-quarter active file of Ui wage records.
The U.S. Office of Personnel Management, and the U.S. Department of
Defense Manpower Data Center, determine charges on an individual request basis.
The previously mentioned need to establish a consolidated request procedure would
minimize the costs incurred by any one state.
Completion of Interagency Agreements
Review the interagency agreement discussed in Step 1. To date, the
agreements that have been designed by SESAs cover a common core of issues that
must be addressed. These include:
1. Why are the data being requested?
2. Precisely what information is sought?
3. Who will have access to the information?
4. How will confidentiality be assured?
5. In what form(s) will the information be released to the public?
176
6. When is the information needed?
7. What transmittal medium is requested?
8. Who certifies that costs will be reimb! Ised?
Recently, the SESAs have begun to require an explicit provision for return or
destruction of the confidential records when an agency's specific need for the data
has been satisfied. The SESAs are wary of open-ended requests that increase the
likelihood that confidential information will be lost once the initial application has been
completed. Signatories to a formal agreement can be held accountable, and a SESA
can be confident that these original users understand and will abide by the rules.
However, other parties who subsequently become aware of these records might be
expected to be more careless in the handling of the data. Remember to review all
requirements as proposed for record linkage by the U.S. Department of Labor and
issued in the March 23, 1992 Federal Register.
Summary
None of the topics that have been treated in this step should become a barrier
to successful interagency cooperation in most settings. However, there will be
exceptions to this general rule. In some cases, even these exceptional circumstances
can be overcome.
Persistence is an important behavioral trait in any attempt to acquire
administrative information from another agency. Legal counsels are properly
conservative in their interpretation of what can be done. Data processing unit
managers are equally conservative in their acknowledgement of what should be done.
This cautious attitude will not change. A SESA gains very little by agreeing to
177
cooperate, but it stands to lose a lot if its confidential records are handled improperly
by a third party.
178
Step 5.
Conduct Data Analysis
Described in this step are ways to present the data to satisfy various consumer
interests and some of the important considerations about analysis of longitudinal data.
But, first, it provides an explanation of how to build a comprehensive data platform,
which serves as a foundation for customized reporting of findings.
How to Build A Comprehensive Data Platform
A comprehensive data platform is built in a two-step process by using all the
different data sources and consolidating them into a single format. Table 5 shows the
first step used in the demonstration project. (Table 5 was first presented in Chapter
Five.) It gives actual reported earnings figures for former students of all five
participating community colleges for one state. Six data sources are reflected in
Table 5:
individual student data for five participating community collegeinstitutions in one state;
curricula data for students who attended the five participatingcommunity colleges; and
state UI wage records data for employees employed during any onequarter in a year, and for employees employed during all four quartersin a year.
Table 5 shows the universe of all fal: 1984 first-time enrollees in selected
occupational programs at the five community colleges. Two occupational programs
were selected to highlight important figures of the demonstration effort--Secretarial
Science and Real Estate.
179
2 0 ;)
TABLE 5Employment and Earnings by Program for 1984 Community College First-Time Enrollees
(All Participating Institutions In One State)
PROGRAM: SECRETARIAL SCIENCE (Enrollment: 275)
Year
State Wage Records (1)
# Employed Percent Mean # Employed Percent Mean
in some qtr. Employed Earnings all 4 quarters Employed Earnings
1987 180 65% $ 9,699 125 45% $ 11,901
1988 174 63% $ 10,665 109 40% $ 14,333
1989 162 59% $ 13,179 109 40% $ 16,989
1990 152 55% $ 13,466 93 34% $ 17,443=
PROGRAM: REAL ESTATE (Enrollment: 142)
Year
State Wage Records (1)
# Employed Percent Mean # Employed Percent Mean
in some qtr. Employed Earnings all 4 quarters Employed Earnings
NOTES: (1) State employment figures were calculated using two rules. Rule 1 - include all enrollees with non-zero earnings In any one or more quarters of the year. Rule 2 - include only those enrollees withnon-zero earnings in all four quarters of the year.
180
2t
The All Programs section of the table includes all occupatior programs offered by
the five community colleges in the fall 1984 semester.
This table represents a composite of all five Institutions because each one
was promised anonymity in return for participation In the demonstration project. A
format such as this can be given to administrators of any vocational education
institution with only the furmer students in that particular Institution's occupational
programs. Anonymity can be accomplished by censoring all cells with fewer than
three cases, and by subsequently reviewing the tabulations to assure that no former
student's identity was revealed.
State UI Wage Records
Table 5 gives employment and earnings by program for 1984 community
college first-time enrollees using only state UI wage records. Table 5 reflects data for
four years. Additional years can be added at any time. Table 5 addresses two typical
questions that are asked about employment and earnings:
Do former students work in the state where they had attended school?
How much did they earn each year?
The first three columns of Table 5 reveal the actual reported annual earnings
of former students who had reported earnings during any one or more quarters in a
designated year. The second set of three columns displays the annual earnings for
only those former students who had reported earnings in each of the four quarters of
the designated year. As was pointed out in Chapter Five, these two sets of figures
(i.e., those employed all four quarters versus those employed one or more quarters)
paint remarkably disparate employment and earnings pictures.
181
2u:
Program analysts can use a table similar to Table 5 to analyze employment
and earnings outcomes to compare the following:
programs within one institution;
programs across many institutions within the state; and
total results (all programs) across institutions.
Program analysts can also use the data to compare to occupational data from
the labor market studies conducted by the SESA or from occupational information
collected and disseminated by the State Occupational Information Coordinating
Committee (SOICC). This comparison will tell how well the former postsecondary
vocational students are doing in relationship to entry-level salaries and average
salaries for the specific occupation.
The second step in building the comprehensive data platform is to add any
other administrative data sources of employment information such as:
adjacent-state UI wage records data;
U.S. Office of Personnel Management file data for Federal civilianemployees;
U.S. Department of Defense file data for military personnel; and
any other sources of data such as U.S. Postal Service administrativerecords.
The information from Table 5 plus the data from three additional sources are
presented in Table 6. Censoring all cells with fewer than three cases is represented
in Table 6 by a "C" in the appropriate category. Such censoring should apply to any
instance when there are fewer than three cases for the particular unit of analysis to
prevent identification of a particular student, institution, etc.
182
211
TABLE 6
Employment and Earnings by Program for 1984 Community College First-Time Enrollees
(All Participating Institutions)
PROGRAM:
SECRETARIAL SCI
(Enrollment:
275)
Own State Wage Records (1)
US Office of Personnel
Management (2)
US Dept of Defense
Manpower Data Ctr (3)
ADJACENT STATES
State 1
RECORDS
State 2
(4)
State 3
# Employed
Percent
Mean
N Employed
Percent
Mean
Number
Percent
Mean
Began military svce
Number
Number
Number
Year
in some qtr
Employed
Earnings
all 4 qtrs
Employed
Earnings
Employed
Employed
Earnings
FY1985 - Mar 1990
EmployedEmployed
Employed
1987
180
65%
S9699
125
45%
5 11901
C1988
174
63X
S 10665
109
40%
S 14333
1989
162
59%
S 13179
109
40%
S 16989
1990
152
55%
S 13466
93
34X
$ 17443
24
9%
S 19323
C (5)
19
6
PROGRAM:
REAL ESTATE
(Enrollment:
142)
Own State Wage Records (1)
US Office of Personnel
Management (2)
US Dept of Defense
Manpower Data Ctr (3)
ADJACENT STATES
State 1
RECORDS
State 2
(4)
State 3
N Emp')yed
Percent
Mean
N Employed
Percent
Mean
Number
Percent
Mean
Began military svce
Number
Number
Number
Year
in some qtr
Employed
Earnings
all 4 qtrs
Employed
Earnings
Employed
Employed
Earnings
FY1985 - Mar 1990
Employed
Employed
Employed
1987
93
65X
S 26842
78
55%
S 29471
C1988
95
67%
S 26239
71
50X
5 33291
1989
90
63X
S 29068
68
48%
S 33843
1990
88
62%
$ 31976
64
45%
S 37815
54%
S 37383
CC
C
LL PROGRAMS
(Enrollment: 1631)
Own State Wage Records (1)
US Office of Personnel
Management (2)
US Dept of Defense
Manpower Data Ctr (3)
ADJACENT STATES
State 1
RECORDS
State 2
(4)
State 3
# Employed
Percent
Mean
N Employed
Percent
Mean
Number
Percent
Mean
Began military svce
Number
Number
Number
Year
in some qtr
Employed
Earnings
all 4 qtrs
Employed
Earnings
Employed
Employed
Earnings
FY1985 - Mar 1990
Employed
Employed
Employed
1987
1084
66X
5 12917
743
46%
S 16308
11
1988
1073
66%
S 14018
712
44X
$ 18372
1989
1010
62%
S 16175
685
42X
S 20488
1990
974
60%
5 17297
589
36%
5 22701
153
9%
S 26850
18
110
22
NOTES: (1) own state employment figures calculated using two rules.
Rule 1--include all enrollees with non-zero earnings inany one or more quarters
of the year.
Rule 2 include only those enrollees with non-zero earnings in all four quarters of theyear.
(2) Federal OPM statistics based on December 1990 data.
(3) U.S. Dept. of Defense Manpower Data Center statistics based on fiscal year 1985 through March 1990 data.
(4) State 1
statistics include all enrollees employed at any time between first quarter 1990 and secondquarter 1991.
State 2 statistics
include all enrollees employed at any time between third quarter 1990 and third quarter 1991.
State 3 statistics include alt enrollees
employed first or second quarter 1987.
(5) The letter "C" indicates that a cell has been censored because fewer than three observations are found in this cell.
This is necessary to
comply with confidentiality requirements.
BE
ST C
OPY
AV
AIL
AB
LE
205
to:
The comprehensive data platform allows practitioners and program analysts
review the overall picture of employment and earnings outcomes fromall the available data sources;
analyze the findings among the programs; and
propose related questions raised by the data for policy andmanagement purposes.
Data Ana iris
The purpose of data analysis is to determine the employment and earnings
outcomes related to vocational education programs. Data analysis will help to provide
answers to:
"consumer rights" questions;
policy questions; and
questions regarding the attainment of postprogram performancestandards.
The issues that were raised repeatedly by educators that need to be
considered in the data analysis phase include:
differences in student demographics across programs within aninstitution and across institutions in the state;
labor market dynamics such as discriminatory practices that mayinfluence the employment opportunities of women and ethnic minoritystudents; and
local economic conditions such as the current recession in which evenpeople in highly skilled Jobs have experienced job loss, includingprofessional workers and middle-level managers.
As has been said numerous times in the text of this report, conducting
multivariate analysis to determine the relationship between various factors is needed
184
2ej
to ensure that the entire picture is being presented to policymakers, administrators,
and educators for consideration of future action.
Additional questions can arise from data analysis. For instance, the
demonstration project found that the earnings of former female students were
significantly lower than earnings of former male students which introduced the
following question:
Why are more women not being encouraged towards careers in thehigher paying occupations and away from the lower-payingoccupations that offer little advancement or training for pursuing workin new fields?
Of course, the interests of the women must be considered when providing
Gamer counseling. But biases on the part of counselors or instructors regarding
women's roles can play a part in the career counseling women receive.
Interpretation of Data
The authors of this report have frequently cautioned the readers about careful
interpretation of data. This holds true for analysts examining data for programs within
an institution or in making comparisons among institutions within the state.
Preliminary data often present a picture that needs more clarification which
longitudinal data may be able to provide, such as in trends over time and the effects
of the trends on the !abor market experiences of former students. Data analysis
should not be done in a vacuum, especially with postprogram outcomes of
vocational/technical education.
Before interpreting data, review the following checklist:
1. Review questions that need to be answered. (See Chapter Three forexamples of typical questions that prospective students, policymakers,and educators may have.)
185
2f,"
2. Note differences in reporting between public and privatepostsecondary vocational education institutions.
3. Develop a common core of data elements which would permit moreroutine tabulations of information for 'consumer rights" purposes.
4. Consider linking data about community college enrollees withinformation about subsequent enrollment in four-year colleges anduniversities, especially for students who obtain associate degrees.
5. Use longitudinal data for refined multivariate analysis to discoverreliable predictors of employment and earnings differences.
6. As contract and temporary employment become more common, thechallenges in earnings measurement will increase. Consider howthese changes in the job market will affect the accuracyof employmentand earnings outcomes in the state. Seek data on "contingencyworkers from SESAs and SOICCs for comparison purposes in dataanalysis.
7. Be sure to use statistical data as a starting point in the investigation ofworkplace experiences of former students along with contextual factorssuch as employment opportunities in the local economy.
8. Remember that the choice of unit(s) of analysis predetermines thetypes of findings that can arise. Also, the smaller the unit of analysissuch as a particular semester's degree recipients in a single school'scurriculum specialization the more likely it is that censoring of sometypes of data may be necessary to protect the anonymity of formerstudents.
9. In analyzing earnings data, review the employment rates of thestudents in the data base as the demonstration project found thatdifferences in outcomes often occurred in labor force participationrates, rather than in the earnings of those students who continued towork.
10. When releasing information gained from data analysis to the public, arule of thumb is that percent employed and average earnings figuresshould always be carefully drawn from the same student populationand be presented together. Otherwise, the public will be receiving amixed bag of apples and oranges and misunderstanding can be theresult
In conclusion, using administration wage records to track the workplace
outcomes of former students present unique opportunities for data collection and
186
analysis in the postsecondary vocational education community and challenges in the
accurate interpretation of the data. Practitioners and program analysts are
encouraged to use the knowledge and experience gained from the demonstration
project as described in the report as well as the references listed in the Endnotes to
develop a system for linkage between institutional and administrative records.
187
11 ^,2
ENDNOTES
1. See: King, Christopher T. (1987). Performance Standards in Job TrainingandJob Placement Programs. Washington, DC: National Association of Counties.(35 pp.); and, in chronological order: Stevens, David W. (1981). "Assessingthe effectiveness of vocational education and CETA programs through the useof routinely available administrative data." In The Federal Role in VocationalEducation: Sponsored Research. Washington, DC: National Commission forEmployment Policy. (pp. 185-213); Stevens, David W. (1983). "Outcomes forvocational education: Economic perspectives." In McKinney, Floyd L. &Fornash, Patricia (Eds.). Selected Evidence Supporting or Rejecting EighteenOutcomes for Vocational Education. Columbus, OH: The National Center forResearch in Vocational Education, The Ohio State University. (pp. 185-215);California Community Colleges (1984). Placement Rate Concept.Sacramento, CA: The Chancellor's Office, California Community Colleges. (67pp.); Stern, David (1988). Performance-Based Public Policy TowardPostsecondary Vocational Education: Some Economic Issues. Berkeley, CA:The National Center for Research in Vocational Education. (41 pp.; draft);Butler, Eric Payne (1988). 'The search for a bottom line in education andtraining: What lessons are offered by the Job Training Partnership Act?"Waltham, MA: Brandeis University. (5 pp.); National Commission forEmployment Policy (1988). Evaluation of the Effects of JTPA PerformanceStandards on Clients, Services, and Costs. Research Report Nos. 88-15, 88-16, and 88-17. Washington, DC; Stevens, David W. (1989). Using StateUnemployment Insurance Wage-Records to Trace the Subsequent LaborMarket Experiences of Vocational Education Program Leavers. Washington,DC: National Assessment of Vocational Education, U.S. Department ofEducation. (56 pp.); Hoachlander, E. Gareth, Choy, Susan P., & Brown,Cynthia L. (1989). Performance-Based Policies Options for PostsecondaryVocational Education: A Feasibility Study. Washington, DC: NationalAssessment of Vocational Education, U.S. Department of Education. (136pp.); Goodwin, David (1989). Final Report Volume IV: PostsecondaryVocational Education, Washington, DC: National Assessment of VocationalEducation, U.S. Department of Education. (pp. 107-129); Office of TechnologyAssessment (1989). Performance Standards for Secondary School VocationalEducation: Background Paper. Washington, DC: Science, Education, andTransportation Program, Office of Technology Assessment, U.S. Congress. (80pp.); Center on Education and Training Employment (1990). Vocationaleducation performance standards. ERIC Digest No. 96. Columbus, OH:Clearinghouse on Adult, Career, and Vocational Education, The Ohio StateUniversity. (2 pp.); Bab John & Trott, Charles E. (1991). A Feasibility Studyof the Use of Unemployment Insurance Wage-Record Data as an EvaluationTool for JTPA. Washington, DC: National Commission for Employment Policy.(118 pp.); Hill, Paul T. (1991). Performance standards, accountability, andlocal service delivery. (2 pp.; dated March 15 with no other identifyinginformation); Harmon, Tim (1991). JTPA performance standards: Briefing forIllinois State Board of Education Committee of Practitioners. Springfield, IL:
188
2i
Job Training Programs Division, Department of Commerce and CommunityAffairs. (8 pp.); Bross, Nancy (1991). Issue Paper: Using UnemploymentInsurance Wage Record Data for JTPA Postprogram Performance Standards.Chapel Hill, NC: Research and Evaluation Associates, Inc. (21 p. +appendices); and, Bross, Nancy (1991). Findings of the Technical Workgroupon Using Unemployment Insurance Wage Record Data for JTPA PerformanceStandards. Chapel Hill, NC: Research and Evaluation Associates, Inc. (15 pp.+ appendices).
2. Colorado and Florida are the leaders in sustained commitment; but Arizona,Illinois, Maryland, Missouri, Ohio, Oklahoma, Utah, Washington, and Wisconsinhave each contributed to the refinement of either the process or the contentof what is presented here.
3. This demonstration project was one task of a contract performed by Researchand Evaluation Associates for the U.S. Department of Education on "ConsumerRights Information in Postsecondary Education" (Contract No. EALC890010).
4. Due credit should be given to pioneering efforts by colleagues in Arizona,Colorado, Florida, Missouri, Ohio, Washington and Wisconsin, who createdmerged data sets similar to those that are described here. The originalaspects of the just completed demonstration are its Introduction of measuresof local economic conditions to adjust employment and earnings outcomes,its diagnostic approach to meeting the interests of multiple constituencies, andthe length of post-program coverage that is investigated.
5. America's Choice: High Skills or Low Wagesl National Center on Educationand the Economy, Rochester, New York, 1989. Office of TechnologyAssessment, Retraining America's Workers, Washington, DC, 1991. TheLearning Enterprise, America Society for Training and Development,Alexandria, VA, 1989.
6. P.L. 98-369, Section 1137.
7. Section 1137 of the Social Security Act was adopted pursuant to the DeficitReduction Act of 1984. This section requires each state to establish andmaintain an income and eligibility verification system that incorporatesUnemployment Compensation, Aid to Families With Dependent Children, FoodStamps, and Medicaid Assistance features.
8. Michigan's Employment Security Commission requires covered employers tosubmit quarterly wage reports only in compliance with state and Federal lawsrequiring an "Income and Eligibility Verification System" (IEVS)the informationis not used in the day-to-day administration of the State's unemploymentcompensation program.
9. Carl D. Perkins Vocational and Applied Technology Act of 1990, Section115(a).
189
2
10. Ibid, Section 115(b)(2)(D).
11. Ibid, Section 115(c).
12. Gene Streagle, a high school principal, quoted in "Low Grades for Md. ReportCard," The Washington Post, November 11, 1991, p. B1.
13. Ibid.
14. Ibid.
15. Richard D. Wood, Chairman of the Board of Eli Lilly and Company,headquartered in Indiana, quoted in a one-page advertisement titled"Corporate Roundtable: Competing in a New World," The Washington Post,November 26, 1991, p. A18.
16. The Assistant State Superintendent who is in charge of Maryland's SchoolPerformance Program is quoted in The Washington Post articles as saying,"we are considering whether we're getting a pass-through phenomenon [inresponse to a 96 percent pass rate standard for grades one through six].That was one of the standards most systems met this year and last year,which makes you say, 'Whoa. How are they getting there so fast?'" Refer toHill's admonishment, cited in the Appendix to this report, thatstates,"inappropriate comparisons of performance between dissimilar entitiescan distort management behavior."
17. The U.S. Department of Labor has drafted regulations that would offer eachstate a recommended procedure for making administrative records availableto external parties. The proposed regulations appear in the March 23, 1992issue of the Federal Register.
18. The pace and content of change is so state specific that only a minimalattempt is made here to describe how individual states have responded to, orin some cases anticipated, the 1990 Perkins Act's language. Florida andOregon have taken a legislative approach to creation of an integratedmultiagency tracking capability. Illinois and Maryland are relying uponadministrative direction to achieve the same objective.
19. One frequently asked question cannot be answered directly, "Did the formerstudents get jobs using the skills they acquired at the community college?"
20. John Baj, co-author of A Feasibility Study of the Use of UnemploymentInsurance Wage-Record Data as an Evaluation Tool for JTPA, first made thispoint in conjunction with his matching of interstate data for Job TrainingPartnership Act performance standards investigations.
21. The Job Training Partnership Act system is deliberating this issue. It isimportant to establish and maintain a dialogue with those who are responsiblefor policy decisions about this matter. The National Commission for
190
2 1 i
Employment Policy, Northern Illinois University's Center for GovernmentalStudies, and the Division of Performance Management and Evaluation in theEmployment and Training Administration of the U.S. Department of Labor areimportant contacts on this issue.
22. Unit record information about the former students was obtained from thestate's community college oversight agency, with written authorization from anadministrator at each of the five colleges.
23. Florida's Education and Training Placement Information Program collects U.S.Postal Service information as well. No attempt to pursue this administrativedata was made during the demonstration project. If future requests areanticipated, then the importance of a consolidated submission must beconsidered. The issue is identical to that associated with U.S. Office ofPersonnel Management, U.S. Department of Defense Manpower Data Center,and adjacent state data requests.
24. Actually, it can only be said that these were first time enrollees at the particularcommunity college that reported this status. A student may have beenpreviously enrolled at another postsecondary institution in this state or inanother state.
25. Here, "reported" earnings refers to the quarterly reports submitted by thestate's employers who are required to comply with the unemploymentcompensation law. There is no self-reporting of earnings by former studentsincluded in this table.
26. This may be due to many different reasons, such as the volatility of the realestate market during this period.
27. It is surprising that the average earnings of these former students increasedfrom 1988 to 1989, and then again from 1989 to 1990. This is the point atwhich additional information is needed to interpret this apparent contradictionof general conditions in the real estate sector. Did these people actually workin real estate? Did they work only in real estate? Would their earnings levelbe expected to reflect changes in the flow of sales t)ommissions? Someevidence pertinent to these questions can be extracted from the wage recorddata, when they are combined with available information about industryaffiliation. Additional information would have to be sought through othermeans.
28. The issue becomes complicated very quickly. Reference to year-roundemployment does not mean that the former students are employed full-timeeach week throughout the year. The selection criterion used here onlyrequires that some earnings were reported in each of the four quarters in adesignated year. No floor level of earnings was established. Tests wereconducted using the quarterly earnings equivalent of full-time employment atthe applicable minimum wage rate as a threshold criterion. This lowers the
191
2 1 t)
number of former students who are reported as employed. Also, refer toStep 3 in Chapter Seven to the section entitled multiple wane records, thatquarterly earnings can arise from one job, sequential jobs, or concurrent Jobs.No attempt has been made in the platform tabulation to distinguish amongthese circumstances.
29. It must be recognized that voluntary cooperation in facilitating arms-lengthperformance measurement may not occur. In this case, mandatory reportingof a consistent core of data elements will be required, if the performancemeasurement goal is taken seriously.
30. See: Florida Education and Training Placement Information Program (1990).Annual Report. Tallahassee, FL: Florida Department of Education. (76 pp.+ appendices).
31. Research and Evaluation Associates (1991). Consumer Information inPostsecondary Education: Case Studies of Three States, p. 2-6.
32. Research and Evaluation Associates (1991). State-Level Measurement ofPerformance Outcomes in Postsecondary Vocational Education, Volume I: ASummary of State Policies, submitted to the U.S. Department of Education,Washington, D.C, pil.
33. Ibid, p.6.
34. Ibid, pp. 10-15.
35. Pfeiffer, Jay J., Director of Florida's Education and Training PlacementInformation Program (FETPIP), and David W. Stevens, Director of the Universityof Baltimore's Regional Employment Dynamics Center, State and NationalPerspectives of Whether and How to Attempt to Use State UI Wage Records,for Research and Evaluation Associates (1992), p. 9.
36. Statistical data that do not reveal the identities of individuals or employers mayintentionally affect the future rights, benefits, or privileges of an entire class ofindividuals. This is one of the important reasons for undertaking evaluative,or diagnostic, researchto advance management effectiveness. This is whythe U.S. Department of Labor's proposed regulations for the release ofconfidential records would require states to inform both claimants andemployers that UI wage record data might be used for purposes other thanthe day-to-day processing of claims. See: Federal Register, March 23, 1992,Section 603.15 (a) and (b).
37. Ibid, p.7.
38. Ibid.
39. Ibid, p. 10
192
21
40. Ibid.
41. The Family Educational Rights and Privacy Act of 1974 (Pl. 93-568, 20 USC1232g) is commonly referred to as 'The Buckley Amendment."
42. Pfeiffer, Jay J. and Stevens, David, W., op cit., pg. 12.
43. Ibid, pp. 12-14.
44. Ibid, p. 5.
45. See Section 603 of the March 23,1992 issue of the Federal Register forproposed regulations for the release of confidential administrative recordsissued by the U.S. Department of Labor.
46. See: Ohio Bureau of Employment Services (1991). Confidentiality of Bureauinformation. Administrative Directive No. 5-91. January 10. Columbus, OH:Author. (2 pp.); and Policy on Release of Confidential Information, which isappended to the Directive; Illinois Department of Employment Security (1989).Final Report and Recommendations of the Sub-Committees of the IDES DataRelease Policy Committee. Springfield, IL: Author; and Illinois Department ofEmployment Security (undated). Data Release Information Booklet.Springfield, IL: Author. Also, see David W. Stevens' chapter in a forthcomingvolume by the National Commission for Employment Policy on the use ofState UI wage records for JTPA follow-up purposes, for state-by-stateexamples.
47. Again, the definition of earnings is state specific. Most states require areporting of the cash equivalent value of non-wage or salary compensation(e.g., meals, tips, etc.). The accuracy of such reporting is uneven. Bonuses,which are becoming an increasingly important part of total compensation, arereported during the quarter in which they were received. This introduces aquarter-to-quarter unevenness that has not been examined to date, which mayintroduce a significant bias if only one quarter of data is used for performancemeasurement purposes (e.g., in Florida's Education and Training PlacementInformation Program).
48. Employers actually report two identification numbers--their Federal EmployerIdentification Number and the state-specific number assigned by the state'sunemployment compensation agency. An employer with facilities in more thanone state will have multiple state-specific employer identification numbers.
49. In most states employers are permitted to report using a geographic locationcode other than the specific site at which a particular employee or group ofemployees work. For example, a headquarters address, or even a service-bureau address, can be used. These state-specific practices are beingreviewed because of the increased interest that is being shown in knowinghow a company's total employment is distributed geographically within a state.
193
21;
50. Using a four-digit Standard Industrial Classification code.
51. Alaska is an exception; a state law requires occupational reporting in supportof native-Alaskan equity interests. Other states have tested the concept. See:State Job Training Coordinating Council/Council on Vocational Education(1988). Occupational Identifier Project: Legislative Report. Tallahassee, FL:Author. (56 pp. + appendices). Washington's State Board for Communityand Technical Colleges, and Washington's Employment Security Department,have used staffing pattern Information by Standard Industrial Classificationcode, collected by the Bureau of Labor Statistics' SESA OccupationalEmployment Statistics Program, to determine whether former students areworking in an industry that includes occupations that utilize the skillsassociated with their occupational preparatory course work. This requires amatch of Classification of instructional Programs (C1P) codes and Star. lardIndustrial Classification (SIC) codes. See: Washington State Board forCommunity College Education (1990), op cit, pp. B-4 and B-5.
52. Employers have not adopted a uniform occupational classification system(e.g., the Dictionary of Occupational Titles), which means that someone wouldhave to translate employer classifications into a common classification. Evenif this is done, many question the adequacy of any existing occupationalclassification system to serve the education community's needs. See:Stevens, David W. (1991). Canada's National Occupational ClassificationTaxonomy. Washington, DC: Advisory Panel on Revision of the Dictionary ofOccupational Titles, U.S. Department of Labor. Florida's Education andTraining Placement Information Program (FETPIP) manages a comprehensiveemployer-contact activity to collect occupational Information directly. See:FETPIP (1990), op cit, pp. 30-35.
53. Other exclusions include philanthropic organizations, some small agriculturalemployers, and some nonprofit agencies.
54. Late reporting occurs, which introduces a tradeoff between the timeliness ofdata availability and accuracy of coverage. The author is undertaking aninvestigation to determine the implications of late reporting for performancemeasurement uses of the data.
55. Maryland's wage-record data are provided to the University of Baltimore'sRegional Employment Dynamics Center for archiving during the first week ofthe fourth month after a quarter ends.
56. Research and Evaluation Associates, Draft report, The Use of State WageRecords as Performance Outcome Measures: An Overview for Policymakers,1991, p. 6.
57. The salary amount shown is the annual rate for full-time, full-year employmentin the designated occupation taking within-grade step increases into account.
194
This figure cannot be interpreted as the actual amount of money that has beenpaid to the employee during a particular year.
58. During the 1980's, and continuing into the 1990's, there has been a substantialincrease in the use of vendor services by the Federal government, which hastransferred many of those who are fult,iing traditional governmentresponsibilities from the Federal payroll to vendor payrolls, including temporaryhelp agencies.
59. Baj and Trott (1991), op cit, pp. 15-16.
60, Smith, Gregory P. (1989). A Longitudinal Tracking Study of Short-TermEducation and Employment Outcomes of Colorado Community CollegeGraduates. Denver, CO: Community College and Occupational EducationSystem; Strong, Merle E. & Jarosik, Daniel (1989). A Longitudinal Study ofEarnings of VTAE Graduates. Madison, WI: Vocational Studies Center,School of Education, University of Wisconsin; Washington State Board forCommunity and Technical College Education (1990). Vocational OutcomesIn Washington Community Colleges: Baseline Report. Oly ripla, WA: Author;and Pfeiffer, Jay J. (1991). FETPIP status update. Memorandum.Tallahassee, FL: Florida Education and Training Placement InformationProgram, Florida Department of Education.
61. See: Stevens, David W. (1991). The Confidentiality Provisions of StateUnemployment Compensation Laws. Washington, DC: National Commissionfor Employment Policy. (27 pp.). This paper provides an accurate compilationof the confidentiality requirements found in each of the 50 state unemploymentcompensation laws, which control the availability of SESA wage record data.This report documents the fact that no state law prohibits the use of wage-record data for appropriate performance measurement purposes, if individualand enterprise anonymity are assured. Having said this, many of the statelaws grant the SESA Administrator discretionary authority to determine whetherthis requirement is met.
62. See: Florida Education and Training Placement Information Program (1990),loc cit.
63. The State Board for Community Colleges in one state, and the CoordinatingBoard for Higher Education (in cooperation with the American College TestingService) in the other state, provided the school-based unit-record informationafter appropriate confidentiality assurances had been given.
64. The Association of Private Career Schools in each of the two cooperatingstates provided a forum for the author to recruit volunteers from among theAssociation's membership.
65. The author has already archived the universe of wage record data for the twocooperating states, covering the period 1983 through 1989 (third quarter
195
2 "
records only for each year) for one state and covering 1985 second quarterthrough 1991 second quarter (including all intervening quarters) for the secondstate. See: Middlebrooks, Charles 0. & Stevens, David W. (1991). A multi-state wage-record archive: Simultaneous achievement of economies of scale,quality control and data base security. Building Information Partnerships:Conference Proceedings. Washington, DC: National Governors' Association.
66. Washington State Board for Community and Technical College Education(1990), loc cit.
67. Recent creation of the Career College Association, through a merger of theNational Association of Trade & Technical Schools and the Association ofIndependent Colleges and Schools, may result in some inertia to create acommon core of data items that many member schools will voluntarily adopt.The self-interest motive for such action would be to provide reliabledocumentation of student characteristics, curricula offere.. 3rtificates anddegrees awarded, and post-program employment and earnings achievementsof former enrollees. This report suggests that voluntary career schooladoption of the model approach that is described could be expected to havean important "policing" effect on those career schools that choose not toprovide the public vvith credible postprogram outcomes information.
68. There is widespread confusion about a school's authority to release studenttranscript information that includes a social security number identifier. TheFamily Educational Rights and Privacy Act of 1974 (P.L. 93-568, 20 USC1232g), commonly referred to as "the Buckley amendment", is often allegedto prohibit the release of personally identifiable information without the priorwritten consent of the former student. In fact, prior consent is not required ifthe disclosure is for the purpose of evaluating Federal programs, or for theconduct of studies that are intended to improve the educational process, if thethird-party receiving the information to perform the analysis agrees in writingnot to redisclose the former student's identity. Also see Stevens (1991) forcomprehensive documentation of how the SESAs are dealing with this issuein a noneducation context. An extraordinary paper on this topic is Reynolds,Paul D. (1991). Privacy and Advances in Social and Policy Science: BalancingPresent Costs and Future Gains. Revision of a paper originally presented ata Conference on Data Access Through Disclosure Limitation. Convened bythe National Academy of Sciences. Washington, DC. March 1991.
69. Fictitious numbers may be easily detected, if the reporting party does notknow that the Social Security Administration uses specific digits for accuracyauditing purposes, and that regional sequences of numbers are used.
70. The Internal Revenue Service now requires a social security number to bereported for each dependent who is claimed on a Federal tax return. Thispermits the IRS to compare tax returns to determine if one person is beingclaimed as a dependent on more than one tax return. The author does notknow how this requirement has affected the incidence of coverage to date.
196
2!
71. According to Jay Pfeiffer in Florida, there are no known studies of theaccuracy of social security numbers for the purpose of matching informationbetween data bases. However, Florida has developed an algorithm that rused to test the validity of social security numbers reported in Florida. Thisprocedure "kicks out" 2.5 to 3 percent of the reported social security numbers.
72. Reynolds, Paul D. (1991), loc cit, distinguishes among active Informedconsent, passive informed consent, and proxy active informed consent. Onthe one hand, active informed consent typically is assumed to require the wellknown conditions of rational judgment, full information about the "conditionsassociated with the decision," an absence of coercion, and full awareness ofthe potential consequences that could resift from offering the consent.Passive informed consent, on the other hand, is simply assumed in theabsence of any contradictory action. And proxy active informed consentallows an intermediate authority (e.g., a teacher, school administrator, orschool board) to make an explicit determination that passive informed consentis applicable.
73. An anomaly in the interpretation of CIP-coded data arises from the commonemphasis placed on nonduplication of existing programs in the review of newprogram proposals by state education authorities. This results In "creative"descriptions of programs that justifies placing them in a CIP code that willallow approval. The Carl Perkins Act's emphasis on new activities creates asimilar Incentive to "repackage" existing activities so they qualify for Federalfunding.
74. Loretta Seppanen, who has used CIP-coded data in research conducted forWashington's State Board for Community and Technical Colleges, says that"...to look at the data at CIP level is not useful for policy decision makingtoomuch data. We have 17 groupings that are usefulmostly CIP at 2-digit withsome variation."
75. This is exactly what happened in Arizona's ill-fated attempt to rush matchedschool -based and SESA wage record information into the public domain. See:Hoachiander, Choy, & Brown (1989), loc cit.
76. An alternative to increasing the level of investment in accuracy has sometimesbeen to invest in the development of figures that are consistent with theadministrative outcome that is desired. For example, so-called "supply anddemand" figures published by a State Occupational Information CoordinatingCommittee (SOICC) might be used when they are supportive of a desiredmanagement strategy, but they might be challenged with another source ofdatasuch as a costly local survey of employersif the SOICC informationcontradicts the desired outcome.
77. This is only true if accuracy is important; i.e., if the data to be collected will beused to support visible policy and management decisions.
197
2 1
78. Colorado, Florida, and Washington exemplify this approach at the secondaryand postsecondary levels.
79. There is no intention here to assign motives to this inaction. Owners of small,start-up businesses are often overwhelmed and less informed about requiredactions. Motives do not matter here. What matters is that nonreportingtranslates into an inability to retrieve information about the employees of thatbusiness.
80. See endnote 48, which distinguishes this state-specific identification numberfrom a firm's Federal Employer Identification Number, which is used forFederal tax reporting purposes. This distinction is important if there is anyintention to attempt interstate matching of wage records to determine whetheran employee is still working with the same employer, but in another state. Itis unlikely that this issue will matter to most readers.
81. There are obvious nuances to this issue. Employees who travel among sites,or who have no assigned home-base, must be reported through some unit.The Bureau of Labor Statistics, in cooperation with each of the SESAs, isintroducing a Business Establishment List program, which encouragesemployers to report the total number of employees by work site each quarter.However, this is not the same as reporting each individual employee by worksite. Most multi-establishment businesses know the specific profit-center towhich each employee is assigned. Virtually all multi-establishmentbusinesseshave automated personnel data systems. There would be little burden placedon covered employers if a SESA required routine reporting of employeeearnings by work site. However, there is no particular benefit to a SESA'sunemployment compensation unit in requesting this information. Any initiativeto introduce such a requirement must come from a SESA's labor marketinformation unit or from the state's legislature, which hasa compelling interestin being able to more accurately monitor local labor market dynamics withinthe state.
82. Bonuses are awarded at specific times, which means that quarter-to-quarterearnings profiles may differ by substantial amounts. Readers must determinehow this unevenness will affect what they want to know, and how thistranslates into the selection of one or more quarters of wage-record data forpostprogram measurement purposes.
83. There are some tricks of the trade to sort out these possible circumstances.For instance, appearance of one employer identification number in sequentialquarters, accompanied by the appearance of a second employer identificationnumber in only one of the quarters, hints that the multiple wage records mayrepresent sequential employment. However, there are no foolproof ways todisentangle the possibilities.
198
2 2 J
84. Florida and Washington require employers to report a time-unit of work, aswell as total qua' terly earnings; but many observers in each state question theaccuracy of this data element, since it is not used in the administration of theSESA's own unemployment compensation program.
85. The U.S. Department of Labor created an Advisory Panel on Revision of theDictionary of Occupational Titles last year to review what changes might beneeded in the DOT as a result of these new industrial relations practicesongoing technological change, and international events.
86. Data processing was handled at the University of Baltimore's RegionalEmployment Dynamics Center data processing facility, which includes adedicated Hewlett-Packard 9000 Series 370 Workstation, 2.4 gigabytes ofharddisk storage, a tape &hie, and a 650 megabyte rewritable optical disk drive.
87. For example, an IBM mainframe computer would generally not be able to reada nine-track tape written on a Hewlett-Packard workstation, because the IBMexpects EBCDIC characters with a particular header, while the HP typicallywrites ASCII characters with no header. Use of a nine-track tape with fixedrecord length is a practical solution in most cases. ASCII-EBCDIC conversionutilities are available.
88. There is a tradeoff between this ease of response and the consequences ofreleasing data elements that are not required to satisfy the third-party request.
89. Florida's 1990 Annual Report, op cit, p. 8, exemplifies how an experiencedmanagement team approaches this issue.
90. The higher education coordination authority can link the former student datawith subsequent enrollment in four-year institutions in the state, which neitherof the other sources can do. The individual community colleges maintain dataelements other than those that are submitted to the state. So, a preferenceamong the three possible sources might arise from these considerations.
91. Remember that it will be necessary to "sell" the concept of independent third-party assessment. Only the most confident of managers will voluntarilyrelinquish control over performance measurement responsibilities. This risk-aversion can be limited, to some extent, by promising institutional anonymity,and then honoring that commitment without exception. This is the approachthat was taken for demonstration purposes. Of course, it is important to thinkthrough the consequences of offering anonymity--this may not be consistentwith the intended purpose for the postprogram outcomes measurement.
199
APPENDIX
OUTCOME MEASURES VERSUS PERFORMANCE STANDARDS
200
22,,
APPENDIX
OUTCOME MEASURES VERSUS PERFORMANCE STANDARDS
Cot jcpe ts
An outcome measure must be distinguished from a performance standard)
An outcome measure can be any quantitative or qualitative indicator that calibrates
different levels of accomplishment. A performance standard identifies a threshold
level of achievement using this measure, which then serves as a target.
There has been substantial confusion about both the intent and practice of
setting performance standards. Some view a standard as a goal that is virtually
unreachable, like the artificial rabbit at a greyhound racetrack, and which serves as
an incentive to perform at the highest level possible. Others view a performance
standard as a minimum level of accomplishment, a finish line that, once crossed,
pursuit stops. Still others interpret a performance standard as a straightforward
management tool, which lets all parties know ahead of time what are considered to
be satisfactory and unsatisfactory performance levels.
These interpretations leave substantial room for disagreement about what
steps management should take when actual outcomes are known. Many fear
performance standards as a punitive device, having seen an imbalance in
management responses to deficient versus exemplary performance. Some question
the fairness of performance standards practices as they actually unfold, arguing that
they often fail to take into consideration the influence of factors over which little or no
201
2 9
control is exercised. Each of these issues has been addressed in Chapter Four of
this report.
The treatment of performance measures and standards that is offered here is
necessarily generic. In any specific application, each measure and standard must be
identified with a particular unit of analysis (e.g., a student, all enrollees in a course,
completers of a sequence of courses, all school leavers, etc.), and with respect to a
precise context in time (either a point-in-time or a specific time interval).
Historical Precedents
Three major phases in performance standards implementation in federally
funded employment and training programs have been identified? The first phase,
from 1961 to 1973, rewarded past performance and a vendor's proposal writing skills.
During this period, contracts were awarded based more on historical performance
than on present competence or skills. This is not the typical definition of
performance-based funding, in the sense that a flow of funds is made contingent
upon performance after a specified starting date.
A second phase was ushered in with passage of the Comprehensive
Employment and Training Act (CETA), which shifted from historical performance as
a funding criterion to a needs-based allocation of Federal funds. King concludes that
during this second phase:
...there were no particular performance expectations orrequirements placed on local efforts beyond reportingrequirements;...
In the mid-1970s there were signs of change. TheDepartment of Labor began to establish goals andexpectations of varying degrees of specificity, including"performance indicator clusters"...
202
Until the 1978 CETA Reauthorization Amendments(P.L. 95-524), performance standards were notmentioned in the authorizing legislation for employmentand training programs. The 1978 Amendmentsintroduced performance standards, but were silent ontheir implications.3
The third phase began with passage of the Job Training Partnership Act
(JTPA) in 1982. Federal JTPA funds were then allocated on both a needs and
performance basis, with the greatest weight continuing to be placed on need criteria.
King reports that:
...full-scale implementation of performance standardstook place in Program Year 1984....With the provision of[incentive] awards across the country in the fall of1985 - based on PY 1984 performance--the reality ofthese new provisions began to take hold.
Application of sanctions for failure to meet or exceedstandards for two years occurred for the first time in late1986. With the completion of the first two-yearperformance management cycle, program accountabilityvia performance standards, incentives and sanctionshad truly arrived.4
Practitioners and policymakers can benefit from the lessons that have been
learned in JTPA.5 However, all interested parties must maintain a balanced sensitivity
to both important differences and common interests. A poorly informed rush to
impose a single uniform model on all three systems would be a serious mistake. The
following sections discuss principles, measurement processes, and the relevance of
employment and earnings outcomes measures.
203
2 9 ""
Principles
Among the important performance measurement perspectives identified in the
available literatures are:
King
Performance standards should be designed primarily to encouragegood performance, not to punish deficient performance;
Only good performance should be rewarded, not good intentions;
Deficient performance that is clearly attributable to causes beyond amanager's control should not be punished;
Substantial attention should be given to encouragement of internalimprovement (competition against own previous performance) withoutregard to external comparisons;
Performance standards derived through the use of appropriateadjustment models can serve as an effective management tool;
Numerical performance standards of this type should serve as thebeginning point for oversight and management dialogue, not as theending point; and
Good performance involves more than meeting, or even exceeding, aperformance standard.
Hoachlander--
Performance measure definitions should be unambiguous;
These measures should be subject to routine and accuratemeasurement;
Only a few measures should be chosen;
Actual measurement should occur regularly; and
Resulting data should be made available to all interestedconstituencies.
Hill
Overemphasis of national performance standards can weaken localaccountability practices, if externally required measures are substitutedfor local process monitoring, and if administrative attention is divertedto a higher management level;
Uniform standards can promote "gaming"; and
Inappropriate comparisons of performance between dissimilar entitiescan distort management behavior.
These principles are reflected in the 1989 postsecondary performance
incentive recommendations of the U.S. Department of Education's National
Assessment of Vocational Education:
After studying experiences under the Job TrainingPartnership Act (JTPA), other state employment andtraining programs, as well as approaches that stateshave used in attempting to introduce performance-based elements into their educational systems, NAVErecommends two specific performance incentivemechanisms:
1. A performance information system todiss-. inate information to students,policymakers, employers, and the publicon the performance of vocationaleducation Institutions; and,
2. A performance-based funding systemthat distributes financial aid to institutionsaccording to performance-based fundingformulas.
The Mechanics of Measurement8
It has already been stated that a goal in conducting performance measurement
and in establishing performance standards is to provide a widely accepted uniform
metric of accomplishment. This requires a sensitive balancing of common definition,
quality control, and allowance for situational differences? For example, JTPA
205
2`?
performance standards "... are constructed using a statistical technique called multiple
regression analysis. This process allows multiple local factors to be considered
simultaneously and determines the amount of variation in performance--for a given
measurethat is independently attributable to each local factor contained in the
model."1°
At the outset, seven JTPA performance measures were specified:
1. Adult entered employment rate;
2. Adult cost per entered employment;
3. Adult average wage at placement;
4. Adult welfare entered employment rate;
5. Youth entered employment rate;
6. Youth positive termination rate; and
7. Youth cost per positive termination.
Each of these seven measures is an immediate outcome. Only one of the
sevenyouth entered employment rateis still retained today. The others have been
replaced by postprogram outcomes:11
1. Adult follow-up employment rate;
2. Adult average weekly earnings in the 13th week aftertermination;
3. Adult welfare follow-up employment rate;
4. Adult average weekly earnings for welfare clients in the13th week after termination; and
5. Youth employability enhancement rate.
206
To date, these measures have been recorded through state and local JTPA
management Information systems and telephone follow-up programs. Recently,
interest has been building to offer the states an option to use SESA UI wage records
instead of, or in addition to, the telephone follow-up activity.12
This report provides a bridge from this JTPA experience to the education
community, particularly to the occupational program sectors of the postsecondary
education community.
The Relevance of Employment and Faminas Outcome Measures
Three questions might be asked about measures of employment and earnings
for former students:
(1) Are these measures relevant?
(2) Are they important?
(3) Are they sufficient?
Few question the relevance of these measures for judging education's
performance. Substantial disagreement arises when the importance of these
measures is discussed, particularly with respect to differences in objectives among
curriculums and type of institution.13 No one would defend the sufficiency of these
measures for assessing education. Therefore, it is generally acknowledged that
measures of employment and earnings are relevant and important, but are not
sufficient to document educational outcomes.
207
2 9 '3
Consider selected alternatives14 to the use of employment and earnings
measures of vocational education's performance:
Competency Attainment- -such measures are certainly relevant15, butthey too fall short of sufficiency if (1) nothing is known about bench-mark competencies that were already in place upon entrance into thevocational education setting (i.e., there is no baseline measure or wayto determine the value-added gain due to program participation); or (2)nothing is known about the intention or opportunity to subsequentlyapply these competencies.
Process Accountability--focusing only on what is done, not onconsequences of these actions.
Efficiency addressing the costs of providing the educational serviceswithout reference to the subsequent effects that follow from theseresource commitments.
It is apparent that each of these measures--process assessment, cost figures,
competency attainment, and employment and earningscomplements the others in
providing a more accurate understanding of education's role in our society and
economy.
208
2
Endnotes
1. See: Hoachlander, Gary (1990). Designing systems of performancemeasures. Presentation to the National Association of State Directors forVocational Education. Annual meeting of the American VocationalAssociation. December 1, 1990.
2. King, Christopher T. (1987). Performance Standards in Job Traininocand JobPlacement Pro rams.ns. Washington, D.C.: National Association of Counties (35PP.).
3. King, op cit, p. 12.
4. 'bid, p. 13.
5. The multiple attempts to design a resource allocation formula for the U.S.Employment Service's State Employment Security Agencies system are alsoinstructive.
6. See: King, op cit, p. 18; Hoachlander (1990), op cit, p. 1; and Hill, Paul T.(1991). Performance Standards, Accountability, and Local Service Delivery (2pp.; dated March 15 with no other identifying information); p. 1.
7. Goodwin, David (1989). Final Report Volume IV: Postsecondary VocationalEducation, Washington, D.C.: National Assessment of Vocational Education,U.S. Department of Education, p. 110.
8. This subheading is adapted from King's use of the phrase "TheMechanics of Performance Standards". See: King, op cit, p. 18.
9. Included in this sensitivity is the behavioral quality called common sense.Numerical performance standards should not be carried out in a rote manner.See, for example, Florida Education and Training Placement InformationProgram (1990). Annual Report: August 1990. Tallahassee, FL: FloridaDepartment of Education. (pp. 6-7). This paper describes the evolution ofFlorida's 1984 legislative enactment of a performance standard requiring "that70% of all [public vocational education job preparatory] program completersobtain employment which is related to their training." The spirit of thisadmonishment is also captured in the following sentence excerpted from aneditorial titled "Block That Celebration," which chides overzealous referees fortheir enforcement of a National Football League prohibition of "on-the-fieldcelebrations that are 'prolonged, excessive or premeditated "': "Legislatinggood sportsmanship is difficult at best, but when the enforcers aren't versedin the proper uses of what might be called the Wink Factor [emphasis added],then it can get downright ridiculous," The Washington Post, 9-18-91, p. A18.
209
2 3 :
10. King, op cit, p. 19. The precision of this alleged attribution, especially fordifferent participant cohorts and localities, has been questioned. See: Trott,Charles E., Sheets, Robert, & Baj, John (1985). An Evaluation of ETA's PY85,Title II-A Performance Standards Models and Feasibility Assessment Regarding
a Regional/State-Based Modeling Initiative. De Kalb, IL: Center forGovernmental Studies, Northern Illinois University; Trott, Charles E., Baj, John,
Fahey, Sean, & Sheets, Robert (1987). Development of JTPA. Title II-APerformance Standards Models for the States of Rec..,ion V. DeKalb, IL: Centerfor Governmental Studies, Northern Illinois University; and, Baj, John & Trott,Charles E. (1968). State-Based Performance Standkuds Models. Washington,DC: National Governors' Association.
11. See: Harmon, Tim (1991). JTPA performance standards: Briefing for IllinoisState Board of Education Committee of Practitioners. Springfield, IL; JobTraining Programs Division, Department of Commerce and Community Affairs(8 pp).; and Baj and Trott, op cit, p. 93.
12. See: Stevens, David W. (1978). Performance measurement in the CETAsystem. In CETA: An Analysis of the Issues. Special Report No. 23.Washington, DC: National Commission for Employment Policy. (pp. 217-241);and, Bross, Nancy (1991), Findings of the Technical Workgroup on UsingUnem o ment Insurance Wa e Record Data for JTPA PerformanceStandards, Chapel Hill, N.C.: Research and Evaluation Associates, Inc. (15pp. + appendices).
13. The Office of Technology's 1989 Background Paper cited in endnote 3 of themain portion of this paper reports that "[a] recent national poll found thatnearly 70 percent of the 265 responding school districts were opposed to theuse of job placement rates as a measure of student success," p. 34, footnote20. This statement refers to use of labor market outcomes as a measure. TheERIC most document, also cited in endnote 3, makes a stronger statement:"Even ii the labor market outcome information could be collected in a valid,unbiaset., and accurate manner, many vocational educators would object tosuch indicators being the P,72le measure of program effectiveness on thefollowing grounds: (1) adopting placement as the primary [emphasis added]criterion ignores the multiple goals of vocational education, (2) a large numberof economic and personal factors beyond the control of the vocationaleducation system determine the employment of students, (3) a narrow focuson placement encourages programs to admit only those who can be placedand to concentrate on coaching in job placement and interview skills at theexpense of vocational skills, and (4) placement rates and other economicindicators measure the gross effect of participation (total place [sic], totalearnings) rather than the net effect (the difference between labor marketoutcomes that occurred when students participated in vocational educationversus what would have occurred had these programs not existed)."Advocates and opponents of the use of employment and earnings outcomesmeasures often shift their position along the continuum from adoption as ameasure, through acceptance as a primary measure, to the unrealistic extreme
210
as a sole measure of performance. Statistical adjustment models are intendedto respond to objections (2) and (3) above. Objection (1) is a 'Throw away"cliche; no one disagrees. Objection (4) is unlikely to be overcome as aroutine practical matter. The remainder of this paper focuses on what can bedone in a routine way.
14. Omitted here is the long-standing interest in training-related employment.Loretta Seppanen reminded one of the authors that most college-leveloccupational preparatory students already have a job. This places a premiumon being able to determine whether the additional education opens new doorsto training-related employment opportunities.
15. Indeed, the Carl D. Perkins Vocational and Applied Technology Act of 1990requires the adoption of a competency attainment performance standard.