29


363
Asian countries have emerged as the world leaders in cashew production over past thirty
years. Cashew production in Asia currently accounts for about 50 percent of global
production. It has held this prime position for almost twenty years, reaching over 60 percent
in some years. India has long been the main cashew producer in Asia, accounting for
between 70 and 90 percent of total Asian production and about 40 percent of the
international market in cashew production. Other Asian countries, particularly Vietnam and
Indonesia, are beginning to expand their production capacities. Indonesia has long been the
second largest producer of cashew in Asia. Production has picked up over the decade, when
it doubled from 30,000 to 60,000 tons. Some of the Indonesian production is exported to
India for processing.
Currently, the four main cashew producing regions are India, Brazil, Nigeria and Tanzania.
Three countries - India, Mozambique and Tanzania accounted for the majority of this
production, while smaller industries had developed in Brazil, Kenya and several other
African countries. Production in Thailand, Malaysia and Sri Lanka has increased steadily
over the past forty years. Cashew is predominantly a smallholder crop in India – about 70
percent of cashews are grown by small-scale farmers. The remaining 30 percent are grown
under re-forestation programs. Cashew yields in India average around 1.5 kg of nuts per
tree.
Cashews rank third in world production of edible nuts that are traded globally. World trade
in edible nuts has experienced relatively rapid growth. Of the total world supply, 110 000
tons are traded on international markets. India (60 percent) and Brazil (31 percent) are major
exporters. Let’s check the export market scenario for Cashew exports from the state of
Andhra.
Cashew nuts Fresh or Dried, in shellCashew nuts Fresh or Dried, in shellCashew nuts Fresh or Dried, in shellCashew nuts Fresh or Dried, in shell [080131[080131[080131[080131 & 080132 & 080132 & 080132 & 080132]]]]

364
Trend in Exports of Cashew nuts
Cashew has gained significant economic and social importance in India as a major foreign
exchange earner. In 1992-93, India exported 53 436 tons of cashew kernels valued at US$160
million. In the same year, a further US $0.8 million was generated through the sale of 4 258
tons of cashew nut shell liquid. India has long been the world’s largest supplier of cashew
kernels with its prices and quality, setting the standards for the industry.
One look the data of India’s export of Cashew nut in shell to the world and partner nations
reveals a very erratic trade pattern in this commodity. The trade in this commodity virtually
lasted till the year 2003, with very irregular trade in the forthcoming years. There is an
exception for the year of 2007 where the value of exports reached the highest figure for the
period under consideration. However, the same could not be sustained, possibly due to the
global economic crisis that soon ensued and the exports in 2008 reduced to one-sixth of
previous level.Exports of Cashew nuts in shell was much better off in overall growth over
last five years than broken cashew nut, however in absolute terms, exports of broken
cashewnut is much higher than the cashew nut in shell and declining trend for last five
years.
Exports of Cashew nuts for last five years (2003-2008)
2004 2005 2006 2007 2008 CAGR
Cashewnut dried in shell 34.726 474.76 3518.886 5425.029 927.723 127%
Cashewnut broken 491685.1 617752 543832.2 530014 667107.3 14%
Roasted Cashewnut 1545.541 2386.617 4853.834 5355.921 6564.337 28.60
Trend in exports in Cashew nut in Shell Trend in exports in Broken Cashew
365
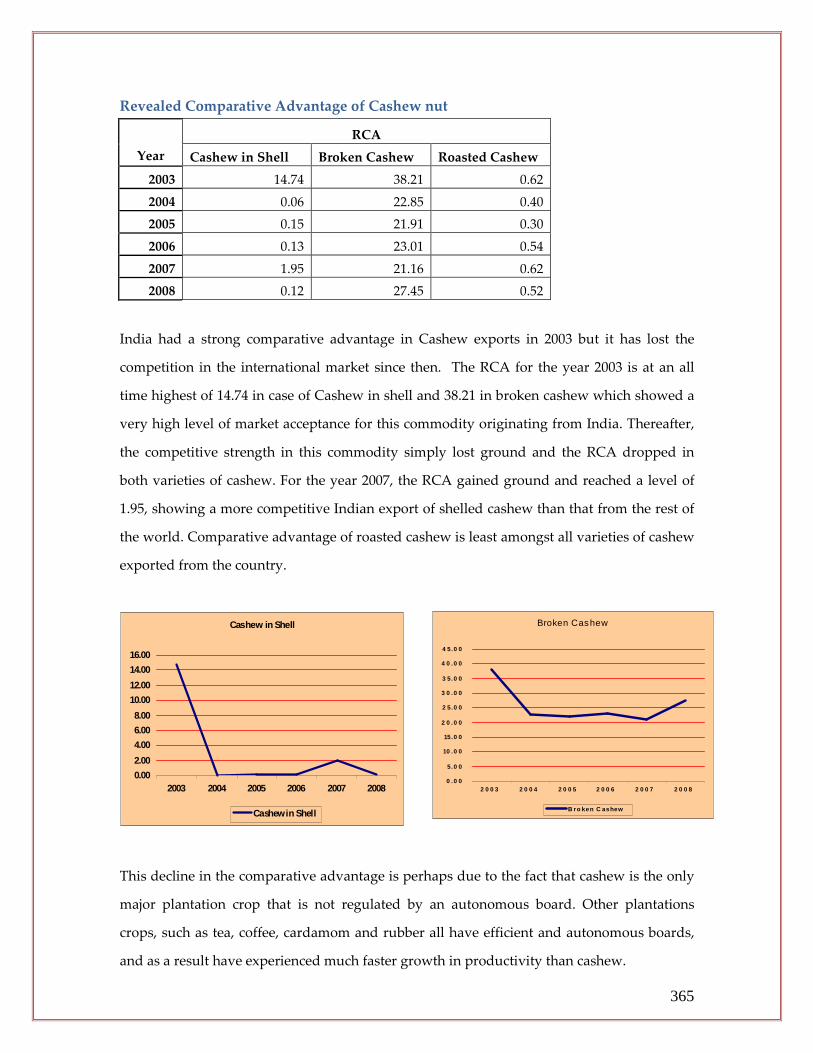
Revealed Comparative Advantage of Cashew nut
RCA
Year Cashew in Shell Broken Cashew Roasted Cashew
2003 14.74 38.21 0.62
2004 0.06 22.85 0.40
2005 0.15 21.91 0.30
2006 0.13 23.01 0.54
2007 1.95 21.16 0.62
2008 0.12 27.45 0.52
India had a strong comparative advantage in Cashew exports in 2003 but it has lost the
competition in the international market since then. The RCA for the year 2003 is at an all
time highest of 14.74 in case of Cashew in shell and 38.21 in broken cashew which showed a
very high level of market acceptance for this commodity originating from India. Thereafter,
the competitive strength in this commodity simply lost ground and the RCA dropped in
both varieties of cashew. For the year 2007, the RCA gained ground and reached a level of
1.95, showing a more competitive Indian export of shelled cashew than that from the rest of
the world. Comparative advantage of roasted cashew is least amongst all varieties of cashew
exported from the country.
This decline in the comparative advantage is perhaps due to the fact that cashew is the only
major plantation crop that is not regulated by an autonomous board. Other plantations
crops, such as tea, coffee, cardamom and rubber all have efficient and autonomous boards,
and as a result have experienced much faster growth in productivity than cashew.
Cashew in Shell
0.00
2.00
4.00
6.00
8.00
10.00
12.00
14.00
16.00
2003 2004 2005 2006 2007 2008
Cashew in Shell
Broken Cashew
0 .0 0
5.0 0
10 .0 0
15.0 0
2 0 .0 0
2 5.0 0
3 0 .0 0
3 5.0 0
4 0 .0 0
4 5.0 0
2 0 0 3 2 0 0 4 2 0 0 5 2 0 0 6 2 0 0 7 2 0 0 8
B ro ken C ashew

366
Cashew is one of the most neglected plantation crops in India despite its status as a major
source of foreign exchange. However, throughout the years, broken cashew has a better
comparative advantage as compared to the cashew in shell.
Major Markets
The United States is the largest importer of cashew kernels, accounting for over 50 percent of
world imports. Other importers include the Netherlands (ten percent), Germany (seven
percent), Japan (five percent) and the United Kingdom (five percent). The former Soviet
Union was previously a major importer of cashew kernels, but with recent economic
changes, trade to this part of the world has diminished. Other emerging markets include the
Middle East, South East Asia and Australia. However, out of these, the only two markets
which India could make slight presence is in Vietnam and UK. Actually, cashew production
in Vietnam has increased quite rapidly over the last decade. Vietnam now accounts for about
6 percent of total Asian production, and is the third largest cashew producer in Asia.
Previously, many of the raw nuts were exported to India for processing, to make good the
short-fall that India experienced when East African supplies dried up. Now, however,
Vietnam has about 60 processing plants, with a capacity of 220 000 tons of raw nuts. Annual
cashew production is often less than this and Vietnam has become an importer of raw nuts
from East and West Africa and South East Asia.
Major Markets for Broken Cashew nut (US$ mn)
2003 2004 2005 2006 2007 2008 CAGR
UAE 19458.946 29248.343 37666.039 44127.509 59286.15 91096.845 36.17
Japan 15323.062 22692.803 26970.817 17331.884 22746.875 32853.142 16.48
Netherlands 43001.071 59691.38 94646.136 88227.581 65861.781 78793.595 12.88
United States 169754.73 233685.08 249869.44 210762.05 193395.34 219456.72 5.27
United Kingdom 18047.18 27941.477 34779.118 23904.055 18357.716 19245.787 1.29
Major Markets for Cashew in shell (US$ mn)
2003 2004 2005 2006 2007 2008
Vietnam 171.5 661.368 25922.77
UK 24.228 79.707 258.942 385.581 228.571 1157.258
Nepal 5.331 2.889 10.968 155.119 102.077
Bangladesh 0.235 4.424 1.427 28.178
367
Vietnam comes across as the single most important trading partner of India for 080131 which
alone accounts for 95% of India’s exports of cashew nuts (in shell) on an average. However,
trade with Vietnam started only in 2005 and reached the highest figure of USD 26 million,
accounting for 98.5% in that year.
In Europe, India has been the preferred supplier, with long standing trading relationships
based on confidence in product quality and on fast and regular deliveries. India has more
than 150 cashew kernel shippers, many of whom have offices in Europe and the United
States. Most cashew kernels exported form India are plain kernels packed in four gallon
prime cans, flushed with carbon dioxide, and having a net weight of 11.34 kg (25 lb). These
cans are encased in cardboard cartons. Global pricing is generally quoted in US dollars per
pound or per kilogram of nuts. United Kingdom accounts for 3% share on an average and
also has consistently increasing trend in exports with a CAGR of 117% since 2003. Nepal too,
showed an increased trade in this product with India where exports surged to more than 30
times in 2007 from 2003 figures. Bangladesh has the lowest share among India’s top markets
for 080131. But in recent years, it shows an increasing trend and possibly the trend
momentum will continue.While analyzing the top markets, it is also important to look at the
consistency of these markets over the years so that a rational decision by the exporter can be
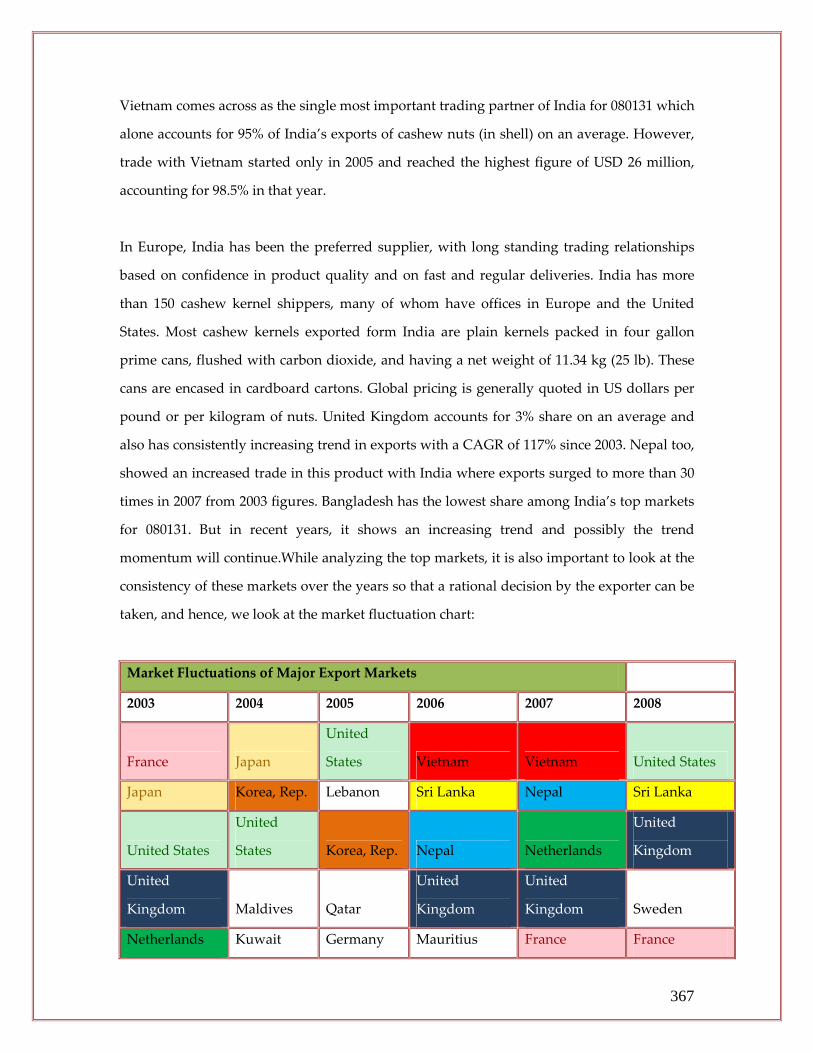
taken, and hence, we look at the market fluctuation chart:
Market Fluctuations of Major Export Markets
2003 2004 2005 2006 2007 2008
France Japan
United
States Vietnam Vietnam United States
Japan Korea, Rep. Lebanon Sri Lanka Nepal Sri Lanka
United States
United
States Korea, Rep. Nepal Netherlands
United
Kingdom
United
Kingdom Maldives Qatar
United
Kingdom
United
Kingdom Sweden
Netherlands Kuwait Germany Mauritius France France

368
As is clear from above, the market for this product is highly volatile with no consistent
dominant top markets. United Kingdom and United States are the only countries that feature
in 4 out of the 6 preceding years among the top 5 market destinations for India’s cashews.
Infact, most of the above countries feature on this list even on account of abysmal exports to
them.
Trade Intensity Index with identified export markets
Trade Intensity Index for Roasted Cashew nut
We see that while the major markets where the bilateral trade strength is high for the state
exporters to target are Vietnam and UK in case of Shelled Cashew nut and Japan, UK and
Netherlands in case of broken cashew. Our high comparative advantage in broken cashew
nuts is depicted in a better trade intensity index in all the markets for broken cashew as
compared to the shelled cashew nuts and roasted cashewnuts. UK is the only market for all
varieties of cashew nuts.
Trade Intensity Index for Shelled Cashew nuts
Year Nepal UK Vietnam Bangladesh
2003 1.90 61.17 1.83
2004 1.24
2005 2.40 0.47 2.33
2006 2.28 1.85 19.10 1.99
2007 2.77 4.49 13.35
2008 2.31 10.43 2.59
Trade Intensity Index for Broken Cashew nut
Year USA Netherlands UAE UK Japan
2003 13.72 33.78 11.71 48.39 65.83
2004 8.15 18.04 8.07 30.20 40.27
2005 9.20 13.96 5.99 25.35 36.17
2006 10.60 13.79 6.77 23.94 46.63
2007 11.20 12.13 4.45 17.51 42.47
2008 13.21 16.34 3.54 28.91 39.13
Kuwait Malaysia UAE UK USA
2003 16.70 1.11 1.11 0.99 1.26
2004 2.46 1.37 0.57 0.91 0.39
2005 7.17 0.13 0.70 0.39 0.83
2006 10.78 2.37 1.73 0.75 0.38
2007 13.41 5.19 1.52 0.94 0.54
2008 10.50 3.27 1.96 0.97 0.60

369
Competitor’s analysis
This analysis further helps us to shortlist the market on the basis of competing position of
India in the identified markets. This is done on the basis of share of India in total imports of
cashew in the country and our trade intensity index vis- a-vis competitors TII with the
export market. This becomes important because although India could have a high trade
intensity, its closest competitors could have even an higher trade intensity with the partner
country, and this could pose significant threats to the Indian exporters in those markets.
The following pie chart lists down all the competitor countries for India’s export of 080131 in
its markets along with the market share each of them commands amongst themselves. Please
note that the market share listed is relative to the 5 countries specifically and not relative to
all the countries exporting 080131 to it, however insignificant they might be.
United Kingdom
The chart above shows that the largest percentage share in UK is commanded by Nigeria
which also a higher TII with UK for 080131. Thus, Nigeria is the market leader and the
toughest competitor for India.

370
India and United States both have a share of 19% exports into UK market for 080131.
However, US has the highest TII of nearly 17 with UK. This means that in 2008, percentage
share of cashews (in shell) (080131) in total exports of edible fruits, nuts, peel of citrus etc.
(HS 08) from US to UK was 17 times more than that of rest of the world. The same figure for
India is second lowest at 10.72. A point to be noted is that United States itself is a major
importer of cashews from India. This possibly implies that the cashews exported from India
into US finally find their way to UK.
Kenya, which has a share of only 6% has TII of close to India’s, at 10.27. This suggests that
Kenya is poised to command a greater share in the future and is as competitive as India in
this market.
The table shows the TII of India for the year 2008
along with its major competitors in the Vietnamese
market. Netherlands has the highest TII followed by
United States and Nigeria respectively. This indicates
that the competition in the UK market for India is
very high and there is possibility of India’s share
being eaten up its competitors if something goes
wrong.
Vietnam
The major exporters of 080131 in Vietnam are (2008 data):
Competitors TIINigeria 11.72824India 10.72293Netherlands 17.8592Kenya 10.27859United States 16.83616
United Kingdom

371
The largest exporter of fresh or dried, in-shell cashews, to Vietnam is Cote d’Ivorie that has a
63% share compared to other 3 exporters. This is followed by Nigeria which again has a 29%
share and a good TII. Nigeria was also a competitor of India in the UK market. Ghana has
the highest TII with Vietnam and has an 8% share of exports.
India’s trade with Vietnam in 080131 was nil in 2008
while its competitors in the market had a TII of
close to 5.9. However, in 2006 and 2007, India’s TII
with Vietnam was 19 and 16 respectively which is
phenomenally higher than the levels of 6 that the
competitors have.
For both Nepal and Bangladesh, India was the only exporter of 080131 in 2008 and therefore,
has no competitor. This gives India an immense potential to increase the exports should the
demand in these export markets increase, as the increase will entirely be met by Indian
exporters.
Analysis of Relative Competitive Advantage vis-a-vis competitors in export destinations
for India in 2008
The Relative Competitive Advantage (RCA)of the competitors into the export destination
measures the relative share of exports of dried or fresh, in-shell cashews in exports of edible
fruits, nuts, mango peels etc. vis-à-vis the similar share of cashews for all the competitors
countries only. This figure takes a closer look at the competitive scenario amongst the top
competitors identified for each market, ignoring the rest of the world.
Competitors TIICote d'Ivoire 5.858968Ghana 5.889106India 0Nigeria 4.573321
Vietnam

372
United Kingdom
India has an RCA of below 1 which indicates a weakened position compared to other
competitors, but which also indicates a far greater potential to increase exports. Netherlands
clearly leads the pack mainly because of its large share in the market and highest TII. Its
share of 080131 amongst the 5 countries is 1.4 times its share of 08 amongst the given
countries. Similarly, United States is another tough competitor, hard to come close to. India
is sandwiched between Nigeria and Kenya and both of these, thus, emerge as closest
competitors for India.
Vietnam

373
In Vietnam, the trade in in-shell cashews is led by Cote d’Ivorie and Ghana. India had no
trade in 2008, however, its trade in 2006 and 2007 was much greater than these competitors
and so they posed no significant threat to it in those years.
Tariff and Non Tariff Barriers for 080131 in identified markets
Amongst the four identified markets for Indian in-shell, fresh and dried cashews,
Bangladesh, Nepal and Vietnam have import tariffs as well as other tariffs.
Import Tariffs
Bangladesh imposes an import duty of 25% MFN basis on the imports of this product into
its markets. Bangladesh also has several other Tariffs that bare levied, as below:
Tariff description Tariff rate
Statutory Rates 100
MFN Rates (General exemption) 25
Infrastructural surcharge 2.5
Value added tax 15
Nepal imposes an MFN duty of 10% on this product.
Vietnam currently imposes a customs duty of 30% on this product.
UK does not have any tariffs on the import of this product.
None of the markets identified had any non-tariff barriers on the export of 080131 into their
boundaries.
Free Trade Agreement/Preferential Trade Agreement
Amongst the four destination markets namely, Vietnam, United Kingdom, Bangladesh and
Nepal, India does not hold any Free Trade or Preferential Trade Agreement with any of
them.
Tariff Rate Quota Structure & Tariff Escalation
No tariff quotas are applied in any of the export destinations for fresh or dried in-shell
cashews. Also, since this is a primary product, there is no concern for tariff escalation.

374
Subsidy Structure in identified markets
Various Governments give different types of export and domestic production subsidies to
the manufacturers or exporters of certain products. These subsidies are usually seen as
trade-distorting and they can cause damage to a potential exporter into these markets by
making his products uncompetitive. None of the identified markets have any subsidies
specific to this product. However, there are subsidies provided on a blanket basis to all the
agricultural products for United Kingdom and Bangladesh.
Non-Product Specific Subsidies
United Kingdom provides 728.4 million Euros of non-product specific trade distorting
subsidies to the sector. This is the market where India has clocked the highest trade growth
for this product.
Bangladesh provides non-product specific subsidies of 40.18 million USD.
Green Box Subsidies
Green Box subsidies are those which are allowable by WTO since they are considered to be
non-trade distorting. They are subsidies given for research and development, new
technology improvements etc. However, lately there has been a shift in the country’s subsidy
structure from those classified as distorting to those classified under “Green Box”.Both
United Kingdom and Bangladesh provide green-box subsidies to the farm sector. United
Kingdom’s share is an alarming 22130.3 million Euros (last reported 1996-97). Bangladesh
provides only 42 million USD as green box subsidy (last reported 1999-00).
S&D T “Development Programmes” Subsidies
Under this category too, United Kingdom and Bangladesh are the only 2 countries who
provide subsidies. UK reported a figure of 21520.8 million Euros in 1996-97 while
Bangladesh reported a meagre 0.22 million USD in 1999-00.
Presence of Special Safeguard Duty
No Special safeguard duty is present in any of the export destinations for this product.

375
Conclusion and recommendation for Cashew nut exporters from Andhra Pradesh
Cashew dried in shell is growing at the fastest rate followed by roasted cashew and then
broken cashew. However, the comparative advantage is very high for broken cashew
followed by roasted cashew in shell and very poor and declining RCA values for cashew nut
in shell.
Major markets for exporting broken cashewnut is Japan, for shelled UK and for roasted
cashew best market is Kuwait.

376
1. Trend in exports:
The product shows a peak on 2005 and declines afterward. It revives after 2007.It may be
expected to show strong growth in the future years. Overall it grew at a CAGR of 44.38%
over 2003-2008.
India's Export to the World (US$ mn)
2003 2004 2005 2006 2007 2008 CAGR
797.405 2191.88 11961.69 10392.72 2680.968 5003.04 44.38
2. Revealed Comparative Advantage:
India's Export
of 6 digit
India's Export of
2 digit
World's Export of
6 digit
World's Export of
2 digit RCA
2003 797.405 84861.2 628731.734 24958165.93 0.37
2004 2191.88 92286.715 760516.08 28188641.54 0.88
2005 11961.692 154926.231 849487.349 30765153.1 2.79
2006 10392.72 193771.264 991163.236 35218728.16 1.90
2007 2680.968 197329.655 1232882.54 43836079.57 0.48
2008 5003.04 266477.73 1452088.563 43911597.7 0.56
Groundnut [200811]Groundnut [200811]Groundnut [200811]Groundnut [200811]

377
The revealed comparative advantage has been shown to decrease in the recent years, though
there is a slight recovery after 2007.
3. Export Destinations:
PARTNER NAME 2003 2004 2005 2006 2007 2008 CAGR
Malaysia 307.264 583.542 4543.212 2492.848 883.928 726.346 18.77
United Kingdom 28.323 0.801 155.32 170.953 1495.571 169.56
Saudi Arabia 5.405 7.804 106.215 137.54 148.384 487.19 146.02
Germany 29.086 149.691 206.484 463.296 73.95
United States 28.449 2.748 138.029 34.763 32.788 378.526 67.80
The major export destinations are as shown above. The amount of exports as shown below is
heavily skewed in favour of Malaysia which is thus our primary market.

378
4. Market Fluctuations:
2003 2004 2005 2006 2007 2008
Malaysia Malaysia Malaysia Malaysia
Malaysia United
Kingdom
Germany United
Kingdom
United
States
United
Kingdom Germany Malaysia
United
States
Saudi
Arabia
Saudi
Arabia Germany
United
Kingdom
Saudi
Arabia
Saudi
Arabia
United
States
United
Kingdom
Saudi
Arabia
Saudi
Arabia Germany
United
Kingdom Germany Germany
United
States
United
States
United
States
Malaysia seems to be a very stable market and occupies the top position. Saudi Arabia comes
second with respect to stability. On the other hand United Kingdom is a very volatile market
and thus risky for the exporters.
5. India’s Trade Intensity Index of Groundnut with the major markets:
Germany
India's export
of 6 digit to
market
India's export of
2 digit to market
World's Export of
6 digit to market
World's Export of
2 digit to market TII
2003 29.086 2442.664 65081.998 3147121.992 0.57
2004 1730.315 76765.826 3393685.731 0
2005 3500.197 82347.354 3610421.373 0
2006 149.691 3099.996 81741.62 3930139.329 2.32
2007 206.484 6762.089 100275.495 4730153.341 1.44
2008 463.296 5453.306 114950.192 4927155.596 3.64
India’s TII with Germany is showing a generally increasing trend and thus Germany can be
a very good market for the Indian products. It was really high last year i.e. 2008 and if the
trend continues then it bodes well for the Indian exporters.

379
Malaysia
India's export of
6 digit to market
India's export of 2
digit to market
World's Export
of 6 digit to
market
World's Export of
2 digit to market TII
2003 307.264 620.558 11321.629 140513.156 6.14
2004 583.542 1771.98 12714.486 148977.267 3.85
2005 4543.212 5422.335 16625.685 160620.135 8.09
2006 2492.848 3602.323 15186.666 176872.878 8.05
2007 883.928 1849.961 15898.73 215043.614 6.46
2008 726.346 1772.843 16640.43 235088.429 5.78
The TII with Malaysia is showing a declining trend post 2006. The reasons for it has to be
found out and precaution has to be taken before exporting to Malaysia.

380
Saudi
Arabia
India's export of
6 digit to market
India's export of 2
digit to market
World's Export of 6
digit to market
World's Export of
2 digit to market TII
2003 5.405 2630.712 3908.684 179712.062 0.094
2004 7.804 2911.69 4105.111 196068.528 0.128
2005 106.215 4112.289 7071.487 234071.506 0.854
2006 137.54 8062.314 9517.742 300106.044 0.537
2007 148.384 8780.792 11600.677 466945.593 0.680
2008 487.19 10551.565 15790.92 339620.105 0.993
Trade intensity index with Saudi Arabia is also increasing which is good for the Indian
exporters. This means that there is still scope for this particular product to be exported to
that country.
UK
India's export of
6 digit to market
India's export
of 2 digit to
market
World's Export of
6 digit to market
World's Export
of 2 digit to
market TII
2003 6438.725 13970.169 2048266.831 0
2004 28.323 6388.512 18709.376 2267940.061 0.53
2005 0.801 11399.349 19369.05 2325584.729 0.008
2006 155.32 15640.636 40721.843 2758702.797 0.672
2007 170.953 16700.588 61315.209 3454306.624 0.576
2008 1495.571 19563.05 58909.175 3343836.551 4.339
United Kingdom also is showing good growth for the Indian products in the last 1 year and
can be seen as a good destination for Indian produce.

381
USA
India's export of
6 digit to market
India's export of 2
digit to market
World's Export of
6 digit to market
World's Export of
2 digit to market TII
2003 28.449 23418.563 47293.237 2952651.911 0.075
2004 2.748 24490.151 40764.548 3411643.107 0.009
2005 138.029 29976.807 49037.925 3705853.868 0.347
2006 34.763 47779 48701.959 4157959.386 0.062
2007 32.788 41497.442 58215.724 5269385.062 0.071
2008 378.526 58702.257 86908.841 5247209.412 0.389
United States as can be seen from the graph has been very volatile when it comes to TII. So
exporters have to weigh the pros and cons before exporting there.

382
6. Competitor's Trade Intensity Index(2008 only) for the identified markets:
The following table lists down the five major competitors considered for each of the
markets. The competitors have been chosen according to their vicinity to the Indian
export figures to these markets as we consider these countries more intense rivals to the
position of India.
Market Name Malaysia
Competitors
Competitor's export
of 6 digit to market
Competitor's export
of 2 digit to market
World's Export
of 6 digit to
market
World's Export
of 2 digit to
market TII
China 14741.849 109284.896 16640.43 235088.429 1.90
India 726.346 1772.843 16640.43 235088.429 5.78
Singapore 589.647 24945.615 16640.43 235088.429 0.33
Thailand 350.298 18995.728 16640.43 235088.429 0.26
United States 133.646 35556.777 16640.43 235088.429 0.053
UK 47.654 939.818 16640.43 235088.429 0.716
India, as we see, is the clear winner here with a TII of 5.78. No other country comes remotely
close to India . So this is one market where we don’t have to worry about competition.

383
Market Name United Kingdom
Competitors
Competitor's export
of 6 digit to market
Competitor's export
of 2 digit to market
World's Export
of 6 digit to
market
World's Export
of 2 digit to
market TII
Netherlands 21761.829 776276.034 58909.175 3343836.551 1.59
Germany 7579 322118 58909.175 3343836.551 1.33
United States 3984.643 33599.595 58909.175 3343836.551 6.73
India 1495.571 19563.05 58909.175 3343836.551 4.33
Greece 916.653 109703.839 58909.175 3343836.551 0.47
Poland 389.118 97655.332 58909.175 3343836.551 0.22
As is the case with most developed countries, in UK too, their greatest trading partner seems
to be other developed countries, in this case US which has a very high TII with UK. Though
India is pretty comfortably placed in the 2nd position.
Market
Name Saudi Arabia
Competitors
Competitor's export
of 6 digit to market
Competitor's export
of 2 digit to market
World's Export
of 6 digit to
market
World's Export
of 2 digit to
market TII
Canada 7358.024 22307.58 15790.92 339620.105 7.09
China 4005.548 58691.141 15790.92 339620.105 1.46
United
States 3355.408 37087.233 15790.92 339620.105 1.94
India 487.19 10551.565 15790.92 339620.105 0.99
Philippines 255.976 2209.271 15790.92 339620.105 2.49
384
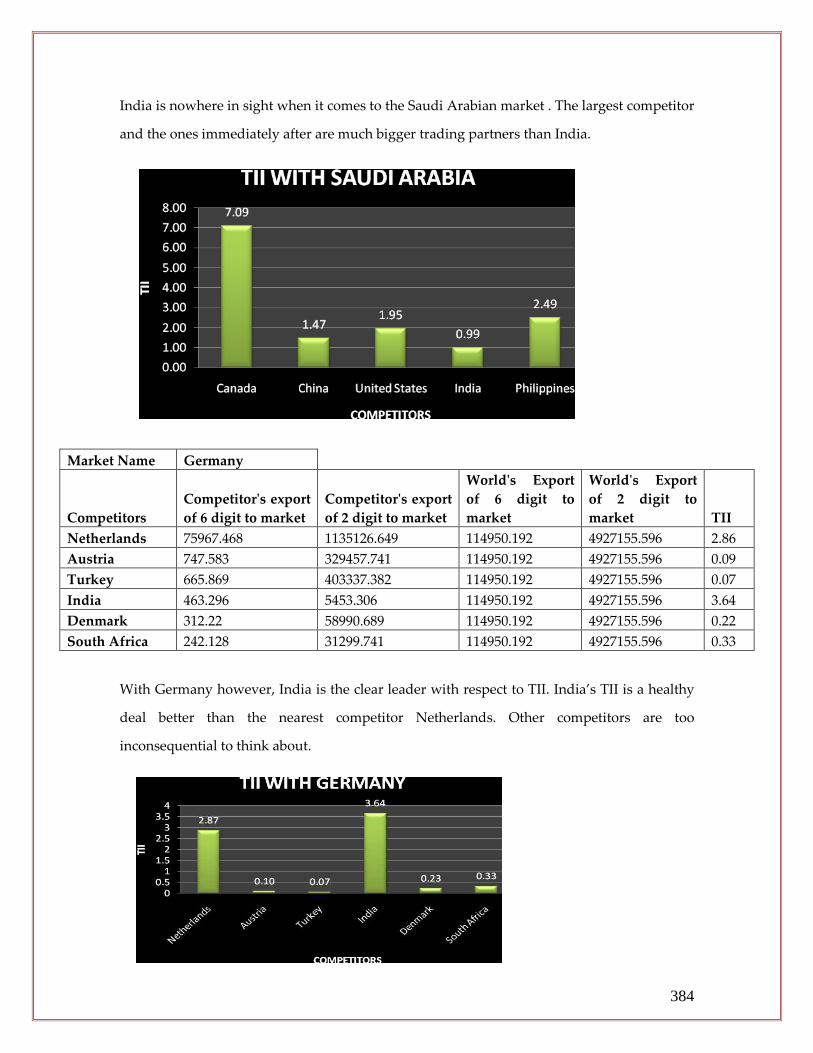
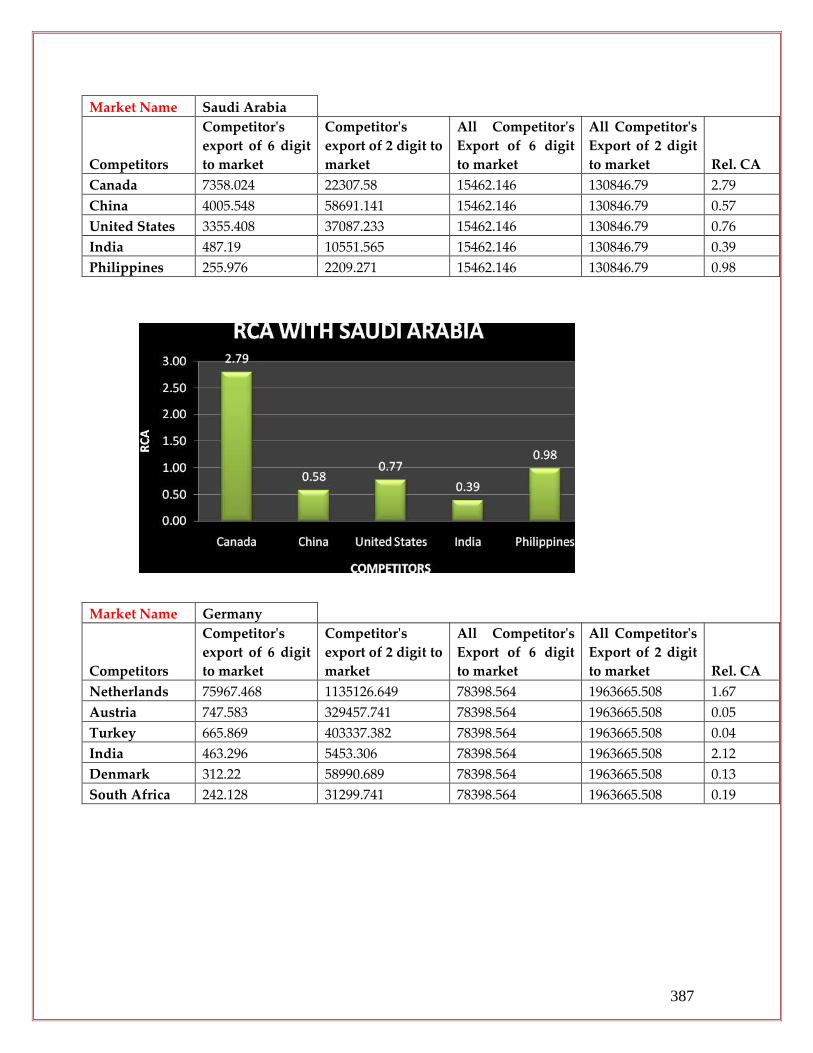
India is nowhere in sight when it comes to the Saudi Arabian market . The largest competitor
and the ones immediately after are much bigger trading partners than India.
Market Name Germany
Competitors
Competitor's export
of 6 digit to market
Competitor's export
of 2 digit to market
World's Export
of 6 digit to
market
World's Export
of 2 digit to
market TII
Netherlands 75967.468 1135126.649 114950.192 4927155.596 2.86
Austria 747.583 329457.741 114950.192 4927155.596 0.09
Turkey 665.869 403337.382 114950.192 4927155.596 0.07
India 463.296 5453.306 114950.192 4927155.596 3.64
Denmark 312.22 58990.689 114950.192 4927155.596 0.22
South Africa 242.128 31299.741 114950.192 4927155.596 0.33
With Germany however, India is the clear leader with respect to TII. India’s TII is a healthy
deal better than the nearest competitor Netherlands. Other competitors are too
inconsequential to think about.

385
Market
Name United States
Competitors
Competitor's export
of 6 digit to market
Competitor's export
of 2 digit to market
World's Export
of 6 digit to
market
World's Export
of 2 digit to
market TII
Canada 31903.051 1054988.406 86908.841 5247209.412 1.82
Thailand 498.873 498367.201 86908.841 5247209.412 0.06
Philippines 412.231 158029.808 86908.841 5247209.412 0.15
India 378.526 58702.257 86908.841 5247209.412 0.38
Israel 151 20128 86908.841 5247209.412 0.45
Malaysia 145.266 8506.037 86908.841 5247209.412 1.03
With the US, India is in a medium position and it still has a good amount of ground to cover
with respect to its nearest competitors like Israel and Malaysia.
7. Relative Competitive Advantage(2008) w.r.t. nearest competitors:
Market Name Malaysia
Competitors
Competitor's
export of 6 digit
to market
Competitor's
export of 2 digit to
market
All Competitor's
Export of 6 digit
to market
All Competitor's
Export of 2 digit
to market Rel. CA
China 14741.849 109284.896 16589.44 191495.677 1.55
India 726.346 1772.843 16589.44 191495.677 4.72
Singapore 589.647 24945.615 16589.44 191495.677 0.27
Thailand 350.298 18995.728 16589.44 191495.677 0.21
United States 133.646 35556.777 16589.44 191495.677 0.04
United
Kingdom 47.654 939.818 16589.44 191495.677 0.58

386
Market Name United Kingdom
Competitors
Competitor's
export of 6 digit
to market
Competitor's
export of 2 digit to
market
All Competitor's
Export of 6 digit
to market
All Competitor's
Export of 2 digit
to market
Rel.
CA
Netherlands 21761.829 776276.034 36126.814 1358915.85 1.05
Germany 7579 322118 36126.814 1358915.85 0.88
United States 3984.643 33599.595 36126.814 1358915.85 4.46
India 1495.571 19563.05 36126.814 1358915.85 2.87
Greece 916.653 109703.839 36126.814 1358915.85 0.31
Poland 389.118 97655.332 36126.814 1358915.85 0.14
387
Market Name Saudi Arabia
Competitors
Competitor's
export of 6 digit
to market
Competitor's
export of 2 digit to
market
All Competitor's
Export of 6 digit
to market
All Competitor's
Export of 2 digit
to market Rel. CA
Canada 7358.024 22307.58 15462.146 130846.79 2.79
China 4005.548 58691.141 15462.146 130846.79 0.57
United States 3355.408 37087.233 15462.146 130846.79 0.76
India 487.19 10551.565 15462.146 130846.79 0.39
Philippines 255.976 2209.271 15462.146 130846.79 0.98
Market Name Germany
Competitors
Competitor's
export of 6 digit
to market
Competitor's
export of 2 digit to
market
All Competitor's
Export of 6 digit
to market
All Competitor's
Export of 2 digit
to market Rel. CA
Netherlands 75967.468 1135126.649 78398.564 1963665.508 1.67
Austria 747.583 329457.741 78398.564 1963665.508 0.05
Turkey 665.869 403337.382 78398.564 1963665.508 0.04
India 463.296 5453.306 78398.564 1963665.508 2.12
Denmark 312.22 58990.689 78398.564 1963665.508 0.13
South Africa 242.128 31299.741 78398.564 1963665.508 0.19

388
Market Name United States
Competitors
Competitor's
export of 6 digit
to market
Competitor's
export of 2 digit to
market
All Competitor's
Export of 6 digit
to market
All Competitor's
Export of 2 digit
to market
Rel.
CA
Canada 31903.051 1054988.406 33488.947 1798721.709 1.62
Thailand 498.873 498367.201 33488.947 1798721.709 0.053
Philippines 412.231 158029.808 33488.947 1798721.709 0.140
India 378.526 58702.257 33488.947 1798721.709 0.346
Israel 151 20128 33488.947 1798721.709 0.402
Malaysia 145.266 8506.037 33488.947 1798721.709 0.917

389
Thus on the basis of the above graphs we can say that in Malaysia, Germany and United
Kingdom India is in a good position than its nearest competitors.
8. Tariff and Non Tariff Measures:
Selected importers Import tariff Other Tariff where ever applicable NTM %
Malaysia 5% Customs duty 5.0% 0
United Kingdom 8% na
Saudi Arabia 5% MFN Rate 12.0% 0
Germany 8% na
MFN Rates 132% 100
Non MFN Tariff 155%
United States
67%
US-Mexico FTA NA
9. FTA & PTA:
Country FTA/PTA Rate
Malaysia
ASEAN FTA 2003
rate 5%
USA US-Mexico FTA
Saudi Arabia None
Germany None
United
Kingdom None
TRQ:Tariff Rate Quota Structure of 200811 in major export destinations
Markets TRQ Quantity (METRIC TONS) In quota - Duty Out Quota - Duty
Malaysia No No No
United Kingdom No No No
Saudi Arabia No No No
Germany No No No
United States No No No
390
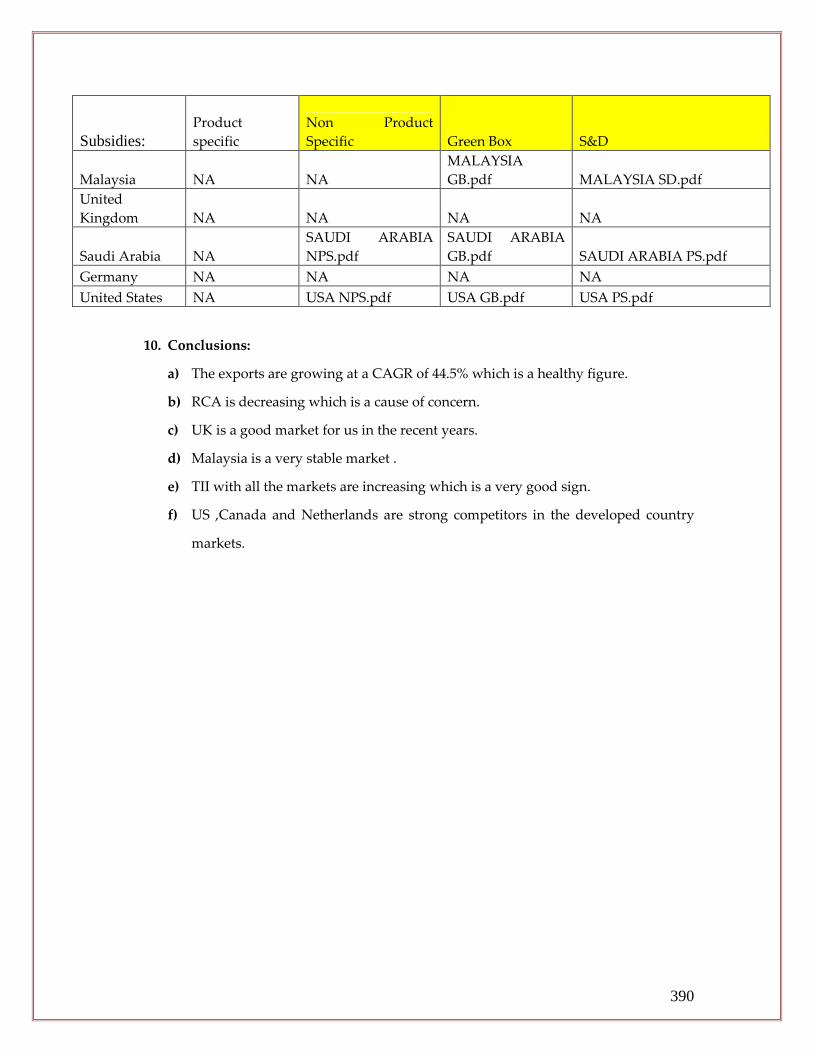
Subsidies: Product
specific
Non Product
Specific Green Box S&D
Malaysia NA NA
MALAYSIA
GB.pdf MALAYSIA SD.pdf
United
Kingdom NA NA NA NA
Saudi Arabia NA
SAUDI ARABIA
NPS.pdf
SAUDI ARABIA
GB.pdf SAUDI ARABIA PS.pdf
Germany NA NA NA NA
United States NA USA NPS.pdf USA GB.pdf USA PS.pdf
10. Conclusions:
a) The exports are growing at a CAGR of 44.5% which is a healthy figure.
b) RCA is decreasing which is a cause of concern.
c) UK is a good market for us in the recent years.
d) Malaysia is a very stable market .
e) TII with all the markets are increasing which is a very good sign.
f) US ,Canada and Netherlands are strong competitors in the developed country
markets.


