What is the impact of the economic crisis on public education spending?
A delayed effect…
Education is the best protection against the crisis.The economic crisis has reinforced the value of education. While educational attainment has always had a huge impact on employability, the financial crisis has strengthened this effect even further. On average across OECD countries, 4.8% of individuals with a tertiary degree were unemployed in 2011, compared with 12.6% of those lacking a secondary education. Moreover, between 2008 and 2011 the unemployment gap widened: the unemployment rate for adults with low levels of education increased by almost 3.8 percentage points, whereas it increased by only 1.5 percentage points for highly educated ones.
While education matters more than ever, the crisis is putting pressure on public budgets. This pressure is mostly felt in primary and secondary education because at these levels, public funding accounts on average for 92% of all funds. But what has the real impact of the economic crisis been on public spending and when did the first effects appear?
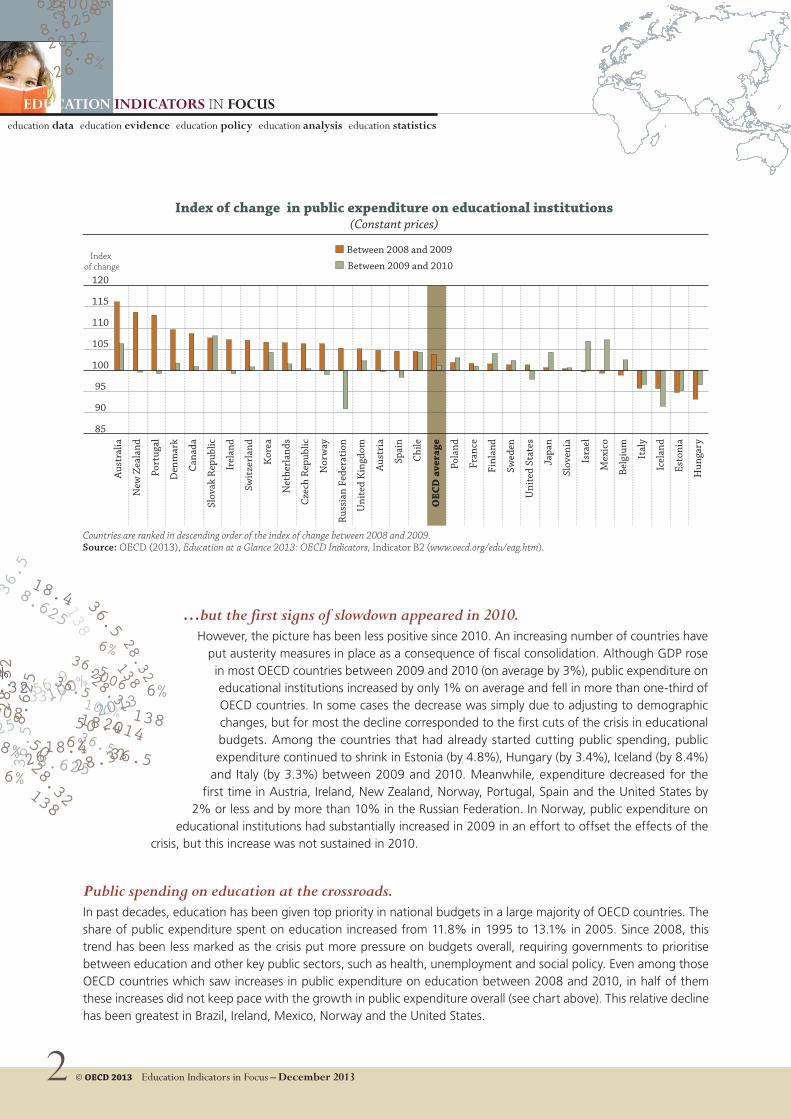
One would have expected to see education systems in OECD countries suffering from severe budget cuts as soon as the financial crisis hit in 2008. However, many countries initially continued to increase public spending on educational institutions, either in an effort to offset the effects of the crisis or because they had already decided their budgets before the start of the crisis (see chart on page 2).
Among the 31 countries with comparable data, only Belgium, Estonia, Hungary, Iceland, Israel, Italy and Mexico reduced public spending on education between 2008 and 2009. Even in these countries, with the exception of Israel, the share of national income spent on education grew in this period because the gross domestic product (GDP) fell faster than public expenditure. Globally, public expenditure on educational institutions increased by an average of 4% in OECD countries between 2008 and 2009, and by more than 10% in Australia, New Zealand and Portugal.
The aftermath of the 2008 financial crisis has meant a significant number of countries have cut public spending on education. Despite GDP rising in most OECD countries between 2009 and 2010, public expenditure on educational institutions fell in one-third of them.
Teachers’ salaries were either frozen or cut between 2009 and 2011 in 12 out of the 25 OECD countries with data available. This may discourage the highest-performing students from joining the teaching profession.
Demand for education and training is increasing even as austerity continues to put pressure on the resources allocated to education. Educational institutions will have to do more with less in the coming years.
education data education evidence education policy education analysis education statistics
However, the picture has been less positive since 2010. An increasing number of countries have put austerity measures in place as a consequence of fiscal consolidation. Although GDP rose in most OECD countries between 2009 and 2010 (on average by 3%), public expenditure on educational institutions increased by only 1% on average and fell in more than one-third of OECD countries. In some cases the decrease was simply due to adjusting to demographic changes, but for most the decline corresponded to the first cuts of the crisis in educational budgets. Among the countries that had already started cutting public spending, public expenditure continued to shrink in Estonia (by 4.8%), Hungary (by 3.4%), Iceland (by 8.4%)
and Italy (by 3.3%) between 2009 and 2010. Meanwhile, expenditure decreased for the first time in Austria, Ireland, New Zealand, Norway, Portugal, Spain and the United States by
2% or less and by more than 10% in the Russian Federation. In Norway, public expenditure on educational institutions had substantially increased in 2009 in an effort to offset the effects of the
crisis, but this increase was not sustained in 2010.
…but the first signs of slowdown appeared in 2010.
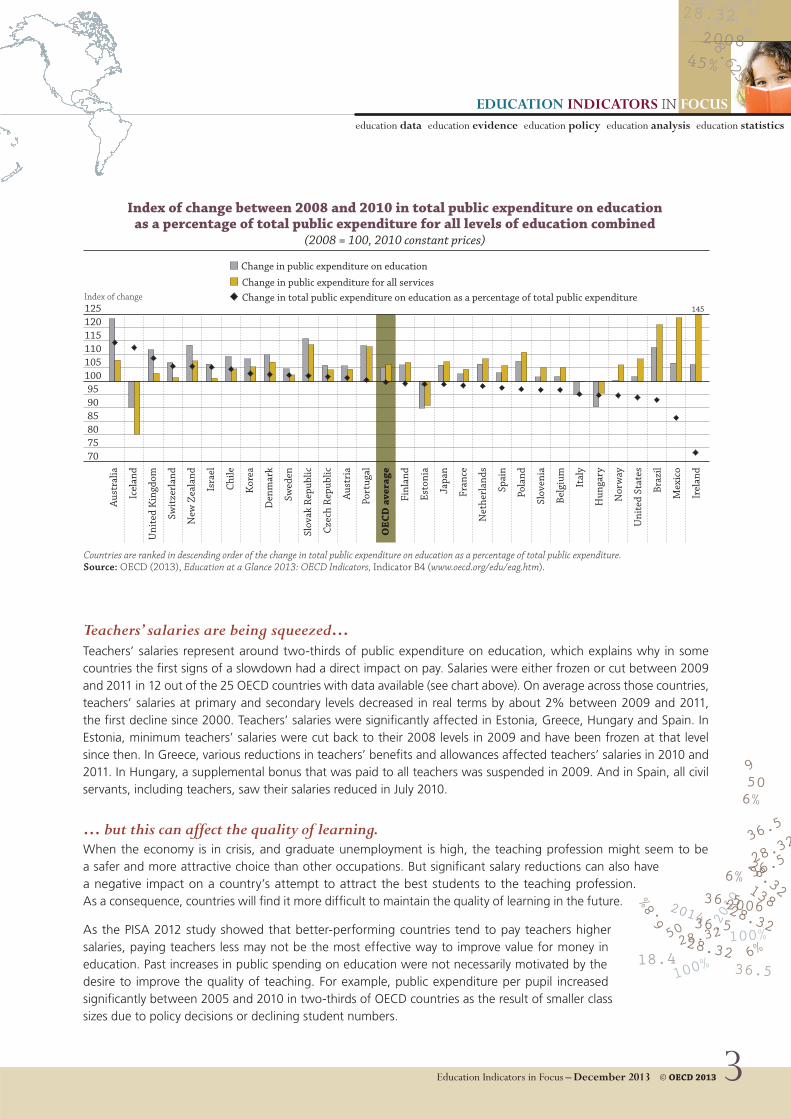
In past decades, education has been given top priority in national budgets in a large majority of OECD countries. The share of public expenditure spent on education increased from 11.8% in 1995 to 13.1% in 2005. Since 2008, this trend has been less marked as the crisis put more pressure on budgets overall, requiring governments to prioritise between education and other key public sectors, such as health, unemployment and social policy. Even among those OECD countries which saw increases in public expenditure on education between 2008 and 2010, in half of them these increases did not keep pace with the growth in public expenditure overall (see chart above). This relative decline has been greatest in Brazil, Ireland, Mexico, Norway and the United States.
Public spending on education at the crossroads.
Index of change Between 2009 and 2010
Aus
tral
ia
New
Zea
land
Port
ugal
Den
mar
k
Cana
da
Slov
ak R
epub
lic
Irel
and
Swit
zerl
and
Kor
ea
Net
herl
ands
Czec
h R
epub
lic
Nor
way
Rus
sian
Fed
erat
ion
Uni
ted
Kin
gdom
Aus
tria
Spai
n
Chi
le
OEC
D a
vera
ge
Pola
nd
Fran
ce
Finl
and
Swed
en
Uni
ted
Stat
es
Japa
n
Slov
enia
Isra
el
Mex
ico
Belg
ium
Ital
y
Icel
and
Esto
nia
Hun
gary
Countries are ranked in descending order of the index of change between 2008 and 2009. Source: OECD (2013), Education at a Glance 2013: OECD Indicators, Indicator B2 (www.oecd.org/edu/eag.htm).
Index of change in public expenditure on educational institutions(Constant prices)
Between 2008 and 2009
120
115
110
105
100
95
90
85
education data education evidence education policy education analysis education statistics
Teachers’ salaries are being squeezed…Teachers’ salaries represent around two-thirds of public expenditure on education, which explains why in some countries the first signs of a slowdown had a direct impact on pay. Salaries were either frozen or cut between 2009 and 2011 in 12 out of the 25 OECD countries with data available (see chart above). On average across those countries, teachers’ salaries at primary and secondary levels decreased in real terms by about 2% between 2009 and 2011, the first decline since 2000. Teachers’ salaries were significantly affected in Estonia, Greece, Hungary and Spain. In Estonia, minimum teachers’ salaries were cut back to their 2008 levels in 2009 and have been frozen at that level since then. In Greece, various reductions in teachers’ benefits and allowances affected teachers’ salaries in 2010 and 2011. In Hungary, a supplemental bonus that was paid to all teachers was suspended in 2009. And in Spain, all civil servants, including teachers, saw their salaries reduced in July 2010.
… but this can affect the quality of learning.When the economy is in crisis, and graduate unemployment is high, the teaching profession might seem to be a safer and more attractive choice than other occupations. But significant salary reductions can also have a negative impact on a country’s attempt to attract the best students to the teaching profession. As a consequence, countries will find it more difficult to maintain the quality of learning in the future.
As the PISA 2012 study showed that better-performing countries tend to pay teachers higher salaries, paying teachers less may not be the most effective way to improve value for money in education. Past increases in public spending on education were not necessarily motivated by the desire to improve the quality of teaching. For example, public expenditure per pupil increased significantly between 2005 and 2010 in two-thirds of OECD countries as the result of smaller class sizes due to policy decisions or declining student numbers.
Index of change
Change in public expenditure for all servicesChange in total public expenditure on education as a percentage of total public expenditure
Aus
tral
ia
Icel
and
Uni
ted
Kin
gdom
Swit
zerl
and
New
Zea
land
Isra
el
Chi
le
Kor
ea
Den
mar
k
Swed
en
Slov
ak R
epub
lic
Czec
h R
epub
lic
Aus
tria
Port
ugal
OEC
D a
vera
ge
Finl
and
Esto
nia
Japa
n
Fran
ce
Net
herl
ands
Spai
n
Pola
nd
Slov
enia
Belg
ium
Ital
y
Hun
gary
Nor
way
Uni
ted
Stat
es
Braz
il
Mex
ico
Irel
and
Countries are ranked in descending order of the change in total public expenditure on education as a percentage of total public expenditure. Source: OECD (2013), Education at a Glance 2013: OECD Indicators, Indicator B4 (www.oecd.org/edu/eag.htm).
Index of change between 2008 and 2010 in total public expenditure on education as a percentage of total public expenditure for all levels of education combined
EDucation inDicators IN focuseducation data education evidence education policy education analysis education statistics
The pressure on public budgets has become significant in many countries since 2010. Recent research suggests that the trend observed in 2010 of declining public expenditure on education has continued (European Commission/EACEA/Eurydice, 2013). It also shows that more OECD countries will begin cutting public spending on education over the next two years.
In times of pressured public budgets, choices need to be made and many OECD countries face challenges to maintain or improve the quality of learning with fewer resources. It will be crucial to invest public resources more efficiently in the coming years. For instance, funds allocated to teacher training – both initial and continuing – turn out to pay off to improve performance of the education systems.
Investment in education will need to become much more efficient.
the bottom line
Coming next month:To which fields of education are students attracted?
See:OECD (2013), Education at a Glance 2013:OECD Indicators, OECD Publishing.
Visit:www.oecd.org/edu
While public spending on education did not initially seem to suffer from the crisis, the picture since 2010 has been less positive. fiscal consolidation has led half of oEcD countries to cut or freeze teachers’ salaries. oEcD countries will not be able to mobilise additional public resources in the coming years, so investment in education will need to become more efficient and be motivated by considerations to improve the quality of teaching.
ReferencesEuropean Commission/EACEA/Eurydice (2013), Funding of Education in Europe 2000-2012: The Impact of the Economic Crisis – Eurydice Report, Publications Office of the European Union, Luxembourg.
Index of change (2000 = 100)
Between 2008 and 2011Between 2000 and 2011
Czec
h R
epub
lic
Esto
nia
Irel
and
Port
ugal
Den
mar
k
Kor
ea
Hun
gary
Scot
land
Aus
tria
Isra
el
OEC
D a
vera
ge
Aus
tral
ia
Mex
ico
Icel
and
Finl
and
Spai
n
New
Zea
land
Engl
and
Belg
ium
(Fr.)
Belg
ium
(Fl.)
Ital
y
Uni
ted
Stat
es
Swit
zerl
and
Gre
ece
Fran
ce
Japa
n
Countries are ranked in descending order of the index of change between 2000 and 2011. Source: OECD (2013), Education at a Glance 2013: OECD Indicators, Indicator D3 (www.oecd.org/edu/eag.htm).
Change in teachers’ salaries in lower secondary education (2000, 2008 and 2011)Index of change between 2000 and 2011 (2000 = 100, constant prices) for teachers with 15 years of experience