Page 1
{222A0E69-13A2-4985-84AE-73CC3D FF4D02}- CD-230212146160043139253081133148017062160006198134117012182085150065036156255141206181160141216078200219246023034225148118025053031192131057133098081193218230095051145215049236082020184240197069109011159099253004053021009125157167081079227004163210022065128005109083194191150214247129128049
MEMORANDUM March 27, 2020
Subject: Estimated State Grants Under the Education Stabilization Fund Included in the
Coronavirus Aid, Relief, and Economic Security (CARES) Act
From: Rebecca R. Skinner, Specialist in Education Policy, [email protected] , 7-6600
Cassandria Dortch, Specialist in Education Policy, [email protected] , 7-0376
Joselynn H. Fountain, Analyst in Education Policy, [email protected] , 7-0129
Emma C. Nyhof, Research Assistant, [email protected] , 7-3215
This memorandum was prepared to enable distribution to more than one congressional office.
This memorandum has been prepared in response to Congressional interest in estimated grant allocations
under the Education Stabilization Fund (ESF), which is included in the Coronavirus Aid, Relief, and
Economic Security (CARES) Act (H.R. 748), as signed by the President.1 More specifically, the ESF is
composed of (1) a Governor’s Emergency Education Relief Fund, (2) an Elementary and Secondary
School Emergency Relief Fund, and (3) a Higher Education Emergency Relief Fund, based on an overall
appropriations level of $30.750 billion. This memorandum begins with a discussion of the ESF and the
appropriations available for each of the three emergency relief funds. The remainder of the memorandum
discusses the formula specifications for determining grants under each of the emergency relief funds and
provides for each fund estimated state grant amounts and allocations aggregated at the state level, as
appropriate. No analysis of the estimates is provided beyond discussion of methodological limitations.
Education Stabilization Fund
The ESF receives an appropriation of $30.750 billion. From the appropriation, the following reservations
will be made:
Up to 0.5% for the outlying areas;2
0.5% for the Bureau of Indian Education (BIE); and
1% for competitive grants awarded by ED to states/BIE with the “highest coronavirus
burden”.
The remaining funds will be allocated among the three emergency relief funds as follows:
1 The text of H.R. 748 is available at https://www.congress.gov/bill/116th-congress/house-bill/748. A public law number is not
yet available.
2 The Secretary of Education (hereinafter referred to as the Secretary) will be required to allocate up to 0.5% of the total
appropriation to the outlying areas on the basis of their relative need as determined by the Secretary, in consultation with the
Secretary of the Interior. For the purposes of this memorandum, it was assumed that the full 0.5% will be allocated to the
outlying areas.
Page 2
Congressional Research Service 2
9.8% for the Governor’s Emergency Education Relief Fund;
43.9% for the Elementary and Secondary School Emergency Relief Fund; and
46.3% for the Higher Education Emergency Relief Fund.
For the purposes of the ESF, the definition of state includes the 50 states, the District of Columbia, and
Puerto Rico.
Table 1 details the amount of funding that reserved for the outlying areas, BIE, and competitive grants
and the amount of funding available to be appropriated for each of the emergency relief funds.
Table 1. Appropriations for Emergency Relief Funds and Required Reservations of Funds for
the Education Stabilization Fund Included in CARES Act
Dollars in thousands
Program Appropriations
Governor’s Emergency Education Relief Fund $2,953,230
Elementary and Secondary School Emergency Relief Fund $13,229,265
Higher Education Emergency Relief Fund $13,952,505
Subtotal for Emergency Relief Funds $30,135,000
Reservation for Outlying Areas $153,750
Reservation for Bureau of Indian Education $153,750
Reservation for Competitive Grants $307,500
Total appropriation $30,750,000
Source: CRS analysis of the CARES Act.
Governor’s Emergency Education Relief Fund
The $2,953,230,000 available for the Governor’s Emergency Education Relief Fund will be awarded to
states based on two formula factors: (1) 60% of the funds will be awarded to states based on each state’s
share of individuals ages 5 through 24 relative to the total number of individuals ages 5 through 24 in all
states; and (2) 40% of the funds will be awarded to states based on each state’s share of children counted
in Section 1124(c) of the Elementary and Secondary Education Act (ESEA) relative to the total number of
children counted in Section 1124(c) for all states. Population estimates for the first factor were available
from the U.S. Census Bureau for 2018.3 Data for the second factor are based on formula child counts used
to determine Title I-A grants under the ESEA. These counts for the 50 states, the District of Columbia,
and Puerto Rico consist of children who are ages 5-17 (1) living in families in poverty, according to
estimates from the U.S. Census Bureau’s Small Area Income and Poverty Estimates (SAIPE) program;
(2) in institutions for neglected or delinquent children or in foster homes; and (3) in families receiving
3 Data for the 50 states and the District of Columbia were available from the U.S. Census Bureau, Annual Estimates of the
Civilian Population by Single Year of Age and Sex for the United States and States: April 1, 2010 to July 1, 2018 (SC-EST2018-
AGESEX-CIV), https://www2.census.gov/programs-surveys/popest/tables/2010-2018/state/asrh/sc-est2018-agesex-civ.csv. Data
for Puerto Rico was available from the U.S. Census Bureau, Annual Estimates of the Resident Population by Single Year of Age
and Sex for the United States, States, and Puerto Rico Commonwealth: April 1, 2010 to July 1, 2018,
https://factfinder.census.gov. These data sources were used as they are the same data sources that ED uses for determining Title I-
A grants under the Elementary and Secondary Education Act.
Page 3
Congressional Research Service 3
Temporary Assistance for Needy Families (TANF) payments above the poverty income level for a family
of four.4
Table 2 presents the estimated state grants. These estimates are provided solely to assist in gauging the
relative impact of allocation formulas and funding levels in the legislative process. They are not intended
to predict specific amounts states will receive.
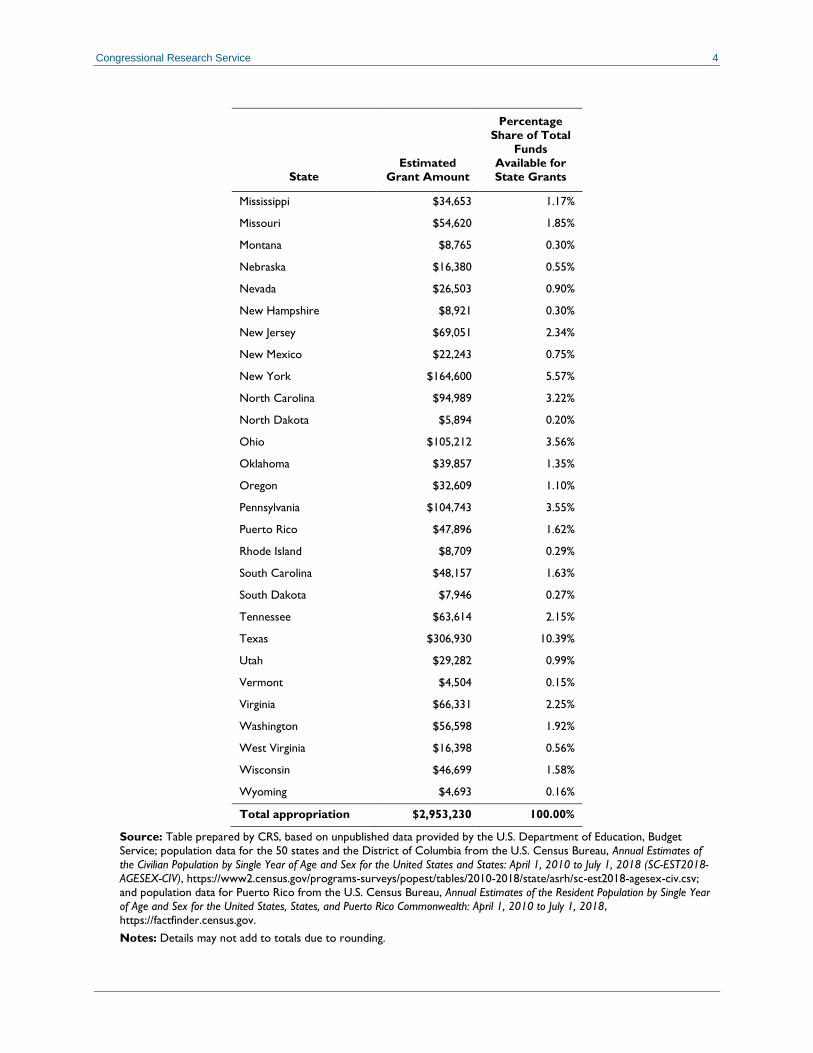
Table 2. Estimated State Grants Based on Governor’s Emergency Education Relief Fund
Included in the CARES Act
Dollars in thousands
State Estimated
Grant Amount
Percentage
Share of Total
Funds
Available for
State Grants
Alabama $48,907 1.66%
Alaska $6,376 0.22%
Arizona $69,248 2.34%
Arkansas $30,722 1.04%
California $354,923 12.02%
Colorado $43,904 1.49%
Connecticut $27,927 0.95%
Delaware $7,920 0.27%
District of Columbia $5,808 0.20%
Florida $173,674 5.88%
Georgia $105,448 3.57%
Hawaii $9,704 0.33%
Idaho $15,709 0.53%
Illinois $108,521 3.67%
Indiana $61,782 2.09%
Iowa $26,304 0.89%
Kansas $26,181 0.89%
Kentucky $43,795 1.48%
Louisiana $50,305 1.70%
Maine $9,301 0.31%
Maryland $45,681 1.55%
Massachusetts $51,011 1.73%
Michigan $89,700 3.04%
Minnesota $43,581 1.48%
4 The analysis relies on unpublished preliminary FY2020 Title I-A data that was provided to CRS by ED on February 21, 2020.
These data were used as they include counts of children ages 5-17 living in families in poverty, which compose over 97% of the
children counted under Section 1124(c), for 2018. This is the same year being used for the population data.
Page 4
Congressional Research Service 4
State Estimated
Grant Amount
Percentage
Share of Total
Funds
Available for
State Grants
Mississippi $34,653 1.17%
Missouri $54,620 1.85%
Montana $8,765 0.30%
Nebraska $16,380 0.55%
Nevada $26,503 0.90%
New Hampshire $8,921 0.30%
New Jersey $69,051 2.34%
New Mexico $22,243 0.75%
New York $164,600 5.57%
North Carolina $94,989 3.22%
North Dakota $5,894 0.20%
Ohio $105,212 3.56%
Oklahoma $39,857 1.35%
Oregon $32,609 1.10%
Pennsylvania $104,743 3.55%
Puerto Rico $47,896 1.62%
Rhode Island $8,709 0.29%
South Carolina $48,157 1.63%
South Dakota $7,946 0.27%
Tennessee $63,614 2.15%
Texas $306,930 10.39%
Utah $29,282 0.99%
Vermont $4,504 0.15%
Virginia $66,331 2.25%
Washington $56,598 1.92%
West Virginia $16,398 0.56%
Wisconsin $46,699 1.58%
Wyoming $4,693 0.16%
Total appropriation $2,953,230 100.00%
Source: Table prepared by CRS, based on unpublished data provided by the U.S. Department of Education, Budget
Service; population data for the 50 states and the District of Columbia from the U.S. Census Bureau, Annual Estimates of
the Civilian Population by Single Year of Age and Sex for the United States and States: April 1, 2010 to July 1, 2018 (SC-EST2018-
AGESEX-CIV), https://www2.census.gov/programs-surveys/popest/tables/2010-2018/state/asrh/sc-est2018-agesex-civ.csv;
and population data for Puerto Rico from the U.S. Census Bureau, Annual Estimates of the Resident Population by Single Year
of Age and Sex for the United States, States, and Puerto Rico Commonwealth: April 1, 2010 to July 1, 2018,
https://factfinder.census.gov.
Notes: Details may not add to totals due to rounding.
Page 5
Congressional Research Service 5
Notice: These are estimated grants only. These estimates are provided solely to assist in gauging the
relative impact of allocation formulas and funding levels in the legislative process. They are not intended to
predict specific amounts states will receive. In addition to other limitations, data needed to calculate final
grants may not yet be available.
Elementary and Secondary School Emergency Relief Fund
The $13,229,265,000 available for the Elementary and Secondary School Emergency Relief Fund will be
awarded to states based on their relative shares of grants awarded under Title I-A of the ESEA for the
most recent fiscal year. As the U.S. Department of Education (ED) has not yet awarded FY2020 Title I-A
grants, the calculations included in this memorandum use Fiscal Year (FY) 2019 Title I-A grant amounts
for the most recent fiscal year grant amounts. The ESEA requires that Title I-A grant amounts used to
determine other formula grants to states be calculated assuming no hold harmless provisions are applied.5
Thus, CRS calculated estimated state grants for the Elementary and Secondary School Emergency Relief
Fund using FY2019 Title I-A grants with no hold harmless provisions applied.
Table 3 presents the estimated state grant amounts. These estimates are provided solely to assist in
gauging the relative impact of allocation formulas and funding levels in the legislative process. They are
not intended to predict specific amounts states will receive.
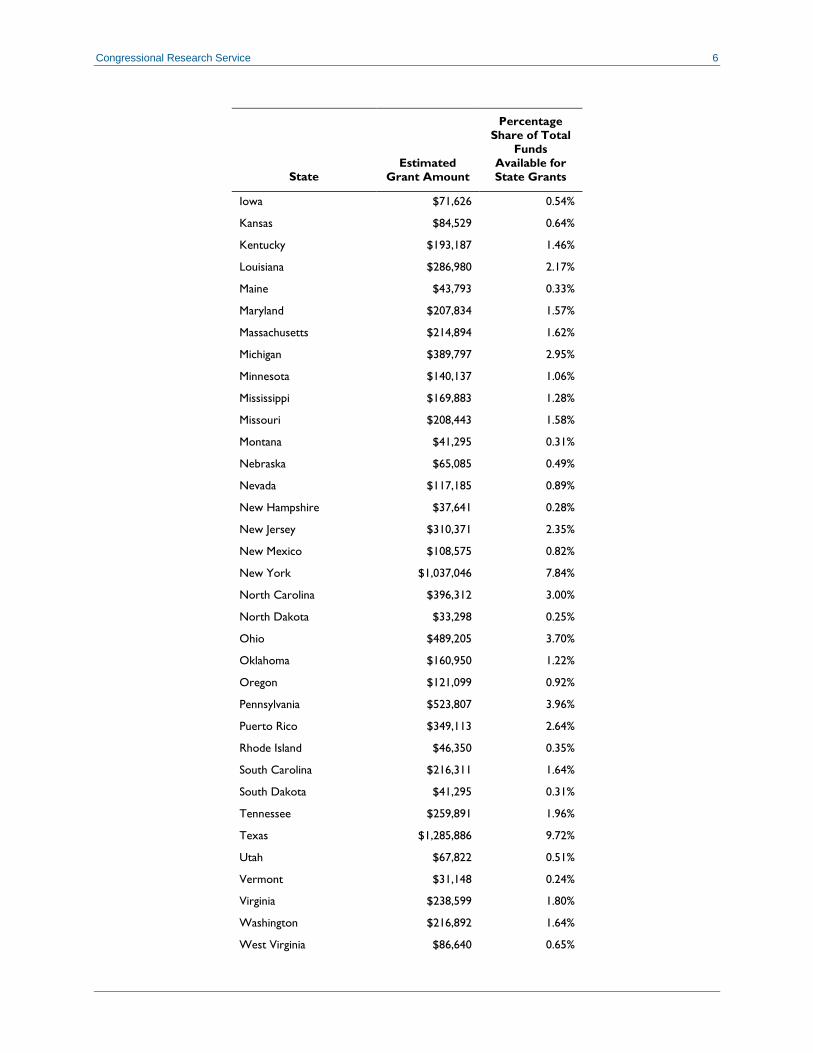
Table 3. Estimated State Grants for an Elementary and Secondary School Emergency
Relief Fund Included in the CARES Act
Dollars in thousands
State Estimated
Grant Amount
Percentage
Share of Total
Funds
Available for
State Grants
Alabama $216,948 1.64%
Alaska $38,408 0.29%
Arizona $277,423 2.10%
Arkansas $128,759 0.97%
California $1,647,306 12.45%
Colorado $120,994 0.91%
Connecticut $111,068 0.84%
Delaware $43,493 0.33%
District of Columbia $42,006 0.32%
Florida $770,248 5.82%
Georgia $457,170 3.46%
Hawaii $43,385 0.33%
Idaho $47,855 0.36%
Illinois $569,467 4.30%
Indiana $214,473 1.62%
5 The requirement to determine state grants with no hold harmless provisions applied is in Section 1122(c)(3) of the ESEA. For
more information on Title I-A formulas, see CRS Report R44461, Allocation of Funds Under Title I-A of the Elementary and
Secondary Education Act.
Page 6
Congressional Research Service 6
State Estimated
Grant Amount
Percentage
Share of Total
Funds
Available for
State Grants
Iowa $71,626 0.54%
Kansas $84,529 0.64%
Kentucky $193,187 1.46%
Louisiana $286,980 2.17%
Maine $43,793 0.33%
Maryland $207,834 1.57%
Massachusetts $214,894 1.62%
Michigan $389,797 2.95%
Minnesota $140,137 1.06%
Mississippi $169,883 1.28%
Missouri $208,443 1.58%
Montana $41,295 0.31%
Nebraska $65,085 0.49%
Nevada $117,185 0.89%
New Hampshire $37,641 0.28%
New Jersey $310,371 2.35%
New Mexico $108,575 0.82%
New York $1,037,046 7.84%
North Carolina $396,312 3.00%
North Dakota $33,298 0.25%
Ohio $489,205 3.70%
Oklahoma $160,950 1.22%
Oregon $121,099 0.92%
Pennsylvania $523,807 3.96%
Puerto Rico $349,113 2.64%
Rhode Island $46,350 0.35%
South Carolina $216,311 1.64%
South Dakota $41,295 0.31%
Tennessee $259,891 1.96%
Texas $1,285,886 9.72%
Utah $67,822 0.51%
Vermont $31,148 0.24%
Virginia $238,599 1.80%
Washington $216,892 1.64%
West Virginia $86,640 0.65%
Page 7
Congressional Research Service 7
State Estimated
Grant Amount
Percentage
Share of Total
Funds
Available for
State Grants
Wisconsin $174,778 1.32%
Wyoming $32,563 0.25%
Total appropriation $13,229,265 100.00%
Source: Table prepared by CRS, based on unpublished data provided by the U.S. Department of Education (ED), Budget
Service.
Notes: Details may not add to totals due to rounding.
Notice: These are estimated grants only. These estimates are provided solely to assist in gauging the
relative impact of allocation formulas and funding levels in the legislative process. They are not intended to
predict specific amounts states will receive. In addition to other limitations, data needed to calculate final
grants may not yet be available.
Higher Education Emergency Relief Fund
The $13,952,505,000 appropriated for the Higher Education Emergency Relief Fund will be allocated as
follows: (1) 90% will be allocated to each institution of higher education (IHE) according to its
enrollment of students who were not exclusively enrolled in distance education courses prior to the
coronavirus emergency; (2) 7.5% will be made available to programs for minority serving institutions
(MSIs) authorized under the Higher Education Act (HEA) Titles III-A, III-B, V-A, and VII-A; and (3)
2.5% will be made available for the Fund for the Improvement of Postsecondary Education Program
(FIPSE) authorized under HEA Title VII-B. Table 4 provides a breakdown of funding under the Higher
Education Emergency Relief Fund.
Table 4. Appropriations for Higher Education Emergency Relief Funds Included in the
CARES Act
Dollars in Thousands
Program/Purpose Appropriations
Direct Grants to Institutions of Higher Education $12,557,255
Programs for Minority Serving Institutions $1,046,438
Fund for the Improvement of Postsecondary Education $348,813
Total Funding $13,952,500
Source: CRS analysis of the CARES Act.
Note: Details many not add to totals due to rounding.
Direct Grants to Institutions of Higher Education
Of the funds available for the Higher Education Emergency Relief Fund, 90% ($12,557,254,500.00) of
the funds will be awarded to IHEs based on two formula factors: (1) 75% of the funds will be awarded to
IHEs based on each IHE’s share of full-time equivalent (FTE) enrollment of Pell Grant recipients who
were not enrolled exclusively in distance education prior to the coronavirus emergency, relative to the
total FTE enrollment of such individuals in all IHEs;6 and (2) 25% of the funds will be awarded to IHEs
6 For a description of the Pell Grant program, see CRS Report R45418, Federal Pell Grant Program of the Higher Education
Act: Primer.
Page 8
Congressional Research Service 8
based on each IHE’s share of FTE enrollment of students who were not Pell Grant recipients and who
were not enrolled exclusively in distance education prior to the coronavirus emergency, relative to the
total FTE enrollment of such individuals in all IHEs. The first factor primarily allocates funds based on
undergraduate enrollment since Pell Grant eligibility is limited to undergraduates and students in
postbaccalaureate teacher education programs.7 The second factor allocates funds based on undergraduate
and graduate enrollment. Because precise estimates for the factors are not publicly available, CRS
approximated the factors using the best available data from ED’s Integrated Postsecondary Education
Data System (IPEDS) and Title IV Program Volume Reports.
The first factor was approximated as follows. The FTE enrollment of Pell Grant recipients was
approximated by dividing Award Year (AY) 2017-2018 Pell Grant disbursements by the AY2017-2018
maximum Pell Grant award ($5,920). In order to approximate FTE enrollment of Pell Grant recipients
who were not enrolled exclusively in distance education, the estimated FTE enrollment of Pell Grant
recipients was multiplied by the percentage of fall 2017 undergraduate degree/certificate-seeking students
not enrolled exclusively in distance education. IPEDS is a series of surveys conducted annually by ED to
gather institutional data on a variety of topics from those IHEs that participate in the Title IV aid
programs, including student outcomes, student demographics, and institutional finances.8 The Title IV
Program Volume Reports provide recipient and volume data for each aid program authorized under Title
IV of the HEA for each school participating in the Title IV programs.9
Pell Grant disbursements are reported by ED in its Title IV Program Volume Reports for each IHE at the
6-digit Office of Postsecondary Education Identification (OPE ID) level. OPE ID is the identification
number used by ED to identify institutions that are eligible to participate in the aid programs authorized
under Title IV of the HEA. Undergraduate distance education participation is based on data reported in
ED’s Integrated Postsecondary Education Data System (IPEDS) at the 8-digit OPE ID level.10 The 8-digit
OPE ID includes the 6-digit OPE ID of the eligible IHE as well as two additional digits in order to
distinguish branch campuses, additional locations, and other entities that may be part of the eligible IHE.
CRS aggregated the IPEDS data to the 6-digit OPE ID level to apply to the FTE enrollment of Pell Grant
recipients.
The second factor was estimated by subtracting the approximated FTE enrollment of Pell Grant recipients
(if any) from the total FTE enrollment of students and then multiplying the difference by the percentage
of fall 2017 undergraduate, graduate, and professional students not enrolled exclusively in distance
education.11 The FTE enrollment of students is the 2017-2018 reported 12-month FTE undergraduate,
graduate, and doctors professional practice enrollment from IPEDS. The distance education participation
was calculated by CRS using IPEDS data.12
7 Students with a bachelor's degree may be enrolled at least half-time in a postbaccalaureate teacher education program. Half-time
enrollment is at least 6 credit hours in a standard semester. A postbaccalaureate teacher education program does not lead to a
graduate degree; is offered by a school that does not also offer a bachelor's degree in education; and leads to certification or
licensure necessary for employment as an elementary or secondary school teacher in the state. To be eligible for a Pell Grant, the
student enrolled in the postbaccalaureate teacher education program must be pursuing an initial teacher certification or licensing
credential within the state.
8 IHEs that do not participate in the Title IV programs may also report to IPEDS. However, these non-Title IV-participating IHEs
are excluded from this analysis.
9 The Title IV Program Volume Reports are available at https://studentaid.gov/data-center/student/title-iv.
10 For IHEs that did not report any students enrolled exclusively in distance education, CRS assumed no students were so
enrolled.
11 The approximated FTE enrollment of Pell Grant recipients exceeded the total FTE enrollment for 7% of IHEs. Such IHEs were
not eligible for an allocation based on the second factor.
12 For IHEs that did not report any students enrolled exclusively in distance education, CRS assumed no students were so
enrolled.
Page 9
Congressional Research Service 9
The methodology used to calculate allocations for 90% of the funds under the Higher Education
Emergency Relief Fund has some limitations.
This approximation of the FTE enrollment of Pell Grant recipients does not take into
consideration award rules. Some Pell Grant recipients are not eligible to receive the
maximum Pell Grant award if enrolled full-time for a full academic year. Further some
Pell Grant recipients receive Pell Grant funds that exceed the maximum Pell Grant award
through a provision known as year-round Pell, in which qualified students may receive up
to 150% of the maximum Pell Grant award in each award year. Thus, the approximated
FTE enrollment of Pell Grant recipients may overestimate the actual FTE enrollment for
some IHEs and underestimate it for other IHEs.
The data used to determine distance education participation are based on a fall
unduplicated enrollment which is different from FTE enrollment and, in the case of the
total FTE enrollment, also different from FTE enrollment for a 12-month period. The
unduplicated enrollment is a simple headcount of students enrolled in classes; whereas
the FTE enrollment counts part-time students in accordance with their enrollment rate.
IHEs at the 6-digit OPE ID-level may include entities that cross state lines.13 A single
state was assigned to such IHEs.14
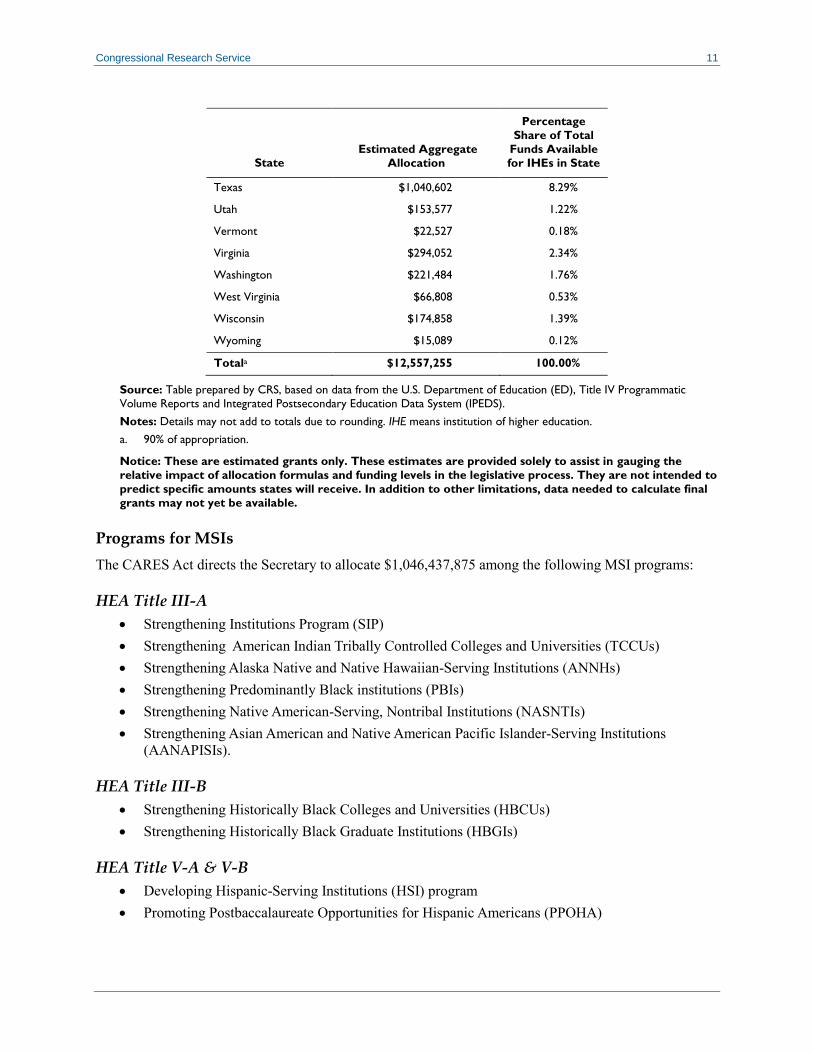
Table 5 presents an aggregation of the IHE-level allocations at the state level for the 90% of funds in the
Higher Education Emergency Relief Fund available for Direct Grants to Institutions of Higher Education.
These estimates are provided solely to assist in gauging the relative impact of allocation formulas and
funding levels in the legislative process. They are not intended to predict specific amounts that IHEs in
each state will receive.
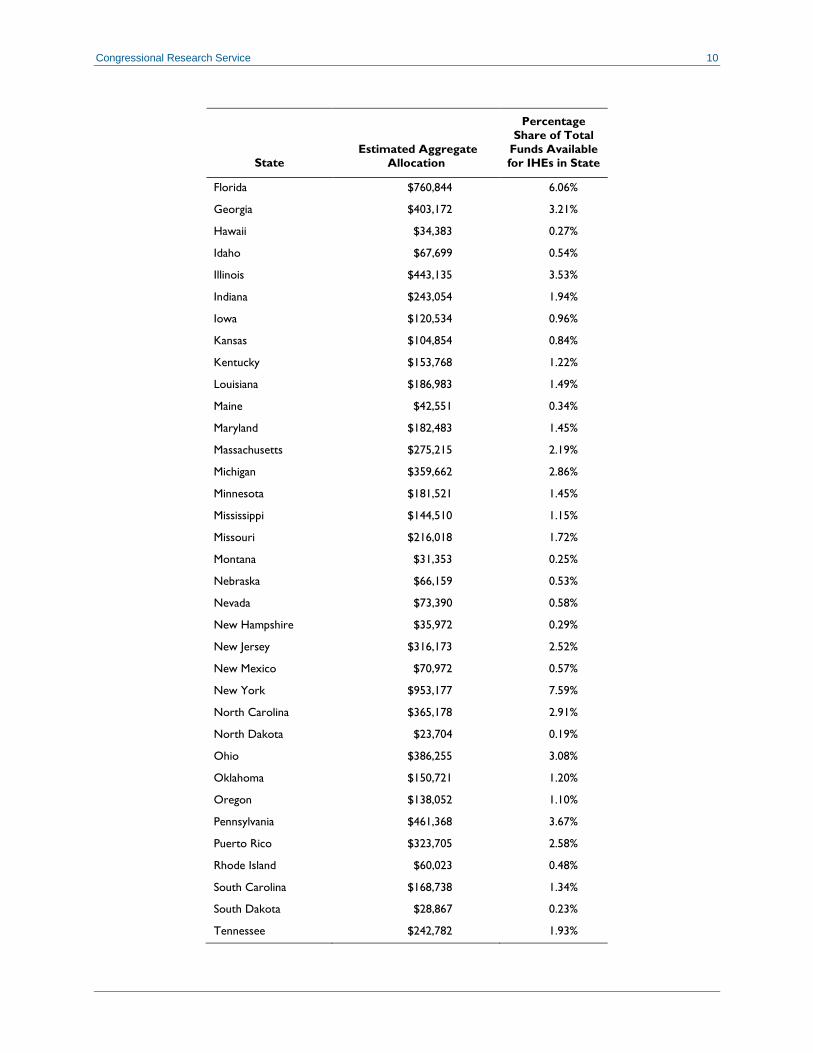
Table 5. Estimated IHE Grants Aggregated at the State Level for a Higher Education
Emergency Relief Fund Included in the CARES Act
Dollars in Thousands
State Estimated Aggregate
Allocation
Percentage
Share of Total
Funds Available
for IHEs in State
Alabama $218,505 1.74%
Alaska $11,053 0.09%
Arizona $272,213 2.17%
Arkansas $118,440 0.94%
California $1,750,910 13.94%
Colorado $166,797 1.33%
Connecticut $133,961 1.07%
Delaware $33,310 0.27%
District of Columbia $46,094 0.37%
13 Department Of Education, National Center for Education Statistics, Report and Suggestions from IPEDS Technical Review
Panel #43: Defining an IPEDS Institutions (Part 2), 2014, p. 2,
https://edsurveys.rti.org/IPEDS_TRP_DOCS/prod/documents/TRP_43_Report_and_Suggestions.pdf.
14 The state was assigned in accordance with the state of the main campus, if available, or the campus with the highest FTE Pell
enrollment.
Page 10
Congressional Research Service 10
State Estimated Aggregate
Allocation
Percentage
Share of Total
Funds Available
for IHEs in State
Florida $760,844 6.06%
Georgia $403,172 3.21%
Hawaii $34,383 0.27%
Idaho $67,699 0.54%
Illinois $443,135 3.53%
Indiana $243,054 1.94%
Iowa $120,534 0.96%
Kansas $104,854 0.84%
Kentucky $153,768 1.22%
Louisiana $186,983 1.49%
Maine $42,551 0.34%
Maryland $182,483 1.45%
Massachusetts $275,215 2.19%
Michigan $359,662 2.86%
Minnesota $181,521 1.45%
Mississippi $144,510 1.15%
Missouri $216,018 1.72%
Montana $31,353 0.25%
Nebraska $66,159 0.53%
Nevada $73,390 0.58%
New Hampshire $35,972 0.29%
New Jersey $316,173 2.52%
New Mexico $70,972 0.57%
New York $953,177 7.59%
North Carolina $365,178 2.91%
North Dakota $23,704 0.19%
Ohio $386,255 3.08%
Oklahoma $150,721 1.20%
Oregon $138,052 1.10%
Pennsylvania $461,368 3.67%
Puerto Rico $323,705 2.58%
Rhode Island $60,023 0.48%
South Carolina $168,738 1.34%
South Dakota $28,867 0.23%
Tennessee $242,782 1.93%
Page 11
Congressional Research Service 11
State Estimated Aggregate
Allocation
Percentage
Share of Total
Funds Available
for IHEs in State
Texas $1,040,602 8.29%
Utah $153,577 1.22%
Vermont $22,527 0.18%
Virginia $294,052 2.34%
Washington $221,484 1.76%
West Virginia $66,808 0.53%
Wisconsin $174,858 1.39%
Wyoming $15,089 0.12%
Totala $12,557,255 100.00%
Source: Table prepared by CRS, based on data from the U.S. Department of Education (ED), Title IV Programmatic
Volume Reports and Integrated Postsecondary Education Data System (IPEDS).
Notes: Details may not add to totals due to rounding. IHE means institution of higher education.
a. 90% of appropriation.
Notice: These are estimated grants only. These estimates are provided solely to assist in gauging the
relative impact of allocation formulas and funding levels in the legislative process. They are not intended to
predict specific amounts states will receive. In addition to other limitations, data needed to calculate final
grants may not yet be available.
Programs for MSIs
The CARES Act directs the Secretary to allocate $1,046,437,875 among the following MSI programs:
HEA Title III-A
Strengthening Institutions Program (SIP)
Strengthening American Indian Tribally Controlled Colleges and Universities (TCCUs)
Strengthening Alaska Native and Native Hawaiian-Serving Institutions (ANNHs)
Strengthening Predominantly Black institutions (PBIs)
Strengthening Native American-Serving, Nontribal Institutions (NASNTIs)
Strengthening Asian American and Native American Pacific Islander-Serving Institutions
(AANAPISIs).
HEA Title III-B
Strengthening Historically Black Colleges and Universities (HBCUs)
Strengthening Historically Black Graduate Institutions (HBGIs)
HEA Title V-A & V-B
Developing Hispanic-Serving Institutions (HSI) program
Promoting Postbaccalaureate Opportunities for Hispanic Americans (PPOHA)
Page 12
Congressional Research Service 12
HEA Title VII-A
Master’s Degree Programs at HBCUs
Funds are to be distributed to each program according to each program’s proportional share of funds
allocated to all of the aforementioned programs under the Further Consolidated Appropriations Act, 2020
(P.L. 116-94).15 While it is possible to determine the amount of funding each program is to receive, there
is no precise way of estimating how program funds will be distributed at the institution or state level.
Some of the challenges in generating the estimates are as follows:
1. Many of the MSI programs award competitive grants, and data on most recent funding is
not consistently available across programs. Also, the CARES Act generally provides ED
with discretion in making awards. Thus, there is no way to determine if ED will award
supplemental funding to existing grantees or if it will hold a new competition to make
awards to other eligible IHEs not currently receiving funds or to a combination of
existing grantees and other eligible IHEs not currently receiving funds.
2. HBCUs and TCCUs are awarded grants through a statutory formula. However, CRS is
not certain of the underlying data that ED uses to calculate the formula. Additionally, it
appears that the FY2020 awards have not yet been made, so a breakdown of the
proportional share of funding that will be received by HBCUs and TCCUs under the
Further Consolidated Appropriations Act, 2020 (P.L. 116-94) is not yet available. Lastly,
the availability of prior year data is inconsistent across the two programs.
Table 6 provides the amount of discretionary funding16 for each program in FY2020, each program’s
proportional share of funding, and an estimate of the amount from the 7.5% of funds under the Higher
Education Emergency Relief Fund made available for this purpose.
Table 6. Estimated Minority-Serving Institutions Program Allocations Based on the Higher
Education Emergency Relief Fund
Dollars in Thousands
Program
FY2020
Discretionary
Appropriations
Proportional Share of
FY2020 Discretionary
Appropriations Estimated Allocation
SIP $107,854 14.2% $148,591
Strengthening TCCUs $36,633 4.8% $50,469
Strengthening ANNHs $18,320 2.4% $25,239
Strengthening PBIs $13,197 1.7% $18,182
Strengthening NASNTIs $4,444 0.6% $6,123
Strengthening AANAPISIs $4,444 0.6% $6,123
Strengthening HBCUs $324,792 42.8% $447,466
Strengthening HBGIs $83,995 11.1% $115,720
15 In FY2020, the Minority Science and Engineering Program (MSEIP) authorized under Title III-E received $12.8 million in
discretionary appropriations. The CARES Act does not authorize the Secretary to allocate funds to the MSEIP; thus, the program
was not included in the analysis.
16 Title III-F of the HEA authorizes mandatory appropriations for select MSI programs. The CARES Act does not direct the
Secretary to provide funding to the Title III-F programs; thus, mandatory appropriations were not taken into consideration when
calculating the estimates.
Page 13
Congressional Research Service 13
Program
FY2020
Discretionary
Appropriations
Proportional Share of
FY2020 Discretionary
Appropriations Estimated Allocation
Developing HSIs $143,081 18.8% $197,123
PPOHAs $12,838 1.7% $17,687
Masters Degrees at HBCUse $9,956 1.3% $13,716
Total $759,554 100% $1,046,437,875
Source: CRS analysis of the CARES Act.
Notes: In FY2020, the Minority Science and Engineering Program (MSEIP) authorized under HEA Title III-E received $12.8
million in discretionary appropriations. The CARES Act does not authorize the Secretary to allocate funds to the MSEIP;
thus, the program was excluded when determining the proportional share of funding allocated to each program.
FIPSE
The CARES Act directs the Secretary to allocate $348,813,625 to IHEs that the Secretary determines to
have the greatest unmet needs related to coronavirus. The Secretary is required to give priority to
institutions that will not otherwise receive grants of at least $500,000 through the Higher Education
Emergency Relief Funds. There is no precise way of determining which institutions will receive FIPSE
funding based on these priorities.
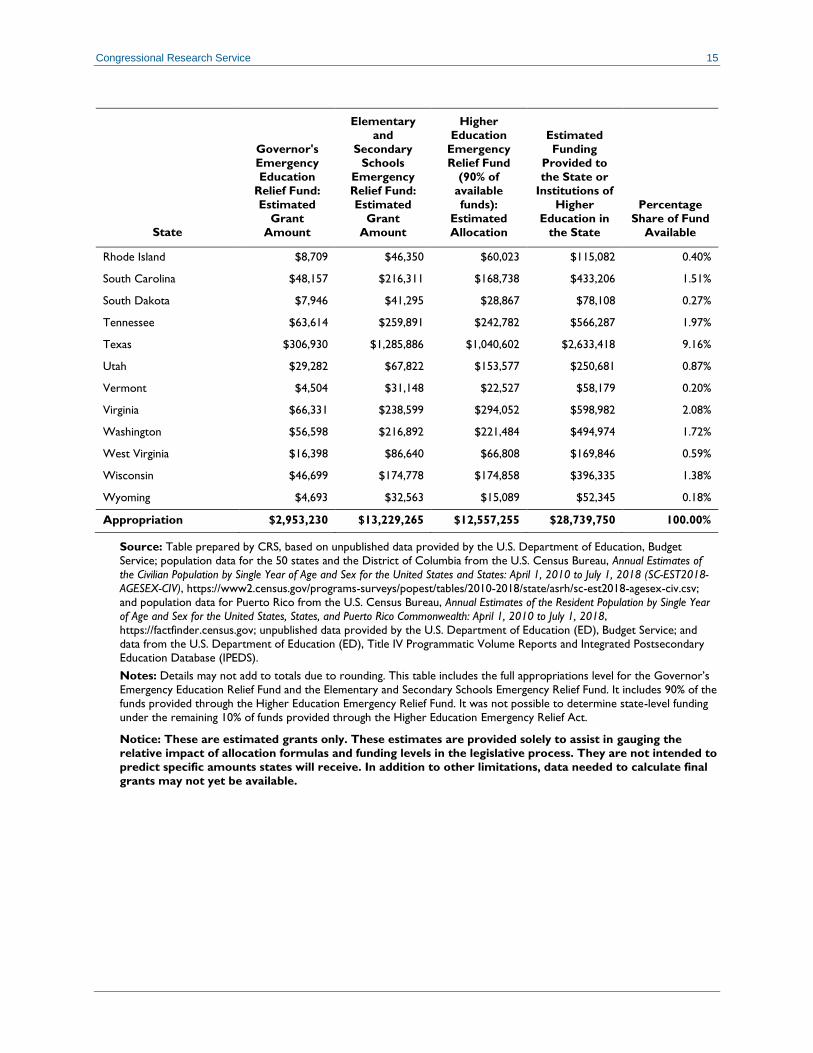
State Totals for the Education Stabilization Fund
Table 7 compiles data from Table 2, Table 3, and Table 5 to provide state-level estimates for the majority
of the funds provided through the Education Stabilization Fund. With respect to the Higher Education
Emergency Relief Fund, Table 7 includes the 90% of funds for direct grants to IHEs presented in Table 5.
State level funding could not be determined for the remaining 10% of the funds.
Table 7. Estimated State Grants and Institution of Higher Education Grants Aggregated at
the State Level for the Education Stabilization Fund Included in the CARES Act
Dollars in Thousands
State
Governor's
Emergency
Education
Relief Fund:
Estimated
Grant
Amount
Elementary and
Secondary
Schools
Emergency
Relief Fund:
Estimated
Grant
Amount
Higher Education
Emergency
Relief Fund
(90% of
available
funds):
Estimated
Allocation
Estimated
Funding
Provided to
the State or
Institutions of
Higher
Education in
the State
Percentage
Share of Fund
Available
Alabama $48,907 $216,948 $218,505 $484,360 1.69%
Alaska $6,376 $38,408 $11,053 $55,837 0.19%
Arizona $69,248 $277,423 $272,213 $618,884 2.15%
Arkansas $30,722 $128,759 $118,440 $277,921 0.97%
California $354,923 $1,647,306 $1,750,910 $3,753,139 13.06%
Colorado $43,904 $120,994 $166,797 $331,695 1.15%
Connecticut $27,927 $111,068 $133,961 $272,956 0.95%
Delaware $7,920 $43,493 $33,310 $84,723 0.29%
Page 14
Congressional Research Service 14
State
Governor's
Emergency
Education
Relief Fund:
Estimated
Grant
Amount
Elementary
and
Secondary
Schools
Emergency
Relief Fund:
Estimated
Grant
Amount
Higher
Education
Emergency
Relief Fund
(90% of
available
funds):
Estimated
Allocation
Estimated
Funding
Provided to
the State or
Institutions of
Higher
Education in
the State
Percentage
Share of Fund
Available
District of Columbia $5,808 $42,006 $46,094 $93,908 0.33%
Florida $173,674 $770,248 $760,844 $1,704,766 5.93%
Georgia $105,448 $457,170 $403,172 $965,790 3.36%
Hawaii $9,704 $43,385 $34,383 $87,472 0.30%
Idaho $15,709 $47,855 $67,699 $131,263 0.46%
Illinois $108,521 $569,467 $443,135 $1,121,123 3.90%
Indiana $61,782 $214,473 $243,054 $519,309 1.81%
Iowa $26,304 $71,626 $120,534 $218,464 0.76%
Kansas $26,181 $84,529 $104,854 $215,564 0.75%
Kentucky $43,795 $193,187 $153,768 $390,750 1.36%
Louisiana $50,305 $286,980 $186,983 $524,268 1.82%
Maine $9,301 $43,793 $42,551 $95,645 0.33%
Maryland $45,681 $207,834 $182,483 $435,998 1.52%
Massachusetts $51,011 $214,894 $275,215 $541,120 1.88%
Michigan $89,700 $389,797 $359,662 $839,159 2.92%
Minnesota $43,581 $140,137 $181,521 $365,239 1.27%
Mississippi $34,653 $169,883 $144,510 $349,046 1.21%
Missouri $54,620 $208,443 $216,018 $479,081 1.67%
Montana $8,765 $41,295 $31,353 $81,413 0.28%
Nebraska $16,380 $65,085 $66,159 $147,624 0.51%
Nevada $26,503 $117,185 $73,390 $217,078 0.76%
New Hampshire $8,921 $37,641 $35,972 $82,534 0.29%
New Jersey $69,051 $310,371 $316,173 $695,595 2.42%
New Mexico $22,243 $108,575 $70,972 $201,790 0.70%
New York $164,600 $1,037,046 $953,177 $2,154,823 7.50%
North Carolina $94,989 $396,312 $365,178 $856,479 2.98%
North Dakota $5,894 $33,298 $23,704 $62,896 0.22%
Ohio $105,212 $489,205 $386,255 $980,672 3.41%
Oklahoma $39,857 $160,950 $150,721 $351,528 1.22%
Oregon $32,609 $121,099 $138,052 $291,760 1.02%
Pennsylvania $104,743 $523,807 $461,368 $1,089,918 3.79%
Puerto Rico $47,896 $349,113 $323,705 $720,714 2.51%
Page 15
Congressional Research Service 15
State
Governor's
Emergency
Education
Relief Fund:
Estimated
Grant
Amount
Elementary
and
Secondary
Schools
Emergency
Relief Fund:
Estimated
Grant
Amount
Higher
Education
Emergency
Relief Fund
(90% of
available
funds):
Estimated
Allocation
Estimated
Funding
Provided to
the State or
Institutions of
Higher
Education in
the State
Percentage
Share of Fund
Available
Rhode Island $8,709 $46,350 $60,023 $115,082 0.40%
South Carolina $48,157 $216,311 $168,738 $433,206 1.51%
South Dakota $7,946 $41,295 $28,867 $78,108 0.27%
Tennessee $63,614 $259,891 $242,782 $566,287 1.97%
Texas $306,930 $1,285,886 $1,040,602 $2,633,418 9.16%
Utah $29,282 $67,822 $153,577 $250,681 0.87%
Vermont $4,504 $31,148 $22,527 $58,179 0.20%
Virginia $66,331 $238,599 $294,052 $598,982 2.08%
Washington $56,598 $216,892 $221,484 $494,974 1.72%
West Virginia $16,398 $86,640 $66,808 $169,846 0.59%
Wisconsin $46,699 $174,778 $174,858 $396,335 1.38%
Wyoming $4,693 $32,563 $15,089 $52,345 0.18%
Appropriation $2,953,230 $13,229,265 $12,557,255 $28,739,750 100.00%
Source: Table prepared by CRS, based on unpublished data provided by the U.S. Department of Education, Budget
Service; population data for the 50 states and the District of Columbia from the U.S. Census Bureau, Annual Estimates of
the Civilian Population by Single Year of Age and Sex for the United States and States: April 1, 2010 to July 1, 2018 (SC-EST2018-
AGESEX-CIV), https://www2.census.gov/programs-surveys/popest/tables/2010-2018/state/asrh/sc-est2018-agesex-civ.csv;
and population data for Puerto Rico from the U.S. Census Bureau, Annual Estimates of the Resident Population by Single Year
of Age and Sex for the United States, States, and Puerto Rico Commonwealth: April 1, 2010 to July 1, 2018,
https://factfinder.census.gov; unpublished data provided by the U.S. Department of Education (ED), Budget Service; and
data from the U.S. Department of Education (ED), Title IV Programmatic Volume Reports and Integrated Postsecondary
Education Database (IPEDS).
Notes: Details may not add to totals due to rounding. This table includes the full appropriations level for the Governor’s
Emergency Education Relief Fund and the Elementary and Secondary Schools Emergency Relief Fund. It includes 90% of the
funds provided through the Higher Education Emergency Relief Fund. It was not possible to determine state-level funding
under the remaining 10% of funds provided through the Higher Education Emergency Relief Act.
Notice: These are estimated grants only. These estimates are provided solely to assist in gauging the
relative impact of allocation formulas and funding levels in the legislative process. They are not intended to
predict specific amounts states will receive. In addition to other limitations, data needed to calculate final
grants may not yet be available.