Effect of Applied Vibration on Silo Hopper Design Th. Kollmann and J. Tomas Mechanical Process Engineering, Department of Process Engineering, The Otto-von-Guericke- University of Magdeburg, P.O. Box 4120, D-39016 Magdeburg, Germany Abstract The vibration promoted flow of cohesive particulate solids was investigated for Limestone and Titania powder, each with an average particle size of about 1 μm. The flow behaviour of fine cohesive powders can be improved by the application of harmonic vibrations, as reflected in the flow properties. Based on the work of Roberts et al., a shear testing technique has been established that allows the measurement of the effect of vibrations on the flow properties of particulate solids. The experimental results show that the vibration application leads to a significant reduction of the shear strength. The unconfined yield strength decreases with increasing vibration velocity, whereas the angle of internal friction is nearly independent of applied vibration. Also, the unconfined yield strength and the wall friction angle ϕ W can be reduced by applying mechanical vibration. Based on the lab-scale shear tests, the hopper half angle and the unconfined yield strength were estimated. For the given example the conical outlet width is reduced from 0.88 m to about 0.4 m the maximum hopper angle increases from 5° up to approximately 20° due to the vibration application. 1 INTRODUCTION Recently, the production of very fine particles has gained considerable importance in many powder technology applications. Finer particles coincide with increasing adhesion forces and make higher demands on reliable powder storage and handling equipment. ‘Static’ silo hopper design often reach limit when hopper half angles of 10° and below combined with wide outlet dimensions are required. flexible connection vibratory excitor discharge internal baffle vibratory excitor bin (a) (b) Figure 1 Examples for vibrational flow promoting devices: a) vibrator at the hopper wall (left) and b) vibrating hopper (right)
Transcript
Effect of Applied Vibration on Silo Hopper Design
Th. Kollmann and J. Tomas Mechanical Process Engineering, Department of Process Engineering, The Otto-von-Guericke-
University of Magdeburg, P.O. Box 4120, D-39016 Magdeburg, Germany Abstract The vibration promoted flow of cohesive particulate solids was investigated for Limestone and Titania powder, each with an average particle size of about 1 µm. The flow behaviour of fine cohesive powders can be improved by the application of harmonic vibrations, as reflected in the flow properties. Based on the work of Roberts et al., a shear testing technique has been established that allows the measurement of the effect of vibrations on the flow properties of particulate solids. The experimental results show that the vibration application leads to a significant reduction of the shear strength. The unconfined yield strength decreases with increasing vibration velocity, whereas the angle of internal friction is nearly independent of applied vibration. Also, the unconfined yield strength and the wall friction angle ϕW can be reduced by applying mechanical vibration. Based on the lab-scale shear tests, the hopper half angle and the unconfined yield strength were estimated. For the given example the conical outlet width is reduced from 0.88 m to about 0.4 m the maximum hopper angle increases from 5° up to approximately 20° due to the vibration application.
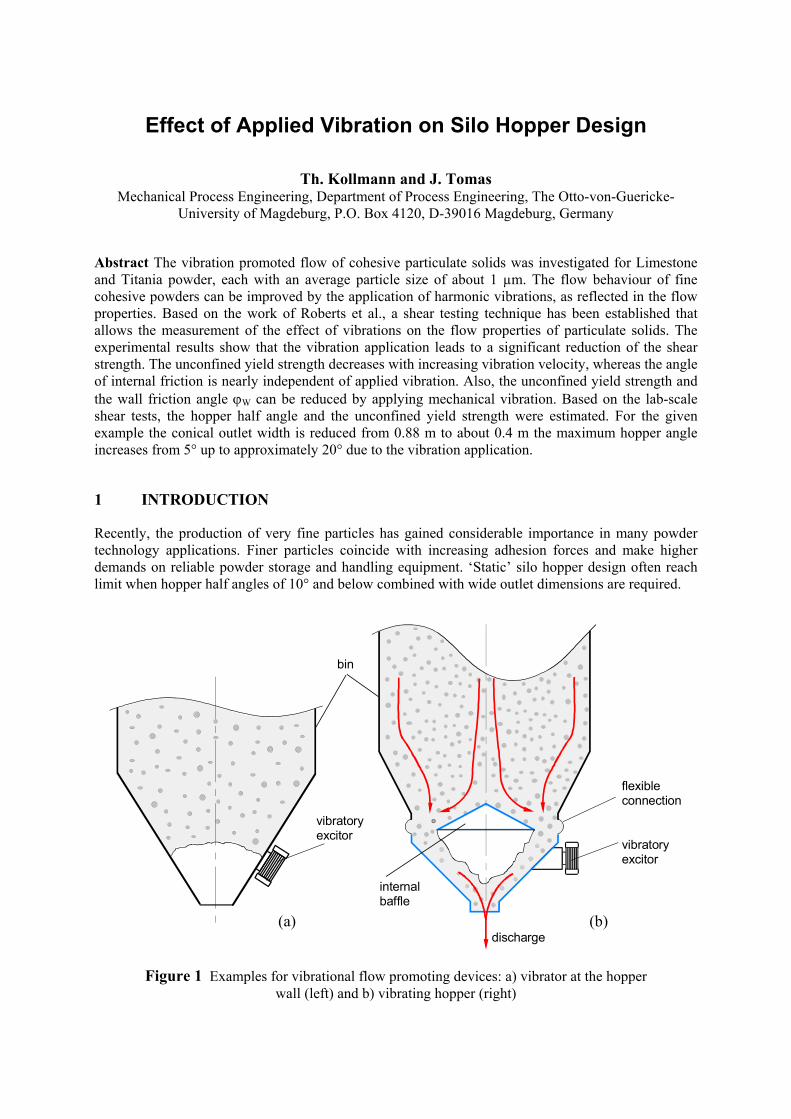
1 INTRODUCTION Recently, the production of very fine particles has gained considerable importance in many powder technology applications. Finer particles coincide with increasing adhesion forces and make higher demands on reliable powder storage and handling equipment. ‘Static’ silo hopper design often reach limit when hopper half angles of 10° and below combined with wide outlet dimensions are required.
flexibleconnection
vibratoryexcitor
discharge
internalbaffle
vibratoryexcitor
bin
(a) (b)
Figure 1 Examples for vibrational flow promoting devices: a) vibrator at the hopper wall (left) and b) vibrating hopper (right)
When trouble-free powder discharge from silos due to gravity seems impossible, mechanical vibration are widely used to promote and control gravity flow. Figure 1 shows two typical applications of mechanical vibrations in flow promoting and bin discharging: a) vibrator, e.g. unbalanced motor or pneumatic vibrator, outside of the bin hopper for vibration of the
hopper wall, b) vibrating hopper (also called bin activator or vibrational disc feeder). A great deal of practical experience for apparatus design has been gained but these recommendations are often not applicable beyond the empirical situation from which they were derived (Bell, 1999, Thomson, 1997). The present work strives to contribute to better understanding of the flow behaviour of very fine, cohesive powders in the presence of harmonic vibrations. The study focuses on the gravity powder flow that is initiated and promoted by the application of harmonic vibrations. Dumbaugh (1984) proposed the term vibration induced gravity flow, an appropriate description for such applications. Based on the work of Roberts et al. (1978, 1984), a test technique has been established and expanded that allows the measurement of the effect of vibrations on the flow properties of particulate solids. Test apparatus and testing technique are based on the wide-spread direct shear test according to Jenike (1964). The Jenike-method has been proven in industrial practice and so the results of the vibrated shear testing are expected to be applicable for storage and handling equipment design as well.
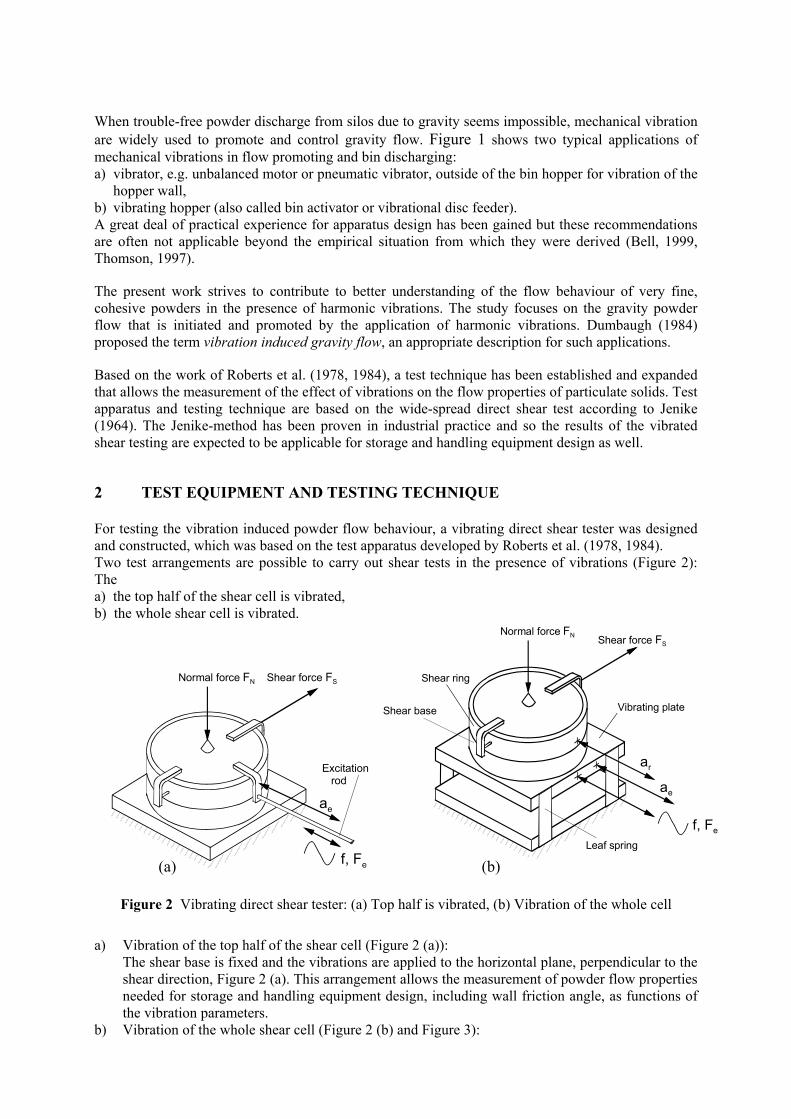
2 TEST EQUIPMENT AND TESTING TECHNIQUE For testing the vibration induced powder flow behaviour, a vibrating direct shear tester was designed and constructed, which was based on the test apparatus developed by Roberts et al. (1978, 1984). Two test arrangements are possible to carry out shear tests in the presence of vibrations (Figure 2): The a) the top half of the shear cell is vibrated, b) the whole shear cell is vibrated.
Excitation rod
f, Fe
ae
Shear force FSNormal force FN
Figure 2 Vibrating direct shear tester: (a) Top half is vibrated, (b) Vibration of the whole cell
Normal force FN
Shear ring
Shear base
Shear force FS
Leaf spring
f, Fe
Vibrating plate
ar
ae
(a) (b)
a) Vibration of the top half of the shear cell (Figure 2 (a)): The shear base is fixed and the vibrations are applied to the horizontal plane, perpendicular to the
shear direction, Figure 2 (a). This arrangement allows the measurement of powder flow properties needed for storage and handling equipment design, including wall friction angle, as functions of the vibration parameters.
b) Vibration of the whole shear cell (Figure 2 (b) and Figure 3):
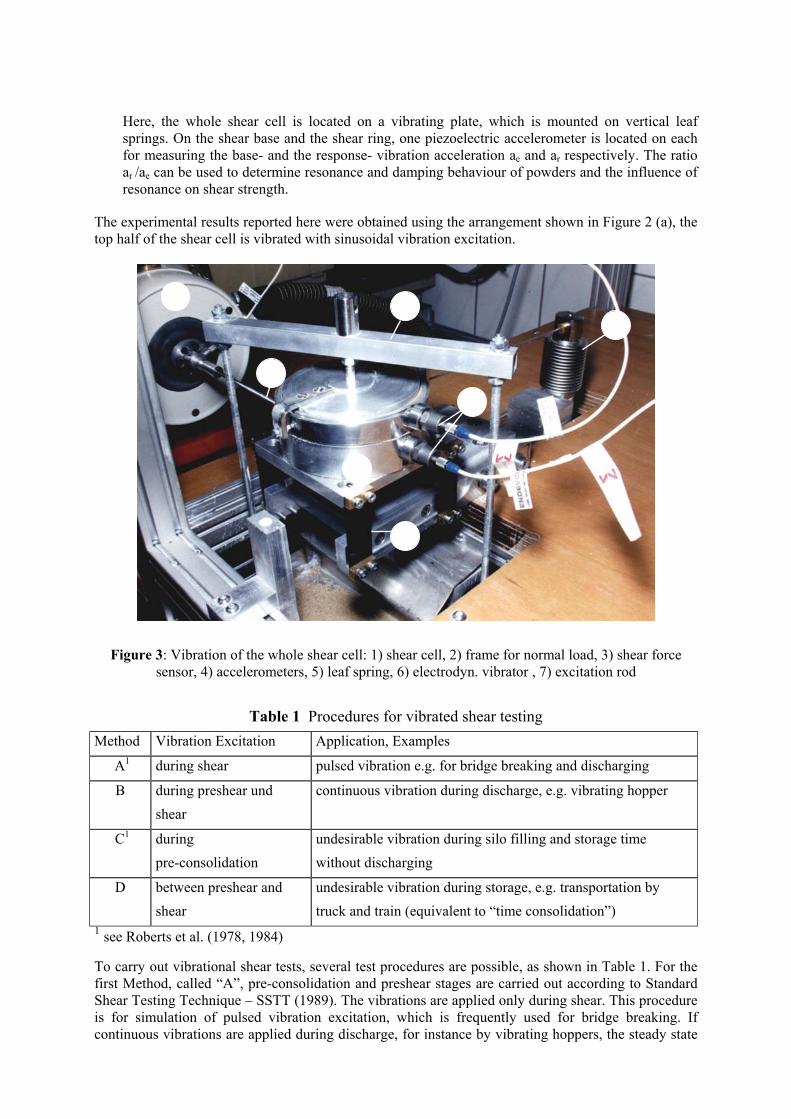
Here, the whole shear cell is located on a vibrating plate, which is mounted on vertical leaf springs. On the shear base and the shear ring, one piezoelectric accelerometer is located on each for measuring the base- and the response- vibration acceleration ae and ar respectively. The ratio ar /ae can be used to determine resonance and damping behaviour of powders and the influence of resonance on shear strength.
The experimental results reported here were obtained using the arrangement shown in Figure 2 (a), the top half of the shear cell is vibrated with sinusoidal vibration excitation.
6
1
3
5
2
7
4
Figure 3: Vibration of the whole shear cell: 1) shear cell, 2) frame for normal load, 3) shear force sensor, 4) accelerometers, 5) leaf spring, 6) electrodyn. vibrator , 7) excitation rod
Table 1 Procedures for vibrated shear testing
Method Vibration Excitation Application, Examples
A1 during shear pulsed vibration e.g. for bridge breaking and discharging
B during preshear und shear
continuous vibration during discharge, e.g. vibrating hopper
C1 during pre-consolidation
undesirable vibration during silo filling and storage time without discharging
D between preshear and shear
undesirable vibration during storage, e.g. transportation by truck and train (equivalent to “time consolidation”)
1 see Roberts et al. (1978, 1984) To carry out vibrational shear tests, several test procedures are possible, as shown in Table 1. For the first Method, called “A”, pre-consolidation and preshear stages are carried out according to Standard Shear Testing Technique – SSTT (1989). The vibrations are applied only during shear. This procedure is for simulation of pulsed vibration excitation, which is frequently used for bridge breaking. If continuous vibrations are applied during discharge, for instance by vibrating hoppers, the steady state
flow of powders will be influenced by the vibrations as well. This procedure can be simulated by method “B”. Here, the vibrations are already applied to the powder sample during preshear. Further procedures are explained in Table 1. However, the focus of present study was only on methods A and B.
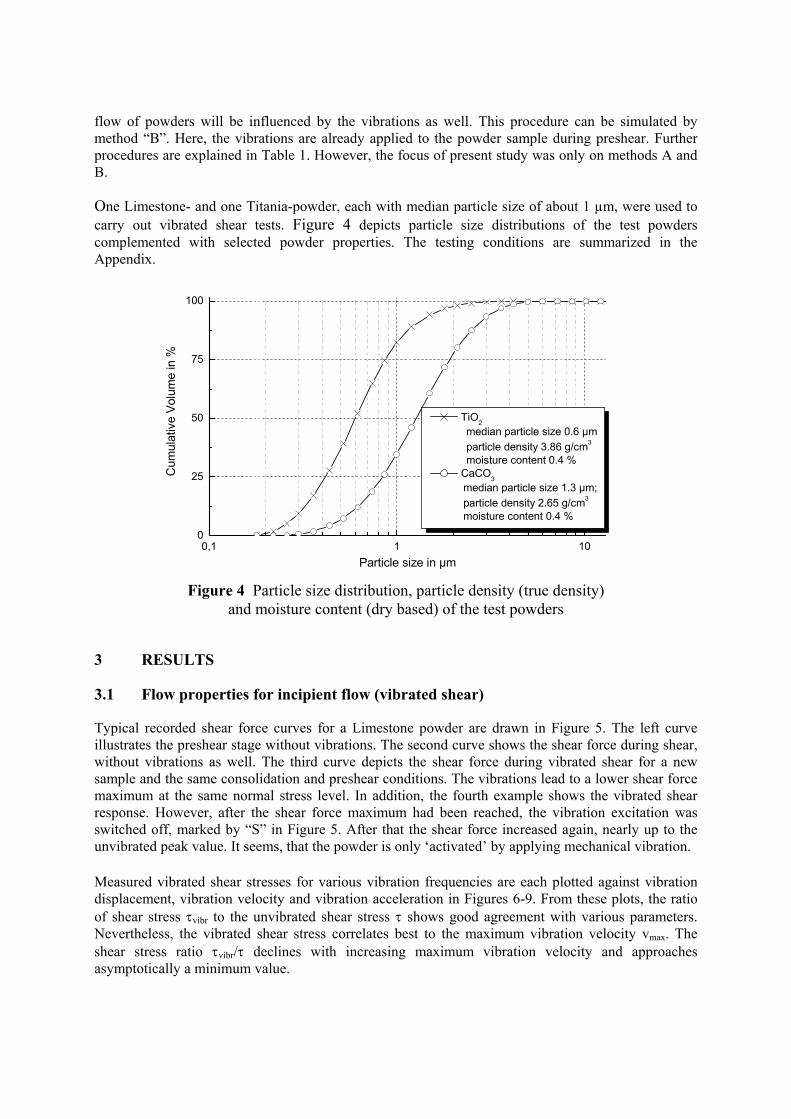
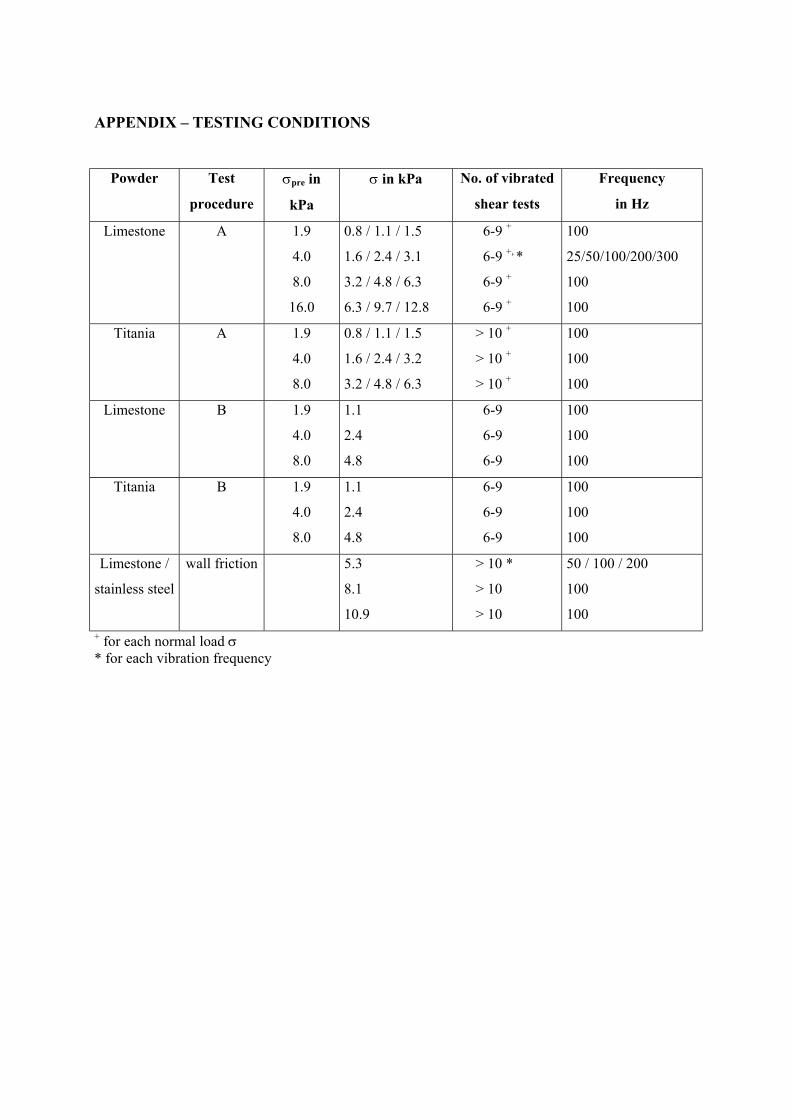
One Limestone- and one Titania-powder, each with median particle size of about 1 µm, were used to carry out vibrated shear tests. Figure 4 depicts particle size distributions of the test powders complemented with selected powder properties. The testing conditions are summarized in the Appendix.
0,1 1 100
25
50
75
100
TiO2 median particle size 0.6 µm particle density 3.86 g/cm3 moisture content 0.4 %
CaCO3 median particle size 1.3 µm; particle density 2.65 g/cm3
moisture content 0.4 %
Cum
ulat
ive
Volu
me
in %
Particle size in µm
Figure 4 Particle size distribution, particle density (true density) and moisture content (dry based) of the test powders
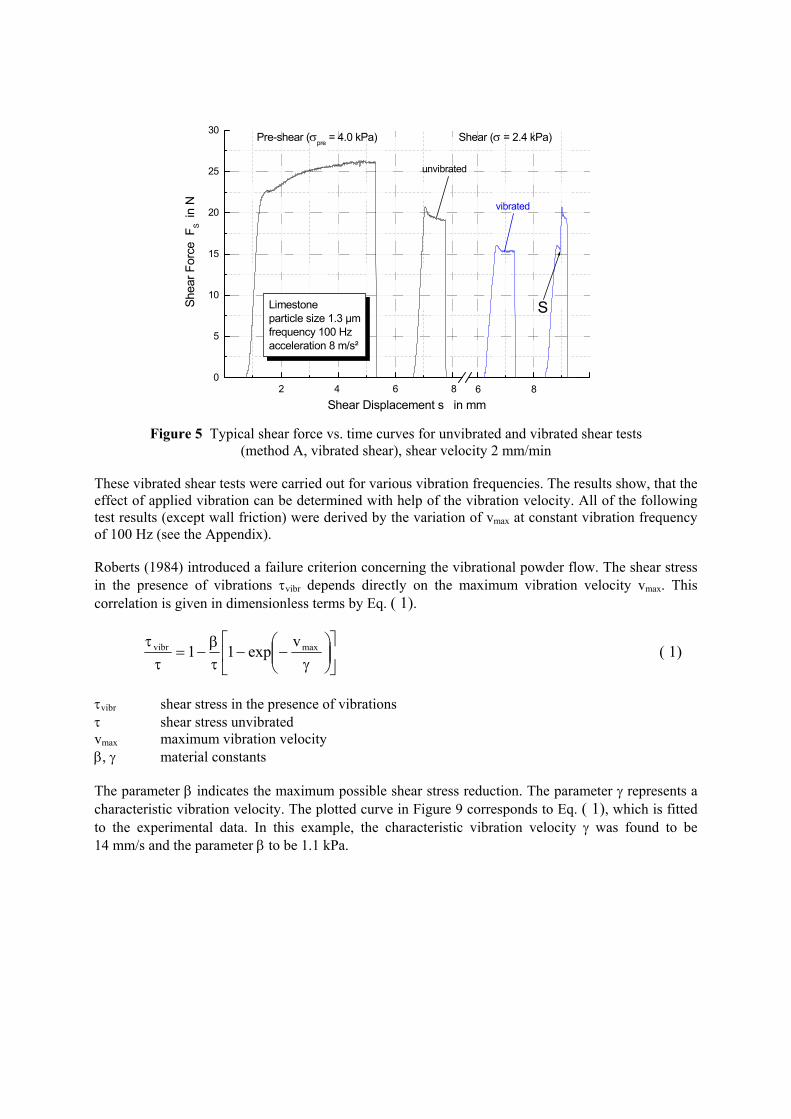
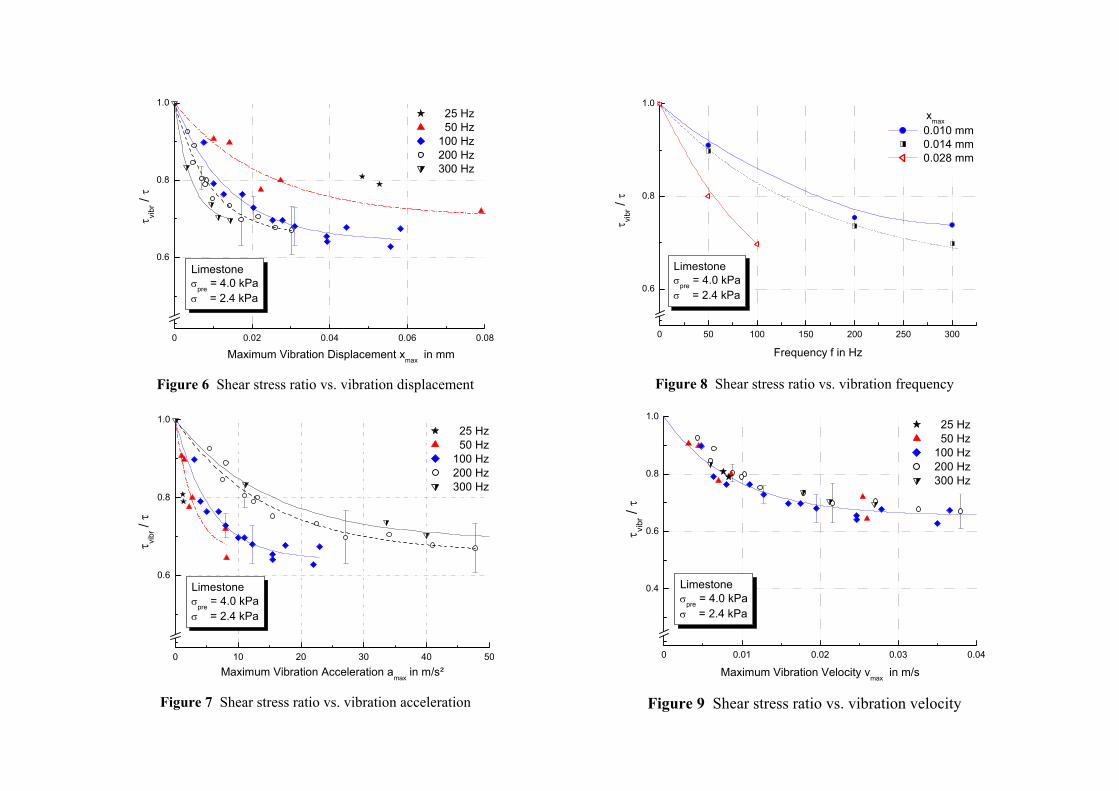
3 RESULTS 3.1 Flow properties for incipient flow (vibrated shear) Typical recorded shear force curves for a Limestone powder are drawn in Figure 5. The left curve illustrates the preshear stage without vibrations. The second curve shows the shear force during shear, without vibrations as well. The third curve depicts the shear force during vibrated shear for a new sample and the same consolidation and preshear conditions. The vibrations lead to a lower shear force maximum at the same normal stress level. In addition, the fourth example shows the vibrated shear response. However, after the shear force maximum had been reached, the vibration excitation was switched off, marked by “S” in Figure 5. After that the shear force increased again, nearly up to the unvibrated peak value. It seems, that the powder is only ‘activated’ by applying mechanical vibration. Measured vibrated shear stresses for various vibration frequencies are each plotted against vibration displacement, vibration velocity and vibration acceleration in Figures 6-9. From these plots, the ratio of shear stress τvibr to the unvibrated shear stress τ shows good agreement with various parameters. Nevertheless, the vibrated shear stress correlates best to the maximum vibration velocity vmax. The shear stress ratio τvibr/τ declines with increasing maximum vibration velocity and approaches asymptotically a minimum value.
Figure 5 Typical shear force vs. time curves for unvibrated and vibrated shear tests (method A, vibrated shear), shear velocity 2 mm/min
These vibrated shear tests were carried out for various vibration frequencies. The results show, that the effect of applied vibration can be determined with help of the vibration velocity. All of the following test results (except wall friction) were derived by the variation of vmax at constant vibration frequency of 100 Hz (see the Appendix). Roberts (1984) introduced a failure criterion concerning the vibrational powder flow. The shear stress in the presence of vibrations τvibr depends directly on the maximum vibration velocity vmax. This correlation is given in dimensionless terms by Eq. ( 1).
γ
−−τβ
−=τ
τ maxvibr vexp11 ( 1)
τvibr shear stress in the presence of vibrations τ shear stress unvibrated vmax maximum vibration velocity β, γ material constants The parameter β indicates the maximum possible shear stress reduction. The parameter γ represents a characteristic vibration velocity. The plotted curve in Figure 9 corresponds to Eq. ( 1), which is fitted to the experimental data. In this example, the characteristic vibration velocity γ was found to be 14 mm/s and the parameter β to be 1.1 kPa.
0 0.02 0.04 0.06 0.08
0.6
0.8
1.0
Limestone σpre = 4.0 kPaσ = 2.4 kPa
25 Hz 50 Hz 100 Hz 200 Hz 300 Hz
τ vibr /
τ
Maximum Vibration Displacement xmax in mm
Figure 6 Shear stress ratio vs. vibration displacement
0 10 20 30 40 50
0.6
0.8
1.0
Limestone σpre = 4.0 kPaσ = 2.4 kPa
25 Hz 50 Hz 100 Hz 200 Hz 300 Hz
τ vibr /
τ
Maximum Vibration Acceleration amax in m/s²
Figure 7 Shear stress ratio vs. vibration acceleration
0 50 100 150 200 250 300
0.6
0.8
1.0
Limestone σpre = 4.0 kPaσ = 2.4 kPa
xmax 0.010 mm 0.014 mm 0.028 mm
τ vibr /
τ
Frequency f in Hz Figure 8 Shear stress ratio vs. vibration frequency
0 0.01 0.02 0.03 0.04
0.4
0.6
0.8
1.0
Limestone σpre = 4.0 kPaσ = 2.4 kPa
25 Hz 50 Hz 100 Hz 200 Hz 300 Hz
τ vibr /
τ
Maximum Vibration Velocity vmax in m/s
Figure 9 Shear stress ratio vs. vibration velocity
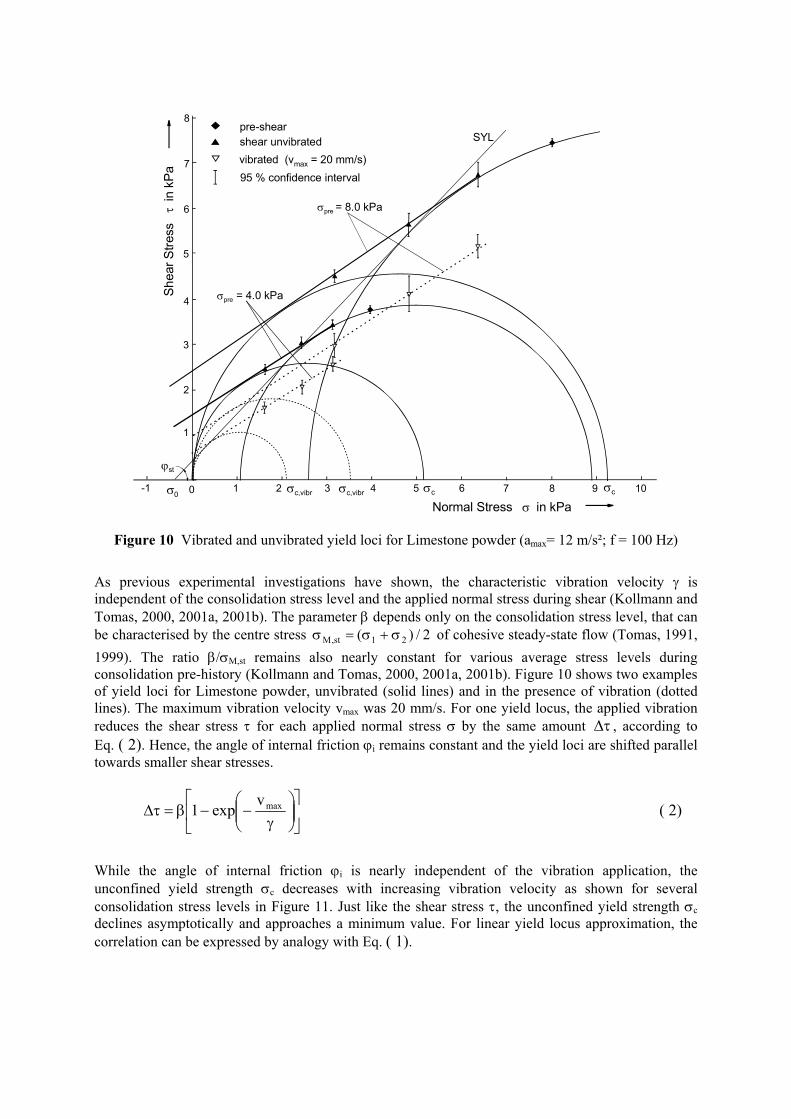
Figure 10 Vibrated and unvibrated yield loci for Limestone powder (amax= 12 m/s²; f = 100 Hz)
As previous experimental investigations have shown, the characteristic vibration velocity γ is independent of the consolidation stress level and the applied normal stress during shear (Kollmann and Tomas, 2000, 2001a, 2001b). The parameter β depends only on the consolidation stress level, that can be characterised by the centre stress of cohesive steady-state flow (Tomas, 1991, 1999). The ratio β/σ
2/)( 21st,M σ+σ=σ
M,st remains also nearly constant for various average stress levels during consolidation pre-history (Kollmann and Tomas, 2000, 2001a, 2001b). Figure 10 shows two examples of yield loci for Limestone powder, unvibrated (solid lines) and in the presence of vibration (dotted lines). The maximum vibration velocity vmax was 20 mm/s. For one yield locus, the applied vibration reduces the shear stress τ for each applied normal stress σ by the same amount , according to Eq. ( 2). Hence, the angle of internal friction ϕ
τ∆i remains constant and the yield loci are shifted parallel
towards smaller shear stresses.
γ
−−β=τ∆ maxvexp1 ( 2)
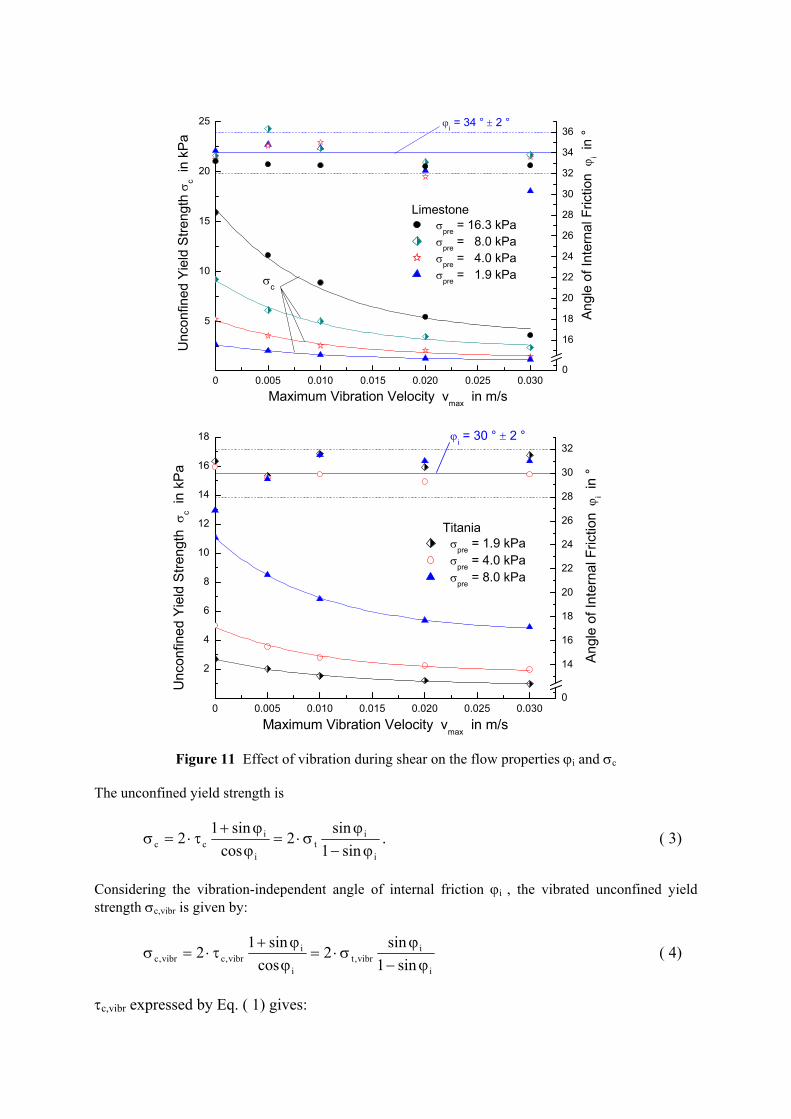
While the angle of internal friction ϕi is nearly independent of the vibration application, the unconfined yield strength σc decreases with increasing vibration velocity as shown for several consolidation stress levels in Figure 11. Just like the shear stress τ, the unconfined yield strength σc declines asymptotically and approaches a minimum value. For linear yield locus approximation, the correlation can be expressed by analogy with Eq. ( 1).
Figure 11 Effect of vibration during shear on the flow properties ϕi and σc
The unconfined yield strength is
i
it
i
icc sin1
sin2cos
sin12ϕ−
ϕσ⋅=
ϕϕ+
τ⋅=σ . ( 3)
Considering the vibration-independent angle of internal friction ϕi , the vibrated unconfined yield strength σc,vibr is given by:
i
ivibr,t
i
ivibr,cvibr,c sin1
sin2cos
sin12ϕ−
ϕσ⋅=
ϕϕ+
τ⋅=σ ( 4)
τc,vibr expressed by Eq. ( 1) gives:
γ
−−τβ
−ϕ
ϕ+τ⋅=σ max
ci
icvibr,c
vexp11
cossin1
2 ( 5)
The tensile strength σt in terms of the angle of internal friction ϕi is expressed as:
( 6) ivibr,cvibr,t tan/ ϕτ=σ
Combining Eqs. ( 5) and ( 6) leads to:
γ
−−ϕ⋅σ
β−
ϕ−ϕ
σ⋅=σ max
iti
itvibr,c
vexp1
tan1
sin1sin2 . ( 7)
The curves for the unconfined yield strength in Figure 11 are given by Eq. ( 7) and the material parameters β and γ.
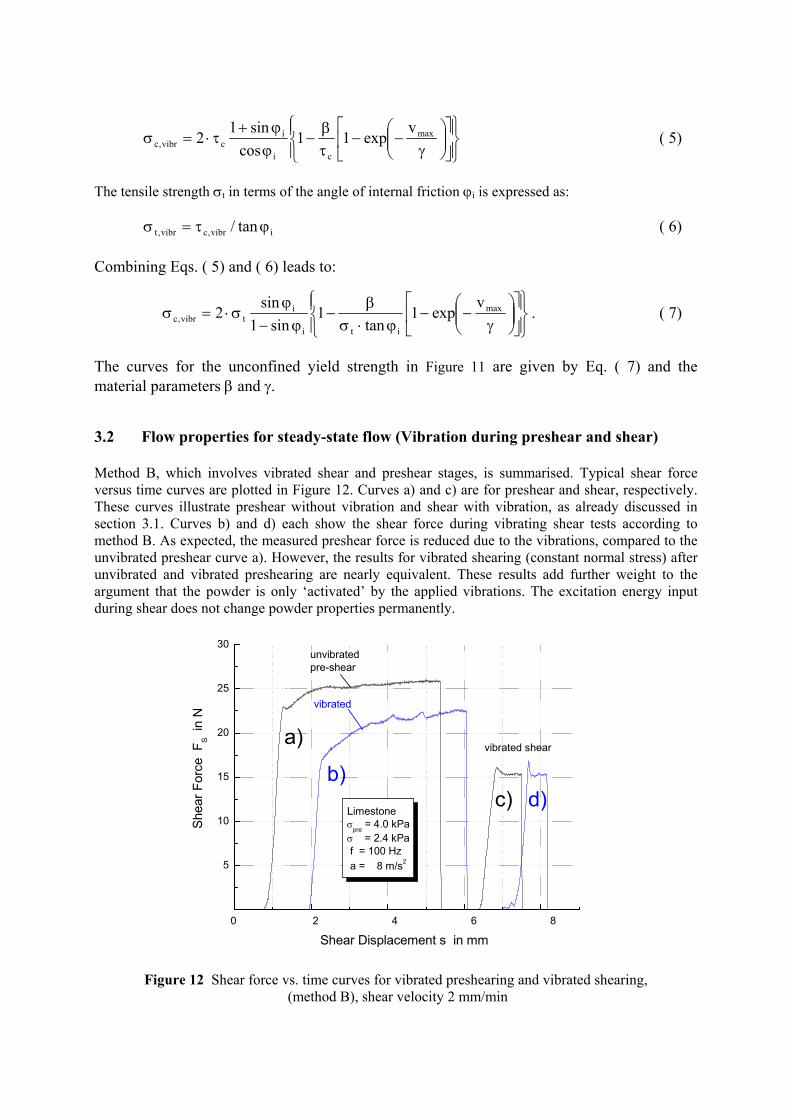
3.2 Flow properties for steady-state flow (Vibration during preshear and shear) Method B, which involves vibrated shear and preshear stages, is summarised. Typical shear force versus time curves are plotted in Figure 12. Curves a) and c) are for preshear and shear, respectively. These curves illustrate preshear without vibration and shear with vibration, as already discussed in section 3.1. Curves b) and d) each show the shear force during vibrating shear tests according to method B. As expected, the measured preshear force is reduced due to the vibrations, compared to the unvibrated preshear curve a). However, the results for vibrated shearing (constant normal stress) after unvibrated and vibrated preshearing are nearly equivalent. These results add further weight to the argument that the powder is only ‘activated’ by the applied vibrations. The excitation energy input during shear does not change powder properties permanently.
5
10
15
20
25
30
b)c) d)
a)
0 2 4 6 8
Shear Displacement s in mm
Shea
r For
ce F
S in
N
vibrated shear
unvibratedpre-shear
vibrated
Limestone σpre = 4.0 kPaσ = 2.4 kPa f = 100 Hz a = 8 m/s2
Figure 12 Shear force vs. time curves for vibrated preshearing and vibrated shearing,
(method B), shear velocity 2 mm/min
0.005 0.010 0.015 0.020 0.025 0.0300
26
28
30
32
34
36
38
40
42
44
46
48
ϕi ≈ 34 °
Limestone ϕst
σ 0 in k
Pa
ϕ st in
°
Maximum Vibration Velocity vmax in m/s
0.25
0.50
0.75
1.00
1.25
1.50
1.75
2.00
σ0
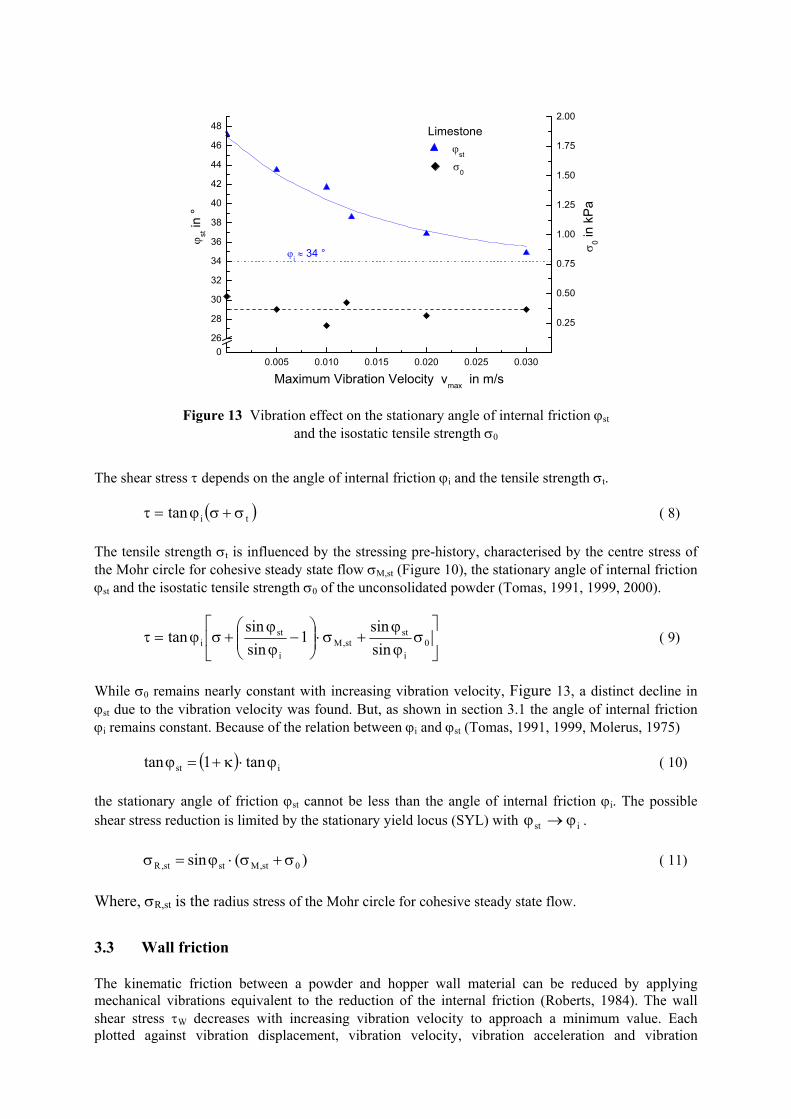
Figure 13 Vibration effect on the stationary angle of internal friction ϕst
and the isostatic tensile strength σ0
The shear stress τ depends on the angle of internal friction ϕi and the tensile strength σt.
( 8) ( titan σ+σϕ=τ )
The tensile strength σt is influenced by the stressing pre-history, characterised by the centre stress of the Mohr circle for cohesive steady state flow σM,st (Figure 10), the stationary angle of internal friction ϕst and the isostatic tensile strength σ0 of the unconsolidated powder (Tomas, 1991, 1999, 2000).
σ
ϕϕ
+σ⋅
−
ϕϕ
+σϕ=τ 0i
stst,M
i
sti sin
sin1
sinsin
tan ( 9)
While σ0 remains nearly constant with increasing vibration velocity, Figure 13, a distinct decline in ϕst due to the vibration velocity was found. But, as shown in section 3.1 the angle of internal friction ϕi remains constant. Because of the relation between ϕi and ϕst (Tomas, 1991, 1999, Molerus, 1975)
( 10) ( ) ist tan1tan ϕ⋅κ+=ϕ
the stationary angle of friction ϕst cannot be less than the angle of internal friction ϕi. The possible shear stress reduction is limited by the stationary yield locus (SYL) with . ist ϕ→ϕ
( 11) )(sin 0st,Mstst,R σ+σ⋅ϕ=σ
Where, σR,st is the radius stress of the Mohr circle for cohesive steady state flow. 3.3 Wall friction The kinematic friction between a powder and hopper wall material can be reduced by applying mechanical vibrations equivalent to the reduction of the internal friction (Roberts, 1984). The wall shear stress τW decreases with increasing vibration velocity to approach a minimum value. Each plotted against vibration displacement, vibration velocity, vibration acceleration and vibration
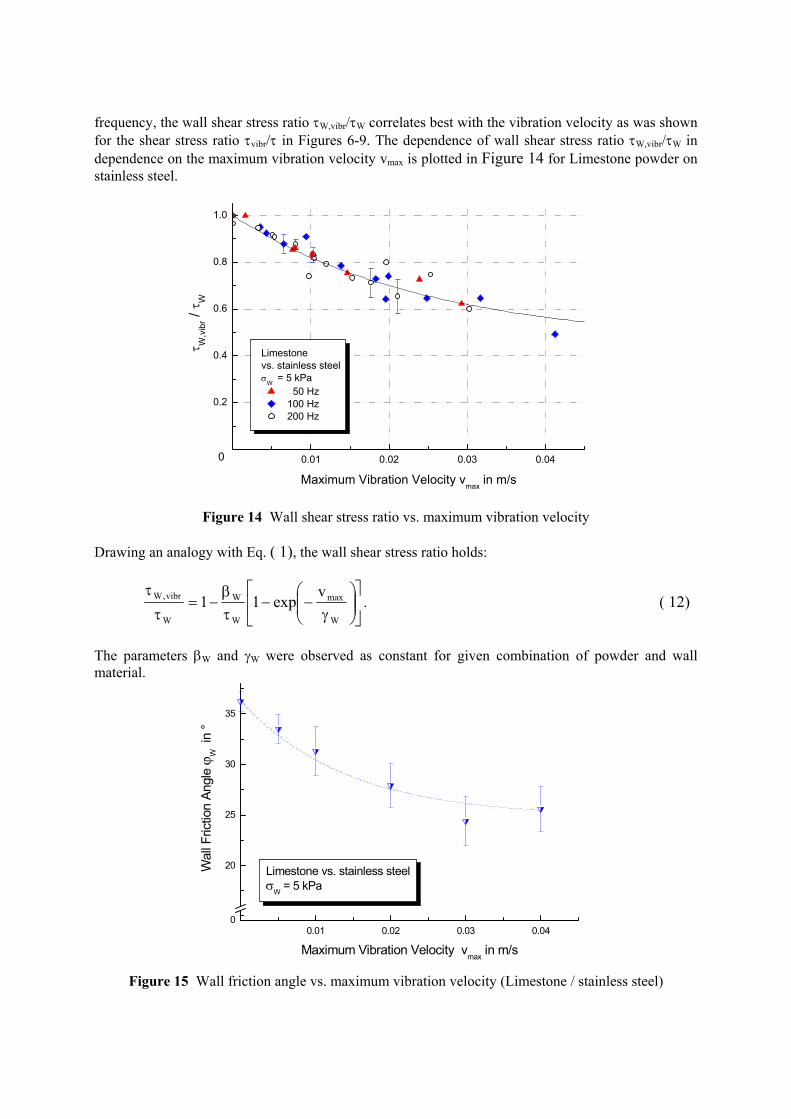
frequency, the wall shear stress ratio τW,vibr/τW correlates best with the vibration velocity as was shown for the shear stress ratio τvibr/τ in Figures 6-9. The dependence of wall shear stress ratio τW,vibr/τW in dependence on the maximum vibration velocity vmax is plotted in Figure 14 for Limestone powder on stainless steel.
Figure 14 Wall shear stress ratio vs. maximum vibration velocity
Drawing an analogy with Eq. ( 1), the wall shear stress ratio holds:
γ
−−τβ
−=τ
τ
W
max
W
W
W
vibr,W vexp11 . ( 12)
The parameters βW and γW were observed as constant for given combination of powder and wall material.
0.01 0.02 0.03 0.040
20
25
30
35
Limestone vs. stainless steelσW = 5 kPa
Wal
l Fric
tion
Angl
e ϕ W
in
°
Maximum Vibration Velocity vmax in m/s
Figure 15 Wall friction angle vs. maximum vibration velocity (Limestone / stainless steel)
The decline of wall shear stress coincides with the decrease in the wall friction angle ϕW. In Figure 15, the wall friction angle ϕW is plotted against the maximum vibration velocity vmax for Limestone on stainless steel. Because of
( 13) WWW /tan στ=ϕ
and Eq. ( 12) the following relationship for vibrated wall friction angle ϕW,vibr holds:
γ
−−⋅τβ
−⋅στ
=ϕW
max
W
W
W
Wvibr,W
vexp11tan . ( 14)
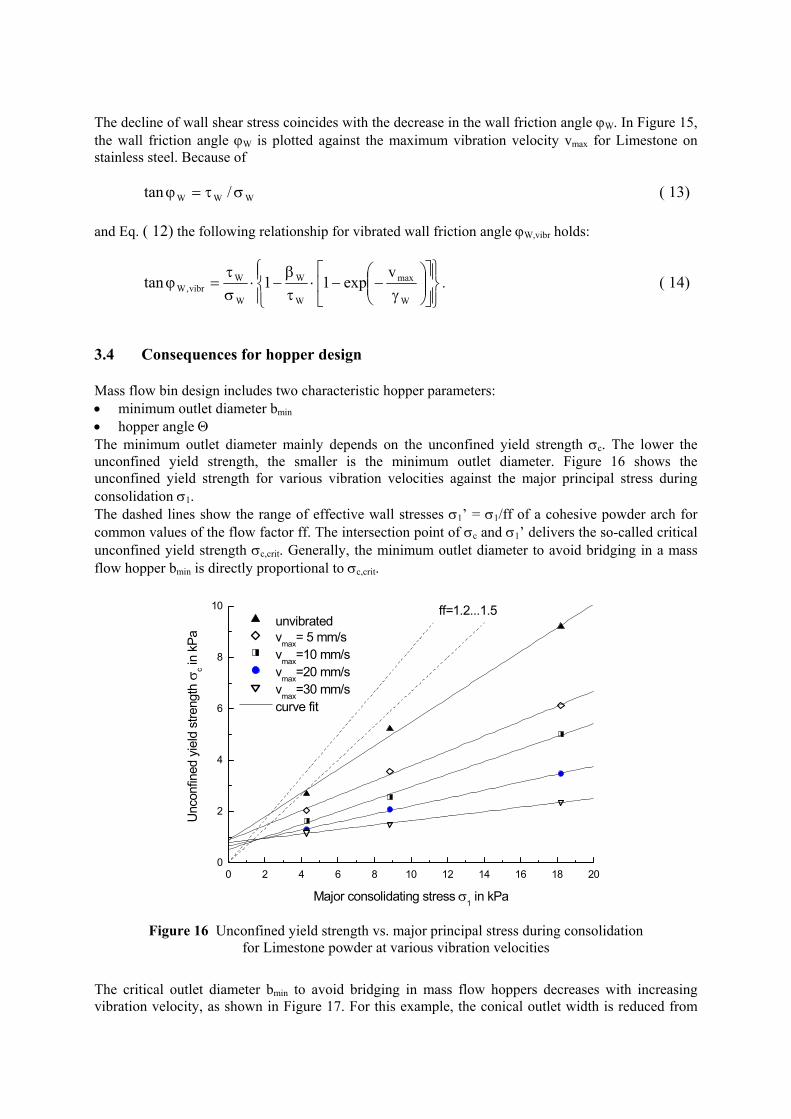
3.4 Consequences for hopper design Mass flow bin design includes two characteristic hopper parameters: • minimum outlet diameter bmin • hopper angle Θ The minimum outlet diameter mainly depends on the unconfined yield strength σc. The lower the unconfined yield strength, the smaller is the minimum outlet diameter. Figure 16 shows the unconfined yield strength for various vibration velocities against the major principal stress during consolidation σ1. The dashed lines show the range of effective wall stresses σ1’ = σ1/ff of a cohesive powder arch for common values of the flow factor ff. The intersection point of σc and σ1’ delivers the so-called critical unconfined yield strength σc,crit. Generally, the minimum outlet diameter to avoid bridging in a mass flow hopper bmin is directly proportional to σc,crit.
Figure 16 Unconfined yield strength vs. major principal stress during consolidation for Limestone powder at various vibration velocities
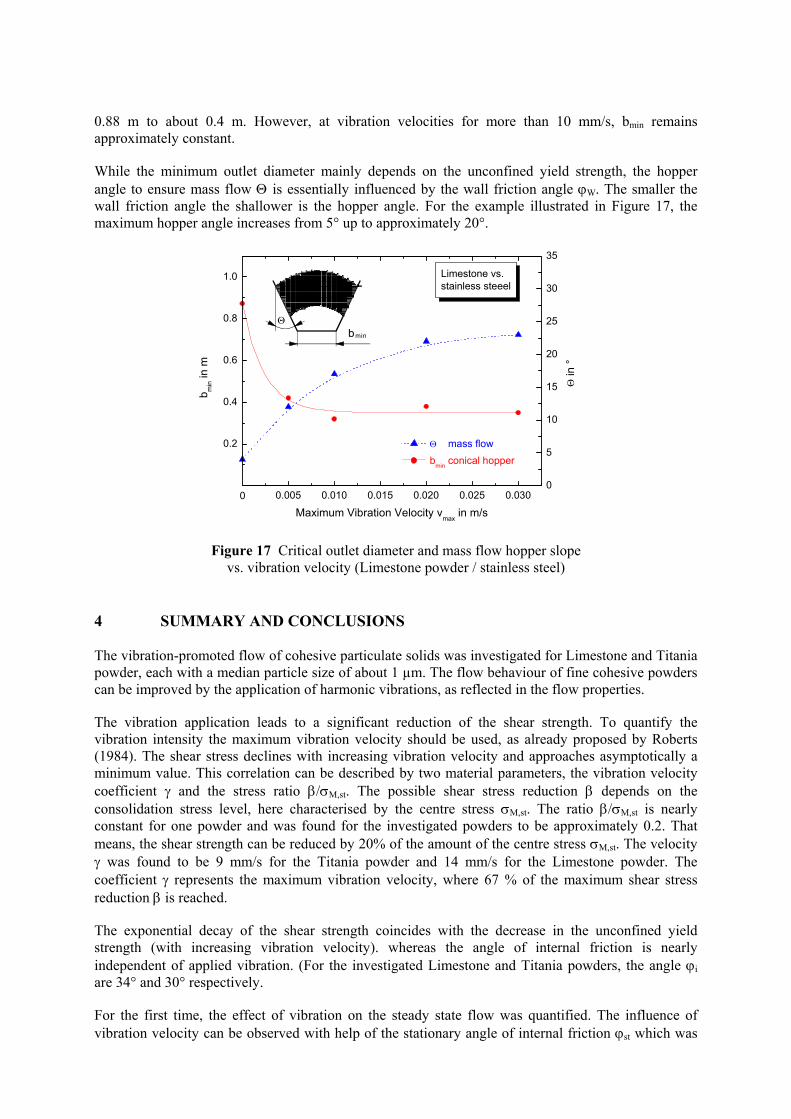
The critical outlet diameter bmin to avoid bridging in mass flow hoppers decreases with increasing vibration velocity, as shown in Figure 17. For this example, the conical outlet width is reduced from
0.88 m to about 0.4 m. However, at vibration velocities for more than 10 mm/s, bmin remains approximately constant. While the minimum outlet diameter mainly depends on the unconfined yield strength, the hopper angle to ensure mass flow Θ is essentially influenced by the wall friction angle ϕW. The smaller the wall friction angle the shallower is the hopper angle. For the example illustrated in Figure 17, the maximum hopper angle increases from 5° up to approximately 20°.
0.005 0.010 0.015 0.020 0.025 0.0300
5
10
15
20
25
30
35
Limestone vs. stainless steeel
Θ in
°
Θ mass flow0.2
0.4
0.6
0.8
1.0
bmin
Θ
0
bm
in in
m
Maximum Vibration Velocity vmax in m/s
bmin conical hopper
Figure 17 Critical outlet diameter and mass flow hopper slope vs. vibration velocity (Limestone powder / stainless steel)
4 SUMMARY AND CONCLUSIONS The vibration-promoted flow of cohesive particulate solids was investigated for Limestone and Titania powder, each with a median particle size of about 1 µm. The flow behaviour of fine cohesive powders can be improved by the application of harmonic vibrations, as reflected in the flow properties. The vibration application leads to a significant reduction of the shear strength. To quantify the vibration intensity the maximum vibration velocity should be used, as already proposed by Roberts (1984). The shear stress declines with increasing vibration velocity and approaches asymptotically a minimum value. This correlation can be described by two material parameters, the vibration velocity coefficient γ and the stress ratio β/σM,st. The possible shear stress reduction β depends on the consolidation stress level, here characterised by the centre stress σM,st. The ratio β/σM,st is nearly constant for one powder and was found for the investigated powders to be approximately 0.2. That means, the shear strength can be reduced by 20% of the amount of the centre stress σM,st. The velocity γ was found to be 9 mm/s for the Titania powder and 14 mm/s for the Limestone powder. The coefficient γ represents the maximum vibration velocity, where 67 % of the maximum shear stress reduction β is reached. The exponential decay of the shear strength coincides with the decrease in the unconfined yield strength (with increasing vibration velocity). whereas the angle of internal friction is nearly independent of applied vibration. (For the investigated Limestone and Titania powders, the angle ϕi are 34° and 30° respectively. For the first time, the effect of vibration on the steady state flow was quantified. The influence of vibration velocity can be observed with help of the stationary angle of internal friction ϕst which was
reduced by vibration application by approximately 10°. The shear stress during steady state flow is reduced just as described for the shear stress during incipient flow. However, vibration during preshear only slightly changes the powder properties after preshearing. The vibration does not change the powder properties permanently. The powder is only dynamically activated by means of the additional energy input. Equivalent to the internal friction of powders, the kinematic friction between powder and hopper wall material can be lowered. The wall shear stress also correlates best to the maximum vibration velocity. The wall shear stress reduction βW was about 2 kPa (independent on the wall normal stess) for both Titania and Limestone. The experimental results show that the unconfined yield strength σc as well as the wall friction angle ϕW can be reduced by applying mechanical vibration. The minimum outlet diameter of silo hoppers mainly depends on the unconfined yield strength. The hopper angle to ensure mass flow Θ is essentially influenced by the wall friction angle ϕW. Hence, smaller outlet diameters and shallower mass flow hopper angles are possible. Based on the lab-scale shear tests the hopper half angle and the unconfined yield strength were estimated. For the given example, the conical outlet diameter is reduced from 0.88 m to about 0.4 m the maximum hopper angle increases from 5° up to approximately 20°.
5 ACKNOWLEDGEMENT The research described in this paper has been sponsored by the Deutsche Forschungsgemeinschaft (DFG). We would like to acknowledge the DFG for their support. We are also indebted to Ammar Al-Hilo, Elisaveta Georgieva Shopova, Aimo Haack and Guido Kache, who derived many experimental results. They are much appreciated.
6 NOMENCLATURE Symbols Indices a vibration acceleration, m/s² c compressive bmin critical outlet diameter, m crit critical f frequency, Hz e exciting F force, N M centre v vibration velocity, m/s max maximum value β maximum shear stress reduction, kPa n normal γ characteristic velocity, m/s pre preshear Θ hopper angle r response κ particle contact consolidation coefficient S shear σ normal stress, kPa st stationary σc unconfined yield strength, kPa vibr vibration σM,st centre stress for steady-state flow, kPa σt tensile strength, kPa σ0 isostatic tensile strength, kPa σ1, σ2 principle stresses, kPa τ shear stress, kPa τc cohesion, kPa ϕi angle of internal friction, deg ϕst stationary angle of internal friction, deg
7 REFERENCES Bell, T.A., 1999. Industrial Needs in Solids Flow for the 21st Century, Powder Handling &
Processing, 11, 9-12. Thomson, F.M., 1997. Storage and flow of particulate solids, M.E. Fayed and L. Otten (eds.):
Handbook of Powder Science and Technology, 2nd ed., Chapman & Hall, New York, 389-486. Dumbaugh, G.D., 1984. The Induced Vertical Flow of Bulk Solids from Storage. Bulk Solids
Handling, 4: 153-171. Roberts, A.W. and Scott, O.J., 1978. An Investigation into the Effects of Sinusoidal and Random
Vibrations on the Strength and Flow Properties of Bulk Solids, Powder Technology, 21: 45-53. Roberts, A.W., 1984. Vibration of Powders and its Application, M.E. Fayed and L. Otten (eds.),
Handbook on Powder Science and Technology, Van Nostrand, 181-229. Jenike, A.W., 1964. Storage and flow of Solids, Bul. 123, University of Utah, Utah Engineering
Station. Standard shear testing technique for particulate solids using the Jenike shear cell, 1989. Institution of
Chemical Engineers, European Federation of Chemical Engineering. Kollmann, Th. and Tomas, J., 2000. On the vibrational flow of fine powders, The 3rd Israeli
Conference for Conveying and Handling of Particulate Solids, The Dead Sea, Israel, 3.66-3.72. Kollmann, Th. and Tomas, J., 2001a. Vibrational flow of fine powders, Handbook of Conveying and
Handling of Particulate Solids, Kalman, H. and Levi, A., Elsevier, 45-56. Kollmann, Th. and Tomas, J., 2001b. The Influence of Applied Vibration on the Friction of
Limestone and Titania Powders. J.H. Adair, V.M. Puri, K.S. Haris and C.C. Huang (eds.): Fine Powder Processing ’01, Penn State University, PA, USA, 332-342.
Tomas, J., 1991. Modellierung des Fließverhaltens von Schüttgütern auf der Grundlage der Wechselwirkungskräfte zwischen den Partikeln und Anwendung bei der Auslegung von Bunkeranlagen, Habilitation, TU Bergakademie Freiberg.
Tomas, J., 1999. Particle Adhesion Fundamentals and Bulk Powder Consolidation, Reliable Flow of Particulate Solids III, Porsgrunn, 641-656.
Tomas, J., 2000. Particle Adhesion Fundamentals and Bulk Powder Consolidation, KONA, No 18: 157-169.
Molerus, O., 1975. Theory of yield of cohesive powders, Powder Technology, 12: 259-275.
APPENDIX – TESTING CONDITIONS
Powder Test
procedure
σpre in
kPa
σ in kPa No. of vibrated
shear tests
Frequency
in Hz
Limestone A 1.9
4.0
8.0
16.0
0.8 / 1.1 / 1.5
1.6 / 2.4 / 3.1
3.2 / 4.8 / 6.3
6.3 / 9.7 / 12.8
6-9 +
6-9 +, *
6-9 +
6-9 +
100
25/50/100/200/300
100
100
Titania A 1.9
4.0
8.0
0.8 / 1.1 / 1.5
1.6 / 2.4 / 3.2
3.2 / 4.8 / 6.3
> 10 +
> 10 +
> 10 +
100
100
100
Limestone B 1.9
4.0
8.0
1.1
2.4
4.8
6-9
6-9
6-9
100
100
100
Titania B 1.9
4.0
8.0
1.1
2.4
4.8
6-9
6-9
6-9
100
100
100
Limestone /
stainless steel
wall friction 5.3
8.1
10.9
> 10 *
> 10
> 10
50 / 100 / 200
100
100 + for each normal load σ * for each vibration frequency