Page 1
Global Journal of Agricultural Research
Vol.4, No.4, pp.29-46, September 2016
Published by European Centre for Research Training and Development UK (www.eajurnals.org)
29
ISSN 2053-5805(Print), ISSN 2053-5805(Print)
Effect of Chemical, Organic and Biological Fertilizers on Protein Concentration
and Protein Electrophoretic Profiles of Wheat Plants Irrigated with Seawater
Sameera O. Bafeel, Amany S. Alerwy*& Abdulmoneam Al-Toukhy
Dept. Biological Sciences, Faculty of Sciences King Abdul Aziz Univ, KSA
ABSTRACT: Wheat plants grown under 0%, 20% and 40% of seawater, 0, 100, 250
and 500 kg/ha of urea as chemical fertilizer; Rhizobium and Azotobacter as
biofertilizer; and 0, 5, 10 and 20 kg/ha of humic acid as organic fertilizer. Soluble,
insoluble and total proteins as well as RAPD-PCR were evaluated. To obtain reliable
molecular markers for response to salinity in such genotype, RAPD banding patterns
by using two primers. It was found that low concentration (20%) of seawater caused
an observed increase in soluble protein. While, high concentration (40%) of seawater
caused a significant decrease in soluble and insoluble proteins as well as total
proteins. Biological and organic fertilizer treatments increased total proteins even at
40% seawater treatment as compared with unfertilized plants at the same level of
seawater. The results of RAPD analysis showed that the two primers (OPUPC-75 and
OPA18 could efficiently align genomic DNA of wheat. Approximately 88 bands (AF)
were amplified under different treatments using the two primers. Monomorphic and
polymorphic bands ware present in all individuals, and the mean percentage of
polymorphic bands for all treatments was 76.2%, with molecular sizes ranging from
350 to 1900 pb. It was observed also that eight bands of the 88 commonly detected in
all the samples, so it could be the specific genus bands of Triticum aestivum species.
It seems that the extensive polymorphism detected among seawater and
fertilizertreatments elevated the degree of change occurring in DNA sequences.
Keywords: Chlorophyll, electrophoretic patterns, soluble proteins, salinity, sorghum.
INTRODUCTION
Wheat (Triticum aestivum L.) is a glycopyte species and is important crop grown in
the semi-arid areas of Saudi Arabia on soils prone to salinity. Increasing wheat
production is a national target to fill the gap between production and consumption.
Saudi Arabia needs sustained agricultural development to cope with the social and
economic obligations that are the normal consequences of the continued high rates of
population growth. This urgent need requires continuous scientifically based
implementation of effective agricultural practices. Problems related to the agricultural
systems, deficiencies of agricultural research plans, traditional agriculture, lack of
agricultural knowledge and information among most World farmers have caused
irreparable damage to plant productivity in economies of these countries. Besides,
salinity of soils and waters caused serious problems for crop production. Appropriate
management of organic and biofertilizers reduces the potential disadvantages in
comparison to the mineral fertilizers (Ahmed et al. 2011). Therefore, in the
development and implementation of sustainable agriculture techniques, organic
fertilization and biofertilization has great importance in alleviating environmental
pollution and deterioration of nature (Jalilian et al., 2012; Mehran et al., 2011).
Page 2
Global Journal of Agricultural Research
Vol.4, No.4, pp.29-46, September 2016
Published by European Centre for Research Training and Development UK (www.eajurnals.org)
30
ISSN 2053-5805(Print), ISSN 2053-5805(Print)
Classical methods of screening for salt tolerance were based on the plant yield and are
very costly and time consuming. Environmental salinity resistance in plants is
recognizable through some parameters. For example, measurements of major
physiological and biochemical traits, including proline content and protein
concentration, can be used to monitor plant responses to salt stress (Bavei et al.,
2011a). Crops in saline soils are faced with reductions in water absorption,
insufficient nutrient availability, accumulation of toxic ions, or K+ and Ca++
depletion in plant tissues (Taiz and Zeiger, 2010), disturbances in metabolic activity
such as respiration, photosynthesis (Ouzounidou et al., 2014), altered enzyme activity
and imbalance in absorbed elements (Abdul Qados, 2015). Plant species reveal many
differences in sensitivity and reaction to water potential reduction that result from
drought or salinity. Molecular breeding of salt-tolerant plants using either molecular
markers or genetic engineering enhances their resistance to both hyper-osmotic stress
and ion toxicity (Kurepin et al., 2015).
Genetic analysis of wheat irrigated with seawater and fertilized with different kinds of
fertilizers revealed some genes that exert a major effect on Na+ exclusion (Munns et
al., 2010). Preferential deposition of Na+ in the leaf base has been described for rice
(Oryza sativa) and sorghum (de Lacerda et al., 2005). One significant effect of
salinity on plant growth occurs through changes induced in the osmotic strength of the
growth medium. Plants have several mechanisms for balancing osmotic pressure
changes in the root medium. Crops under saline conditions decrease the cellular
osmotic potential by increasing the concentrations of free amino acids, inorganic
cations and insoluble particles, accumulation of which helps to maintain the osmotic
balance (Roy and Chakraborty, 2014). Genes that are up-regulated by salt stress
mainly belong to several groups‚ based on their possible functionality. These genes
encode proteins‚ enzymes involved in the biosynthesis of osmolytes‚ hormones‚
detoxification and general metabolism and regulatory molecules such as transcription
factors‚ protein kinase and phosphatases.
The identification of specific characteristics related to salt resistance such as pralines,
soluble and non-soluble proteins as well as total proteins will provide potential
biological markers useful in the identification and genetic manipulation of salt-
resistant plants and plant cells (Li et al., 2014). The aim of this study is to use protein
electrophoretic profiles and other physiochemical traits to compare between wheat
plants grown under normal water irrigation or grown under seawater irrigation in the
presence or absence of chemical, bio and organic fertilization.
MATERIALS AND METHODS
Pot experiments were carried out at the King Abdulaziz University, Saudi Arabia,
during winter season of 2011/2012. The average daily maximum and minimum
temperature were 27/19 Co, respectively (according to the Metrological Station in
Jeddah). The aim of the study was to determine the effect of chemical fertilizer, bio
fertilizer and organic fertilizer on proline content, protein concentration and
electrophoretic patterns of leaf soluble proteins of bread wheat (Triticum aestivum)
plants irrigated with different ratios of seawater.
Page 3
Global Journal of Agricultural Research
Vol.4, No.4, pp.29-46, September 2016
Published by European Centre for Research Training and Development UK (www.eajurnals.org)
31
ISSN 2053-5805(Print), ISSN 2053-5805(Print)
Experiment Eighty one (81) pots 40 cm diameter, each was filled with fifteen (15) kilograms
sandy soils mixed with perllit and peat moss in the ratio of 2:1:1 irrigated with tap
water for one week to remove weeds. The pots were divided into three groups, each
group was treated with different kind of fertilizers as followes:
a- Chemical fertilizer "Urea" was used in the rates of 100, 250 and 500 kg/ha. Urea is
a complete water-soluble fertilizer.
b- Biofertilizer was used in the form of Rhizobium or Azotobacter treatments.
Inoculation of the grains with the bio-fertilizer containing N-free living bacteria
Rhizobium or Azotobacter was done just before sowing, using Arabic gum (4%) as
adhesive material.
c- Organic fertilizer was used in the form of Humic acid (HA) and was applied in the
rate of 5, 10 and 20 kg/ha, 7days before sowing and incorporated through soil
preparation.
Ech fertilizer treatment was berformed in three replicates with the recommended dose
and was irrigated with three levels ( 0%, 20% or 40%) of seawater designed as (low,
medium or high) ratio of seawater.
Determination of proline
Plant Proline (amino acid) was determined using Bates (1973) method, by adding 10
ml aqueous sulfosalysilic acid 3% to 5 gm of the fresh plant sample. Then this was
crushed and filtered, and 2 ml of the filtrate was placed in a test tube, then added 2 ml
of Ninhydrin acid and 2 ml of glacial acetic acid were added. The tube was incubated
in a water path (100oC) for 1 hour, and placed on ice for 5 minutes, and 4 ml of
toluene was added and then stirred using vortex for 15-20 seconds. The upper red
colored part of the solution was then taken out for determination of the light intensity
ay a light wave length of 520 nanometer using spectrophotometer.
Determation of proteins
Soluble and total proteins were estimated in plant leaves colorimetrically using
colorimetrically using Coomassie Brilliant Blue G-250, according to the method of
Bradforod (1976). The absorption was measured at 595 nm and standard curve of
absorbance was prepared according to Al-Zahrani and Al-Robai (2008).
Electrophoresis study
1. DNA isolation
Total genomic DNA was isolated according to Azcárate-Peril and Raya (2001) with
some modification, where 200 μl of TES buffer and 20 μl of lysozyme (10 mg/ml)
were mixed with 1 mg or suitable amount of bacterial pellets of overnight culture. The
mixture was incubated at 37o C for 20 min in a water bath. 20 μl of proteinase K (10
mg/ml) was added to each sample then incubated at 37oC for 20 min in a water bath.
The mixture was transferred to ice for 5 min then 250 μl of 4M sodium acetate was
added. 250 μl of chloroform: isoamyl (24:1) was added then the mixture was inverted
between fingers to mix it then centrifuged at 13000 rpm for 2 min. The upper zone
was transferred with care to a new clean eppendorff and 3/4 or 1 v/v of isopropanol
was added then incubated at -20 overnight. Next day, the mixture was centrifuged at
13000 rpm/2 min then the supernatent was totally discarded and DNA was dried at
room temperature then resuspended with 50 μl of distilled water. 10 μl of isolated
Page 4
Global Journal of Agricultural Research
Vol.4, No.4, pp.29-46, September 2016
Published by European Centre for Research Training and Development UK (www.eajurnals.org)
32
ISSN 2053-5805(Print), ISSN 2053-5805(Print)
DNA was loaded in 0.5% agarose gel in 1x of TBE buffer run at 100 V for 60-90 min
and stained with ethidium bromide (Sambrook et al., 1989).
2. RAPD-PCR analysis
Polymerase chain reaction (PCR) based molecular markers has developed into
controllable tools to analyze genetic relationships and genetic diversity using random
amplified polymorphic DNA-RAPD. Two primers used, PCR reactions were
conducted according to (Williams et al., 1990). Each RAPD-PCR marker was named
by the primer used and DNA fragment size in base pairs (bp). RAPD patterns were
scored for each treatment and genetic distances were calculated using RAPD distance.
The nucleotide sequences and GC ratios of 5 primers used in RAPD-PCR were
represented in (Table 1).
3. SDS-PAGE electrophoresis
Sodium dodecylsulphate polyacrylamide gel electrophoresis (SDS-PAGE) according
to Laemmli (1970) was used to study the genetic background at the vegetative stage
for the studied strains by their total protein fingerprints.
Table 1: List of primers and their nucleotide sequence
Primer Sequence
Prime1 AGGAGTCGGA-3`-5'
Prime2 AGACCCAGAG-3`-5'
Statistical analysis:
All data were subjected to analysis of variance and significant difference among
means were determined according to (Snedecor and Cochran, 1980) with the aid of
SPSS softwear. Significant difference among mean were distinguished according to
the Duncans, multiple test range (Duncan, 1955). Differences between means were
compared at LSD 5%.
RESULTS AND DISCUSSION
Proline concentration Proline concentration increased in wheat shoots in response to the increase of
seawater concentration. The 20% and 40% concentrations of seawater caused
substantial increases (50% - 200%) in ptoline compared to control treatment. A
positive correlation between sea water concentration and proline accumulation was
found to be (R2 = 92%). Data in the same figure showed a gradual increase in proline
contend with increasing dose of chemical fertilizer. In this respect, the most increase
in proline was recoded at Chem.3 treatment to be 18% as compared with unfertilized
control plants. Moreover, chemical fertilizers resulted in an increase in proline
concentration under seawater treatments compared to unsalted control plants. At 40%
seawater, proline concentration increased by about 6.1% when plants were treated
with Chem.3 as compared with unfertilized plants grown under same level of
seawater. Biofertilizer, Bio.1 and Bio.2 treatments, caused about 12% and 13%,
Page 5
Global Journal of Agricultural Research
Vol.4, No.4, pp.29-46, September 2016
Published by European Centre for Research Training and Development UK (www.eajurnals.org)
33
ISSN 2053-5805(Print), ISSN 2053-5805(Print)
respectively, in proline concentration in plants grown under normal irrigation
compared with biofertilizer-untreated control plants. While, neither biofertilizers nor
organic fertilizers caused significant changes in proline content of plants grown under
20% or 40% of seawater irrigation as compared to unfertilized plants grown under
same levels of seawater.
Plants grow under environmental stresses, like drought and salt stress, accumulate
organic compatible substances such as proline (Cha-Um and Kirdmanee, 2009). These
solutes help to maintain high water content necessary for growth and cellular
function. The present study showed that seawater permitted the increase of proline in
wheat plants, and the accumulation of proline was more pronounced in fertilized
plants than unfertilized ones particularly at 40% seawater (Fig. 1). Physiologically,
proline accumulation seemed to be a primary defense response to maintain the
osmotic pressure in plant tissues (Koca et al., 2007). Moreover, the role of proline in
osmotic adjustment, membrane stabilization and detoxification of injurious ions in
plants exposed to salt stress is widely reported (Kavi Kishor et al., 2005). Many plants
including wheat accumulate proline as an adaptive trait concerned with stress
tolerance, and it is generally assumed that proline accumulation is caused by both the
activation of its biosynthesis and inactivation of its degradation (Çiçek and Çakirlar,
2008).
Fig. (1): Effect of Chemical fertilizer (Chem1-Chem3), Biofertilizer (Bio1-Bio2) and
Organic fertilizer (Org1-Org3) on proline concentration of wheat plants grown under
different concentrations of seawater (SW). (Cont = Control ; vertical lines indicate SD
values).
Page 6
Global Journal of Agricultural Research
Vol.4, No.4, pp.29-46, September 2016
Published by European Centre for Research Training and Development UK (www.eajurnals.org)
34
ISSN 2053-5805(Print), ISSN 2053-5805(Print)
Soluble and insoluble proteins The 20% concentration of seawater treatments caused an observed increase in soluble
and to a relatively little extent in the insoluble proteins as compared with 0% control
treatment (Table 2). On the other side, the 40% of seawater caused a significant
decrease in soluble and insoluble proteins as compared with control treatment. At
20% concentration of seawater, Chem.1 treatment improved the soluble proteins by
about 16.3% and insoluble proteins by about 31.8% as compared with 0% level of sea
water. Under biofertilizer treatments, only soluble proteins were increased with the
20% concentration of seawater, at which an increase in soluble proteins by Bio.1 and
Bio.2 treated plants was about 14.5% and 12.2%, respectively. Organic fertilizer
showed gradual increases in soluble proteins and gradual decreases in insoluble
proteins. In this regard, soluble proteins increased by about 5%, 14.8% and 22.6% at
Org.1, Org.2 and Org.3 treatment, respectively, as compared with 0% sea water
treatment. The comparable decreases in the insoluble proteins were about 3%, 4.9%
and 11.2%, respectively. Both, soluble and insoluble proteins were drastically
decreased at 40% concentration of seawater eather in fertilizer-treated or untreated
plants.
Table (2): Effect of different fertilizer treatments on soluble and insoluble proteins
(mg/g Fwt) of wheat (Triticum aestivum) shoots grown under different concentrations
of seawater.
Fertilizer
treatments
Seawater concentration
0% 20% 40%
soluble insoluble soluble insoluble soluble insoluble
Cont 1.22±0.32 3.26±0.42 1.35±0.16 4.14±0.71 1.15±0.16 2.26±0.40
Chem1 1.84±0.41 3.58±0.46 2.14±0.22 4.72±0.75 1.43±0.11 3.11±0.67
Chem2 2.55±0.36 4.11±0.72 2.75±0.25 4.88±0.82 2.06±0.24 3.34±0.71
Chem3 2.17±0.29 3.85±0.66 2.16±0.31 3.88±0.74 1.48±0.24 3.09±0.72
Bio1 1.45±0.25 4.12±0.88 1.66±0.26 3.55±0.92 1.22±0.12 3.13±0.69
Bio2 1.56±0.23 4.23±0.82 1.75±0.25 3.26±0.88 1.16±0.23 3.02±0.72
Org1 1.19±0.25 3.66±0.82 1.25±0.26 3.55±0.93 1.05±0.18 3.22±0.85
Org2 1.88±0.18 3.85±0.74 2.16±0.22 3.67±0.87 1.34±0.12 3.42±0.74
Org3 2.16±0.23 4.35±0.79 2.65±0.30 3.91±0.90 1.66±0.17 3.65±0.62
LSD5% 0.26 0.56 0.34 0.48 0.20 0.35
Total protein content All forms of fertilizers caused an increase in total proteins of wheat plants under
normal irrigation (Fig. 2). At 0% seawater, the highest increase in total proteins was
observed at Chem.2, Bio.2 and Org.3 treatments at which the increase was 48%,
29.2% and 45.35, respectively, as compared with unfertilized control plants. It was
also clear that total proteins were negatively affected by 40% of seawater, at which
total protein was reduced by about 31.3%, as compared with control plants under 0%
level of seawater.
It seemed that fertilizer treated plants could withstand the harm effect of salt stress
and total protein was increased even at high concentrations of seawater as compared
Page 7
Global Journal of Agricultural Research
Vol.4, No.4, pp.29-46, September 2016
Published by European Centre for Research Training and Development UK (www.eajurnals.org)
35
ISSN 2053-5805(Print), ISSN 2053-5805(Print)
with non-fertilized plants. In this regard, Chem.2 treatment showed the highest level
of total protein among other chemical fertilizer treatments (58.8% at 40% seawater);
Biofertilizers positively affected total protein (27.5% at Bio.1 and 22.5% at Bio.2
treatments under 40% seawater) and Organic fertilization also improved total
proteins (55.7% at Bio.3 treatment under 40% of seawater).
Fig (2): Effect of Chemical fertilizer (Chem1-Chem3), Biofertilizer (Bio1-Bio2) and
Organic fertilizer (Org1-Org3) on total protein concentration of wheat plants grown
under different concentrations of seawater (SW). (Cont = Control ; vertical lines
indicate SD values).
The inhibiting effects of saline water on plant growth and biochemical composition
have previously been reported by many researchers (Abdalla, 2011; Hefny, 2011). It
is well known that high salinity stress conditions cause a multitude of molecular,
biochemical and physiological changes, thereby affecting plant growth and
development (Boutraa, 2010). The depressive effect of high salt stress on growth
parameters may also be attributed to a reduction in the assimilation of nitrogen
compounds (Reddy et al., 2003), affecting the rate of protein formation (Yazdanpanah
et al., 2011) and cause oxidative damage to DNA, lipid and proteins. On the other
side, accumulation of protein under low concentration of seawater has been correlated
with stress avoidance (Goudarzi and Pakniyate, 2009).
Accumulation of proteins under moderate level of seawater (20%) is known to occur
widely in plants in response to salinity to protect plant cells by balancing the osmotic
strength of cytosol with the vacuole and external environment (Kavi Kishor et al.,
Page 8
Global Journal of Agricultural Research
Vol.4, No.4, pp.29-46, September 2016
Published by European Centre for Research Training and Development UK (www.eajurnals.org)
36
ISSN 2053-5805(Print), ISSN 2053-5805(Print)
2005). In addition, protein accumulations are particularly important for cell survival
under low concentration of salt stress and causes membranes stabilization under
salinity stress (Goudarzi and Pakniyate, 2009). Thus, in response to salinity, plants
make new proteins that help them to grow and develop under low saline conditions
(Rani and Rose, 2012). The soluble protein and free amino acids in barley and maize
plants increased with NaCl increasing (El-Tayeb, 2005; Hussein et al., 2012). The
marked increase in soluble and insoluble protein in shoots might indicate the
superiority of shoots to alleviate the imposed salt stress, either via osmotic adjustment
or by conferring desiccation resistance to plant cells (Hefny, 2011).
Nitrogen containing fertilizer, improves protein contents within plant tissues, because
nitrogen play a role in the structure of protein and nucleic acids. Therefore, additions
of N fertilizers can substantially increase protein content and plants yield. However,
plants protein concentration can decrease if the amount of added N is not adequate for
potential yield (Hafez et al., 2012). Many researchers have found that N additions as
fertilizer materials were effective in attaining higher plants protein concentration
(Namvar and Sharifi, 2011). However, high amount of fertilizers increases the salt
concentration in the soil and has an adverse effect on growth and protein and other
constituents in plant tissues (Daneshmand et al., 2012)
As for Bio and Organic fertilizers, Abd El-Razek and El-Sheshtawy (2013) found that
bio-fertilizer inoculation gave high nitrogen percentage and total protein percentage.
In this regard, many investigators found that inoculation of wheat grains with nitrogen
fixing bacteria significantly enhanced the growth and protein of wheat plants (Zaki et
al., 2012). Daneshmand et al. (2012) indicated that the use of biological and organic
fertilizers lead to significant increase in yield and protein content of wheat (Triticum
aestivum), thus such fertilizers can be used to reduce the harmful effect of chemical
fertilizers and to improve soil and plant nutrition and reduce the environmental
pollution.
4-12 Effects on DNA
RAPD data analysis
PCR amplification of genomic DNA was tested on 2 RAPD primers in two rounds of
amplification. RAPD analysis evaluated the response of Triticum aestivum genomes
challenged with seawater and fertilizer treatments, thereby to detect the molecular
changes associated with the presence of fertilizer priming in wheat leaves. Results in
Figs (3, 4 and 5) and Tables (3A, 4A and 5A) indicated that the two primers (OPUPC-
75 and OPA18 could efficiently align genomic DNA of wheat. Approximately 88
bands (AF) were amplified under different treatments using the two primers (Figs 3, 4
and 5; Tables 3B, 4B and 5B). Monomorphic and polymorphic bands are present in
all individuals, and the mean percentage of polymorphic bands for all treatments was
76.2%, with molecular sizes ranging from 350 to 1900 pb. It was observed also that
eight bands of the 88 commonly detected in all the samples, so it could be the specific
genus bands of Triticum aestivum species.
Page 9
Global Journal of Agricultural Research
Vol.4, No.4, pp.29-46, September 2016
Published by European Centre for Research Training and Development UK (www.eajurnals.org)
37
ISSN 2053-5805(Print), ISSN 2053-5805(Print)
It was obvious that the two primers gave clear and reproducible banding patterns,
however primer1 was more clear than primer2 in producing more bands at sea water
treatment of 20% and 40%. But for control plants, where no sea water treatment,
primer 2 was more active than primer 1 in producing the bands. In this regard, total
bands produced by primer1 in 0% sea water treatment was 46 while those produced
by primer2 were 62, to make a sum of 108 bands for both primers. The polymorphic
bands for primer1 accounted for 87.5% of the total bands of this primer, while the
polymorphic bands for primer2 accounted for 81.2% of the total bands produced by
primer2, thus the mean polymorphism for both RAPD primers was 84.4% of the total
sum of produced bands.
As for seawater treatments, it is clear that at 20% seawater, PCR amplification with
RAPD primer1 gave a total number of 84 RAPD fragments of different molecular
weight, out of which 90.4% were polymorphic, while Prime2 produced a total of 48
RAPD fragments, out of which 66.7% were polymorphic. The mean value of the
polymorphism for both RAPD primers was 78.5% of the total bands.
At 40% treatment of sea water, it is obvious that RAPD primer1 yield 79 RAPD
fragment, 73.6% of which were polymorphic. While RAPD primer2 produced 50
RAPD fragments, of which 57.1% were polymorphic. Thus, the mean value of
polymorphism for Primer1 and Primer 2 was 65.4% of total bands.
0% seawater
Prim1 prim2 Fig (3): Effect of fertilizers on RAPD-PCR polymorphism of DNA using OPUPC-75 (Prim1) and
OPA18 (Prim2) primers on Triticum aestivum plants grown under 0% seawater.
Table (3A): Effect of the interaction of 0% seawater and fertilization treatments on
RAPD analysis from the DNAs of Triticum aestivum using 2 random primers.
Primer
name
Total #
bands
Total
AF
Monomorphic
bands
Polymorphic
bands
% of
Polymorphism
Prim.1 46 16 02 14 87.5
Prim.2 62 16 03 13 81.2
Page 10
Global Journal of Agricultural Research
Vol.4, No.4, pp.29-46, September 2016
Published by European Centre for Research Training and Development UK (www.eajurnals.org)
38
ISSN 2053-5805(Print), ISSN 2053-5805(Print)
Table (3B): Molecular weight base pairs (bp) of amplified DNA fragment that
produced by using RAPD analysis with two primers at 0% seawater. DNA
marker
Size
(bp)
L1 L2 L3 L4 L5 L6 L7 L8 L9
Prim.1
3000 + - - - + - - - +
2800 + - + + - - - +
2600 + + + + + + + + +
2500 - - - - - - - - +
1800 - - - - - - - - +
1500 + - - - - - - - +
1200 - - - - - - - - +
900 + - + - + - - + -
800 - -- + - + - - + +
700 - - - - - - - - -
600 - - - - - - - - +
500 + - - - - - - - -
400 + + + - + - - - -
300 + - - - - - - - +
200 + + + + + + + + +
100 - - - - - - - - +
Total 9 3 5 3 6 2 2 4 12
Prim.2
1300 + + + + + - - - +
1250 + - - - - - -
1200 + - - - - - - - +
1150 - - + - + + + + -
1100 + + + + + + + + +
1000 - - - - - - - - -
950 + + + + + - - - +
900 - - - - - + + + -
450 + + + + + + + + +
400 + - - - - - - - -
350 + - - - + + + + +
300 - - - - - - - + -
250 + + + + + + + + +
200 + - - + - - - - -
150 - - - + - - - - -
100 - - - + - - - - -
Total 10 5 6 8 7 6 6 7 7
20% seawater
Prim1b prim2b Fig (4): Effect of fertilizers on RAPD-PCR polymorphism of DNA using OPUPC-75 (Prim1) and
OPA18 (Prim2) primers on Triticum aestivum plants grown under 20% seawater.
Page 11
Global Journal of Agricultural Research
Vol.4, No.4, pp.29-46, September 2016
Published by European Centre for Research Training and Development UK (www.eajurnals.org)
39
ISSN 2053-5805(Print), ISSN 2053-5805(Print)
Table (4A): Effect of the interaction of 20% seawater and fertilization treatments on
RAPD analysis from the DNAs of Triticum aestivum using 2 random primers. Primer
name
Total #
bands
Total
AF
Monomorphic
Bands
Polymorphic
bands
% of
Polymorphism
Prim1 84 21 02 19 90.4
Prim2 48 09 03 06 66.7
Table (4B): Molecular weight base pairs (bp) of amplified DNA fragment that
produced by using RAPD analysis with two primers at 20% seawater. DNA
marker
Size
(bp)
L1 L2 L3 L4 L5 L6 L7 L8 L9
Prim.1
1600 - - - + - - - - -
1450 - - - + - - - - -
1400 - - - - - + + + +
1350 + - - - - - + + +
1300 + - - + - - + + +
1250 - - - - - - + + +
1200 + - - - - - + + +
1150 + + - + - - - - -
1100 + + + - - + - - -
1000 - + - - + + - - -
950 + + + + + + + + +
900 + + + + + + - - -
650 + - - - - - - -
600 + + + + + + + + +
550 + + - - - - - - -
500 - - - - + + - - -
450 + + + - + - - - -
400 - - - - + - + + +
600 - - + - - + + + +
260 + + + + + - - -
100 + + + + + - - - -
Total 13 10 8 8 9 9 9 9 9
Prim.2
1900 + + + + + + + + +
1500 - - - - - + + + +
1000 + + + + + + + + +
750 + + + + + + + + +
700 - - - - + + + + +
600 - - - - + - - - -
500 + + + + - + + + -
350 - - + + + - - - -
200 - - - - + - - - -
Total 4 4 5 5 7 6 6 6 5
40% seawater
Prim1c Prim2c
Fig (5): Effect of fertilizers on RAPD-PCR polymorphism of DNA using OPUPC-75 (Prim1) and OPA18 (Prim2)
primers on Triticum aestivum plants grown under 40% seawater.
Page 12
Global Journal of Agricultural Research
Vol.4, No.4, pp.29-46, September 2016
Published by European Centre for Research Training and Development UK (www.eajurnals.org)
40
ISSN 2053-5805(Print), ISSN 2053-5805(Print)
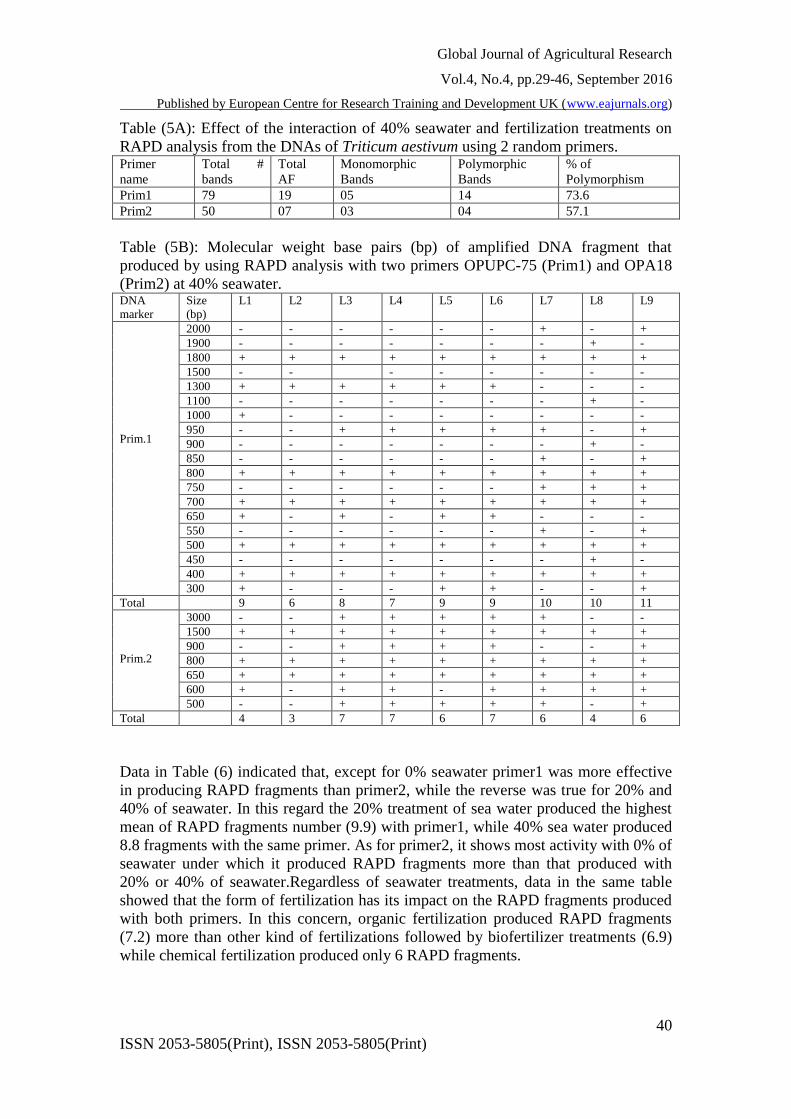
Table (5A): Effect of the interaction of 40% seawater and fertilization treatments on
RAPD analysis from the DNAs of Triticum aestivum using 2 random primers. Primer
name
Total #
bands
Total
AF
Monomorphic
Bands
Polymorphic
Bands
% of
Polymorphism
Prim1 79 19 05 14 73.6
Prim2 50 07 03 04 57.1
Table (5B): Molecular weight base pairs (bp) of amplified DNA fragment that
produced by using RAPD analysis with two primers OPUPC-75 (Prim1) and OPA18
(Prim2) at 40% seawater. DNA
marker
Size
(bp)
L1 L2 L3 L4 L5 L6 L7 L8 L9
Prim.1
2000 - - - - - - + - +
1900 - - - - - - - + -
1800 + + + + + + + + +
1500 - - - - - - - -
1300 + + + + + + - - -
1100 - - - - - - - + -
1000 + - - - - - - - -
950 - - + + + + + - +
900 - - - - - - - + -
850 - - - - - - + - +
800 + + + + + + + + +
750 - - - - - - + + +
700 + + + + + + + + +
650 + - + - + + - - -
550 - - - - - - + - +
500 + + + + + + + + +
450 - - - - - - - + -
400 + + + + + + + + +
300 + - - - + + - - +
Total 9 6 8 7 9 9 10 10 11
Prim.2
3000 - - + + + + + - -
1500 + + + + + + + + +
900 - - + + + + - - +
800 + + + + + + + + +
650 + + + + + + + + +
600 + - + + - + + + +
500 - - + + + + + - +
Total 4 3 7 7 6 7 6 4 6
Data in Table (6) indicated that, except for 0% seawater primer1 was more effective
in producing RAPD fragments than primer2, while the reverse was true for 20% and
40% of seawater. In this regard the 20% treatment of sea water produced the highest
mean of RAPD fragments number (9.9) with primer1, while 40% sea water produced
8.8 fragments with the same primer. As for primer2, it shows most activity with 0% of
seawater under which it produced RAPD fragments more than that produced with
20% or 40% of seawater.Regardless of seawater treatments, data in the same table
showed that the form of fertilization has its impact on the RAPD fragments produced
with both primers. In this concern, organic fertilization produced RAPD fragments
(7.2) more than other kind of fertilizations followed by biofertilizer treatments (6.9)
while chemical fertilization produced only 6 RAPD fragments.
Page 13
Global Journal of Agricultural Research
Vol.4, No.4, pp.29-46, September 2016
Published by European Centre for Research Training and Development UK (www.eajurnals.org)
41
ISSN 2053-5805(Print), ISSN 2053-5805(Print)
Table (6). Effect of fertilizer treatments on RAPD analysis from DNA 2 random
primers of Triticum aestivum grown under different concentrations of seawater.
(values are the mean of bands number).
Sea
water
Conc.
RAPD
primer
Fertilizer treatments Mean
Control Chemical Bio. Fert. Org. Fert.
Total No. of bands
0% Prim1 9.0 3.7 4.0 6.0 5.7
Prim2 10.0 6.3 6.5 6.7 7.3
20% Prim1 13.0 8.7 9.0 9.0 9.9
Prim2 4.0 4.7 6.5 5.7 5.2
40% Prim1 9.0 7.0 9.0 10.3 8.8
Prim2 4.0 5.6 6.5 5.3 5.4
Mean 8.2 6.0 6.9 7.2
Data recorded in Table (7) showed that 20% of seawater treatment produced the
highest number of RAPD fragments with primer1 as compared with other treatments.
Moreover, despite seawater treatments, data in the same table indicated that organic
fertilizer treatments produced the highest number of RAPD fragments. In this respect,
Org.1, Org.2 and Org.3 treatments produced a mean number of 7.8, 7.2 and 8.0,
respectively, of RAPD fragments. While, Bio.1 and Bio.2 treatments produced a mean
number of 7.7 and 7.8, respectively, of fragments. On the other side, Chemical
fertilizer treatments produced lower number of fragments. In this regard Chem.1,
Chem.2 and Chem.3 treatments produced a mean number of 5.3, 7.2 and 6.8,
respectively, of RAPD fragments.
Table (7). Effect of sea water treatments on RAPD analysis from DNA 2 random
primers of Triticum aestivum grown under different concentrations of seawater .
(values are the mean of bands number).
Sea
water
Primer Cont Chem1 Chem2 Chem3 Bio1 Bio2 Org1 Org2 Org3 Mea
0% Prim1 9 6 8 7 9 9 10 10 11 8.7
Prim2 10 3 7 7 6 7 6 4 6 6.2
20% Prim1 13 10 8 8 9 9 9 9 9 9.3
Prim2 4 4 5 5 7 6 6 6 5 5.3
40% Prim1 9 6 8 7 9 9 10 10 11 8.7
Prim2 4 3 7 7 6 7 6 4 6 5.6
Mean 8.1 5.3 7.2 6.8 7.7 7.8 7.8 7.2 8.0
It is is obvious from data analysis of DNA that RAPD assay can efficiently generate
both randomly dispersed markers as well as markers linked to specific genes. In this
study, the RAPD analysis with 2 random primers gave totally 108, 132 and 129
fragments of which 84.4 %, 78.6 % and 65.5 % were polymorphic at 0%, 20% and
40% of sea water, respectively. These results are close with results of other studies on
corn lines show similar ratio of polymorphic RAPD fragments (Bauer et al., 2005).
Page 14
Global Journal of Agricultural Research
Vol.4, No.4, pp.29-46, September 2016
Published by European Centre for Research Training and Development UK (www.eajurnals.org)
42
ISSN 2053-5805(Print), ISSN 2053-5805(Print)
The molecular mechanism of salt stress tolerance in plant could be elucidated using
cDNA microarrays. However, mRNAs may not be transcribed or that changes in the
protein level or enzyme activity can occur without any detectable change in transcript
abundance due to translational or other levels of control. Therefore, it is necessary to
study the salt stress responses at the protein level (Shunping et al., 2005). In this
study the major protein profile of wheat leaf under control conditions show protein
bands that can categorized in high molecular weight, medium range molecular weight
and low range molecular weight. The protein profile patterns emphasize the closely
relationship between Biofertilizers and Organic fertilizers in their effect (7).
Under salt stress conditions, protein profile of the wheat show high homogeneity
pattern among the different treatments of the same fertilization. Comparing to non-
stress protein pattern, the high molecular weight bands were disappeared and the
major protein bands were located at the medium molecular weight range. This could
be due to the inhibitory effects of salt stress at 40% of sea water on transcriptional
process (Abbas and Fayed , 2014). The fast breakdown of cellular protein during salt
stress, induced by 40% sea water, might be also due to the increasing activity of acid
and alkaline protease (Sohrabi et al., 2011). Homeostasis and mineral deficiencies
has been a consequence of salt stress condition (Abbas et al., 2013).
The obtained results showed that the using of RAPD analysis to characterize each
treatment with the appearance of specific markers and produce informative bands that
distinguished all the treatments. The expressions of many genes induction by stress,
involved directly in stress tolerance and regulation of gene expression and signal
transduction (Zhou et al., 2010). The expression of stress-responsive genes is
important for the plants’ ability to grow under different environmental stress
conditions (Chinnusamy et al., 2007). In this regard, Malik et al., (2000) revealed that
RAPD technique has a potential to find DNA-based polymorphisms between the
stress resistant and stress-susceptible genotypes of the same varieties. Abdel-Bary et
al., (2005) recorded positive and negative RAPD markers for salinity tolerance, thus,
the different primers have different performances for evaluation of genetic
polymorphism. The extensive polymorphism detected among seawater and fertilizer
treatments elevated the degree of change occurring in DNA sequences. The results of
RAPD-PCR indicated the existence of differences in RAPD fragments. The
quantitative polymorphism obtained might be due to the changes of some regions of
the nucleotide sequences aligned by arbitrary primers. This promotion may be due to
effects of fertilization or due to the enhancement of annealing between primers and
DNA templates by activation and recognition of sequences and / or activation of Taq
polymerase activity (Afiah et al., 2007). In addition, the action of fertilization was
achieved by enhancing the activity level of free radical scavenging enzymes could
reduce the incidence of DNA damage, explaining the appearance of new DNA in
fertilizer treatments (Mohsen et al., 2013; Bavei et al., 2011b).
CONCLUSION AND RECOMMENDATION
Results of this study indicated that seawater irrigation of wheat plants caused an
observed increase in proline and significant reduction in soluble, insoluble and total
Page 15
Global Journal of Agricultural Research
Vol.4, No.4, pp.29-46, September 2016
Published by European Centre for Research Training and Development UK (www.eajurnals.org)
43
ISSN 2053-5805(Print), ISSN 2053-5805(Print)
proteins, while fertilizers increased all fractions of proteins either under normal or
seawater irrigation. In addition, the obtained results showed that RAPD analysis can
be used to characterize each treatment with the appearance of specific markers and
produce informative bands that distinguished all the treatments.
REFERENCES
Abbas, M. K., Ali, A. S., Hasan, H. H. and Ghal, R. H. (2013). Salt Tolerance Study
of Six Cultivars of Rice (Oryza sativa L.) During Germination and Early
Seedling Growth. J. Agril. Sci. 5 (1): 250-259.
Abbas, N. H. and Fayed, A. M. (2014). Monitoring of salt tolerance responses of
different maize inbred lines using protein profile and spectrofluorescence.
Reviews of Literature , 1(7): 1-12.
Abd El-Razek, U. A. and El-Sheshtawy, A. A. (2013). Response of Some Wheat
Varieties to Bio and Mineral Nitrogen Fertilizers. Asian J Crop Science, 5: 200-
208.
Abdalla, M. M. (2011). Beneficial effects of diatomite on growth, the biochemical
contents and polymorphic DNA in Lupinus albus plants grown under water
stress. Agric. Biol. J. North Am., 2: 207-220.
Abdel–Bary, A., Rashed, M. A. and Lila, S. (2005). Molecular genetic studies on
some maize (Zea mays L.) inbred. Egypt. J. Genet. Cytol. 34: 15-27.
Abdul Qados, A. M. S. (2015). Effects of salicylic acid on growth, yield and chemical
contents of pepper (Capsicum Annuum L) plants grown under salt stress
conditions. Int. J Agric. Crop Sci. Available online at www.ijagcs.com.
Afiah, S. A., Ahmed, K. Z., and Soliman, K. A. (2007). Somaclonal variation in
bread wheat (Triticum aestivum L.) RAPD, Finger printing of elite genotypes
under Siwa Oasis conditions. African Crop Sci Conf Proc. 8: 2039-2045.
Ahmed, M. A., Ahmed, A. G., Mohamed, M. H. and Tawfik, M. M. (2011).
Integrated effect of organic and biofertilizers on wheat productivity in new
reclaimed sandy soil. Research Journal of Agriculture and Biological Sciences,
7(1): 105-114.
Al-Zahrani, H. S., Al-Robai, S. A. (2008). Allelopathic effect of Calotropis procera
leaves extract on seed germination of some plants. Journal of King Abdulaziz
University 19, 115-126.
Azcárate-Peril, M. A. and Raya, R. R. (2001). Methods for plasmid and genomic
DNA isolation from Lactobacilli. In: Food microbiology protocols Methods in
biotechnology. Spencer J. F. T. and A. L. DSpencer (eds.). Humana
Press,Argentina, 135-139.
Bates, L. S., Waldran, R. P., and Teare, I. D. (1973). Rapid determination of free
proline for water stress studies. Plant Soil 39: 205-208.
Bauer, I., Mladenovic, S. D., Filipovic, M., and Konstantinov, K. (2005). Genetic
characterization of early maturing maize hybrids (Zea mays L.) obtained by
protein and RAPD markers. Genetika, 37: 235.
Bavei, V., Behrouz, S. and Arzani, A. (2011a) Evaluation of salinity tolerance in
sorghum (Sorghum bicolor L.) using ion accumulation, proline and peroxidase
criteria. Plant Growth Reg 64: 275–285.
Bavei, V., Shiran, B., Khodambashi, M. and Ranjbar, A. (2011b). Protein
electrophoretic profiles and physiochemical indicators of salinity tolerance in
Page 16
Global Journal of Agricultural Research
Vol.4, No.4, pp.29-46, September 2016
Published by European Centre for Research Training and Development UK (www.eajurnals.org)
44
ISSN 2053-5805(Print), ISSN 2053-5805(Print)
sorghum (Sorghum bicolor L.). African Journal of Biotechnology, 10(14): 2683-
2697.
Boutraa, T. (2010). Improvement of water use efficiency in irrigated agriculture: a
review. Journal of Agronomy, 9: 1–8.
Bradford, M. M. (1976). A rapid and sensitive method for the quantitation of
microgram quantities of protein utilizing the principle of protein-dye binding.
Anal Biochem. 7(72): 248-54.
Cha-Um, S. and Kirdmanee, C. (2009). Effect of salt stress on proline accumulation,
photosynthetic ability and growth characters in two maize cultivars. Pak. J. Bot.,
41(1): 87-98.
Chinnusamy, V., Zhu, J., Zhu, J. K. (2007). Cold stress regulation of gene
expression in plants. Trends in Plant Science ;12:444-451.
Çiçek, N. and Çakırlar, H. (2008). Effects of salt stress on some physiological and
photosynthetic parameters at three different temperatures in six soya bean
(Glycine max L. Merr.) cultivars. J. Agron. Crop Sci., 194: 34-46.
Daneshmand, V. G., Bakhshandeh, A. and Rostami, M. R. (2012). Biofertilizer affects
yield and yield components of wheat. International Journal of Agriculture:
Research and Review., 2 (6): 699-704.
de Lacerda, C. F., Cambraia, J., Oliva, M. A. and Ruiz, H. A. (2005). Changes in
growth and in solute concentrations in sorghum leaves and roots during salt stress
recovery. Environ. Exp. Bot., 54: 69-76.
Duncan, D. B. (1955). Multiple range and multiple F-tests. Biometrics; 11: 1-42.
El-Tayeb, M. A. (2005). Response of barley grains to interactive effect of salinity and
salicylic acid. Plant Growth Regulation, 45: 215-224.
Goudarzi, M. and Pakniyat, H. (2009). Salinity Causes Increase in Proline and Protein
Contents and Peroxidase Activity in Wheat Cultivars. Journal of Applied
Sciences, 9: 348-353.
Hafez, E. M., Aboukhadrah, S. H., Gh, S., Sorour, R. and Yousef, A. R. (2012).
Comparison of agronomical and physiological nitrogen use efficiency in three
cultivars of wheat as affected by different levels of N-sources. Proceedings of the
13th International Agronomy Conference, September 9-10, 2012, Faculty of
Agriculture Benha University, Egypt, pp: 30.
Hefny, M. M. (2011). Agronomical and biochemical responses of white lupin Lupinus
albus L. genotypes to contrasting water regimes and inoculation treatments.
Journal of American Science, 7(3): 187-198.
Hussein, M. M., Abo-Leila, B. H., Metwally, S. A., Leithy, S. Z. (2012). Anatomical
structure of jatropha leaves affected by proline and salinity conditions. J. Appl.
Sci. Res. 8(1): 491-496.
Jalilian, J., Sanavy, A. M. M., Saberali, S. F. and Aslian, K. (2012). Effects of Bio and
Chemical Nitrogen Fertilizer on Grain and Oil Yield of Sunflower (Helianthus
annuus L.) under Different Rates of Plant Density Field Crops Res., 127: 26-34.
Jingtao, L., Xinhua, S., Gang, Y., Chengguo, J., Jinliang, L., and Hongyu, P. (2014).
Generation and analysis of expressed sequence tags (ests) from halophyte Atriplex
canescens to explore salt-responsive related genes. Int J Mol Sci. 15(6): 11172–
11189.
Kavi Kishor, P. B., Sangam, S., Amrutha, R. N., Laxmi, P. S., Naidu, K. R., Rao, K.
R. S. S., Rao, S., Reddy, K. J., Theriappan, P. and Sreenivasulu, N. (2005).
Regulation of proline biosynthesis, degradation, uptake and transport in higher
Page 17
Global Journal of Agricultural Research
Vol.4, No.4, pp.29-46, September 2016
Published by European Centre for Research Training and Development UK (www.eajurnals.org)
45
ISSN 2053-5805(Print), ISSN 2053-5805(Print)
plants: Its implications in plant growth and abiotic stress tolerance. Curr. Sci., 88:
424-438.
Koca, H., Bor, M., Özdemir, F. and Türkan, I. (2007). The effect of salt stress on lipid
peroxidation, antioxidative enzymes and proline content of sesame cultivars.
Environ. Exp. Bot., 60: 344-351.
Kurepin, L. V., Ivanov, A. G., Zaman, M., Pharis, R. P., Allakhverdiev, S. I., Hurry,
V. and Hu¨ner, N. P. A. (2015). Stress-related hormones and glycinebetaine
interplay in protection of photosynthesis under abiotic stress conditions.
Photosynth Res, Springer Science+Business Media Dordrecht 2015, Published
online.
Laemmli, U. K. (1970). Cleavage of structural proteins during the assembly of the
head of bacteriophage T4. Nature 227: 680-685.
Malik, T. A., Pric, A. and Wright, D. (2000). Bulked sergeant analysis and RAPD
markers for drought resistance in wheat. Pak. J. Agric. Res., 2: 82-88.
Mehran, M., Ardakani, M. R., Madani, H., Zahedi, M., Amirabadi, M. and Mafakheri,
S. (2011). Response of Sunflower Yield and Phytohormonal Changes to
Azotobacter, Azospirillum, Pseudomonas and Animal Manure in a Chemical Free
Agroecosystem. Annals Biol. Res., 2011, 2(6): 425-430.
Mohsen, A. A., Ebrahim, M. K. H. and Ghoraba, W. F. S. (2013). Effect of salinity
stress on Vicia faba productivity with respect to ascorbic acid treatment. Iranian
Journal of Plant Physiology 3 (3): 725-736.
Muhammed, A. S. S., Memon, H. U. R. R., Baloch, S. K., Osman, K. A. and Ali, S.
A. I. (2013). Effect of bio-organic and inorganic fertilizers on the growth and
yield of wheat (Triticum aestivum L.). Persian Gulf Crop Protection, 2(4): 15-24.
Munns, R., James, R. A., Sirault, X. R. R., Furbank, R. T. and Jones, H. G. (2010).
New phenotyping methods for screening wheat and barley for beneficial
responses to water deficit. Journal of Experimental Botany, 61: 3499-3507.
Namvar, A. and Seyed Sharifi, R. (2011). Effects of Bio and Chemical Nitrogen
Fertilizer on Grain and Oil Yield of Sunflower (Helianthus annuus L.) under
Different Rates of Plant Density. Zemdirbyste-Agriculture, 98(2): 121-130.
Ouzounidou, G., Ilias, I. F., Giannakoula, A. and Theoharidou, I. (2014). Effect of
water stress and NaCl triggered changes on yield, physiology, biochemistry of
broad bean (Vicia faba) plants and on quality of harvested pods. Biologia 69(8):
1010—1017.
Rani, R. H. and Rose, C. M. (2012). Salt stress tolerance and stress protein in wheat
(Triticum aestivum L.). International Research Journal of Pharmacy, 3: 243-148.
Reddy, T. Y., Reddy, V. R. and Anbumozhi, N. (2003). Physiological responses of
groundnut (Arachis hypogaea L.) to drought stress and its amelioration: critical
review. Plant Growth Regulation 41(3): 75-78.
Roy, S. and Chakraborty, U. (2014). Salt tolerance mechanisms in Salt Tolerant
Grasses (STGs) and their prospects in cereal crop improvement. Botanical
Studies 55: 31-40.
Sambrook, J., Fritsch, E. F., and Maniatis, T. (1989). Molecular cloning: A laboratory
manual. 2nd ed. Cold Spring Harbor Lab., Cold Spring Harbor, NY.
Shunping, Y., Tang, Z., Su, W. and Sun, W. (2005). Proteomic Analysis of Salt
Stress-Responsive Proteins in Rice Root. Proteomics, 5, 235–244.
Snedecor, G. W. and Cochran, W. G. (1980). Statistical Methods 8th Ed. Iowa State
Univ. Press Ames, Iowa, U.S.A.
Page 18
Global Journal of Agricultural Research
Vol.4, No.4, pp.29-46, September 2016
Published by European Centre for Research Training and Development UK (www.eajurnals.org)
46
ISSN 2053-5805(Print), ISSN 2053-5805(Print)
Sohrabi, N., Tajabadipour, A., Motamed, N. and Seyedi, M. (2011). A Change in
Leaves Protein Pattern of Some Pistachio Cultivars under Salinity Condition.
International Journal of Nuts and Related Sciences, 2: 67-74.
Taiz, L. and Zeiger, E. (2010). Plant Physiology, Fifth Edition. Sinauer Associates,
Sunderland, MA.
Williams, J. G. K., Kubelik, A. R., Livak, K. J., Rafalski, J. A. and Tingey, S. V.
(1990). DNA polymorphisms amplified by arbitrary primers are useful as genetic
markers. Nucleic Acids Res., 18: 6531-6535
Yazdanpanah, S., Baghizadeh, A., Abbassi, F. (2011). The interaction between
drought stress and salicylic and ascorbic acids on some biochemical
characteristics of Satureja hortensis. Afric J Agric Res 6(4): 798-807.
Zaki, N. M., Gomaa, M. A., Radwan, F. I., Hassanein, M. S. and Wali, A. M. (2012).
Effect of mineral, organic and bio-fertilizers on yield, yield components and
chemical composition of some wheat cultivars. J. Applied Sci. Res., 8: 174-191.
Zhou, F., Chang, Z., Zhang, L., Hong, Y. K., Shen, B., Wang, B., Zhang, F., Lu, G.,
Tvorogov, D. and Alitalo, K. (2010). Akt/Protein kinase B is required for
lymphatic network formation, remodeling, and valve development. Am J Pathol.
177: 2124–2133.


![Untitled-1 [] · NeoMass AAAC is used with Tandem Mass Spectrometry to detect concentrations of amino acid, free carnitine, acylcarnitines, succinylacetone Amino acid Internal](https://static.documents.pub/doc/80x56/5e17034a57b52e6d1445a413/untitled-1-neomass-aaac-is-used-with-tandem-mass-spectrometry-to-detect-concentrations.jpg)


