Page 1
Effect of Maturity and Mineralogy on Fluid-Rock Reactions in the Marcellus Shale
Journal: Environmental Science: Processes & Impacts
Manuscript ID EM-ART-09-2018-000452.R2
Article Type: Paper
Date Submitted by the Author: 30-Jan-2019
Complete List of Authors: Pilewski, John; West Virginia University, Geology and GeographySharma, Shikha; West Virginia University, Geology and GeographyAgrawal, Vikas; West Virginia University, Geology and GeographyHakala, J.; National Energy Technology Laboratory, U.S. Department of EnergyStuckman, Mengling; National Energy Technology Laboratory, U.S. Department of Energy
Environmental Science: Processes & Impacts
Page 2
Environmental Significance Statement
Natural gas exploitation from the Appalachian Basin has significantly increased in the past decade.
The push to properly dispose, reuse, or recycle the large amounts of produced fluid associated with
hydraulic fracturing operations and designing better fracturing fluids has necessitated a better
understanding of the subsurface chemical reactions taking place during hydrocarbon extraction.
This study reports results of laboratory experiments conducted to understand the effect of varying
maturity and mineralogy of shale on the proliferation of inorganic ions and low molecular weight
organic compounds, mainly benzene, toluene, ethylene, and xylene (BTEX) and monosubstituted
carboxylic acids in the reservoir after injection of hydraulic fracturing fluids.
Page 1 of 31 Environmental Science: Processes & Impacts
123456789101112131415161718192021222324252627282930313233343536373839404142434445464748495051525354555657585960
Page 3
1
Effect of Maturity and Mineralogy on Fluid-Rock
Reactions in the Marcellus Shale
John Pilewski1, Shikha Sharma1*, Vikas Agrawal1, Alexandra Hakala2, Mengling Y. Stuckman2
1 West Virginia University Department of Geology & Geography, 330 Brooks Hall, 98 Beechurst
Ave. Morgantown, WV 26506
2 National Energy Technology Laboratory, U.S. Department of Energy, Pittsburgh, PA 15236
*Corresponding Author : E-mail: [email protected] Phone: 304-293-6717
ABSTRACT
Natural gas exploitation from the Appalachian Basin has significantly increased in the past
decade. The push to properly dispose, reuse, or recycle the large amounts of produced fluid
associated with hydraulic fracturing operations and designing better fracturing fluids has
necessitated a better understanding of the subsurface chemical reactions taking place during
hydrocarbon extraction. Using autoclave reactors, this study mimics conditions of deep subsurface
shale reservoirs to observe the chemical evolution of fluids during the shut-in phase of hydraulic
fracturing (HF), a period when hydraulic fracturing fluid (HFF) remains closed in the reservoir.
The experiment was conducted by combining synthetic hydraulic fracturing fluid and powdered
shale core samples in high temperature/pressure static autoclave reactors for 14 days. Shale
samples of varying maturity and mineralogy were used to assess the effect of these variations on
the proliferation of inorganic ions and low molecular weight volatile organic compounds (VOCs),
mainly benzene, toluene, ethylbenzene and xylenes (BTEX) and monosubstituted carboxylic
Page 2 of 31Environmental Science: Processes & Impacts
123456789101112131415161718192021222324252627282930313233343536373839404142434445464748495051525354555657585960
Page 4
2
acids. Ion chromatography results indicate the relative abundance of ions present were similar to
those of produced water from HF operations in the Marcellus Shale basin. There was an increase
of SO42- and PO4
3- and the decrease in Ba2+ upon fluid-shale reaction. Major ionic shifts indicate
calcite dissolution in two of the fluid-shale reactions and barite precipitation in all fluid-shale
reactions. Toluene, xylene, and carboxylic acids were produced in the shale-free control
experiment. The most substantial increase in BTEX analytes was observed in reactions with low
maturity shale, while the high maturity shale reaction produced no measurable BTEX compounds.
Total organic carbon decreased in all reactions including fracturing fluid and shale, suggesting
adsorption onto the organic matter (OM) matrix. The results from this study highlight that both
the nature of OM and mineralogy play a key role in determining the fate of inorganic and organic
compounds during fluid-shale interactions in the subsurface shale host rock. Overall this study
aims to contribute to the growing understanding of complex chemical interactions that occur in the
shale reservoirs during HF, which is vital for determining potential environmental impacts of HF
and designing more efficient HFF and produced water recycling techniques for environmentally
conscious natural gas production.
1.0 Introduction
The Marcellus Shale is the largest natural gas producing reservoir in the United States, and over
the past decade, the amount of natural gas extracted from the reservoir has almost tripled due to
advancements in horizontal drilling technologies .1 As a result, thousands of wells have been
drilled in areas of Pennsylvania, Ohio and West Virginia, where most of the reservoir is
underlain. Hydraulic fracturing is applied to stimulate production from tight reservoirs and
involves the injection of millions of gallons of fluid (hydraulic fracturing fluid, HFF), which is
comprised of water, sand, and chemical additives.2,3 Injected HFF is known to react with the
Page 3 of 31 Environmental Science: Processes & Impacts
123456789101112131415161718192021222324252627282930313233343536373839404142434445464748495051525354555657585960
Page 5
3
reservoir rocks, resulting in changes in reservoir porosity and permeability due to HFF-mineral
interactions. 4–7 These reactions also affect the chemistry of fluids produced from the
formation.8,9 Therefore, these interactions can affect both long-term hydrocarbon productivity
from shale reservoirs and produced fluid treatment and management strategies. One area of study
that requires further investigation is understanding the effect of HFF-shale reactions on the
potential release of organic constituents, such as BTEX compounds, into fluids produced from
the reservoir. Knowledge of how shale thermal maturity, and transformation of HFF additives
under reservoir conditions, affect the composition of produced fluids is needed to improve the
efficiency of fracturing treatments and the efficacy of produced fluid management. The overall
outcome would be a reduced environmental footprint for hydrocarbon production from
unconventional reservoirs.
The composition of produced fluids from both active wells and laboratory-based
experiments differed from initial injection fluid in prior studies, indicating that reservoir
reactions and fluid mixing may both contribute significantly to produced water chemical
signatures.8–11 Produced water from unconventional reservoirs is typically characterized by its
relatively high total dissolved solids (TDS), varying concentrations of dissolved organic carbon
(DOC), and sometimes an abundance of radioactive elements.4,12,13 Monocyclic aromatic
hydrocarbons such as benzene, toluene, ethylbenzene, xylene, and low molecular weight organic
acids represent common soluble organic compounds observed in produced water. 3,14–16
Determining the source of soluble organic compounds is particularly challenging due to
variations in organic additives used from well to well and the difference in organic matter
throughout different maturity zones of the Marcellus Shale.17 Identifying sources of organic
carbon and its evolution throughout the HF process is crucial for predicting which additives to
Page 4 of 31Environmental Science: Processes & Impacts
123456789101112131415161718192021222324252627282930313233343536373839404142434445464748495051525354555657585960
Page 6
4
use in HFF and how it can be handled at the surface after it has interacted with the organic-rich
shale in the reservoir.
Hydraulic fracturing fluid (HFF) is comprised of three main ingredients: 95% fresh
water, 4% proppant or silica sand, and 1% chemical additives by wt%.18 Although chemical
additives constitute only 1% of the total fluid injected, at volumes of 3-4 million gallons of
injected fluid per well (e.g., per disclosures reported in FracFocus), this can result in 30,000 to
40,000 gallons of injected chemical additive. In the initial stages of fracturing, the friction of
HFF must be lowered via friction reducing organic additives such as WFR-61LA,2 which
contains petroleum distillates and ethoxylated alcohols. Gelling agents are included in order to
increase the HFF viscosity to transport proppant into the induced fractures, which produce a
linked 3D polymer structure with the addition of cross linkers such as boric acid and
ethanolamine. Breaker compounds, such as ammonium persulfate, are included in the HFF
mixture to subsequently react with the proppant transport gel to reduce the HFF viscosity for
flowback. The breaker compounds are often included with the overall HFF mixture. However,
these are expected to become reactive after a period of time, or under certain reservoir
conditions. For example, ammonium persulfate creates SO42- free radical ions to break down the
gel at elevated temperatures above 50°C.15,16,19
The Marcellus Shale is characterized by its low permeability and high concentrations of total
organic carbon (TOC).1 The reservoir varies in depth longitudinally, increasing from 3,000 ft in
the northwest to 8,000 ft in the southeastern portion of the reservoir. This variation in depth
results in different maturity windows throughout the reservoir ranging from 0.5% Ro (percentage
of vitrinite reflectance) at shallower depths up to 3.5% Ro at the deepest zones of the reservoir.1
Page 5 of 31 Environmental Science: Processes & Impacts
123456789101112131415161718192021222324252627282930313233343536373839404142434445464748495051525354555657585960
Page 7
5
Gas-rich, over mature zones of the Marcellus, contain type II-III kerogen that has been thermally
altered, providing a predominantly aromatic chemical signature.20–23 Less mature zones have
similar type II-III kerogen, but it has not been thermally degraded or altered to the same extent,
resulting in a relatively more aliphatic chemical signature.21,24 It is possible that the shallow, less
mature zones of the Marcellus Shale contain aliphatic chemical structures that serve as the source
of labile organic compounds released during the well shut-in period.
Variations in shale mineralogy also may affect the reactivity of both organic additives in the
HFF and the shale kerogen. The Marcellus Shale is comprised of mostly mixed-layer clays,
quartz, feldspar, calcite, and pyrite.1 Relative abundances of these minerals can vary from zone
to zone and can control the system’s buffering capacity and alteration of organic material.
Previous fluid-rock reaction studies conducted at ambient pressures showed that the mineralogy
of the shale, especially calcite and pyrite content, control the precipitation of iron-bearing
minerals, removal/release of metal contaminants, the evolution of fluid composition and porosity
destruction or development. 5,6 Calcite rich shales possess high pH buffering capacity, which
favors pyrite dissolution, the release and oxidation of Fe2+ ion and formation of Fe (III)- bearing
precipitates. 5,6 These studies also show that calcite and pyrite dissolution can cause a release in
metal contaminants whereas Fe-(oxy)hydroxide precipitation leads to removal of metal
contaminants from solution. A recent study25 shows that fracturing fluid interactions can also
lead to significant changes in carbonyl content, aromaticity, average aliphatic chain length and
release of metals from kerogen isolates. Although these studies provide a preliminary
understanding of inorganic and organic reactions that might take place during shale-fracturing
fluid interactions, they were performed at ambient pressure conditions as opposed to in situ
reservoir pressure conditions.
Page 6 of 31Environmental Science: Processes & Impacts
123456789101112131415161718192021222324252627282930313233343536373839404142434445464748495051525354555657585960
Page 8
6
The objective of this study is to perform laboratory experiments to effectively simulate fluid-
shale reactions under in situ, high pressure/temperature reservoir conditions, and to elucidate the
fate of inorganic and organic reactants and products from HF operations within different
maturity zones of a reservoir. To our knowledge, this is one of the first study that has tried to
compare shale-fluid interactions in shale samples collected across a range of maturity from a
single shale basin. Determining the downhole chemical evolution of the fluid used to fracture the
Marcellus Shale is critical for improving hydrocarbon recovery from tight shales and identifying
effective water treatment and management strategies for produced fluids.
2.0 Materials and Methods
Fluid-shale reactions were conducted using Parr 4768 static autoclaves to mimic and analyze
the in situ fluid-shale reactions during the shut-in phase of hydraulic fracturing. The specific
analyses focused on the major changes of inorganic ions and the proliferation of low molecular
weight organic compounds within the fluid.
2.1 Sampling and Preparation
The fluid used in the reaction vessels was a mixture of synthetic formation brine and
synthetic HFF, prepared per methods reported for core flood experiments simulating the shut-in
period for a Marcellus Shale HF operation, as reported4 (Table 1). The three shale samples of
varying maturity were collected from Marcellus Shale cores from different depths and
geographical zones of the reservoir (Table 2). All samples have TOC values greater than 9 wt%,
and OM sourced from mixed marine and terrestrial sources, representing type II-III kerogen.
20,21,26 The maturity of the samples is represented as a percent vitrinite reflectance (%Ro). The %
Page 7 of 31 Environmental Science: Processes & Impacts
123456789101112131415161718192021222324252627282930313233343536373839404142434445464748495051525354555657585960
Page 9
7
R0 is calculated directly from the Tmax, a thermal maturity parameter determined by pyrolysis
analysis, and is the temperature where the hydrocarbon generation rate from kerogen peaks.27
Mineralogy was analyzed as part of this study (Table 2) and is further described in both the
methods and results sections. To prepare shale samples for the static autoclave reactions, core
samples were first washed using deionized water to avoid contamination from drill mud, then
crushed using SPEX mixer mill to 100 mesh powder to maximize surface area and enhance
reaction kinetics.
2.2 Experimental Design
To emulate reservoir conditions during the shut-in phase, experiments were conducted
using two 4768 Parr Instrument Company 600-ml high-temperature/pressure vessels set to
~2,500 psi and 100°C respectively. These values were used to best mimic in situ reservoir
conditions of the Marcellus Shale while remaining within the limitations of the vessels.4,8 Inside
each 600-ml pressure vessel, a small Teflon cup was placed containing a fixed HFF-shale ratio
(20:1) of 400 mL of fluid and 20 g of shale, following a previous study. 8The remaining volume
of each vessel was then filled with pressurized, inert N2 (100% pure) to 2,500 psi. Four
experiments were conducted, each for 14 days to mimic an intermediate-term shut-in phase of an
HF operation4. One experiment only contained HFF (no shale), and the other three experiments
were performed with both HFF and the three shale samples described above. Fluids and shale
were mixed immediately prior to pressurizing the reactors. Duplicate experiments were not
performed due to limitations in the availability of shale samples.
Page 8 of 31Environmental Science: Processes & Impacts
123456789101112131415161718192021222324252627282930313233343536373839404142434445464748495051525354555657585960
Page 10
8
2.3 Analytical Methods
Five fluid samples were collected and analyzed in this study: NR-HFF (Non-Reacted
Hydraulic Fracturing Fluid: the original fracturing fluid synthesized for this study) that served as
control, HPT-HFF (High Pressure/Temperature Hydraulic Fracturing Fluid; HFF exposed to high
pressure and temperature in the absence of shale), and LM-2, WV-7, and MIP-3H fluids
collected after the fluid-shale reactions with respective shale samples.
Fluid samples were collected from the reactors at the conclusion of the 14-day experiment
using a high-density polyethylene Luer syringe and filtered via a 0.45µm WhatmanTM syringe
filter attachment. Samples for ion chromatography (IC, ThermoFisher ICS-5000+ with AS11-HC
column for anion and CS16 column for cation quantification) were collected with minimal
headspace in 10 mL plastic vials. The IC analysis focused on observing low molecular weight
mono substituted carboxylic acids (e.g., acetate, formate, butyrate, and succinate) and dissolved
major cations and anions of interest in this study (e.g., Ba2+, SO42-, and PO4
3-). All the samples
were run in triplicates, and the standard error of IC measurements reported here were generally
less than ± 3%. Additionally, every 10-20 samples, a cation/anion control sample (Sigma
Aldrich, Inc.) was added during measurements, whose accuracy is within 95% - 105%. The
detection limit of the organic acids and ions analyzed in this study are indicated in Table 3 and
Table 4.
Sample splits for non-purgeable organic carbon (NPOC) and dissolved inorganic carbon
(DIC) were analyzed with a Shimadzu Total Organic Carbon/Total Inorganic Carbon (TOC/TIC)
Analyzer. Average values from 3-5 replicates were reported with < 2% precision (%RSD), and
Page 9 of 31 Environmental Science: Processes & Impacts
123456789101112131415161718192021222324252627282930313233343536373839404142434445464748495051525354555657585960
Page 11
9
quality control samples for every 10-12 samples demonstrated consistent accuracy within 95%-
105%.
Volatile organic carbon (VOC) analytes were sampled in accordance with methods described
in Chapter 4 of EPA SW-486 Compendium: Organic Analytes. Samples for VOC analysis were
placed in pre-cleaned 60 mL volatile organic analysis (VOA) vials and acidified with minimal
headspace to preserve target analytes. VOCs were efficiently transferred from the aqueous phase
to the vapor phase by bubbling helium at a flow rate of 40mL/min through a portion of the
aqueous sample at ambient temperature and purged for 11 minutes. The vapor is swept through
a sorbent trap (Supelco Trap A, Tenax 24cm) where the volatile components are adsorbed. The
sorbent trap is then heated at 180oC for 12 minutes and backflushed with an inert gas to desorb
the components onto a gas chromatographic (GC) column (30m x 0.53mmID VOCOL capillary
column with 3μm film thickness). A temperature program of 2°C/min to 75°C (with initial
temperature 45°C) then to 25°C/min to 220°C and hold 2 minutes was used in the gas
chromatograph (GC) to separate the organic compounds. Detection is achieved by a photo-
ionization detector (PID) for detection of the aromatic compounds. This analysis was performed
at REIC Labs in Morgantown, WV, within one day of sampling and kept at 4°C until analyzed.
The analysis was conducted in accordance with EPA Method 8260B and analytes of focus
included benzene, toluene, ethylbenzene and xylene with a detection limit of 1 μg/ml for
benzene, toluene, ethylbenzene, and o-xylene and 2 μg/ml for m/p xylene.
Mineral compositional analysis was performed on powdered shale samples (using SPEX
mixer mill), using a PANalytical X’Pert Pro X-ray Diffractometer with a CuKα source at 2θ
angles from 5° to 75° and a step time of ~12 s per degree (total scan time 13.5 min). 20-mm slit
Page 10 of 31Environmental Science: Processes & Impacts
123456789101112131415161718192021222324252627282930313233343536373839404142434445464748495051525354555657585960
Page 12
10
was used to focus X-rays onto an Xcelerator™ detector. Samples were irradiated on a spinning
stage (1 revolution/s), with antiscatter and divergence slit angles of 1° and 0.5°, respectively. The
x-ray beam was operated at current 40 mA and voltage 45 kV. Spectra were interpreted using the
X’pert HighScore Plus Program to evaluate the percentage of various mineral phases present.
Semi-quantitative estimation of percentages was performed using the reference-intensity ratio
(RIR) matrix-flushing method28,29 based on selected PDF2 reference samples chosen for each
mineral phase. The minerals wt % were calculated to the nearest unit, and the total sum of the
minerals was within 100 ± 1 wt %.
Geochemical modeling of the IC and DIC data for each fluid (NR-HFF, HPT-HFF, LM-2,
WV-7, and MIP-3H), was performed using Geochemists Workbench Professional v. 10.0 using
the MINTEQ database to calculate saturation indices for minerals in the system (sulfate,
carbonate, and phosphate bearing).
3.0 Results
3.1 Mineralogy and Aqueous Inorganic Chemistry
The Marcellus Shale samples in this study were mixed layer clays with lower fractions of
carbonate, quartz, pyrite, and feldspar as compared to clay minerals (Table 2), consistent with
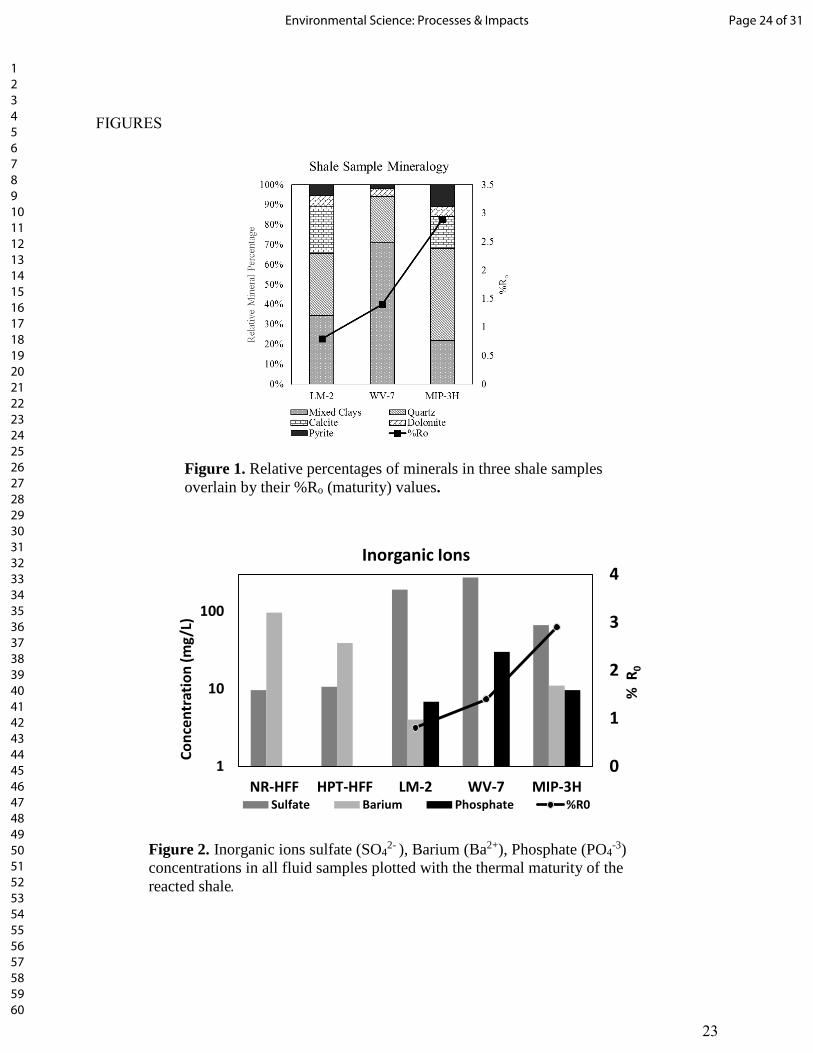
mineral compositions in previous studies.30,31 Calcite abundance differed amongst the samples,
in which it was identified in the LM-2 (21 wt%) and MIP-3H (16 wt%) samples, however, it was
not detected in the WV-7 sample (Figure 1). Dolomite and pyrite were both detected within 1 –
10 wt% in all three shale samples (dolomite: LM-2 5 wt%, WV-7 4 wt%, and MIP-3H 5 wt%;
pyrite: LM-2 and MIP-3H 5 wt%, and WV-7 2 wt%). Mixed clay and quartz content varied
Page 11 of 31 Environmental Science: Processes & Impacts
123456789101112131415161718192021222324252627282930313233343536373839404142434445464748495051525354555657585960
Page 13
11
amongst all samples (Table 2). No direct relationship was observed between mineralogy and
thermal maturity (Figure 1). However TOC decreased with increasing thermal maturity (Table
2).
Results indicate that except sulfate, almost all cations and anions are reduced by half on
increasing pressure and temperature in shale-free fracturing fluids (HPT-HFF) as compared to
initial non reacted NR-HFF (Table 3). However, the most measurable changes observed in IC-
analyzed inorganic species are for shale-reacted fluids, where both SO42- and PO4
3- increased and
Ba2+ decreased (Table 3, Figure 2). Sulfate concentrations in the shale-reacted samples were all
elevated relative to the HPT-HFF sample, which is the shale-free control experiment (Table 3,
Figure 2). The NR-HFF and HPT-HFF shale-free samples contained 9.6 mg/L SO42- and 10.6
mg/L SO42-, respectively. For experiments containing shale, SO4
2- was 189.8 mg/L (LM-2),
271.5 mg/L SO42- (WV-7), and 66.1 SO4
2- (MIP-3H). Barium concentrations in the shale-reacted
samples were either substantially lower (less by at least 70%), or non-detectable, relative to the
shale-free control sample HPT-HFF (Table 3, Figure 2). All shale-reacted samples showed a
substantial decrease in Ba2+ relative to the shale-free experiments ([Ba2+] = 3.8 mg/L (LM-2),
10.6 mg/L Ba2+ (MIP-3H), and not-detectable (WV-7)), while the shale-free samples contained
[Ba2+] = 96.2 mg/L (NR-HFF), and 39.1 mg/L (HPT-HFF). No measurable PO43- was present in
NR-HFF or HPT-PF, however it was detected in all shale-reacted fluids ([PO43-] = 6.9 mg/L
(LM-2), 29.8 mg/L PO43- (WV-7), and 9.6 mg/L (MIP-3H)) (Table 3, Figure 2). The pH values
in shale-free conditions remained low, where NR-HFF was 1.3 and HPT-HFF was 1.9. For the
shale-reacted samples, pH values varied and were measured as 2.3 (WV-7), 5.73 (MIP-3H), and
6.07 (LM-2) (Table 3). Dissolved inorganic carbon was detected in only two samples, LM-2 and
Page 12 of 31Environmental Science: Processes & Impacts
123456789101112131415161718192021222324252627282930313233343536373839404142434445464748495051525354555657585960
Page 14
12
MIP-3H. LM-2 contained 35.18 C mg/L DIC and MIP-3H contained 15.8 mg/L DIC. WV-7
fluid had no observable inorganic carbon (Table 3).
3.2 Aqueous Organic Chemistry
Substantial changes in the organic chemistry of fluids from all experiments performed at
elevated pressure and temperature were observed relative to the shale-free control that remained
at ambient conditions. Target volatile organic compounds (VOCs) were detected in the shale-free
HPT-HFF sample (no shale, elevated P,T), which also contained elevated non-purgeable organic
carbon (NPOC) relative to the control NR-HFF fluid (no shale, ambient P,T) (Table 4). For
experiments with shales of different thermal maturity, VOCs were detected at higher
concentrations in the low-maturity shale (LM-2) relative to all other samples, and at around the
same levels for the intermediate-maturity shale (WV-7) as the HPT-HFF sample. VOCs were not
detected in fluids from the experiment with the highest thermal maturity shale (MIP-3H) (Table
4, Figure 3A).
The target VOC analytes, BTEX compounds, were observed in HPT-HFF at relatively low
concentrations. HPT-HFF fluid contained toluene concentrations of 2.7 µg/L and xylene
concentrations of 9.7 µg/L. Fluid from the LM-2 reaction was the only sample which contained
benzene, at a concentration of 2.5 µg/L. The LM-2 sample also contained toluene (14.8 µg/L)
and xylene (15.8 µg/L). The WV-7 fluid contained toluene (1.3 µg/L) and xylene (7.1 µg/L).
HPT-HFF, WV-7 and LM-2 samples no measurable amount of ethylbenzene, fluid from the
MIP-3H reaction produced no observable BTEX compounds. It is also important to note that
NR-HFF had no measurable BTEX compounds (Table 4, Figure 3A).
Page 13 of 31 Environmental Science: Processes & Impacts
123456789101112131415161718192021222324252627282930313233343536373839404142434445464748495051525354555657585960
Page 15
13
No direct trend between fluid-phase NPOC and either the R0 or the experimental P and T,
were observed (Table4). The NPOC values were elevated in some experiments performed at
elevated P,T (HPT-HFF > LM-2) relative to the shale-free ambient P,T fracturing fluid (NR-
HFF), however, two experiments contained lower NPOC (NR-HFF > MIP-3H > WV-7) (Table
4). Low molecular weight organic acids (acetate, formate, butyrate, and succinate) were detected
in all experimental fluids, and they were the highest in the HPT-HFF and lowest in NR-HFF
(Table 4, Figure 3B). Fluids from the experiments containing shale contained different
proportions of individual organic acids; however, the total values were similar across the three
shale samples, and individual organic acids did not display any trends with thermal maturity
(Table 4, Figure 3B).
4.0 Discussion
4.1 Inorganic Mineral Reactions affecting Shale Composition and Produced Fluid Chemistry
Changes in the inorganic fluid chemistry amongst the five experimental fluids demonstrate
that inorganic reactions occur both due to changes from ambient to elevated P,T, conditions, and
during interaction between HFF and the shale. A net decrease (almost half) in almost all cations
(Na+, K+, Ba2+, Sr2+, Mg2+, and Ca2+) upon increasing pressure and temperature of the shale-free
HFF sample occurred (compare NR-HFF and HPT-HFF in Table 3). The observed change in
inorganic ions (especially cations) could result from chelation with fracturing fluid additives, or
potential chemical transformation or precipitation during the experiment. Chelation of inorganic
ions is possible due to the presence of ligands in scaling inhibitors and cross linkers (such as
ethylene glycol or ethanolamine) in the fracturing fluid. For example, ethylene glycol is reported
to form complexes with certain divalent metal halides.32 Additionally, if anions such as Br-
Page 14 of 31Environmental Science: Processes & Impacts
123456789101112131415161718192021222324252627282930313233343536373839404142434445464748495051525354555657585960
Page 16
14
transformed to BrO3- due to reaction with sulfate radicals,33 present as a result of ammonium
persulfate breakdown in our experiments, the resulting BrO3- anion would not be detectable with
the IC method applied in this study. Changes in temperature also may have resulted in the
formation of non-detected precipitates in the reactor, or that were removed during fluid sampling
and filtration.34 Geochemical modeling was used to understand the evolution of inorganic species
in the experiments. However, the changes observed in the IC analysis between NR-HFF and
HPT-HFF are not consistent with the predictions of the model (Table. 5). This could be because
geochemical modeling software does not account for the effect of processes like chelation and
filtration on the fluid chemistry. Although the interaction of HFF with the wall of the reactor
could occur, this is unlikely as the containers used to conduct the experiments were made of
Teflon, which is not anticipated to affect the cationic composition of the fluids. There is a
possibility of adsorption/desorption of organic molecules on the Teflon. However, the
experimental conditions for all the reactions (with and without shale) were same. Therefore,
relative differences observed in the concentration of organic molecules between different
experiments are most likely due to shale fracturing fluid interactions.
Reactions involving shale appear to be largely controlled by reactions involving carbonate
minerals. The HFF formulation applied in this study included HCl and started with low pH
(Table 1, Table 3), which is common for HFF applied in the Marcellus Shale.6 HCl is used for
cleaning perforations prior to injecting fracturing fluid mixtures and is a common additive used
to prevent scaling of secondary minerals.18 The pH in our LM-2 and MIP-3H fluid samples rose
substantially (to 6.1 and 5.7, respectively; Table 3), indicating that carbonate minerals in these
shale samples acted as effective buffers during the reaction similar to prior observations.4,5,8,35
The pH in our WV-7 sample remained low, with a similar value to the HPT-HFF (no-shale)
Page 15 of 31 Environmental Science: Processes & Impacts
123456789101112131415161718192021222324252627282930313233343536373839404142434445464748495051525354555657585960
Page 17
15
experiment at elevated P, T, indicating the minimal buffering capacity of the WV-7 shale (Table
3).
Differences between the pH buffering capacity between the LM-2, MIP-3H, and WV-7
samples can be explained through differences in calcite content between the samples, where LM-
2 and MIP-3H contain 21 and 16 wt%, respectively, while calcite was not detected in WV-7
(Table 2, Figure 1). Calcite saturation indices calculated for our experimental fluids (only LM-2
and MIP-3H, as these were the only samples with detectable DIC as a calculation input), showed
that both shale-reacted solutions were undersaturated with respect to calcite (Table 5). These
results are consistent with other studies focused on HFF-shale reactions, which showed that
calcite content of the shale significantly controlled pH buffering and mineral dissolution and
precipitation reactions. 4–6,8,35
The potential for mineral scale formation involving barite was evaluated for our experiments,
based on the changes in Ba2+ and SO42- observed between the experiments with and without
shale (Table 3, Figure 2). Application of the experimental data towards geochemical equilibrium
calculations showed that barite is supersaturated in all experimental fluids, except for the WV-7
experiment (Table 5). The only reason for this difference with WV-7 is because no Ba2+ was
detected via IC for the fluid sample, which likely indicates that all Ba2+ in that experiment was
removed via precipitation. Barite precipitation during HFF-shale interaction has been observed
by various investigators, 4,7,36 has the potential to affect shale porosity and permeability,4,7 and
may play a role in shale oxidation-reduction.8,37
Multiple sources for Ba2+ and SO42- exist in the HFF-shale reaction scenario. Although Ba2+
in unconventional reservoirs may originate from trapped drilling muds,38 Ba2+ also may be
Page 16 of 31Environmental Science: Processes & Impacts
123456789101112131415161718192021222324252627282930313233343536373839404142434445464748495051525354555657585960
Page 18
16
present within the shale, release upon HFF-shale interaction under low pH conditions, and re-
precipitate once carbonate mineral dissolution buffers the system pH.7,9,37,38 Potential sources of
SO42- include fracturing fluid additives (e.g., ammonium persulfate), sulfate-bearing minerals in
the shale (e.g., anhydrite), and oxidative dissolution of pyrite.5,8,39 Previous studies postulate that
due to the high buffering capacity of calcite, shale samples containing a higher content of calcite
result in the higher dissolution of pyrite and higher concentration SO42-.5,6
In our study, it was observed that the WV-7 shale sample had the highest SO42- concentration
even though it contains the least amount of calcite and pyrite as compared to LM-2 and MIP-3H
shale samples (Table 3, figure 2). This is in contrast to conclusions made by previous studies.5,6
We postulate that a large amount of sulfate formation in the WV-7- fracturing fluid experiments
results from the more extensive breakdown of the ammonium persulfate breaker. This could
possibly result from the presence of higher clay content (almost twice) in WV-7 sample. Clay
carries a net negative charge on its surface which can interact with the ammonium ion (NH4+) in
the ammonium persulfate breaker. We postulate that association of NH4+ with negatively
charged clay surfaces could enhance dissociation of ammonium persulfate. Higher breakdown of
ammonium persulfate will release more sulfate ions into the solution. The higher sulfate
concentration will also lead to the formation of higher amount BaSO4 precipitate by taking up
free barium ions present in the solution. We postulate that this ultimately results in a greater
decrease in barium ions in WV-7 reacted fluid sample as compared to LM-2 and MIP-3H reacted
fluid samples (Fig. 2, Table 3).
A new observation from the experiments performed with this study is the change in fluoride and
phosphate concentrations in fluids from certain HFF-shale experiments, and the subsequent
Page 17 of 31 Environmental Science: Processes & Impacts
123456789101112131415161718192021222324252627282930313233343536373839404142434445464748495051525354555657585960
Page 19
17
supersaturation of certain PO43-- and F-bearing minerals (Tables 3 and 5). The absence of PO4
3-
in the NR-HFF and HPT-HFF, and increase in concentrations in all fluid samples, is evidence
that the F and PO43- is leaching from the powdered shale (Table 3). The possible sources of F
and PO43- are from apatite (Ca5(PO4)3(OH), Ca10 (PO4)5(CO3)F3) and fluorite minerals present
in shale samples (Table. 5). Although, these phases were not detected in XRD analysis probably
because of their lower abundance in the samples, but a prior study on Marcellus shale also
detected evidence for authigenic apatite minerals such as carbonate fluorapatite using a
phosphate-specific sequential extraction step.40 The variations in concentrations of F and PO43-
in the fluid samples could possibly be due to the variations in concentrations of the F and PO43-
rich minerals in the shale and/or different eh and pH conditions of the solution. The higher
concentration of F and PO43- in the fluid samples of WV-7 as compared to LM-2 and MIP-3H
are likely due to the higher dissolution of F and PO43- rich minerals present in WV-7 shale
sample as indicated by their lower saturation index values (Table. 5). Geochemical equilibrium
modeling showed that both LM-2 and MIP-3H fluids are supersaturated with respect to FCO3-
apatite and hydroxyapatite, while all three HFF-shale experiments are supersaturated with
respect to fluorite (Table 5). Similar observations of apatite precipitation are reported on
Huntersville Chert surfaces when exposed to Marcellus Shale produced water (Dieterich et al.,
2016). Formation of these precipitates can clog up the pore spaces during hydraulic fracturing
operation and thus have implications on well productivity.
To evaluate how representative the experimental fluids from this study are to field-collected
produced waters from the Marcellus Shale, we compared the composition of our shale-reacted
fluids with data reported for Marcellus produced waters by the USGS.41 Experimental values for
our shale-reacted experiments (LM-2, MIP-3H, and WV-7) fall within the USGS-reported range
Page 18 of 31Environmental Science: Processes & Impacts
123456789101112131415161718192021222324252627282930313233343536373839404142434445464748495051525354555657585960
Page 20
18
of values (Figure 4). Similarities observed with the mineral reactions between this and prior
studies, and with reported produced water compositions from the Marcellus Shale, indicate that
the organic reactions discussed in the next section are relevant to Marcellus Shale reservoir
conditions.
4.2 Aqueous Organic Chemistry
Differences in organic chemistry between the NR-HFF, HPT-HFF, and experiments
containing shale (LM-2, WV-7, and MIP-3H) indicate that the HFF reacts at elevated P,T both in
the absence and presence of shale, and that the shale controls the evolution of aqueous organic
chemistry in the LM-2, WV-7 and MIP-3H experiments (Table 4, Figure 3).
Exposing HFF to elevated pressure and temperature resulted in differences between the total
dissolved organic carbon (DOC) concentrations between the shale-free experiments (where DOC
represents the non-purgeable organic carbon (NPOC) and organic acids measured in the
experimental fluids) and volatile organic compound (VOC) content (Table 4). The DOC
increased for the HPT-HFF relative to the NR-HFF and results from reactions involving the HFF
additives. The combination of gelling agent and cross linker are applied during hydraulic
fracturing to increase the molecular weight of the injected HFF in order to transport proppant.42
The cross linker also may link other components of the fracturing fluid, resulting in larger
organic molecules that are rendered non-purgeable in the HPT-HFF. Boric acid and
ethanolamine were both included in the HFF recipe used for this study, and boric acid is reported
to catalyze multiple organic transformations.43
Page 19 of 31 Environmental Science: Processes & Impacts
123456789101112131415161718192021222324252627282930313233343536373839404142434445464748495051525354555657585960
Page 21
19
Increases in organic acid and VOC content in the absence of shale shows that both classes of
compounds can be produced solely from HFF exposure to reservoir pressure and temperature
conditions. Although formate and succinate are present in the NR-HFF solution, likely included
as part of the HFF chemical additives ( Table 1), in the HPT-HFF acetate and butyrate are
measured above the detection limit, formate concentrations double, and succinate decreases
(Table 4, Figure 3B). Toluene and xylenes are also generated upon exposure of HFF to reservoir
conditions and are detectable in HPT-HFF (and below the detection limit in NR-HFF) (Table 4,
Figure 3C). A prior study showed that certain organic additives, such as gelling and friction
agents, degraded under reservoir conditions and were able to produce lower molecular weight
organic compounds.19
The concentration and speciation of dissolved organic constituents differed in experiments
containing shale (LM-2, WV-7, MIP-3H) relative to the shale-free HFF reacted at elevated P, T
(HPT-HFF). Experiments containing shale exhibited similarities across shale types for total
organic acid concentrations. However, these organic acid concentrations were lower along with
NPOC when compared to the HPT-HFF fluid (Table 4, Figure 3B). The shale OM matrix
(kerogen) may act as a location for adsorption of the dissolved organic carbon (DOC; organic
acids + NPOC) compounds onto the surface. More mature shale contains more aromatic
compounds within its OM, resulting in higher organic porosity and the relatively high surface
area within this matrix.44,45 This organic porosity creates an effective adsorbent trap for organic
molecules used or generated in the hydraulic fracturing process.45 Other laboratory fluid-shale
studies observed a similar decrease in DOC in the fluid samples from autoclave reactions, while
also observing an increase in TOC in the solid sample.8,19 Alternatively, components of the shale
may catalyze the degradation of dissolved OM, 19,46subsequently lowering concentrations of
Page 20 of 31Environmental Science: Processes & Impacts
123456789101112131415161718192021222324252627282930313233343536373839404142434445464748495051525354555657585960
Page 22
20
organic acids and NPOC in the LM-2, WV-7, and MIP-3H experiments relative to the HPT-HFF
experiment.
Although organic acid concentrations were lower in the experiments containing shale, it is
possible that some of the organic acids released into the fluid were generated from the shale
kerogen (as opposed to solely being sourced from the hydraulic fracturing fluid). Low molecular
weight carboxylic acids, in particular, acetate and formate, have been observed in both produced
water and fluids from similar fluid-shale experiments.11,14,47 The proliferation of these
compounds is considered to be related to the labile ester linked carboxyl functional groups
attached to the OM within the shale formation. These labile functional groups are formed from
throughout the process of diagenesis48 and are thought to be extracted from the shale reservoir
upon hydraulic fracturing and fluid saturation.47 Water-soluble organic acids have been measured
for separate shale sampled from the MIP-3H well. 49
Measured VOCs in the LM-2 experiment were the highest out of all fluids sampled (Table 4,
Figure 3A). VOCs were higher in both LM-2 and WV-7 compared to the HPT-HFF, and below
the detection limit in the MIP-3H experiment (Table 4, Figure 3A). The LM-2 sample contains a
larger portion of labile hydrocarbons, as the OM within the shale has not been thermally
degraded or altered to the same extent as the high maturity rocks21 (LM-2 samples represented as
sample BG-1 LM in 21). Similar to the degradation of gelling agents, the labile portion of the
organic macromolecules in shale are subsequently transformed and solubilized into the fluid
under high pressure and temperatures as a result of kerogen reaction.25 It has been shown the
persulfate breakers have been utilized to dissolve or breakdown the kerogen within subterranean
formations (US Patent 2017/066959A1). Products of oxidizing breakers, such as ammonium
Page 21 of 31 Environmental Science: Processes & Impacts
123456789101112131415161718192021222324252627282930313233343536373839404142434445464748495051525354555657585960
Page 23
21
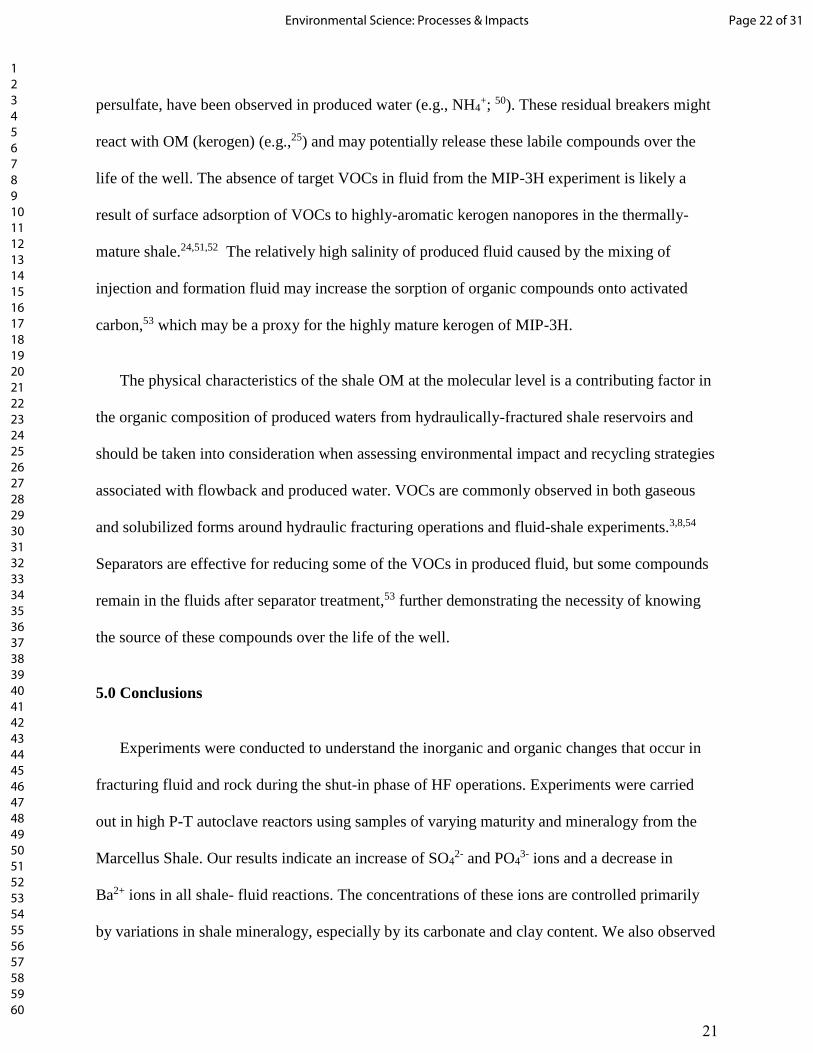
persulfate, have been observed in produced water (e.g., NH4+; 50). These residual breakers might
react with OM (kerogen) (e.g.,25) and may potentially release these labile compounds over the
life of the well. The absence of target VOCs in fluid from the MIP-3H experiment is likely a
result of surface adsorption of VOCs to highly-aromatic kerogen nanopores in the thermally-
mature shale.24,51,52 The relatively high salinity of produced fluid caused by the mixing of
injection and formation fluid may increase the sorption of organic compounds onto activated
carbon,53 which may be a proxy for the highly mature kerogen of MIP-3H.
The physical characteristics of the shale OM at the molecular level is a contributing factor in
the organic composition of produced waters from hydraulically-fractured shale reservoirs and
should be taken into consideration when assessing environmental impact and recycling strategies
associated with flowback and produced water. VOCs are commonly observed in both gaseous
and solubilized forms around hydraulic fracturing operations and fluid-shale experiments.3,8,54
Separators are effective for reducing some of the VOCs in produced fluid, but some compounds
remain in the fluids after separator treatment,53 further demonstrating the necessity of knowing
the source of these compounds over the life of the well.
5.0 Conclusions
Experiments were conducted to understand the inorganic and organic changes that occur in
fracturing fluid and rock during the shut-in phase of HF operations. Experiments were carried
out in high P-T autoclave reactors using samples of varying maturity and mineralogy from the
Marcellus Shale. Our results indicate an increase of SO42- and PO4
3- ions and a decrease in
Ba2+ ions in all shale- fluid reactions. The concentrations of these ions are controlled primarily
by variations in shale mineralogy, especially by its carbonate and clay content. We also observed
Page 22 of 31Environmental Science: Processes & Impacts
123456789101112131415161718192021222324252627282930313233343536373839404142434445464748495051525354555657585960
Page 24
22
a net decrease in DOC (organic acids + NPOC) concentrations for all the shale-fluid reactions as
compared to control HPT-HFF fluid. Further, we noted a decrease in concentrations of VOCs
(benzene, toluene, and xylene) with increasing maturity indicating absorption of these organic
species in shale OM.
The variations in chemical signatures of reacted fluids clearly suggest that the mineralogy
and nature of OM plays a key role in the mobilization of inorganic and organic components
during HF operations. It also suggests these reactions can vary significantly in different parts of
the basin. Therefore, the chemical composition of HFF’s should be modified to better target the
varying mineralogical compositions and nature of OM encountered in different parts of the basin.
Further investigation on the sorption, transformation, transport, and fate of low molecular weight
organic components in fluid-shale reactions is necessary to improve understanding of
geochemical reactions during hydraulic fracturing to optimize gas production, minimize
environmental impact, and design water reuse and recycling strategies.
Acknowledgments
Samples for this research were provided by SWN energy and the Marcellus Shale Energy and
Environment Laboratory (MSEEL) funded by the Department of Energy’s National Energy
Technology Laboratory (DOE-NETL) grant DE# FE0024297. The research was also funded by
Department of Energy’s National Energy Technology Laboratory grant DEFE0004000, a
National Science Foundation grant (NSF DEB-1342732) to S. Sharma and the Department of
Energy’s Office of Oil and Natural Gas Unconventional Resources Research Program support of
the NETL Research and Innovation Center’s Onshore Unconventional Resources Portfolio.
Page 23 of 31 Environmental Science: Processes & Impacts
123456789101112131415161718192021222324252627282930313233343536373839404142434445464748495051525354555657585960
Page 25
23
FIGURES
0
1
2
3
4
1
10
100
NR-HFF HPT-HFF LM-2 WV-7 MIP-3H
% R
0
Co
nce
ntr
atio
n (
mg/
L)
Inorganic Ions
Sulfate Barium Phosphate %R0
Figure 1. Relative percentages of minerals in three shale samples
overlain by their %Ro (maturity) values.
Figure 2. Inorganic ions sulfate (SO42- ), Barium (Ba2+), Phosphate (PO4
-3)
concentrations in all fluid samples plotted with the thermal maturity of the
reacted shale.
Page 24 of 31Environmental Science: Processes & Impacts
123456789101112131415161718192021222324252627282930313233343536373839404142434445464748495051525354555657585960
Page 26
24
0
1
2
3
4
0
10
20
30
40
NR-HFF HPT-HFF LM-2 WV-7 MIP-3H
%R
0
Co
nce
ntr
atio
n (
µg/
L)
Volatile Organic Compounds
Benzene Toluenem,p-Xylene o-XyleneTotal BTEX (µg/L) %R0
A
0
1
2
3
4
0
10
20
30
40
NR-HFF HPT-HFF LM-2 WV-7 MIP-3H
%R
0
Co
nce
ntr
atio
n (
mg/
L)
Organic Acids
Acetate FormateButyrate SuccinateTotal Organic Acids (mg/L) %R0
B
0
2
4
6
8
10
12
14
16
18
0
5
10
15
20
25
30
35
15.4 12.9 9
TOC
(w
t%)
Co
nce
ntr
atio
n
%R0
Total BTEX(µg/L)Total OrganicAcids (mg/L)TOC (wt%)
C
Page 25 of 31 Environmental Science: Processes & Impacts
123456789101112131415161718192021222324252627282930313233343536373839404142434445464748495051525354555657585960
Page 27
25
Figure 3. A) Volatile organic compound concentrations in all fluid samples plotted with the
thermal maturity for the reacted shales. B) Organic acid concentrations in all fluid samples
plotted with the thermal maturity for the reacted shales. C) Plot of the relationship between total
targeted VOC’s, total targeted organic acids, TOC, and %R0. For panels A and B, the cross-
hatched bar represents the sum of concentrations for each class of compounds measured in the
sample. Components without bar display are not detectable (A, B). In panel C, lines are
presented to display the direction of the data trend and do not represent a calculated fit of the
data.
Figure 4. Piper diagram showing the relative amounts of the most abundant ions in
solution. Grey dots represent produced water from hydraulic fracturing operations in the
Marcellus Shale basin collected by the USGS and the black markers overlain, represent
the three fluid samples from fluid-shale reactions in this study.
Page 26 of 31Environmental Science: Processes & Impacts
123456789101112131415161718192021222324252627282930313233343536373839404142434445464748495051525354555657585960
Page 28
26
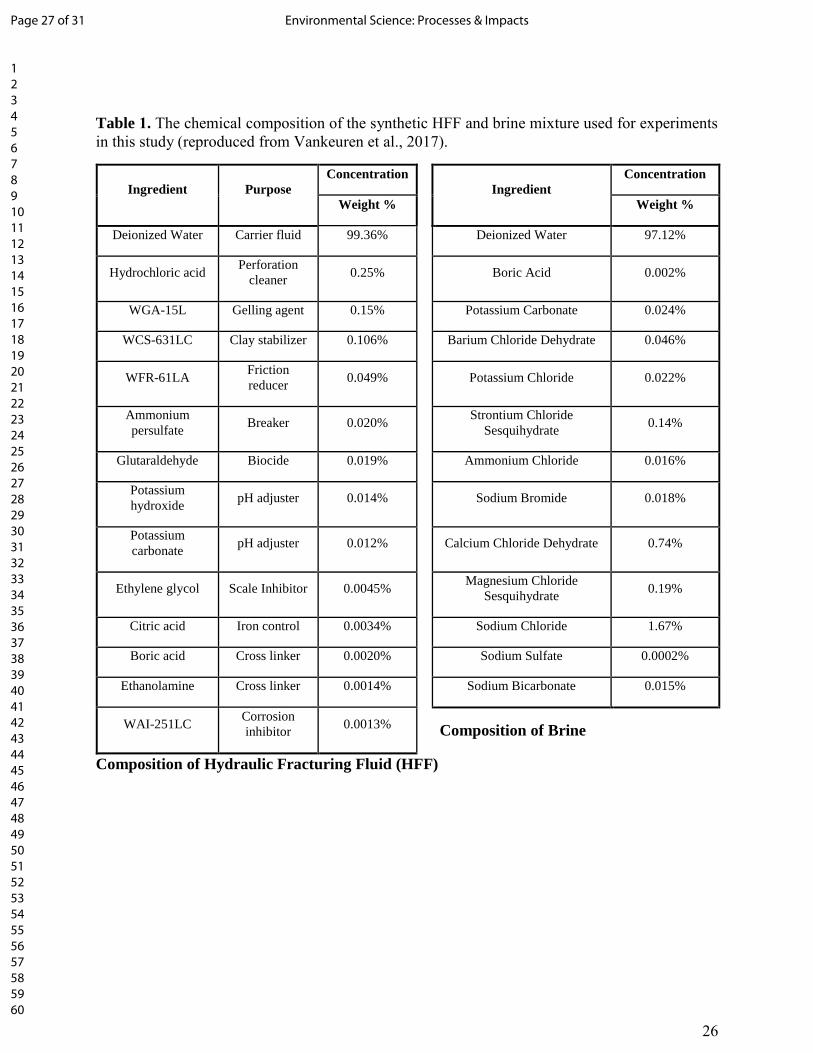
Table 1. The chemical composition of the synthetic HFF and brine mixture used for experiments
in this study (reproduced from Vankeuren et al., 2017).
Ingredient Purpose
Concentration
Ingredient
Concentration
Weight %
Weight %
Deionized Water Carrier fluid 99.36%
Deionized Water 97.12%
Hydrochloric acid Perforation
cleaner 0.25%
Boric Acid 0.002%
WGA-15L Gelling agent 0.15%
Potassium Carbonate 0.024%
WCS-631LC Clay stabilizer 0.106%
Barium Chloride Dehydrate 0.046%
WFR-61LA Friction
reducer 0.049%
Potassium Chloride 0.022%
Ammonium
persulfate Breaker 0.020%
Strontium Chloride
Sesquihydrate 0.14%
Glutaraldehyde Biocide 0.019%
Ammonium Chloride 0.016%
Potassium
hydroxide pH adjuster 0.014%
Sodium Bromide 0.018%
Potassium
carbonate pH adjuster 0.012%
Calcium Chloride Dehydrate 0.74%
Ethylene glycol Scale Inhibitor 0.0045%
Magnesium Chloride
Sesquihydrate 0.19%
Citric acid Iron control 0.0034%
Sodium Chloride 1.67%
Boric acid Cross linker 0.0020%
Sodium Sulfate 0.0002%
Ethanolamine Cross linker 0.0014%
Sodium Bicarbonate 0.015%
WAI-251LC Corrosion
inhibitor 0.0013%
Composition of Brine
Composition of Hydraulic Fracturing Fluid (HFF)
Page 27 of 31 Environmental Science: Processes & Impacts
123456789101112131415161718192021222324252627282930313233343536373839404142434445464748495051525354555657585960
Page 29
27
Table 2. Organic and mineral composition of three shale samples form Marcellus Shale cores,
collected from three different depths and geographical areas. The %R0 and TOC values were
reported by (Agrawal and Sharma, 2018b, c). Semi-quantitative XRD data are used for LM-2,
WV-7, MIP-3H samples analyzed in this study.
Table 3. Cation and anion concentrations in fluid samples in mg/L measured via IC. Also
included is pH for each fluid sample and overall total dissolved solids (TDS in mg/L). For
dissolved inorganic carbon (DIC), values are either not-detected (ND) or reported in mg as C/L.
The values reported are average of samples run in triplicates and the standard error of all
measurements are < ± 3%
Table 4. Dissolved organic carbon (DOC) concentrations in fluid samples in unit of mg/L, where
NPOC = non-purgeable organic carbon in unit of mg as C/L, and volatile organic carbon (VOC)
concentrations in µg/L, for each fluid sample. The values reported are average of samples run in
triplicates and within 2% precision (%RSD).
SAMPLE ID DOC CONCENTRATIONS IN MG/L VOC CONCENTRATIONS IN µG/L
NPOC Acetate Formate Butyrate Succinate Benzene Toluene m,p-Xylene o-Xylene
Det. limit 1.0 0.1 0.1 0.18 0.1 1.0 1.0 2.0 1.0
NR-HFF 243 ND 6.1 ND 1.9 ND ND ND ND
HPT-HFF 317 19.3 13.9 1.6 1.0 0.0 2.7 5.9 3.8
LM-2 264 12.5 10.2 3.0 0.9 2.5 14.8 10.2 5.6
WV-7 197 16.3 6.9 1.7 3.0 ND 1.3 4.7 2.4
MIP-3H 235 12.7 9.4 2.3 1.1 ND ND ND ND
Sample ID Depth (ft.) %Ro Tmax (°C) TOC (wt%) Quartz
(wt%)
Calcite
(wt%)
Dolomite
(wt%)
Pyrite
(wt%)
Mixed Clays
(wt%)
LM-2 5825.7 0.8 443 15.4 28 21 5 5 42
WV-7 6615.8 1.4 475 12.9 23 ND 4 2 71
MIP-3H 7511.8 2.9 561 9.0 46 16 5 11 22
pH F- Br- NO3
- SO4-2 PO4
-3 Cl- Li+ Na+ NH4+ K+ Mg+2 Ca+2 Sr+2 Ba+2 DIC
Det. limit - 0.04 0.26 0.2 0.5 0.4 0.2 0.04 0.4 0.2 0.2 0.2 0.4 0.1 0.1 0.5
NR-HFF 1.3 0.6 107 4.5 9.6 ND 16729 ND 6583 89 393 213 2015 464 96 ND
HPT-HFF 1.9 0.5 60 2.3 10.6 ND 7809 ND 3277 52 165 104 967 224 39 ND
LM-2 6.1 3.2 68 1.7 189.8 6.8 9060 0.1 3727 51 205 132 1606 211 4 35.2
WV-7 2.3 9.9 110 5.1 271.5 29.8 16867 0.2 6663 92 427 418 2576 367 ND ND
MIP-3H 5.7 3.6 65 1.6 66.1 9.6 8894 0.2 3673 50 202 165 1418 228 11 15.8
Page 28 of 31Environmental Science: Processes & Impacts
123456789101112131415161718192021222324252627282930313233343536373839404142434445464748495051525354555657585960
Page 30
28
Table 5. Saturation indices for major and potential scale-forming minerals, as calculated in
Geochemists Workbench v. 10.0 using the MINTEQ database. Values are reported as log Q/K.
Iron- and silica-bearing phases are not included as Fe and Si were not measured in fluids in this
study. Blank values indicate that the mineral SI contained no value for that particular calculation.
MINERAL CHEMICAL
FORMULA NR-HFF
HPT-
HFF LM-2 WV-7 MIP-3H
Barite BaSO4 1.09 1.06 1.35 1.34
Celestite SrSO4 -1.43 -1.37 -0.12 0.11 -0.53
Gypsum CaSO4·2H2O -2.52 -2.44 -0.95 -0.77 -1.44
Calcite CaCO3 -0.82 -1.86
Strontianite SrCO3 -1.22 -2.17
Witherite BaCO3 -3.81 -4.36
FCO3-Apatite Ca10(PO4)5(CO3)F3 18.77 14.62
Fluorite CaF2 -3.69 -3.01 0.88 0.63 0.93
Hydroxyapatite Ca5(PO4)3(OH) 4.50 -19.41 2.21
Page 29 of 31 Environmental Science: Processes & Impacts
123456789101112131415161718192021222324252627282930313233343536373839404142434445464748495051525354555657585960
Page 31
29
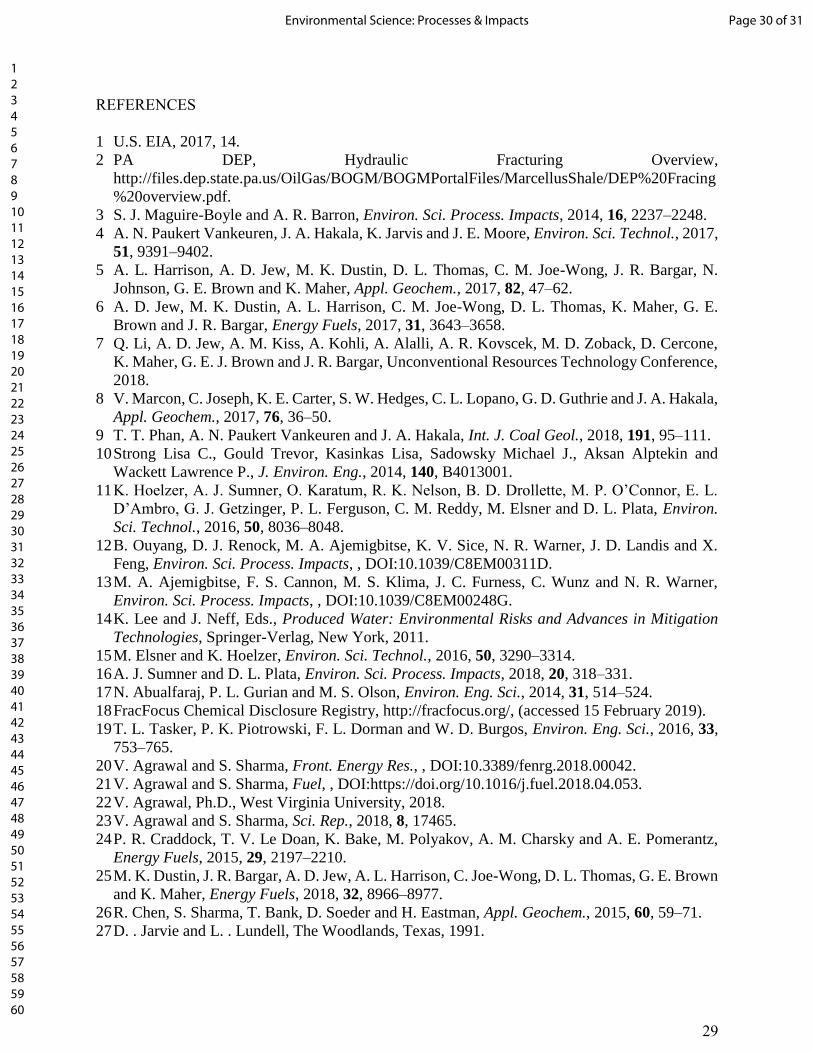
REFERENCES
1 U.S. EIA, 2017, 14.
2 PA DEP, Hydraulic Fracturing Overview,
http://files.dep.state.pa.us/OilGas/BOGM/BOGMPortalFiles/MarcellusShale/DEP%20Fracing
%20overview.pdf.
3 S. J. Maguire-Boyle and A. R. Barron, Environ. Sci. Process. Impacts, 2014, 16, 2237–2248.
4 A. N. Paukert Vankeuren, J. A. Hakala, K. Jarvis and J. E. Moore, Environ. Sci. Technol., 2017,
51, 9391–9402.
5 A. L. Harrison, A. D. Jew, M. K. Dustin, D. L. Thomas, C. M. Joe-Wong, J. R. Bargar, N.
Johnson, G. E. Brown and K. Maher, Appl. Geochem., 2017, 82, 47–62.
6 A. D. Jew, M. K. Dustin, A. L. Harrison, C. M. Joe-Wong, D. L. Thomas, K. Maher, G. E.
Brown and J. R. Bargar, Energy Fuels, 2017, 31, 3643–3658.
7 Q. Li, A. D. Jew, A. M. Kiss, A. Kohli, A. Alalli, A. R. Kovscek, M. D. Zoback, D. Cercone,
K. Maher, G. E. J. Brown and J. R. Bargar, Unconventional Resources Technology Conference,
2018.
8 V. Marcon, C. Joseph, K. E. Carter, S. W. Hedges, C. L. Lopano, G. D. Guthrie and J. A. Hakala,
Appl. Geochem., 2017, 76, 36–50.
9 T. T. Phan, A. N. Paukert Vankeuren and J. A. Hakala, Int. J. Coal Geol., 2018, 191, 95–111.
10 Strong Lisa C., Gould Trevor, Kasinkas Lisa, Sadowsky Michael J., Aksan Alptekin and
Wackett Lawrence P., J. Environ. Eng., 2014, 140, B4013001.
11 K. Hoelzer, A. J. Sumner, O. Karatum, R. K. Nelson, B. D. Drollette, M. P. O’Connor, E. L.
D’Ambro, G. J. Getzinger, P. L. Ferguson, C. M. Reddy, M. Elsner and D. L. Plata, Environ.
Sci. Technol., 2016, 50, 8036–8048.
12 B. Ouyang, D. J. Renock, M. A. Ajemigbitse, K. V. Sice, N. R. Warner, J. D. Landis and X.
Feng, Environ. Sci. Process. Impacts, , DOI:10.1039/C8EM00311D.
13 M. A. Ajemigbitse, F. S. Cannon, M. S. Klima, J. C. Furness, C. Wunz and N. R. Warner,
Environ. Sci. Process. Impacts, , DOI:10.1039/C8EM00248G.
14 K. Lee and J. Neff, Eds., Produced Water: Environmental Risks and Advances in Mitigation
Technologies, Springer-Verlag, New York, 2011.
15 M. Elsner and K. Hoelzer, Environ. Sci. Technol., 2016, 50, 3290–3314.
16 A. J. Sumner and D. L. Plata, Environ. Sci. Process. Impacts, 2018, 20, 318–331.
17 N. Abualfaraj, P. L. Gurian and M. S. Olson, Environ. Eng. Sci., 2014, 31, 514–524.
18 FracFocus Chemical Disclosure Registry, http://fracfocus.org/, (accessed 15 February 2019).
19 T. L. Tasker, P. K. Piotrowski, F. L. Dorman and W. D. Burgos, Environ. Eng. Sci., 2016, 33,
753–765.
20 V. Agrawal and S. Sharma, Front. Energy Res., , DOI:10.3389/fenrg.2018.00042.
21 V. Agrawal and S. Sharma, Fuel, , DOI:https://doi.org/10.1016/j.fuel.2018.04.053.
22 V. Agrawal, Ph.D., West Virginia University, 2018.
23 V. Agrawal and S. Sharma, Sci. Rep., 2018, 8, 17465.
24 P. R. Craddock, T. V. Le Doan, K. Bake, M. Polyakov, A. M. Charsky and A. E. Pomerantz,
Energy Fuels, 2015, 29, 2197–2210.
25 M. K. Dustin, J. R. Bargar, A. D. Jew, A. L. Harrison, C. Joe-Wong, D. L. Thomas, G. E. Brown
and K. Maher, Energy Fuels, 2018, 32, 8966–8977.
26 R. Chen, S. Sharma, T. Bank, D. Soeder and H. Eastman, Appl. Geochem., 2015, 60, 59–71.
27 D. . Jarvie and L. . Lundell, The Woodlands, Texas, 1991.
Page 30 of 31Environmental Science: Processes & Impacts
123456789101112131415161718192021222324252627282930313233343536373839404142434445464748495051525354555657585960
Page 32
30
28 F. H. Chung, J. Appl. Crystallogr., 1974, 7, 519–525.
29 F. H. Chung, J. Appl. Crystallogr., 1975, 8, 17–19.
30 T. R. Malizia, Geochemistry of the Marcellus Shale; Metals mobility and solubilization, 2011.
31 P. Staub, Clay mineralogy of the Marcellus and Utica Shales: Implications for fluid
development via cation exchange, 2014.
32 D. Knetsch and W. L. Groeneveld, Inorganica Chim. Acta, 1973, 7, 81–87.
33 J.-Y. Fang and C. Shang, Environ. Sci. Technol., 2012, 46, 8976–8983.
34 T. Phan, A. Hakala and D. Bain, Appl. Geochem., 2018, 95, 85–96.
35 F. D. H. Wilke, A. Vieth-Hillebrand, R. Naumann, J. Erzinger and B. Horsfield, Appl.
Geochem., 2015, 63, 158–168.
36 M. Dieterich, B. Kutchko and A. Goodman, Fuel, 2016, 182, 227–235.
37 D. Renock, J. D. Landis and M. Sharma, Appl. Geochem., 2016, 65, 73–86.
38 A. D. Jew, Q. Li, D. Cercone, K. Maher, G. E. J. Brown and J. R. Bargar, Unconventional
Resources Technology Conference, 2018.
39 L. Wang, S. Burns, D. E. Giammar and J. D. Fortner, Chemosphere, 2016, 149, 286–293.
40 J. Yang, M. Torres, J. McManus, T. J. Algeo, J. A. Hakala and C. Verba, Chem. Geol., 2017,
466, 533–544.
41 M. . Blondes, K. . Gans, M. . Engle, Y. . Kharaka, M. . Reidy, V. Saraswathula, J. . Thordsen,
E. . Rowan and E. . Morrissey, USGS.
42 O. US EPA, Proceedings of the Technical Workshops for the Hydraulic Fracturing Study,
https://www.epa.gov/hfstudy/proceedings-technical-workshops-hydraulic-fracturing-study-
chemical-and-analytical-methods, (accessed 15 February 2019).
43 R. Pal, Arkivoc, 2018, 2018, 346–371.
44 S. Zargari, K. L. Canter and M. Prasad, Fuel, 2015, 153, 110–117.
45 T. Zhang, G. S. Ellis, S. C. Ruppel, K. Milliken and R. Yang, Org. Geochem., 2012, 47, 120–
131.
46 B. Xiong, Z. Miller, S. Roman-White, T. Tasker, B. Farina, B. Piechowicz, W. D. Burgos, P.
Joshi, L. Zhu, C. A. Gorski, A. L. Zydney and M. Kumar, Environ. Sci. Technol., 2018, 52,
327–336.
47 Y. Zhu, A. Vieth-Hillebrand, F. D. H. Wilke and B. Horsfield, Int. J. Coal Geol., 2015, 150–
151, 265–275.
48 T. I. Eglinton, C. D. Curtis and S. J. Rowland, Mineral. Mag., 1987, 51, 495–503.
49 J. A. Hakala, T. Phan, M. Stuckman, H. Edenborn and C. Lopano, Unconv. Resour. Technol.
Conf., , DOI:10.15530/URTEC-2017-2670833.
50 J. S. Harkness, G. S. Dwyer, N. R. Warner, K. M. Parker, W. A. Mitch and A. Vengosh, Environ.
Sci. Technol., 2015, 49, 1955–1963.
51 V. Agrawal and S. Sharma, Sci. Rep., 2019, (in review).
52 G. Cornelissen, Ö. Gustafsson, T. D. Bucheli, M. T. O. Jonker, A. A. Koelmans and P. C. M.
van Noort, Environ. Sci. Technol., 2005, 39, 6881–6895.
53 A. Butkovskyi, H. Bruning, S. A. E. Kools, H. H. M. Rijnaarts and A. P. Van Wezel, Environ.
Sci. Technol., 2017, 51, 4740–4754.
54 W. Orem, C. Tatu, M. Varonka, H. Lerch, A. Bates, M. Engle, L. Crosby and J. McIntosh, Int.
J. Coal Geol., 2014, 126, 20–31.
Page 31 of 31 Environmental Science: Processes & Impacts
123456789101112131415161718192021222324252627282930313233343536373839404142434445464748495051525354555657585960