Page 1
1
Effect of sauna-based heat acclimation on plasma volume and heart rate variability
Jamie Stanley1,2
, Aaron Halliday3, Shaun D’Auria
4, Martin Buchheit
5, Anthony S. Leicht
3
1Centre of Excellence for Applied Sport Science Research, Queensland Academy of Sport, Brisbane, Australia
2School of Human Movement Studies, University of Queensland, Brisbane, Australia
3College of Healthcare Sciences, James Cook University, Townsville, Australia
4Triathlon Program, Queensland Academy of Sport, Brisbane, Australia
5Sport Science Unit, Myorobie Association, Montvalezan, France
Corresponding author:
Jamie Stanley, School of Human Movement Studies, The University of Queensland, Brisbane, Queensland
4072, Australia; E-mail: [email protected] .
Total word count: 5285 words (excluding abstract, references, tables, figures, acknowledgements, etc)
Abstract word count: 248 words
Number of references: 39
Number of tables: 1
Number of figures: 4
Page 2
2
Abstract
Purpose: We investigated the effect of post-exercise sauna bathing on plasma volume (PV) expansion and
whether such responses can be tracked by changes in heart rate (HR) based measures.
Methods: Seven, well-trained, male cyclists were monitored for 35 consecutive days (17 d baseline training,
10d training plus sauna, 8d training). Sauna exposure consisted of 30 min (87°C, 11% relative humidity)
immediately following normal training. Capillary blood samples were collected to assess PV changes while
resting seated. HR (HRwake) and vagal-related HR variability (natural logarithm of square-root mean squared
differences of successive R−R intervals, ln rMSSDwake) were assessed daily upon waking. A sub-maximal cycle
test (5 min at 125 W) was performed on days 1, 8, 15, 22, 25, 29, and 35 and HR recovery (HRR60s) and ln
rMSSDpostex were assessed post-exercise. Effects were examined using magnitude-based inferences.
Results: Compared with baseline, sauna resulted in: 1) peak PV expansion after 4 exposures with a likely large
increase [+17.8% (90% confidence limits, 7.4;29.2)]; 2) reduction of HRwake by a trivial-to-moderate amount
[−10.2% (−15.9;−4.0)]; 3) trivial-to-small changes for ln rMSSDwake [4.3% (1.9;6.8)] and ln rMSSDpostex [−2.4%
(−9.1;4.9)]; and 4) a likely moderate decrease in HRR60s [−15.6% (−30.9;3.0)]. Correlations between individual
changes in PV and HR measures were all unclear.
Conclusions: Sauna-bathing following normal training largely expanded PV in well-trained cyclists after just 4
exposures. The utility of HR and HRV indices for tracking changes in PV was however uncertain. Future studies
will clarify mechanisms and performance benefits of post-training sauna bathing.
Keywords: heat exposure; blood volume; cardiac parasympathetic activity; post-exercise; cyclists
Page 3
3
Abbreviations
CV
ES
Coefficient of variation
Effect size
Hb Haemoglobin
Hct
HR
HRex
Haematocrit
Heart rate
Heart rate during the 5-min submaximal (125 W) exercise test
HRR Heart rate recovery
HRR60s Heart rate recovery at 60 seconds post-exercise
HRV Heart rate variability
HRwake Heart rate upon waking
ln rMSSDpostex Natural logarithm of the rMSSD following submaximal exercise
ln rMSSDwake Natural logarithm of the rMSSD upon waking
PV Plasma volume
rMSSD Square root mean of the sum of the squared differences between adjacent normal
R−R intervals
SWC Smallest worthwhile change
YoYoIR2 Yo-Yo Intermittent recovery level 2 test
Page 4
4
Introduction
In an increasingly competitive elite sporting environment, identifying methods to extract additional marginal
performance gains from already demanding training schedules is of importance to athletes and coaches.
Recently, supplementing training with heat acclimation has garnered increasing interest (Garrett et al. 2012;
Garrett et al. 2009; Garrett et al. 2011; Lorenzo et al. 2010) primarily because the physiological adaptations
including expansion of blood plasma volume (PV) may contribute to improved myocardial efficiency (Horowitz
et al. 1986b), increased ventricular compliance (Horowitz et al. 1986a), and improved maximal cardiac output
(Lorenzo et al. 2010)—all of which translate into improved physical performance in all (i.e., cool, temperate,
and hot) environmental conditions (Racinais et al. 2014).
Traditionally, heat acclimation has involved exercising in 35−45oC, 10−90% relative humidity for up to 90 min
for 8−22 consecutive days (Garrett et al. 2011). In highly-trained athletes, heat acclimation elicited increased PV
(6.5%; effect size [ES] = 2.0) (Lorenzo et al. 2010), increased maximal aerobic power in cool (4.9%; ES = 1.5)
and hot (8.1%; ES = 2.0) conditions (Lorenzo et al. 2010), increased lactate threshold in cool (5.1%, ES = 0.3)
and hot (2.9%; ES = 0.1) conditions (Lorenzo et al. 2010), improved time-trial performance in cool (6.2%; ES =
1.1) and hot (8.0%; ES = 1.2) conditions (Lorenzo et al. 2010), and increased the distance covered (42%, ES =
2.0) during intermittent exercise performance in hot conditions (Racinais et al. 2014). Similar physiological and
performance adaptations have been demonstrated following shorter durations of heat acclimation. For example,
5 days of exercising in the heat (total heat exposure of 3 h 45 min) induced a 4.5% (ES = 0.8) increase in PV
accompanied with a 1% (ES = 0.3) improvement time-trial performance in highly-trained rowers (Garrett et al.
2012). Similarly, non-heat-acclimatised semi-professional soccer players demonstrated a 5.7% (ES = 1.2)
increase in PV accompanied with a 7% (ES = 0.5) increase in intermittent exercise performance in cool
conditions following 6 days (total heat exposure of 7 h 30 min) of training in the heat (Buchheit et al. 2011).
Heat acclimation is not without limitations. For athletes living in temperate climates, heat
acclimatization/acclimation necessitates traveling to a location with the appropriate conditions for a specific
training block (Buchheit et al. 2011; Racinais et al. 2014), or alternatively training in a climate chamber (Garrett
et al. 2012; Lorenzo et al. 2010). Both options are expensive, unfeasible in certain situations (e.g., training with
the ball in a climate chamber would be impossible for team sport athletes), and may compromise the quality of
training (Garrett et al. 2011). One study has demonstrated that the acute physiological responses to heat were
Page 5
5
augmented when sauna bathing followed exercise (Ridge and Pyke 1986). Therefore, exposure to higher
temperatures such as those experienced during sauna bathing (>50°C) immediately following training may offer
a more efficient means to stimulate ergogenic benefits with minimal disturbance to training. Scoon et al. (2007)
had trained runners bathe in a sauna for ~30-min immediately following training on 12−15 occasions over 3
weeks and demonstrated a 7.1% (ES = 1.3) difference in PV and 1.9% estimated improvement in 5 km time-trial
performance compared with a 3-week period of normal training. The difference in PV and performance were
near perfectly correlated (r = −0.96) (Scoon et al. 2007).
To date however, the time course of sauna-induced changes in PV has not been examined. Heart rate based
measures may provide a simple, non-invasive tool to monitor changes in PV that are expected with sauna
bathing (Buchheit 2014; Stanley et al. 2013b). For example, following traditional heat acclimation
(accompanied with PV expansion), HR during (Buchheit et al. 2011; Garrett et al. 2012; Lorenzo et al. 2010)
sub-maximal exercise is reduced, HR variability (HRV) at rest (Buchheit et al. 2011) and during immediate
post-exercise recovery (Buchheit et al. 2009) is increased, while HR recovery (HRR) is unaffected (Buchheit et
al. 2009; Buchheit et al. 2011). Changes in the aforementioned HR measures also demonstrate moderate-to-very
large correlations with increased PV (Buchheit et al. 2009; Buchheit et al. 2011) and improvements in exercise
performance (Buchheit 2014; Buchheit et al. 2013; Buchheit et al. 2011; Racinais et al. 2014). Most importantly
however, because the magnitude of HR responses after just one day in the heat are similar to those expected
after a month of normal training (Buchheit et al. 2013), changes in HR-based measures during heat acclimation
appear more likely a consequence of expanded PV rather than actual changes in fitness/fatigue. To date, it is not
known how HR-based indexes respond to sauna-based heat acclimation, or which indexes are most sensitive to
the induced physiological adaptations. Therefore, the aim of this study was to 1) investigate the time course of
PV changes during and after a post-training sauna intervention, and 2) determine how and/or which HR-based
measures can be used to monitor these changes.
Methods
Participants
Seven endurance-trained male cyclists participated in this study (age 23.3 4.0 years, height 1.79 0.07 m,
body mass 78.0 6.6 kg, body fat 10.2 1.9%, VO2max 60.4 4.7 mL.kg-1
min-1
, peak HR 193 ± 10 beats.min−1
,
peak power output 427 ± 38 W). All participants had trained consistently for at least 6 months prior to the study,
Page 6
6
were not taking iron supplementation, had not donated blood within 3 months prior to testing and had no prior
history of heat related illnesses. All participants completed questionnaires to confirm their health status and
provided written informed consent in accordance with approval by the Human Research Ethics Committee of
James Cook University.
Experimental Design
An overview of the interrupted time series study design is displayed in Figure 1. The study consisted of pre-
sauna (days 1−17), sauna (days 18−28) and post-sauna (days 29−35) stages. The cyclists’ VO2max, peak HR and
peak power output was determined in the week prior to the pre-sauna period, and during the week following the
completion of the monitoring period (i.e., post day 35) using a graded cycling protocol commencing at an initial
workload of 175 W that increased by 25 W per minute until volitional exhaustion. Expired air was collected via
a one-way mouthpiece (Hans Rudolph Inc, Shawnee, Kansas) and analysed breath-by-breath with 10-s averages
examined for VO2max attainment. Peak HR was the highest HR recorded during the final 10 s of the test. Peak
power output was calculated as the power output from the last completed stage of the incremental exercise test,
plus the fraction of time spent in the next stage multiplied by 25 W. The cyclists bathed in a sauna (80−90°C)
following training on ten consecutive days. For the duration of the study, the cyclists completed their own
training and recorded their training duration and subjective intensity (session RPE) for each training session
(Wallace et al. 2013). The cyclists were instructed to replicate the training performed during days 1−17 during
days 18−35. Each day upon waking, the cyclists adopted a seated position to record HR. The cyclists completed
a submaximal cycling test periodically for the duration of the study and HR was recorded during the acute
recovery period (Figure 1). Capillary blood samples were collected and evaluated for PV changes and sauna
responses (Figure 1).
[Insert Figure 1 here]
Sauna Bathing
Cyclists attended a sauna facility between 5:30 p.m. and 7:00 p.m. immediately after or during the later part (i.e.
warm-down) of daily training sessions for ten consecutive days (Figure 1). The cyclists remained in the sauna
for 30 min in a seated upright position. We opted to standardize the duration of sauna exposure rather than
standardize the relative heat stress to minimize the potential impact on the cyclists’ daily life/training schedule
Page 7
7
and best replicate what can be feasibly implemented in the field. Before, after, and every 5 min during sauna
bathing, tympanic temperature (Welch-Allyn 6021, Braun, Germany), blood pressure (ALP K2 Aneroid, Japan),
thermal comfort (1 = comfortable to 5 = extremely uncomfortable) and sensation (1 = unbearably cold to 13 =
unbearably hot) were measured. Environmental conditions within the sauna were measured using a portable
weather station (Kestral 4000, Boothwyn, Pennsylvania). Dry nude body mass was measured prior to and
following each sauna session with cyclists instructed to drink 150% of fluid difference within 6 h following the
sauna (Shirreffs et al. 2004).
Figure 1 Overview of the study design
Page 8
8
Hydration status and plasma volume assessment
On the morning of the experimental trials, the cyclists collected a urine sample (mid-stream), and entered the
laboratory (in a fasted state) between 5:00 a.m. and 6:30 a.m. The specific gravity of each sample was measured
using a digital refractometer (UG-a Atago, Honcho, Japan). The cyclists were considered hydrated if the urine
specific gravity was ≤1.030 g.mL−1
(Armstrong et al. 1994). Capillary blood samples were collected from
multiple fingers from day-to-day to ensure adequate blood was extracted. The cyclists remained in a seated
position for at least 10 min prior to blood sampling. Each site was cleansed with an alcohol wipe, dried and a
sterile lancet applied. The first drop of blood was discarded with blood collected into duplicate 100 µL
heparinised capillary tubes for haematocrit (Hct) determination and microcuvettes for haemoglobin (Hb)
determination. Samples were collected on days 1, 8, and 15, and days 18−35. Blood samples were analysed for
Hb via a DHT Portable Haemoglobinometer with a reported coefficient of variation of 2.3 0.7% (Sanchis-
Gomar et al. 2013). If there was a difference of >5% in measured Hb between samples, a third blood sample
was collected and analysed. Blood samples for Hct were centrifuged for 5 min at 14000 rpm, and assessed for
Hct by 2 independent reviewers (Morris et al. 1999). Changes in PV (%) were calculated from the following
equation (Strauss et al. 1951):
Where before is the concentration at pre-sauna and after is the concentration during or following the sauna
intervention. All blood analysis was performed immediately onsite.
Sub-maximal Performance Test
On days 1, 8, 15, 22, 25, 29 and 35, following the blood sampling procedures, the cyclists performed a sub-
maximal cycle test (Monark 828E, Varberg, Sweden) at a workload of 125 W and cadence of 100 rpm for 5 min
(Buchheit et al. 2010). Heart rate was recorded during the 5 min of exercise (HRex). Immediately upon
completion, the cyclists dismounted and remained seated for 10 min on a chair located adjacent to the ergometer
for recovery measurements.
Heart Rate Variability
Page 9
9
Upon waking each morning during the study, HR was recorded (Ambit 2, Suunto Oy, Vantaa, Finland) for 7
min in a seated position. R−R interval data files were transferred to a computer and further signal processing
was performed using a dedicated HRV analysis program (Kubios HRV Analysis version 2.0 beta 1, The
Biomedical Signals Analysis Group, University of Kuopio, Finland) (Stanley et al. 2013a). Each file was
visually inspected. Artifacts were manually removed and occasional ectopic beats were automatically replaced
with the interpolated adjacent R–R interval values.
Heart rate and the natural logarithm of the square root mean of the sum of the squared differences between
adjacent normal R−R intervals (ln rMSSD) was calculated from the last 5 min of the 7-min (seated) waking
recordings (HRwake, ln rMSSDwake) and from the last 3 min of the 5 min following the sub-maximal performance
test (HRpostex, ln rMSSDpostex) (Stanley et al. 2013a) to provide an index of cardiac parasympathetic activity
(Task Force of the European Society of Cardiology and the North American Society of Pacing and
Electrophysiology 1996). Analysis was restricted to ln rMSSD due to greater reliability compared with spectral
indices (Al Haddad et al. 2011) during ambulatory trials of variable respiration rate (Penttilä et al. 2001).
Data and Statistical Analysis
All data in the text and figures are presented as mean with the 90% confidence interval (CI) unless otherwise
stated. The practical significance of data was assessed via magnitude-based inferences (Hopkins et al. 2009). A
qualitative approach was selected as traditional statistical approaches generally fail to indicate the magnitude of
an effect, which is more relevant to athletic performance (Hopkins 2010). All data were log-transformed before
analysis to reduce bias arising from non-uniformity in error (Hopkins et al. 2009).
Because of the interrupted time series study design, comparisons were made between the mean response of each
variable during the pre-sauna period (days 1−18) and the response during each day after sauna treatment
commenced (days 19−35) using a modified statistical spreadsheet (Hopkins 2006). Comparisons for
physiological responses were not made for a particular day if data for >3 athletes were lost/excluded due to
equipment malfunction and/or the presence of artefacts. The spreadsheets calculate the within-trial standardized
differences or effect sizes (ES, 90% CI) using the pooled standard deviation (Cohen 1988). The following
threshold values for ES were employed: <0.2 as trivial, >0.2 as small, >0.6 as moderate, >1.2 as large, >2.0 as
very large, and >4.0 as extremely large (Hopkins et al. 2009). Additionally, we calculated the probabilities of
Page 10
10
whether the true (unknown) differences were lower, similar or higher than the smallest worthwhile change or
difference. The smallest worthwhile change/difference for all variables was calculated from the day-to-day
variation during the pre-sauna period (e.g. days 1−18) expressed as the coefficient of variation (CV) (Hopkins
2000). The natural daily variation during the pre-sauna period expressed as the CV (90% CI) was 64.8% (50.9;
92.4) for training duration, 37.6% (30.2; 51.5) for training intensity, 102.0% (78.8; 149.9) for training load,
5.5% (4.1; 9.4) for PV, 8.6% (7.5; 10.2) for HRwake, 6.6% (5.8; 7.8) for ln rMSSDwake, 14.1% (10.3; 24.7) for
HRR60s, 11.0% (8.1; 19.2) for HRpostex, and 8.7% (6.4; 15.0) for ln rMSSDpostex. Pre-sauna characteristics were
included as a covariate for within-trial analysis of training duration, rating and load. Age was included as a
covariate for HRV responses due to its reported effect on baseline and training-induced HRV responses
(Sandercock et al. 2005). The qualitative chances of either higher or lower difference were evaluated as follows:
1%, almost certainly not; 1–5%, very unlikely; 5–25%, unlikely; 25–75%, possible; 75–95%, likely; 95–99%,
very likely; >99%, almost certain. If the chances of a substantially higher or lower difference were both >5 %,
the true difference was assessed as ‘unclear’ (Hopkins et al. 2009). Pearson’s product moment correlation
analysis examined the association between individual percentage changes in PV and HR based variables. The
following criteria were adopted to interpret the magnitude of the correlation (r) between these measures: <0.1 as
trivial; 0.1–0.3 as small; >0.3–0.5 as moderate; >0.5–0.7 as large; >0.7–0.9 as very large; and >0.9–1.0 as
almost perfect (Hopkins et al., 2009). If the 90 % CI overlapped small positive and negative values, the
magnitude of the correlation was deemed ‘unclear’; otherwise, the magnitude of the correlation was deemed to
be the observed magnitude (Hopkins et al., 2009).
Results
Approximately 0−13% of data (i.e. HR, HRV, PV, etc.) were lost/excluded from analysis due to equipment
malfunction and/or the presence of artefacts. These events were random in occurrence and unlikely biased any
statistical analysis. However, comparisons for HRwake and ln rMSSDwake on days 19 and 26 were excluded from
analysis because data for >3 athletes were lost/excluded due to equipment malfunction and/or the presence of
artefacts. All athletes presented to the laboratory in a hydrated state as indicated by a mean urine specific gravity
(SD) of 1.019 (0.007) g.mL−1
.
During the pre-sauna period, mean ± SD values were 74 ± 11 min training duration, 6 ± 1 for training intensity,
446 ± 82 arbitrary units for training load, 94.9 ± 8.1% of day 1 value for PV, 59 ± 6 beats.min−1
for HRwake, 4.1
Page 11
11
± 0.4 ms for ln rMSSDwake, 79 ± 15 beats for HRR60s, 69 ± 10 beats.min−1
for HRpostex, and 3.6 ± 0.3 ms for ln
rMSSDpostex.
Each sauna exposure was perceived as hot and very uncomfortable, and was accompanied by an increase in
tympanic temperature and loss of weight due to sweat loss (Table 1).
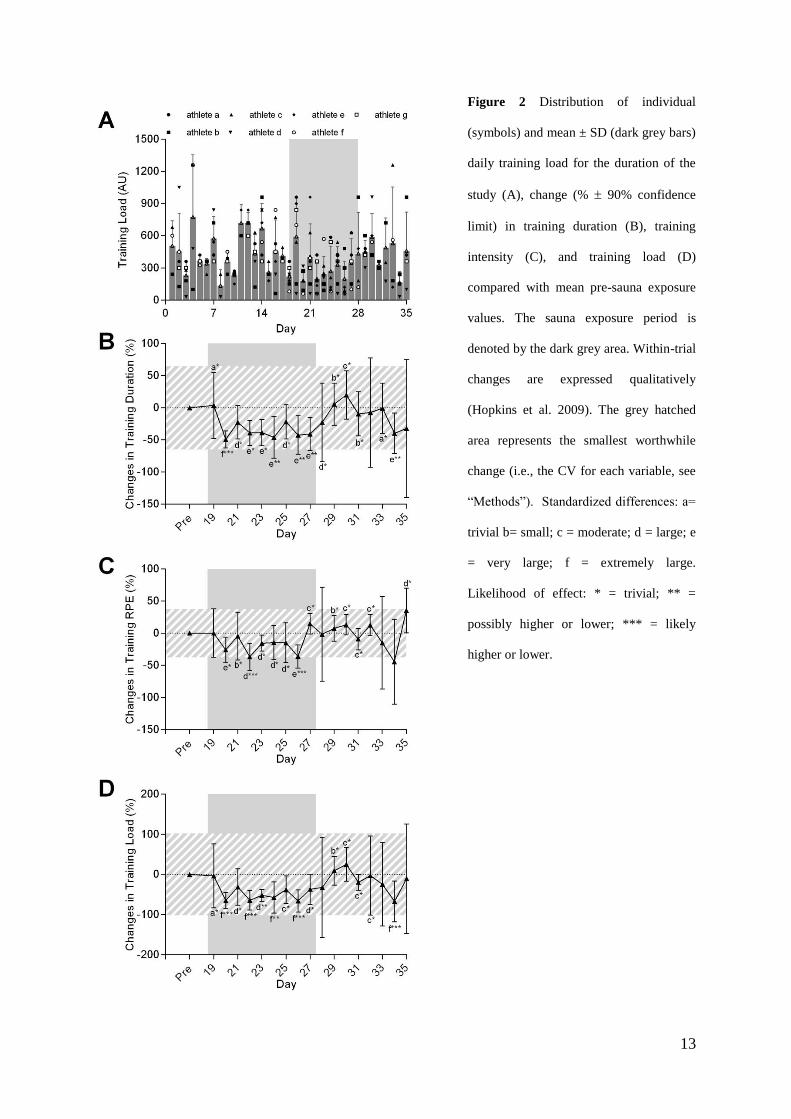
Individual and mean training load distribution for the entire study is presented in Figure 2a. Prior to and
following the sauna period, daily training loads were similar, however, training duration and intensity was
substantially reduced during the sauna period (Figure 2b, c, d).
Post-exercise sauna bathing very likely increased PV (+17.8% 90% CL (7.4; 29.2), ES=+1.7 90% CL (0.7; 2.6),
% chances for greater/similar/lower values of 97/3/0%) after just 4 days of sauna bathing (Figure 3a). An initial
moderate increase in HRwake (+8.3% (−0.8; 18.2), ES=+0.6 (−0.1; 1.3), 48/52/0%) was observed after day 2 of
sauna treatment, thereafter trivial-to-moderate reductions in HRwake were observed peaking after 6 days of sauna
bathing (−10.2% (−4.0; −15.9), ES=−0.8 (−1.3;−0.3), 0/24/76% , Fig 3b). Trivial-to-small increases in ln
rMSSDwake were observed after day 3 of sauna treatment (Fig 3c).
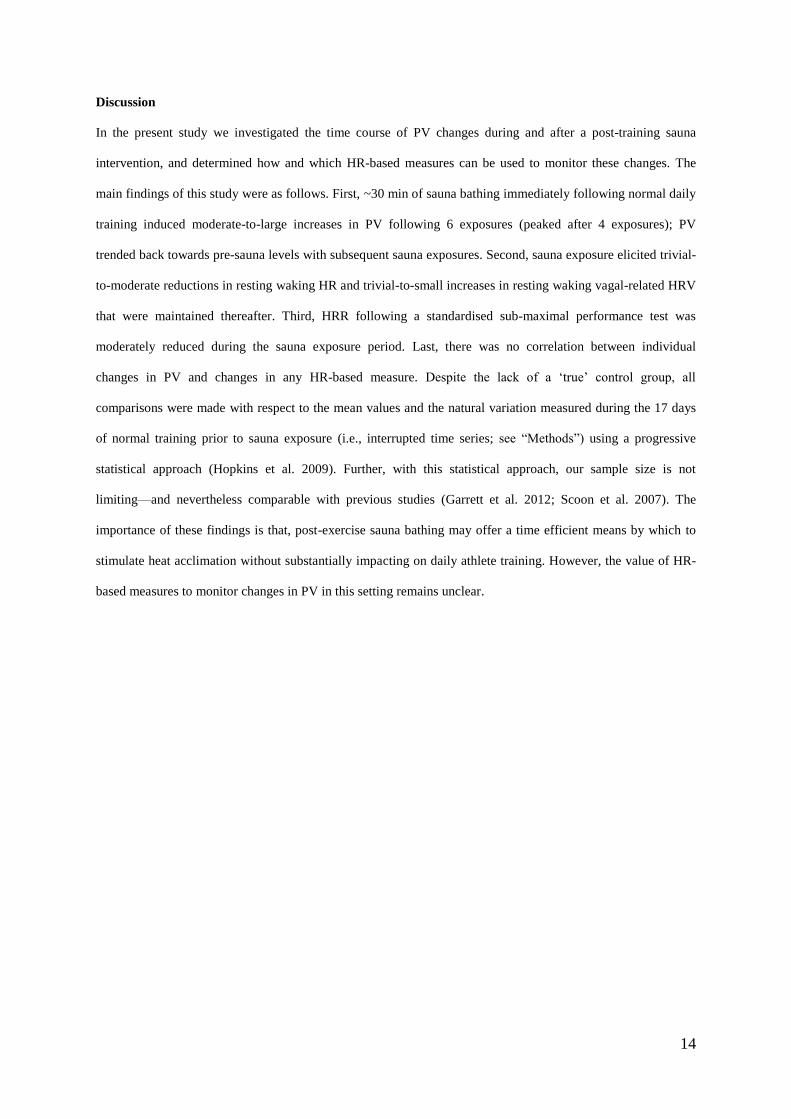
Compared with pre-sauna values, changes in HRex remained trivial or unclear until the 7th
day following sauna
treatment after which a likely moderate increase was observed (+5.5% (2.8; 8.3), ES=0.7 (0.3; 1.0), 90/10/0%,
Fig 4a). HRR60s and ln rMSSDpostex demonstrated likely moderate reductions and trivial-to-small reductions,
respectively, after commencement of sauna treatment compared with pre-sauna values (Fig 4b, c). There were
no clear changes in peak HR (–0.1% (–1.7; 1.4), ES =–0.2 (–0.27; 0.23), 7/82/11%) or peak power output (0.4%
(–2.1; 3.0), ES =0.04 (–0.21; 0.29), 34/50/16%) from the beginning to the end of the study.
Correlations between individual changes in PV and individual changes in HRwake [r = −0.01 (−0.17; 0.15), n =
103], ln rMSSDwake [r = 0.04 (−0.13; 0.20), n = 103], HRR60s [r = 0.09 (−0.23; 0.40), n = 28], HRpostex [r = 0.05
(−0.30; 0.38), n = 25], or ln rMSSDpostex [r = −0.10 (−0.42; 0.25), n = 25] were all unclear. Large correlations
were observed between individual changes in HRwake and individual changes in ln rMSSDwake [r = −0.66 (90%
CI −0.75; −0.56), n = 103] and individual changes in HRpostex and individual changes in ln rMSSDpostex [r =
−0.68 (−0.83; −0.45), n = 25]. There were no clear correlations observed between individual changes in HRR60s
Page 12
12
and individual changes in HRpostex [r = 0.32 (−0.02; 0.59), n = 25] or individual changes in ln rMSSDpostex [r =
0.02 (−0.32; 0.36), n = 25].
Table 1 Participant and environmental characteristics prior to (Pre-Sauna), during (Sauna) and following (Post-
sauna) the sauna bathing period.
Pre-Sauna Sauna Post-Sauna
Sauna temperature (°C)
Sauna humidity (%)
Tympanic temperature (°C)
Thermal sensation
Thermal comfort
Sweat rate/loss (kg∙hr-1
)
87.0 13.7
10.7 12.6
39.2 1.1
10.6 1.0
3.9 0.5
1.6 0.8
Outside environment:
Maximum temperature (°C)
Minimum temperature (°C)
Humidity (%)
27.7 1.4
15.4 2.2
58.0 10.9
27.7 0.6
16.8 1.8
51.7 7.0
29.4 1.3
18.1 2.0
56.3 10.6
Values are mean SD.
Page 13
13
Figure 2 Distribution of individual
(symbols) and mean ± SD (dark grey bars)
daily training load for the duration of the
study (A), change (% 90% confidence
limit) in training duration (B), training
intensity (C), and training load (D)
compared with mean pre-sauna exposure
values. The sauna exposure period is
denoted by the dark grey area. Within-trial
changes are expressed qualitatively
(Hopkins et al. 2009). The grey hatched
area represents the smallest worthwhile
change (i.e., the CV for each variable, see
“Methods”). Standardized differences: a=
trivial b= small; c = moderate; d = large; e
= very large; f = extremely large.
Likelihood of effect: * = trivial; ** =
possibly higher or lower; *** = likely
higher or lower.
Page 14
14
Discussion
In the present study we investigated the time course of PV changes during and after a post-training sauna
intervention, and determined how and which HR-based measures can be used to monitor these changes. The
main findings of this study were as follows. First, ~30 min of sauna bathing immediately following normal daily
training induced moderate-to-large increases in PV following 6 exposures (peaked after 4 exposures); PV
trended back towards pre-sauna levels with subsequent sauna exposures. Second, sauna exposure elicited trivial-
to-moderate reductions in resting waking HR and trivial-to-small increases in resting waking vagal-related HRV
that were maintained thereafter. Third, HRR following a standardised sub-maximal performance test was
moderately reduced during the sauna exposure period. Last, there was no correlation between individual
changes in PV and changes in any HR-based measure. Despite the lack of a ‘true’ control group, all
comparisons were made with respect to the mean values and the natural variation measured during the 17 days
of normal training prior to sauna exposure (i.e., interrupted time series; see “Methods”) using a progressive
statistical approach (Hopkins et al. 2009). Further, with this statistical approach, our sample size is not
limiting—and nevertheless comparable with previous studies (Garrett et al. 2012; Scoon et al. 2007). The
importance of these findings is that, post-exercise sauna bathing may offer a time efficient means by which to
stimulate heat acclimation without substantially impacting on daily athlete training. However, the value of HR-
based measures to monitor changes in PV in this setting remains unclear.
Page 15
15
Figure 3 Change (% 90% confidence
limit) in plasma volume (PV, A), seated
waking heart rate (HRwake, B) and seated
waking ln rMSSD (ln rMSSDwake, C)
compared with mean pre-sauna exposure
values. Comparisons for HRwake and ln
rMSSDwake were excluded from analysis
on days 19 and 26 because data for >3
athletes were lost/excluded due to
equipment malfunction and/or the
presence of artefacts. The sauna exposure
period is denoted by the dark grey area.
Within-trial changes are expressed
qualitatively (Hopkins et al. 2009). The
grey hatched area represents the smallest
worthwhile change (i.e., the CV for each
variable, see “Methods”). Standardized
differences: a= trivial b= small; c =
moderate; d = large. Likelihood of effect:
* = trivial; ** = possibly higher or lower;
*** = likely higher or lower; ****=very
likely higher or lower.
Page 16
16
Figure 4 Mean change (% 90%
confidence limit) compared with mean
pre-sauna exposure values in heart rate
during a 5-min submaximal cycle test
(HRex, A) heart rate recovery 60 s after a
5-min submaximal cycle test (HRR60s,
B), mean heart rate during seated
recovery after a 5-min submaximal cycle
test (HRpostex, C), and ln rMSSD after a
5-min submaximal cycle test (ln
rMSSDpostex, D). The sauna exposure
period is denoted by the dark grey area.
Within-trial changes are expressed
qualitatively (Hopkins et al. 2009). The
grey hatched area represents the smallest
worthwhile change (i.e., the CV for each
variable, see “Methods”). Standardized
differences: a= trivial b= small; c =
moderate. Likelihood of effect: * =
trivial; **= possibly higher or lower; ***
= likely higher or lower.
Page 17
17
The present study is the first to examine the time course of sauna-induced changes in PV during and following a
period of post-training sauna bathing. We observed that the addition of 30 min of sauna exposure following
normal daily training elicited physiological adaptations representative of heat acclimation. Plasma volume was
largely increased (+17.8%, ES = 1.7) within the first 4 days of sauna exposure (~4.5% per day) compared with
the mean values during 18 days of normal training pre-sauna exposure (Fig. 3a). By comparison, PV expansion
following post-exercise sauna exposure (~12 exposures over 3 weeks) was large (+7.1%, ES = 1.3) or ~0.5% per
day in well-trained runners (Scoon et al. 2007), and PV expansion following traditional heat acclimation was
large (+5.7% , ES = 1.2) or ~1.3% per day in semi-professional soccer players following 6 days of training in
the heat (Buchheit et al. 2011), moderate (+8%, ES = 0.6) or ~1.1% per day in sub-elite cyclists following 7
days of exercising in the heat (Patterson et al. 2004), or moderate (+4.5%, ES = 0.8) or ~0.9% per day in highly-
trained rowers following 5 days of exercise in the heat (Garrett et al. 2012). Importantly, the changes in PV
reported in these latter studies were not assessed daily, therefore whether greater values were reached during the
interventions as in the present study remains unclear. Together, these data suggest that post-exercise sauna
exposure is an equally effective and more efficient means by which to initiate PV expansion compared with
traditional heat acclimation that involves training in hot conditions (Buchheit et al. 2011; Garrett et al. 2012;
Garrett et al. 2009; Lorenzo et al. 2010; Patterson et al. 2004). Further, the passive nature of sauna exposure
may be more beneficial for athletes because normal training, intensive training and/or specific taper sessions
near to competition need not be altered (Garrett et al. 2011). Interestingly, by the 7th
sauna exposure, PV trended
back towards pre-sauna levels (unclear whether values were elevated) despite subsequent sauna exposure and
remained stable for the 7 days (possible-to-likely small-to-moderate elevation above pre-sauna levels) after the
final sauna exposure (Fig. 3a), supporting the observation that PV expansion regresses toward baseline levels if
the exercise stimulus and/or thermal load exposures remain constant (Wyndham et al. 1968). Although evidence
linking PV expansion and exercise performance is not definitive (Warburton et al. 2000), the transient nature of
this response highlights that periodization of sauna exposure/heat acclimation within the training/competition
cycle requires consideration if intended for ergogenic benefit.
Acute increases in PV have been accompanied by reduced HR during sub-maximal exercise (Buchheit et al.
2011; Garrett et al. 2012; Lorenzo et al. 2010; Racinais et al. 2014), increased HRV at rest (Buchheit et al. 2011)
and during immediate post-exercise recovery (Buchheit et al. 2009), but not HRR (Buchheit et al. 2009;
Buchheit et al. 2011). Notably, changes in HR-based measures during heat acclimation appear more likely a
Page 18
18
consequence of expanded PV rather than changes in fitness/fatigue (Buchheit et al. 2013). Baroreflex mediated
increases in cardiac parasympathetic activity (i.e., vagal-related indexes of HRV) reaches its maximal level
during moderate hypervolemia but decreases with severe hypervolemia (Saitoh et al. 2008). Therefore, the
trivial-to-small magnitude increases in ln rMSSDwake we observed after the third sauna exposure (Fig. 3c) were
not surprising provided the moderate-to-large (but not very large) increase in PV (Fig. 3a). Further, the likely
moderate-to-very large reduction in training load (Fig. 2) during the sauna exposure period suggests that PV
expansion was probably the most likely contributor to the increase in ln rMSSDwake as a reduction in training
load typically reduces cardiac parasympathetic activity (Buchheit 2014; Plews et al. 2013). Therefore, if training
load was maintained at a level similar to that of the pre-sauna exposure period (Fig. 2), ln rMSSDwake would
likely have been higher. Whether the self-regulated reduction in training load reflects an anticipatory mechanism
or was a consequence of the added stress induced by sauna exposure, or was simply due to the extra time
required for sauna bathing remains unclear. This observation nevertheless has important practical application,
because any prolonged reduction in training load may impact on actual performance. Therefore to maximize
ergogenic benefit, careful management of training load is required if sauna exposure/heat acclimation is to be
integrated within the training/competition cycle.
Unfortunately, due to the large time commitment of the cyclists to participate in this study (maximal) cycling
performance was not tested periodically throughout the monitoring period. However, the athletes did complete a
second maximal test in the week following the monitoring period. No clear change in peak HR or peak power
output was observed. Due to technical difficulties with gas analysis equipment we have not reported these data.
Nevertheless, the cyclists performed a 5-min sub-maximal cycling test at a standardised power output
periodically throughout the study (Lamberts et al. 2011). Heart rate during the exercise tests performed during
the sauna exposure period was similar to values recorded during the pre-sauna exposure period—except on the
final day when it was moderately elevated (Fig. 4a). The reduction in training load during the sauna exposure
period possibly resulted in a reduction of the cyclists’ fitness, and in turn, increased the relative exercise
intensity during 5-min sub-maximal cycling test. Immediately following the 5-min sub-maximal cycling test,
HRR60s was likely moderately reduced during and the day following the sauna exposure period (Fig. 4b). The
reduction in HRR60s was likely not related to changes in PV (Buchheit et al. 2009; Buchheit et al. 2011), but
rather due to the relative reduction in training load during the sauna exposure period (Borresen and Lambert
2007). The reasons for the lack of substantial change in HRpostex and ln rMSSDpostex (Fig. 4c and d) remain
Page 19
19
unclear, but might be linked to the fact that these indexes integrate multiple factors such as exercise intensity
(Stanley et al. 2013b) and PV (Buchheit et al. 2009); therefore if one decreases while the other increases, the net
response is unchanged.
A key aim of this study was to examine the utility of non-invasive HR-based measures for monitoring changes
in PV. Changes in PV affect baroreflex mediated changes in cardiac parasympathetic activity (Saitoh et al.
2008) and have been largely [r = 0.85 (0.53; 0.96)] associated with acute changes in cardiac parasympathetic
reactivation (Buchheit et al. 2009). Surprisingly, we observed no clear correlations between individual changes
in PV and any HR-based index. It is possible that exercise and/or heat modified the set point of baroreceptor
activation (Buchheit et al. 2009; Stanley et al. 2013b). Although not a main objective of this study, our data
suggest that HR-based measures provide similar information because respective correlations between individual
changes in HRwake and individual changes in ln rMSSDwake, and individual changes in HRpostex and individual
changes in ln rMSSDpostex were large [r = −0.66 (−0.75; −0.56) and r = −0.68 (−0.83; −0.45)]. Conversely, the
lack of clear correlations between individual changes in HRR60s and individual changes in HRpostex [r = 0.32
(−0.02; 0.59)] or individual changes in ln rMSSDpostex [r = 0.02 (−0.32; 0.36)] suggests that these indices capture
different information (Buchheit et al. 2007) concerning cardiovascular control.
The current study is not without some limitations. First, changes in PV were estimated via changes in Hct and
Hb concentrations. This method assumes the erythrocytes remain within the circulation and accurately reflects
small to moderate changes (<10%) in PV although underestimates large changes in PV by 25−30% (Lundvall
and Lindgren 1998). Nevertheless, we demonstrated a coefficient of variation of 5.5% in PV measurement prior
to sauna exposure and are confident that our statistical analysis provides a clear and practical indication of the
sauna induced changes. Second, although the cyclists were instructed to replicate the training performed during
days 1−17 during days 18−35, the training load was reduced during the sauna exposure period (Fig. 2). This
self-regulated reduction in training load possibly reflects an anticipatory mechanism or was a consequence of
the added stress induced by sauna exposure. Interestingly, the reduction in training volume was of comparable
duration to the time required for sauna treatment. The substantial drop in training load (from day 20; Fig. 2d)
upon commencing the sauna exposure period would be expected to cause a drop in PV over a few days that
could be masked by the rapid initial increase in PV (e.g., days 19−24; Fig. 3a) that is known to occur with
constant stress heat acclimation protocols. The effect of the sauna intervention on PV was unclear after the
Page 20
20
fourth exposure for reasons that could reflect the preceding reduction in training load now becoming evident
against the background of the sauna intervention. Because the reductions in training load occurred after the
initial clear increase in PV, we are confident changes in PV were primarily due to sauna exposure. Third, while
the interrupted time series design we adopted may not be as strong as a crossover/parallel group design, we
made comparisons with respect to the smallest worthwhile change, increasing the certainty of practical findings.
Finally, the cyclists lived in a tropical environment and naturally exposed to high daily temperatures (Table 1)
outside of the sauna, possibly exhibiting a greater thermal tolerance compared with others living in a cooler
natural environment (Garrett et al. 2012; Garrett et al. 2009; Scoon et al. 2007). Therefore, it is possible that the
physiological acclimation responses we observed may have been greater if the athletes were not moderately heat
acclimatized. Nevertheless, the cyclists identified the sauna conditions as very uncomfortable and very hot, but
tolerable.
Conclusions
The present study has demonstrated that sauna-bathing following normal training induced likely moderate-to-
large PV expansion in well-trained cyclists after just 4 exposures. The importance of these findings is that, post-
exercise sauna bathing may offer a time efficient means by which stimulate heat acclimation without
substantially impacting on daily athlete training. However, consideration is required if such intervention is
associated with a prolonged reduction in training load which may impact on actual performance. The value of
HR-based measures to monitor changes in PV in this setting remains unclear. Further studies identifying the
optimal protocol (i.e., repeating 3 days sauna, 1 day off) and associated training load management for
maximising the potential benefits of sauna bathing for performance are also warranted.
Acknowledgments
The authors would like to thank the participants for their substantial commitment and assistance with the study.
This study was funded by the Centre of Excellence for Applied Sport Science Research at the Queensland
Academy of Sport.
Ethical standards
The current experiment was conducted in Australia with all activities complying with the current laws of
Australia
Page 21
21
Conflict of Interest
Aaron Halliday was supported by a scholarship from the Centre of Excellence for Applied Sport Science
Research at Queensland Academy of Sport. Dr Jamie Stanley is supported by research grant funding from the
Centre of Excellence for Applied Sport Science Research at Queensland Academy of Sport. The remaining
authors declare that they have no conflict of interest.
Page 22
22
References
Al Haddad H, Laursen PB, Chollet D, Ahmaidi S, Buchheit M (2011) Reliability of resting and postexercise
heart rate measures. Int J Sports Med 32: 598-605
Armstrong LE, Maresh CM, Castellani JW, Bergeron MF, Kenefick RW, LaGasse KE, Riebe D (1994) Urinary
indices of hydration status. Int J Sport Nutr 4: 265-279
Borresen J, Lambert M (2007) Changes in heart rate recovery in response to acute changes in training load. Eur
J Appl Physiol 101: 503-511
Buchheit M (2014) Monitoring training status with HR measures: do all roads lead to Rome? Frontiers in
Physiology 5
Buchheit M, Chivot A, Parouty J, Mercier D, Al Haddad H, Laursen P, Ahmaidi S (2010) Monitoring endurance
running performance using cardiac parasympathetic function. Eur J Appl Physiol 108: 1153-1167
Buchheit M, Laursen P, Al Haddad H, Ahmaidi S (2009) Exercise-induced plasma volume expansion and post-
exercise parasympathetic reactivation. Eur J Appl Physiol 105: 471-481
Buchheit M, Papelier Y, Laursen PB, Ahmaidi S (2007) Noninvasive assessment of cardiac parasympathetic
function: postexercise heart rate recovery or heart rate variability? Am J Physiol Heart Circ Physiol 293: H8-10
Buchheit M, Racinais S, Bilsborough JC, Bourdon PC, Voss SC, Hocking J, Cordy J, Mendez-Villanueva A,
Coutts AJ (2013) Monitoring fitness, fatigue and running performance during a pre-season training camp in elite
football players. J Sci Med Sport 16: 550-555
Buchheit M, Voss SC, Nybo L, Mohr M, Racinais S (2011) Physiological and performance adaptations to an in-
season soccer camp in the heat: Associations with heart rate and heart rate variability. Scand J Med Sci Sports
21: e477-e485
Cohen J (1988) Statistical power analysis for the behavioral sciencies. Routledge, London, United Kingdom
Garrett A, Creasy R, Rehrer N, Patterson M, Cotter J (2012) Effectiveness of short-term heat acclimation for
highly trained athletes. Eur J Appl Physiol 112: 1827-1837
Garrett A, Goosens N, Rehrer N, Patterson M, Cotter J (2009) Induction and decay of short-term heat
acclimation. Eur J Appl Physiol 107: 659-670
Garrett A, Rehrer N, Patterson M (2011) Induction and decay of short-term heat acclimation in moderately and
highly trained athletes. Sports Med 41: 757-771
Hopkins W (2000) Measures of Reliability in Sports Medicine and Science. Sports Med 30: 1-15
Hopkins W (2006) Spreadsheets for analysis of controlled trials, with adjustment for a subject characteristic.
Sportscience 10: 46-50
Hopkins W, Marshall S, Batterham A, Hanin J (2009) Progressive statistics for studies in sports medicine and
exercise science. Med Sci Sports Exerc 41: 3-13
Hopkins WG (2010) Linear models and effect magnitudes for research, clinical and practical applications.
Sportscience 14: 49-57 (sportsci.org/2010/wghlinmod.htm)
Horowitz M, Peyser Y, Muhlrad A (1986a) Alterations in cardiac myosin isoenzymes distribution as an
adaptation to chronic environmental heat stress in the rat. J Mol Cell Cardiol 18: 511-515
Horowitz M, Shimoni Y, Parnes S, Gotsman M, Hasin Y (1986b) Heat acclimation: cardiac performance of
isolated rat heart. J Appl Physiol 60: 9-13
Page 23
23
Lamberts RP, Swart J, Noakes TD, Lambert MI (2011) A novel submaximal cycle test to monitor fatigue and
predict cycling performance. Br J Sports Med 45: 797-804
Lorenzo S, Halliwill J, Sawka M, Minson C (2010) Heat acclimation improves exercise performance. J Appl
Physiol 109: 1140-1147
Lundvall J, Lindgren P (1998) F-cell shift and protein loss strongly affect validity of PV reductions indicated by
Hb/Hct and plasma proteins. J Appl Physiol 84: 822-829
Morris S, Ruel M, Cohen R, Dewey K, de la Brière B, Hassan M (1999) Precision, accuracy, and reliability of
hemoglobin assessment with use of capillary blood. Am J Clin Nutr 69: 1243-1248
Patterson M, Stocks J, Taylor N (2004) Sustained and generalized extracellular fluid expansion following heat
acclimation. J Physiol 559: 327-334
Penttilä J, Helminen A, Jartti T, Kuusela T, Huikuri H, Tulppo M, Coffeng R, H. S (2001) Time domain,
geometrical and frequency domain analysis of cardiac vagal outflow: effects of various respiratory patterns. Clin
Physiol 21: 365-376
Plews DJ, Laursen PB, Stanley J, Kilding AE, Buchheit M (2013) Training Adaptation and Heart Rate
Variability in Elite Endurance Athletes: Opening the Door to Effective Monitoring. Sports Med 43: 773-781
Racinais S, Buchheit M, Bilsborough J, Bourdon P, Cordy J, Coutts A (2014) Physiological and Performance
Responses to a Training-Camp in the Heat in Professional Australian Football Players. Int J Sport Physiol
Perform 9: 598-603
Ridge B, Pyke F (1986) Physiological responses to combinations of exercise and sauna. Aust J Sci Med Sport
18: 25-28
Saitoh T, Ogawa Y, Aoki K, Shibata S, Otsubo A, Kato J, Iwasaki K-i (2008) Bell-shaped relationship between
central blood volume and spontaneous baroreflex function. Auton Neurosci 143: 46-52
Sanchis-Gomar F, Cortell-Ballester J, Pareja-Galeano H, Banfi G, Lippi G (2013) Hemoglobin Point-of-Care
Testing: The HemoCue System. Journal of Laboratory Automation 18: 198-205
Sandercock G, Bromley P, Brodie D (2005) Effects of exercise on heart rate variability: inferences from meta-
analysis. Med Sci Sports Exerc 37: 433-439
Scoon GS, Hopkins W, Mayhew S, Cotter JD (2007) Effect of post-exercise sauna bathing on the endurance
performance of competitive male runners. J Sci Med Sport 10: 259-262
Shirreffs S, Armstrong L, Cheuvront S (2004) Fluid and electrolyte needs for preparation and recovery from
training and competition. J Sports Sci 22: 57-63
Stanley J, Peake J, Buchheit M (2013a) Consecutive days of cold water immersion: effects on cycling
performance and heart rate variability. Eur J Appl Physiol 113: 371-384
Stanley J, Peake JM, Buchheit M (2013b) Cardiac Parasympathetic Reactivation Following Exercise:
Implications for Training Prescription. Sports Med 43: 1259-1277
Strauss M, Davis R, Rosenbaum J, Rossmeisl E (1951) “Water diuresis” produced during recumbency by the
intravenous infusion of isotonic saline solution. J Clin Invest 30: 862-868
Task Force of the European Society of Cardiology and the North American Society of Pacing and
Electrophysiology (1996) Heart Rate Variability: Standards of Measurement, Physiological Interpretation, and
Clinical Use. Eur Heart J 93: 1043-1065
Wallace L, Slattery K, Coutts A (2013) A comparison of methods for quantifying training load: relationships
between modelled and actual training responses. Eur J Appl Physiol: 1-10
Page 24
24
Warburton D, Gledhill N, Quinney H (2000) Blood Volume, Aerobic Power, and Endurance Performance:
Potential Ergogenic Effect of Volume Loading. Clin J Sport Med 10: 59-66
Wyndham CH, Benade AJ, Williams CG, Strydom NB, Goldin A, Heyns AJ (1968) Changes in central
circulation and body fluid spaces during acclimatization to heat. J Appl Physiol 25: 586-593