Page 1
EFFECT OF STRATEGIC MANAGEMENT ACCOUNTING
TECHNIQUES ON INVESTMENT DECISIONS AMONG
MANUFACTURING FIRMS IN KENYA
ESTHER VIVIAN ADUVAGA
A RESEARCH PROJECT PRESENTED IN PARTIAL FULFILLMENT
OF THE REQUIREMENTS FOR THE AWARD OF THE DEGREE OF
MASTERS OF SCIENCE FINANCE, SCHOOL OF BUSINESS,
UNIVERSITY OF NAIROBI
November 2020
Page 2
ii
DECLARATION
I declare that this research proposal is my original work and has never been presented to any
other University for assessment or award of degree.
Signed …… … Date……7TH OCT 2020…
ESTHER VIVIAN ADUVAGA
(D63/10036/2018)
This research proposal has been submitted with my approval as the University Supervisor.
Signature………………………………… Date……………………………
Dr. Kennedy Okiro,
Senior Lecturer, Department of Finance and Accounting,
School of Business, University of Nairobi
This research proposal has been submitted with my approval as the University Moderator.
Signature… Date……7TH OCT 2020…
Dr. Morris Irungu
Lecturer, Department of Finance and Accounting
School of Business, University of Nairobi
This research proposal has been submitted with my approval as the Chairman.
Signature………………………………… Date……………………………
Prof. Cyrus Iraya,
Senior Lecturer, Department of Finance and Accounting,
School of Business, University of Nairobi
Page 3
iii
ACKNOWLEDGEMENTS
I am grateful to God for according me the strength, chance and good health to take part in
this course. Without his grace, this research would not have been a success. This research
was made possible with the support and guidance of my Supervisors Dr. Okiro Kennedy and
my moderator Dr. Irungu Morris. My regards to the entire fraternity at the University of
Nairobi more so my lecturers who showed me the way and guided me until the completion of
my studies. My regards also to the management level of various Manufacturing companies
that participated in providing information as and when requested. To my employer and
colleagues for the unconditional support. I am also extremely grateful; to my family
members who provided the financial resources, love, the encouragement, the patience and
kindness they have offered to me during this journey.
Page 4
iv
DEDICATION
I dedicate this project to my family as they have been instrumental in holding my hand through
this journey and have kept me inspired with positive energy. To my Dad Evans, my mum Anne,
my siblings, Brian, Val and Angie and to my personal friend Eddie who walked this journey
with me.
Page 5
v
TABLE OF CONTENTS
DECLARATION ............................................................................................... ii
ACKNOWLEDGEMENTS ............................................................................. iii
DEDICATION .................................................................................................. iv
TABLE OF CONTENTS ................................................................................... v
LIST OF TABLES .......................................................................................... viii
LIST OF FIGURES .......................................................................................... ix
ABBREVIATIONS ............................................................................................. x
ABSTRACT ....................................................................................................... xi
CHAPTER ONE: INTRODUCTION ............................................................... 1
1.1 Background of the Study .................................................................................................... 1
1.1.1 Strategic Management Accounting Techniques ....................................................... 2
1.1.2 Investment Decisions ................................................................................................ 3
1.1.3 Strategic Management Accounting Techniques and Investment Decisions ............. 4
1.1.4 Manufacturing Sector in Kenya ................................................................................ 4
1.2 Research Problem ............................................................................................................... 5
1.3 Research Objective ............................................................................................................. 6
1.4 Value of the Study .............................................................................................................. 7
CHAPTER TWO: LITERATURE REVIEW ................................................. 8
2.1 Introduction ....................................................................................................................... 8
2.2 Theoretical Review............................................................................................................ 8
2.2.1 Theory of Constraints ............................................................................................... 8
2.2.2 The Performance Feedback Theory .......................................................................... 9
2.2.3 Contingency Theory of Management Accounting ................................................. 10
2.3 Determinants of Investment Decisions in Manufacturing Firms ............................... 11
2.3.1 Strategic Management Accounting Techniques ..................................................... 11
2.3.2 Macroeconomic Factors ......................................................................................... 12
2.3.2 Personal Factors ...................................................................................................... 12
Page 6
vi
2.3.3 Firm factors............................................................................................................. 13
2.4 Empirical Studies .............................................................................................................. 13
2.5 Conceptual Framework ..................................................................................................... 16
2.6 Summary and Research Gap of Literature Review ........................................................... 17
CHAPTER THREE: RESEARCH METHODOLOGY ............................... 18
3.1 Introduction ....................................................................................................................... 18
3.2 Research Design................................................................................................................ 18
3.3 Population ......................................................................................................................... 18
3.5 Data Collection ................................................................................................................. 19
3.6 Data Analysis .................................................................................................................... 20
3.6.1 Reliability and Validity of the Instrument .............................................................. 20
3.6.2 Analytical Model .................................................................................................... 21
3.6.3 Significance Tests ................................................................................................... 22
CHAPTER FOUR: DATA ANALYSIS OF INTERPRETATION ............. 23
4.1 Introduction ....................................................................................................................... 23
4.2 Response Rate ................................................................................................................... 23
4.3 Multicollinearity ............................................................................................................... 23
4.4 Normality .......................................................................................................................... 23
4.5 Respondent Position.......................................................................................................... 24
4.6 Descriptive Statistics ......................................................................................................... 24
4.6.1 Target Costing .................................................................................................... 24
4.6.2 Balanced Scorecard ............................................................................................ 25
4.6.3 Just in time production ....................................................................................... 26
4.6.4 Investment Decisions ......................................................................................... 27
4.7 Correlation Analysis ......................................................................................................... 28
4.8 Regression Analysis .......................................................................................................... 29
4.9 Discussion of Research Findings ...................................................................................... 30
CHAPTER FIVE: SUMMARY, CONCLUSION AND
RECOMMENDATIONS..................................................................................33
Page 7
vii
5.1 Introduction ....................................................................................................................... 33
5.2 Summary of Findings ........................................................................................................ 33
5.3 Conclusion ........................................................................................................................ 33
5.4 Recommendations ............................................................................................................. 34
5.5 Limitations of the Study.................................................................................................... 34
5.6 Suggestions for Further Research ..................................................................................... 34
REFERENCES .................................................................................................. 35
APPENDICES ................................................................................................... 43
APPENDIX 1: QUESTIONNAIRE ................................................................ 43
APPENDIX 2: LIST OF MANUFACTURING FIRMS ............................... 47
Page 8
viii
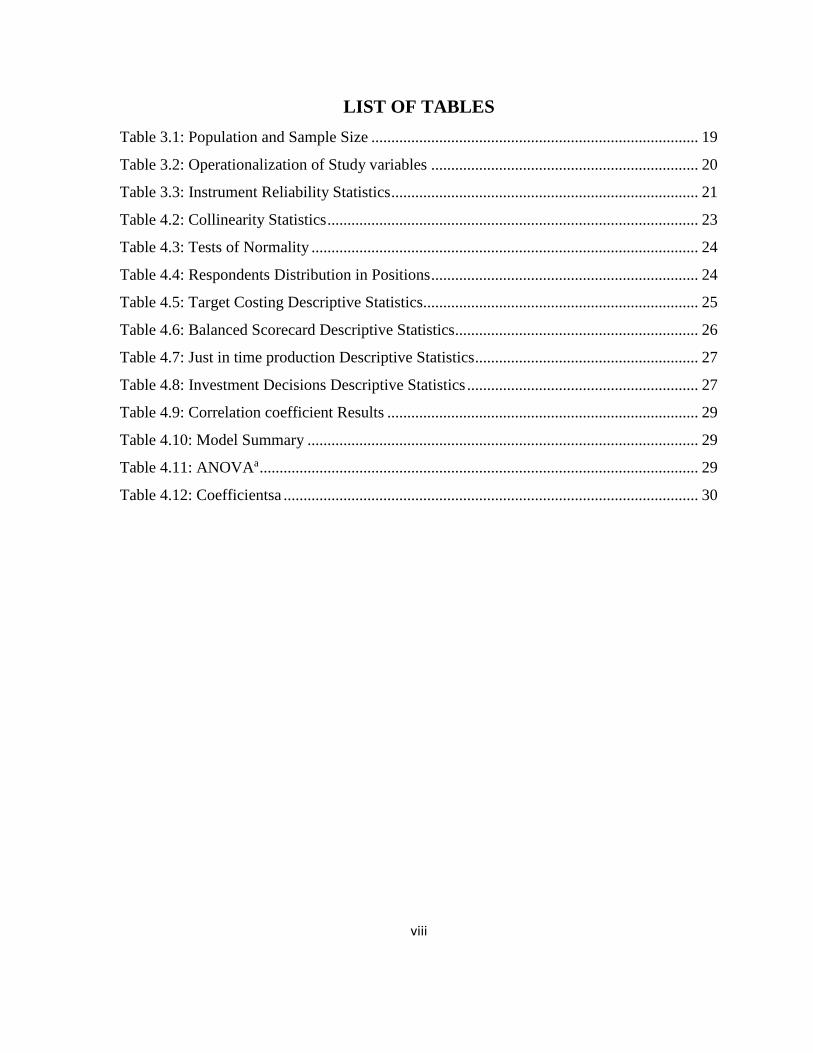
LIST OF TABLES
Table 3.1: Population and Sample Size .................................................................................. 19
Table 3.2: Operationalization of Study variables ................................................................... 20
Table 3.3: Instrument Reliability Statistics ............................................................................. 21
Table 4.2: Collinearity Statistics ............................................................................................. 23
Table 4.3: Tests of Normality ................................................................................................. 24
Table 4.4: Respondents Distribution in Positions ................................................................... 24
Table 4.5: Target Costing Descriptive Statistics..................................................................... 25
Table 4.6: Balanced Scorecard Descriptive Statistics ............................................................. 26
Table 4.7: Just in time production Descriptive Statistics ........................................................ 27
Table 4.8: Investment Decisions Descriptive Statistics .......................................................... 27
Table 4.9: Correlation coefficient Results .............................................................................. 29
Table 4.10: Model Summary .................................................................................................. 29
Table 4.11: ANOVAa .............................................................................................................. 29
Table 4.12: Coefficientsa ........................................................................................................ 30
Page 9
ix
LIST OF FIGURES
Figure 2.1: Conceptual Framework ........................................................................................ 17
Page 10
x
ABBREVIATIONS
ABC Activity Based Costing
ABM Activity-Based Management
AMATs Advanced Management Accounting Techniques
BSC Balanced Scorecard
CIMA Chartered Institute of Management Accounting
EU European Union
GDP gross domestic product
IRR Internal Rate of Return
JIT Just in Time
MAPs Management Accounting Practices
MTP Medium Term Plan
NSE Nairobi Securities Exchange
RRC Relative Replacement Cost
SACCOs Savings and Credit Co-operative
SMA Strategic Management Accounting
SMEs Small and Medium Enterprises
SPSS Statistical Package for the Social Sciences
TMATs Traditional Management Accounting Techniques
Page 11
xi
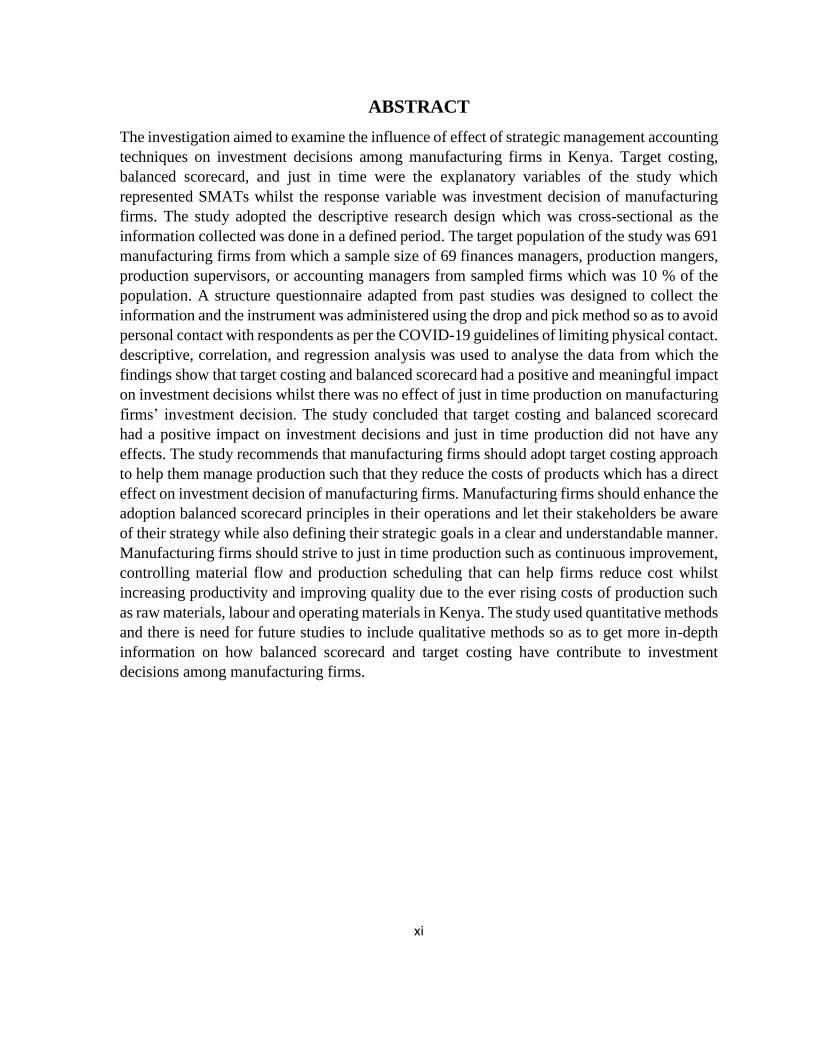
ABSTRACT
The investigation aimed to examine the influence of effect of strategic management accounting
techniques on investment decisions among manufacturing firms in Kenya. Target costing,
balanced scorecard, and just in time were the explanatory variables of the study which
represented SMATs whilst the response variable was investment decision of manufacturing
firms. The study adopted the descriptive research design which was cross-sectional as the
information collected was done in a defined period. The target population of the study was 691
manufacturing firms from which a sample size of 69 finances managers, production mangers,
production supervisors, or accounting managers from sampled firms which was 10 % of the
population. A structure questionnaire adapted from past studies was designed to collect the
information and the instrument was administered using the drop and pick method so as to avoid
personal contact with respondents as per the COVID-19 guidelines of limiting physical contact.
descriptive, correlation, and regression analysis was used to analyse the data from which the
findings show that target costing and balanced scorecard had a positive and meaningful impact
on investment decisions whilst there was no effect of just in time production on manufacturing
firms’ investment decision. The study concluded that target costing and balanced scorecard
had a positive impact on investment decisions and just in time production did not have any
effects. The study recommends that manufacturing firms should adopt target costing approach
to help them manage production such that they reduce the costs of products which has a direct
effect on investment decision of manufacturing firms. Manufacturing firms should enhance the
adoption balanced scorecard principles in their operations and let their stakeholders be aware
of their strategy while also defining their strategic goals in a clear and understandable manner.
Manufacturing firms should strive to just in time production such as continuous improvement,
controlling material flow and production scheduling that can help firms reduce cost whilst
increasing productivity and improving quality due to the ever rising costs of production such
as raw materials, labour and operating materials in Kenya. The study used quantitative methods
and there is need for future studies to include qualitative methods so as to get more in-depth
information on how balanced scorecard and target costing have contribute to investment
decisions among manufacturing firms.
Page 12
1
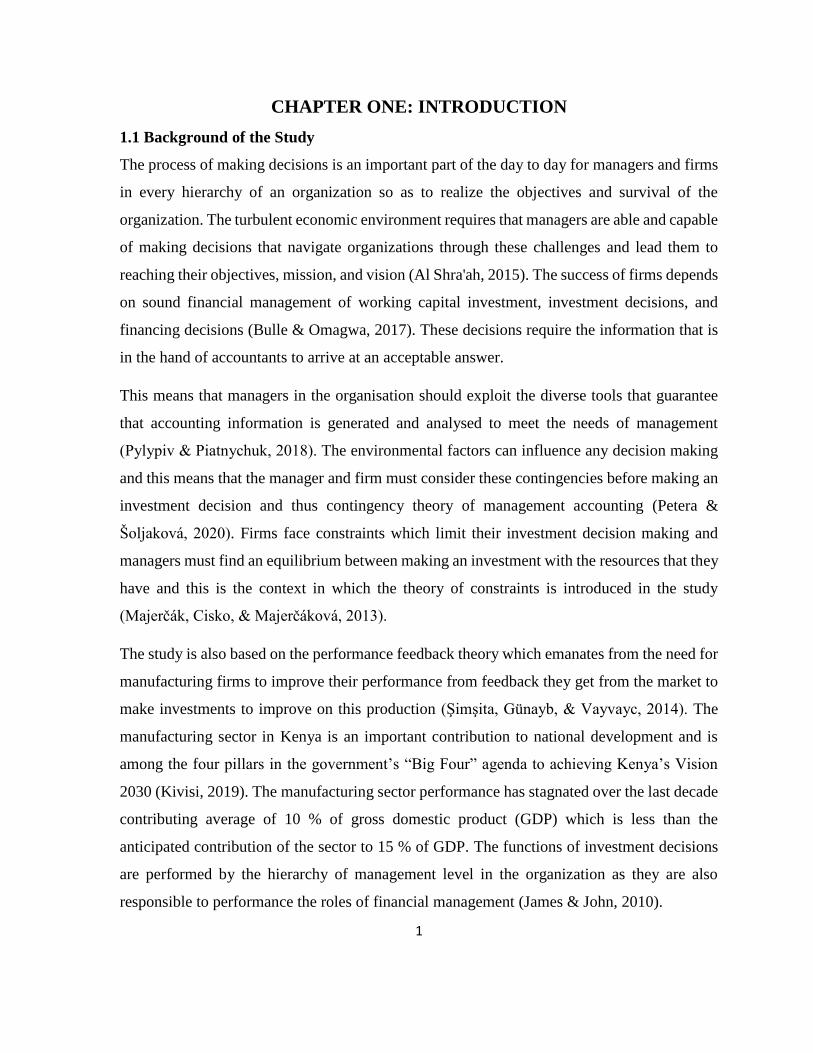
CHAPTER ONE: INTRODUCTION
1.1 Background of the Study
The process of making decisions is an important part of the day to day for managers and firms
in every hierarchy of an organization so as to realize the objectives and survival of the
organization. The turbulent economic environment requires that managers are able and capable
of making decisions that navigate organizations through these challenges and lead them to
reaching their objectives, mission, and vision (Al Shra'ah, 2015). The success of firms depends
on sound financial management of working capital investment, investment decisions, and
financing decisions (Bulle & Omagwa, 2017). These decisions require the information that is
in the hand of accountants to arrive at an acceptable answer.
This means that managers in the organisation should exploit the diverse tools that guarantee
that accounting information is generated and analysed to meet the needs of management
(Pylypiv & Pіatnychuk, 2018). The environmental factors can influence any decision making
and this means that the manager and firm must consider these contingencies before making an
investment decision and thus contingency theory of management accounting (Petera &
Šoljaková, 2020). Firms face constraints which limit their investment decision making and
managers must find an equilibrium between making an investment with the resources that they
have and this is the context in which the theory of constraints is introduced in the study
(Majerčák, Cisko, & Majerčáková, 2013).
The study is also based on the performance feedback theory which emanates from the need for
manufacturing firms to improve their performance from feedback they get from the market to
make investments to improve on this production (Şimşita, Günayb, & Vayvayc, 2014). The
manufacturing sector in Kenya is an important contribution to national development and is
among the four pillars in the government’s “Big Four” agenda to achieving Kenya’s Vision
2030 (Kivisi, 2019). The manufacturing sector performance has stagnated over the last decade
contributing average of 10 % of gross domestic product (GDP) which is less than the
anticipated contribution of the sector to 15 % of GDP. The functions of investment decisions
are performed by the hierarchy of management level in the organization as they are also
responsible to performance the roles of financial management (James & John, 2010).
Page 13
2
1.1.1 Strategic Management Accounting Techniques
Simmonds is credited to coming up with the strategic management accounting concepts in the
early 1980s by stating that strategic management accounting is analysis and provision of
information by the firm to be able to measure and monitor the costs of the strategy that a firm
adopts to compete in the market (Nuraliati, 2018). According to Ma and Tayles (2009), the
management accounting discipline main concern is to provide information that is strategically
oriented for making decisions and control. Strategic management accounting techniques are
fitting for service firms and also manufacturing firms. However, there are techniques that are
more dominant in some industries than others. In the manufacturing sector, activity based
costing, life cycle costing, just in time, and target costing are more present (Nuraliati, 2018).
There are different version and definitions of strategic management accounting techniques and
practices. Adler, Waldron, and Everett (2004) categorised SMATs into two categories:
advanced management techniques and traditional management accounting techniques. back
flush costing, throughput accounting, strategic management accounting, cost modeling, target
cost planning, life cycle costing, economic value added, value added accounting, cost of
quality, target costing, kaizen costing, activity-based costing, and activity-based management
are the advanced management accounting methods. Job order costing, process costing,
standard costing, and full costing are described into the traditional management accounting
techniques. The different conceptualizations that have been used means that area still warrants
more research to determine the mix of SMA variables.
The SMA variable has been measured using different dimensions in the manufacturing
literature. Alkaraan and Northcott (2006) used benchmarking, value chain analysis, technology
road mapping, balanced scorecard, and real options analysis as indicators of SMA. Bawaneh
(2018) used costing system practices, budgeting, performance evaluation practices, and
strategic analysis as proxies for SMAs. Jbarah (2017) adopted balanced scorecard, just in time
production system and target costing were proxies for SMATs. This study adopted Jbarah’s
measurement of SMATs that include target costing, just in time production, and balanced
scorecard.
Page 14
3
1.1.2 Investment Decisions
Making decisions is a notable crucial role of managers in the organization where major
decisions are made (Omarli, 2017). The selection of a course of action from two or more
possible choices to select one answer to a problem is referred to as decision making. Although
investment decisions involve making decisions related to financial resources, there is a
developing concern that they can also be presented as non-financial decisions (Turner & Coote,
2018). The investment decision of an organization can either be replacement modernization,
acquisition, and expansion of long term assets (Kemuma, 2014). Investment decisions are those
that are made by a firm based on which investments to make on their current and long-term
assets which are aimed to increase benefits and value to a firm.
Investment decisions need more scrutiny as they determine the growth of the firm, are risky,
are difficult, involve large volume of funds, and are often irreversible. Deciding on where to
channel firm resources when it comes to investment is a vital aspect that affects economic
growth from a micro and macro perspective (Pandey, 2008). Investment decisions are critical
for the growth of a single firm as such a decision can impact the production efficiency and
reduce the unit production expenses which forms the micro perspective impact. From a macro
perspective, investment decisions are explain the most of change in a nation’s Gross Domestic
Product (GDP) and their effect is used as an indicator of economic performance (Perić &
Đurkin, 2015). The impact of investment decisions in manufacturing firms is an area which
has not been fully explored.
Musau (2016) conceptualized investment decision into four categories: replacement decision,
expansion decision, renewal or modernization decision, and research and development
decision. Muraguri, Irura, and Kyaloteresia (2014) measured investment decision as capital
budgeting. Doust and Pakmaram (2015) used three aspects of managers’ investment decisions
which were investment policy, dividend policy, and financing policy. In their research, Osoro,
Nyang’au, and Nyarige’s (2015) measured investment decisions as internal rate of return (IRR)
and profitability index. Jbarah (2017) measured investment decisions by seven statements on
a five point liker scale. The study used these statements to measure investment decisions as the
data was collected from a sample of respondents.
Page 15
4
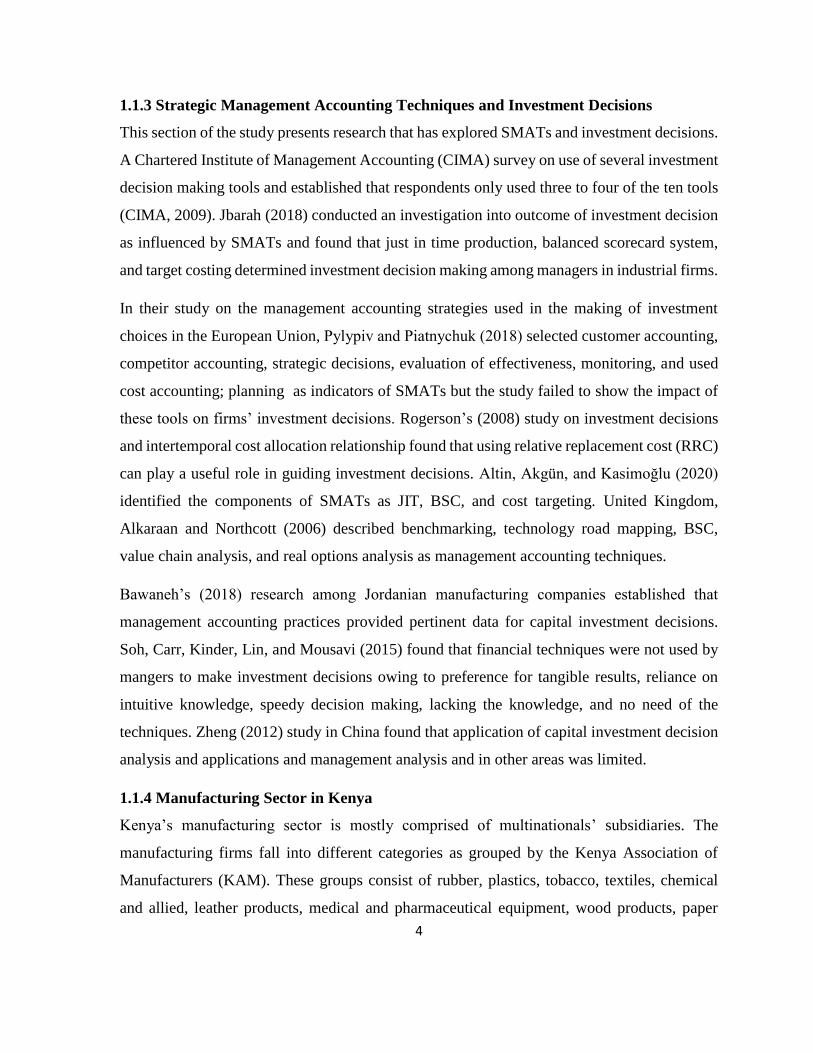
1.1.3 Strategic Management Accounting Techniques and Investment Decisions
This section of the study presents research that has explored SMATs and investment decisions.
A Chartered Institute of Management Accounting (CIMA) survey on use of several investment
decision making tools and established that respondents only used three to four of the ten tools
(CIMA, 2009). Jbarah (2018) conducted an investigation into outcome of investment decision
as influenced by SMATs and found that just in time production, balanced scorecard system,
and target costing determined investment decision making among managers in industrial firms.
In their study on the management accounting strategies used in the making of investment
choices in the European Union, Pylypiv and Pіatnychuk (2018) selected customer accounting,
competitor accounting, strategic decisions, evaluation of effectiveness, monitoring, and used
cost accounting; planning as indicators of SMATs but the study failed to show the impact of
these tools on firms’ investment decisions. Rogerson’s (2008) study on investment decisions
and intertemporal cost allocation relationship found that using relative replacement cost (RRC)
can play a useful role in guiding investment decisions. Altin, Akgün, and Kasimoğlu (2020)
identified the components of SMATs as JIT, BSC, and cost targeting. United Kingdom,
Alkaraan and Northcott (2006) described benchmarking, technology road mapping, BSC,
value chain analysis, and real options analysis as management accounting techniques.
Bawaneh’s (2018) research among Jordanian manufacturing companies established that
management accounting practices provided pertinent data for capital investment decisions.
Soh, Carr, Kinder, Lin, and Mousavi (2015) found that financial techniques were not used by
mangers to make investment decisions owing to preference for tangible results, reliance on
intuitive knowledge, speedy decision making, lacking the knowledge, and no need of the
techniques. Zheng (2012) study in China found that application of capital investment decision
analysis and applications and management analysis and in other areas was limited.
1.1.4 Manufacturing Sector in Kenya
Kenya’s manufacturing sector is mostly comprised of multinationals’ subsidiaries. The
manufacturing firms fall into different categories as grouped by the Kenya Association of
Manufacturers (KAM). These groups consist of rubber, plastics, tobacco, textiles, chemical
and allied, leather products, medical and pharmaceutical equipment, wood products, paper
Page 16
5
board and paper, food and beverages processing listings (Gichaaga, 2014). The import
substitution policy (1967) resulted in the development of the manufacturing sector which
transformed into an industrialization policy which is export-oriented. The industry is depends
heavily on consumer goods production and the government’s participation in the sector is
limited in comparison to that of the private sector owing to the policy of privatization (Aduda
& Ndaita, 2013).
Kariuki and Kamau (2016) reported that manufacturing firms adopted benchmarking,
assessment of the competitor costs, customer accounting practices, monitoring of the
competitors position, and competitor performance appraisal were the prevalent SMA practices.
Whilst activity based costing, target costing and life cycle costing adoption rank low amongst
Kenya’s manufacturing firms. Bulle and Omagwa (2017) showed that investment decisions
played a role in Kenya’s manufacturing firms’ performance which was supported by Koroti
(2014) who showed that there was a direct link between investment decisions and financial
performance of Kenya’s sugar factories. Nyale (2010) found that thirty six percent of firms
quoted in the NSE engaged in diversification investment decisions. The research on investment
decisions and management accounting has been fragmented and this study aims to look at the
relationship between these variables.
1.2 Research Problem
The top leadership mandated to make strategic decisions that include making investments in
restoration old and purchasing new equipment and this requires information that is prepared
by accountants to enable them to arrive at viable solutions. So, it is pertinent that a variety of
tools are used to make sure that analytical and accounting information is generated that meets
the needs of management (Pylypiv & Pіatnychuk, 2018). The importance of Kenya’s
manufacturing sector to the nation’s economic development is great. However, the
performance of the sector has stagnated in the last ten years and improved performance is only
attainable by increase in profits from the industry which depend on all factors that can impact
profits of an organization. Investment decisions have been shown to influence performance of
manufacturing firms in past studies (Bulle & Omagwa, 2017; Mweresa & Muturi, 2017) in
Kenya.
Page 17
6
Several studies conducted around the world show management accounting practices do indeed
influence investment decisions in manufacturing firms. These include Atkinson et al’s. (2012)
study on how management accounting data was used for strategy execution and decision
making. Atrill and Mclaney (2009) conducted a study on management accounting for decision
makers. Myrelid (2013) did an essays on manufacturing-related management accounting.
These studies indicated evidence that management accounting data enhances the quality of
decisions reached by the manufacturing industry and this increases firm performance. Other
studies (Nixon, 1995) found no relationship between management accounting and investment
decisions of firms.
Locally, Bulle and Omagwa (2017) sought the effect of investment decisions on financial
performance of companies listed at the NSE whose operations focused on the manufacturing
and allied sector and found that investment decision did impact the financial performance.
Mweresa and Muturi (2017) assessment on effects of investment decisions on public sugar
companies performance in Western Kenya revealing positive relationship between investments
in production and financial performance. Musau (2016) deduced the influence of investment
choices on financial performance finding that research and development decisions positively
contributed to performance. Koroti’s (2014) examined effects of financing and investment
choices on financial performance of Kenyan sugar companies and found out that investment
decisions positively affected financial performance.
The studies that have explored strategic management accounting techniques in Kenya’s
manufacturing sector. Aduda and Ndaita (2013) investigated on management accounting
systems practices and changes applied by big manufacturing companies. Gichaaga’s (2014)
study on management accounting on manufacturing firms’ financial performance. Waihenya
(2019) study on the impact managerial accounting methods had on manufacturing
organizations financial performance. The goal of this study is to deduce if SMATs have any
effects on investment decisions among Kenya’s quoted manufacturing firms.
1.3 Research Objective
This study aims to determine effects of strategic management accounting techniques on
investment decisions among manufacturing firms listed in the NSE, Kenya.
Page 18
7
1.4 Value of the Study
The study is of value as it aims to contribute to the literature and theory on the influence of
SMATs on investment decision making in manufacturing firms an area which has received
less academic research as impact of strategic management accounting techniques has
dominantly been measured against performance of the firm. There is less academic research
that supports or goes against the existing theoretical framework on the nexus between
management accounting and investment decisions.
The study is of importance and significance to the policy direction and formulation.
Manufacturing is one of the four pillars for the government’s development agenda and this
study inform policy makers on the importance of management accounting methods on the
investment decisions that manufacturing firms make in the pursuit of increasing the
contribution of the sector to the nation’s GDP.
The study helps the managers and leaders in the manufacturing sector as it aims to identify
which SMATs have the greatest effect on investment decision making and thus make
recommendations for adoption of these techniques in the sector. The research makes a vital
contribution to the literature on use of accounting information in making investment decisions
in Kenya’s context where this literature is less available in the academic literature.
Page 19
8
CHAPTER TWO: LITERATURE REVIEW
2.1 Introduction
This chapter reviews existing literature on the topic under study and consists of the theoretical
review, an empirical review of strategic management accounting techniques and investment
decisions, conceptual framework, and a summary and research gap of literature review.
2.2 Theoretical Review
The section thus presents theories relatable to the study to generate understating of SMATs
and investment decisions.
2.2.1 Theory of Constraints
Proposed by Goldratt (1984), theory of constraints (TOC) is a management focused philosophy
where the focus is on the weakest parts of a supply chain to enhance performance of a system.
In its formative years, the TOC was adopted in planning the production process and the
allocation of resources but it was modified as technology evolved and competition became
fierce between competitors in the global market. Today, TOC is used in philosophy of
management combined with cost accounting system (Şimşita, Günayb, & Vayvayc, 2014).
The theory of constraints (TOC) shows managers where and how to focus resources of the
company so that there was a maximum return on investment. It also provides guidance on how
to monitor and measure processes and communicate with the rest of the organization in order
to get on the path of continuous improvement (Rahman, 1998). The TOC has been adopted
widely ranging from marketing and sales, development and research, accounting, project
management, distribution, supply chain, logistics, and production (Şimşita et al., 2014).
According to Cox and Spencer (2000), TOC creates flow accounting one of the three main
branches of TOC performance measurement system, thinking process tools and operation
strategy tools. The last branch of TOC is made up Five Focusing Steps and VAT Analysis. The
performance measurement tools consist of inventory dollar days, throughput dollar days,
operating expense, inventory, throughput, cash flow, return on investment, and net profit. The
thinking process tools consist of audit guidelines/processes and tree diagrams (Majerčák,
Cisko, & Majerčáková, 2013).
Page 20
9
The theory has received considerable criticism. One of the criticisms is that TOC has been
criticized owing to the argument it proposes that it creates the best schedule and the idea that
the algorithm on which it was created from has not been presented in the literature. The TOC
has been criticized for emphasizing on short-term tools of decision making and the concepts
of the theory can be justified in the supply chain from support and resources, production,
management which relies on circumstances. The TOCs operating expenses are identified as
fixed which naïve in the perspective of its critiques.
The TOC is adopted in this study as it integrates the importance of improving performance
systems by exploiting the management accounting system and information of the firm. The
TOC is relevant to the study as the processes is suggests in its explanations can be used by firm
managers to make investment decisions in the company to improve performance. Moreover,
the TOC is relevant as it is a theory that was developed for the industrial and manufacturing
sector in explaining process and product improvement. The focus of this study is
manufacturing firms and the investment decisions they make and thus the theory is useful in
this study.
2.2.2 The Performance Feedback Theory
Rajes, Lechner, and Floyd (2013) posit that performance feedback theory is founded on the
continuous standpoint of the firm where firm decision processes are described by the
behavioural theory of the firm and this process can be understood from evaluating
performance, searching for solutions, and decision making. The theory argues that members
of the firm focus on particular firm goals which are reflected in the level of aspiration and
seeking feedback from the environment to determine if a goal was realized or not. The lack of
achieving a goal means that there is need for a search to find a solution. The empirical evidence
indicates that the theory predicts environment behaviours as well and shows how firms
influence growth of production assets.
A performance that is different from the level of aspiration has a negative impact on risk and
search tolerance such that firms that have performance that is below their aspirations are more
likely to renew or add production facilities that were assessed as acceptable risks. Equally,
firms that have performance beyond their level of aspiration have less input in terms of
Page 21
10
searching for means to enhance their production facilities and have more aversion to risk.
Hence, performance comparative to a level of aspiration has a negative relationship to the level
of asset growth. Simply, failure feed growth and success suppresses growth. This means that
the organization investment choices are reached after considering the organization
performance relative to the aspirations that the firm has and thus makes this theory relevant to
the study (Rajes et al., 2013).
Some of the criticisms levels against performance feedback theory are that the performance
feedback theory does not show the importance of intra-organizational processes or
environmental factors but rather sees firm change as a result of their combination. Despite this
criticism the theory is appropriate for the research as its shows the motivations towards
investment decision making by attributing this process to the realization or a non-realization
of the company goals. The poor performance of a manufacturing firms means that it is more
likely to make investments and good performance will influence less investment decisions.
Manufacturing firms have been performing poorly and are involved in making investment
decisions which are evaluated in terms of their SMATs.
2.2.3 Contingency Theory of Management Accounting
Fred Edward Fielder is credited with the contingency theory of leadership in the 1960s. Otley
(1980) applied the theory in management accounting by arguing that a contingency perspective
must demonstrate the various accounting process parts that are related to specific situations
and show a suitable match. The theory argues that firm systems and structures are a part of
firm and environment specific factors (Cadez & Guilding, 2008). In contrast to best practice
techniques, the contingency approach proposes that firm effectiveness comes from matching
their management control system to a particular situation (Petera & Šoljaková, 2020).
The contingency theory and its link to firm accounting structure and organization gained
tractions in the accounting literature in the seventies. The contingency idea is founded on the
firm theory that a company aims to maximize its competency between environment and
structure (Dik, 2011). This means that a contingency approach must show the specific parts of
Page 22
11
a system of accounting which are linked with particular circumstance that are defined and must
show suitable matching (Islam & Hu, 2012).
The contingency theory has been critiqued as to having a limited scope in the explanation of
how contingencies and peculiarities and how this influence the application of management
accounting systems in the firm (Reid & Smith, 2000). This view of the theory has been
contested by previous studies which posit that the management accounting systems can be
determined and can influence contingencies and that the theory lacks specificity and clarity as
its variables are poorly defined (Orja, 2014).
The theory is useful in this research as it shows the importance of matching the internal
environment to the flexible external environment. The efficiency of the manufacturing sector
can be enhanced by making investment decisions to increase their performance. The
management accounting information is generated internally but can be used to chart the way
forward for manufacturing firms to invest by increasing efficiency in investment decision
making among top leadership in manufacturing firms.
2.3 Determinants of Investment Decisions in Manufacturing Firms
This section of the literature focuses on presenting evidence of studies and research have
established the determinants of firm investment decision. An attempt is made to present this
evidence in a systematic approach moving from global, regional, and local evidence.
2.3.1 Strategic Management Accounting Techniques
The strategic management approach was first used during the coming up with the various
methods in the cost accounting and management disciplines whose aim was to reach the
objectives stipulated by the modern business organization’s strategic management. The
strategic accounting management created several approaches and methods in strategic
management accounting and strategic cost management that included the balanced scorecard,
benchmarking, value chain, and ABC costing (AlMaryani & Sadi, 2012).
The purpose of strategic management accounting is to give data for the coming up with a firm’s
strategy and ensure its execution is successful by boosting a firm’s culture that is relatable to
the firm’s strategy by applying accounting approaches aimed at cost reduction, evaluation of
Page 23
12
performance, product quality improvement that contribute to the firm’s strategy and to
maintain the position of the firm competitively and proceed to operate in the changing market
(AlMaryani & Sadi, 2012).
2.3.2 Macroeconomic Factors
Bialowolski and Weziak-Bialowolska (2014) investigated the importance of certain external
influencers of Polish firms investment choices and found legal and macroeconomic factors
determined the investment decisions. Uleng, Mas’ud, and Nurpadila (2017) study on
relationship between outside factors on investment decision of manufacturing firms in the
Indonesia Stock Exchange (IDX) analyzing effects of interest rates, inflation, exchange rate
and investment decisions and found that interest rate and inflation had negative effects on the
investment decision, while the exchange rate favorably impacted on the investment decision.
2.3.2 Personal Factors
In a sample of individual investors and equity fund managers, Sajid (2015) examined the
factors affecting investment decision making in Pakistan and concluded that practical problem
solving, application of financial tools and level of corporate governance of the firm
significantly and favorably influenced the making of investment decisions whilst risk aversion
had significant negative effect. Qureshi, Rehamn, and Hunjra (2014) analysis of factors
impacting investment choices made by fund managers in equity investment firms, commercial
banks, and insurance firms established there was a significance positive association on
application of financial tools, practical problem solving skills, corporate governance, risk
aversion, and investment decisions. The findings indicated that corporate governance of the
firm has a big effect on making investment decisions.
In a sample that consisted of SACCO board of directors in Kenya, Muraguri, Irura, and
Kyaloteresia (2014) analysed the determinants on SACCO funds investment decisions and
established that financial literacy skills were important in making investment decisions. Still
in Kenya, using a sample of finance managers from NSE listed organizations, Worzie (2020),
analysed the factors affecting investment decisions finding that profitability of the company,
financial market information, investment risk, and investor financial knowhow on investment
decisions of NSE firms.
Page 24
13
2.3.3 Firm factors
In a study conducted in Portugal, Pacheco (2017), investigated the investment determinants at
the firm-level among industrial Small and Medium Enterprises (SMEs). The findings showed
that firm-specific characteristics - profitability, liquidity, leverage, and size favorably and
significantly impacted investment decisions of an SME. In a sample of polish companies,
Bialowolski and Weziak-Bialowolska (2014) investigated the significance of outside
influences on investment choices and indicated that delays in payments had the greater impact
on influencing investment decisions among companies in Poland.
Perić and Đurkin (2015) identified the major determinants that influence investment decisions
of small firms in Croatia from which the results showed that most firms made investments in
fixed assists that were targeted towards survival of the firm, that is, investment decisions were
towards the replacement of worn-out equipment. In Ghana, Edusei-Mensah (2015) examined
the factors that contributed to investment decisions of firms and found that resources, cash
levels, exchange rates, fixed assets all influenced Ghanaian firms listed investment decisions.
2.4 Empirical Studies
The Chartered Institute of Management Accounting (2009) conducted a global research survey
that asked 439 accounting managers to report about the current and intended usage of ten
investment decision making tools. The survey covered ten groups of management accounting
tools divided into strategic, managerial, and operational categories. The study found three or
four tools were used in making investment decisions out of the ten listed with net present value
(NPV) being the most applied tool for investment decisions.
In the United Kingdom, Alkaraan and Northcott (2006) study examined the relation between
management accounting tools and capital investment decision using benchmarking, balanced
scorecard, value chain analysis, technology road mapping, and real options analysis were
proxies of MAPs management accounting techniques. The findings showed accounting rate of
return (ARR), net present value (NPV), internal rate of return (IRR), and payback rule (PB)
had a positive relationship with capital investment decision making. Jbarah (2017) evaluated
the relationship between SMATs and investment decisions of industrial firms in Jordan
adopting an analytical descriptive approach to the study. Balanced scorecard, target costing,
Page 25
14
and Just in time production system were the SMATs were the indicators for the independent
variable. The results show an impact of SMATs on making of investment decisions. The study
was limited to industrial firms which possess different operational dynamics than
manufacturing firms which this study aims to focus on. The study did not include control
variables in its analysis which are introduced in the current study.
In Jordan, Bawaneh (2018) conducted a study on the importance and current application of
MAPs among thirty manufacturing firms in Jordan. The independent variables were costing
system practices, budgeting, performance evaluation practices, strategic analysis, and
techniques for short-term decision-making. The findings revealed MAPs complemented the
management accounting processes and firm structure. The study thus concluded that
management accounting provided relevant information for capital investment decisions. In
Turkey, Altin, Akgün, and Kasimoğlu (2020) measured effects of SMATs in a sample of SMEs
operating in the manufacturing sector on their investment decisions. The components of
SMATs were JIT, BSC, and cost targeting. The results indicated that SMATs applied by the
manufacturing SME firms had a moderate effect on their investment decisions whilst JIT had
highest rate of effect on efficiency of making investment decision followed by BSC and TC.
This study was focused on a sample of SMEs which are relatively smaller from the sample of
firms that this study aims to focus on.
Wu, Huang, and Brown (2013) examined the influence of target costing (TC) in real-estate
industry investments using a case study approach. Target costing among real-estate investment
firms was used for price dynamics and market orientation. The study adopted a qualitative
research design which gave rise to the limitation of focusing the research on a small sample.
The study was not in the manufacturing sector where this study aims to focus. Moreover, the
research was limited to one SMA technique whilst this study aims to focus on three techniques.
In the United States, Lyons, Gumbus, and Bellhouse (2003) conducted a study on alignment
of capital investment decisions along with the BSC using a case study approach of Bridgeport
Hospital. The findings show that U Bridgeport Hospital had been applying the BSC
consistently over a three year duration to implement strategy into their operations. The hospital
also linked the BSC to the capital budgeting process to make sure that resources were allocated
Page 26
15
with the imperatives of the strategy. The realisation of allocation of resources and combination
of strategy applying a matrix technique where strategy goals were allocated projects and
weights were assessed on the ability of the project to influence the strategy goals listed in the
scorecard. The study was limited to a hospital firm which is different from manufacturing
firms’ process and was further limited to the BSC as a management accounting technique
whilst this study focuses on three SMATs.
In an assessment of financing and investment choices on financial performance of Kenyan
Sugar companies, Koroti (2014) applied a non-probability sampling approach in which the
sample was of 4 sugar companies from a population of 11 organizations. The research
established that investment decisions had an effect on financial performance. The limitation
from this study was that only sugar companies were included and although they are part of
manufacturing firms in Kenya, but this study includes other companies of manufacturing
definition. The study was limited to secondary data and lacked input from professionals on use
of SMATs in making investment decisions a goal which this study aims to do. Amuko (2015)
conducted a study on SMEs investment decisions by assessing the technology investments by
SMEs in Nairobi, Kenya. The descriptive study used a population list comprising of 107
respondents from a sample of 53 companies. The study called for improved capital structure
management for SMEs as it contributed to access to finance and investment decisions. The
study sample was SMEs while this study focuses on large manufacturing firms in the NSE.
Musau (2016) investigated the outcome of financial performance from effects of investment
decisions of SACCOs from Kitui Central Sub County using time series data covering a 10 year
period (2006 - 2015) in a sample of 12 firms. The findings revealed that research and
development, renewal decisions, and replacement decision had positive significant effects on
financial performance (dividends) whilst negative effect was seen for expansion decision.
Research and development decision, modernization decision, and expansion decision had
resulted in an increase to financial performance (surplus or deficits) with replacement decisions
had negative effects.
Page 27
16
Bulle and Omagwa (2017) examined effects of investment decisions on financial performance
of organization listed in the NSE whose operations were focused on manufacturing and allied
sector. The sample of the study comprised of data on firms from 2011 to 2016. The study found
that investment decision impacted the financial performance of any firm. This study used
investment decisions as an explanatory variable whilst it is used as a response variable in this
study. In an assessment of outcome of performance of public Kenyan sugar companies from
investment decision in western Kenya, Mweresa and Muturi (2017) found that production
investment had an impact on financial performance, distribution investment decisions had a
moderate effect, and least impact was observed for financial asset investment. The study
findings were restricted to sugar firms which are also part of the manufacturing and allied
sector but not all firms are on the NSE which is the focus of this project. The study did not
examine any relationships between investment decisions and SMATs which is the main
objective of the study.
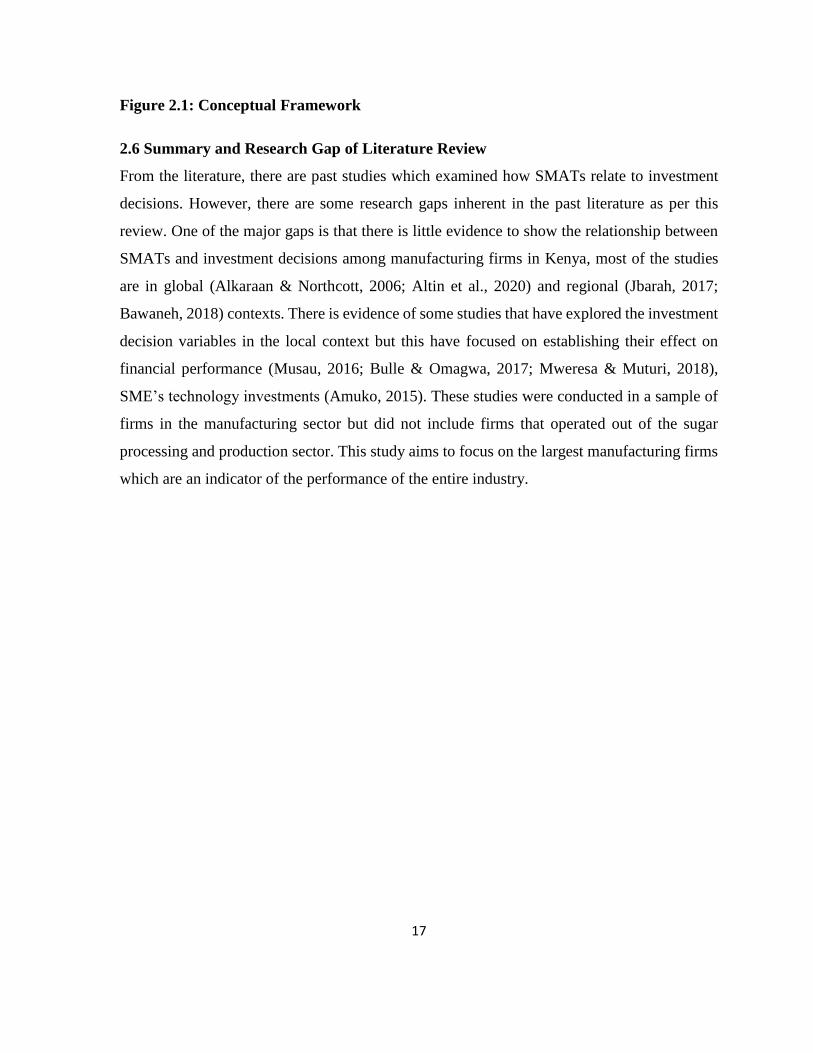
2.5 Conceptual Framework
The structure that an investigator believes can explain the natural progression of a research
problem is referred to as a conceptual framework. This framework is connected to important
theories, empirical results, and concepts which are applied to promote and systematize the
knowledge adopted by a researcher (Adom, Hussein, & Agyem, 2018). The proxies for SMA
techniques are variables are balanced scorecard, just in time production, and target costing with
investment decisions as dependent variable.
Independent Variable Dependent Variable
Strategic Management
Accounting Techniques
Balance scorecard
Just in time production
Target costing
Investment Decisions
Replacement decision
Expansion decision
Renewal or modernization
decision
Page 28
17
Figure 2.1: Conceptual Framework
2.6 Summary and Research Gap of Literature Review
From the literature, there are past studies which examined how SMATs relate to investment
decisions. However, there are some research gaps inherent in the past literature as per this
review. One of the major gaps is that there is little evidence to show the relationship between
SMATs and investment decisions among manufacturing firms in Kenya, most of the studies
are in global (Alkaraan & Northcott, 2006; Altin et al., 2020) and regional (Jbarah, 2017;
Bawaneh, 2018) contexts. There is evidence of some studies that have explored the investment
decision variables in the local context but this have focused on establishing their effect on
financial performance (Musau, 2016; Bulle & Omagwa, 2017; Mweresa & Muturi, 2018),
SME’s technology investments (Amuko, 2015). These studies were conducted in a sample of
firms in the manufacturing sector but did not include firms that operated out of the sugar
processing and production sector. This study aims to focus on the largest manufacturing firms
which are an indicator of the performance of the entire industry.
Page 29
18
CHAPTER THREE: RESEARCH METHODOLOGY
3.1 Introduction
This chapter describes and defends the selection and choice of the different research techniques
used for the study. The design used, population, sample design, data gathering, diagnostic tests,
and data analysis are the sub sections included in this chapter.
3.2 Research Design
According to Robson (2002), research designs can be grouped into explanatory, descriptive,
exploratory. In explanatory studies, the researcher aims to account and explain phenomenon
by answering the “how” and “why” questions (Grey, 2014). In an exploratory research design,
a researcher aims to find out new information on a research area or problem that has not been
empirically investigated (Saunders, Lewis, & Thronhill, 2012). Descriptive studies describe an
event, individual, or setting showing how they are linked (Blumberg, Cooper & Schindler,
2008). The study adopted the descriptive research design which was deemed fit as it focuses
on the influence of selected variables on manufacturing firms’ investment choices.
3.3 Population
The entire group of units that a survey aims to study and make inferences is referred to as a
population. It’s then the group of the population that the findings are aimed to be generalized
(Taherdoost, 2016). The units of analysis was 691 manufacturing firms in Kenya and the units
of observation is either finance managers, production mangers, production supervisors, or
accounting managers from the selected firms.
3.4 Sample Design
The study adopted the stratified random sampling which is presented in Table 3.1 in which the
strata are places into the manufacturing sub sectors. In choosing the sample size, Mugenda and
Mugenda (2019) recommendations was taken into account that it’s prudent to select 10-30 %
of the population as the sample size of the study. Thus, the study selected the 10 % of the
population as the sample size for the study which corresponds to 69 firms.
Page 30
19
Table 3.1: Population and Sample Size
Sub-Sector Population Sample Size
Building, Mining, and construction 26 3
Chemical and Allied 78 7
Energy, Electrical, and Electronics 44 4
Food and Beverages 193 19
Leather and footwear 9 1
Metal and allied 78 8
Motor vehicle assemblers and accessories 53 5
Paper and board 70 7
Pharmaceutical and medical equipment 26 3
Plastics and rubber 26 6
Textile and apparel 61 2
Timber, wood, and furniture 18 2
Fresh produce 3 1
Total 691 69
Source: Kenya Association of Manufactures (2020)
3.5 Data Collection
Quantitative research is that which aims to collect data in a numerical format and is analysed
using mathematical procedures using statistical software (Aliaga & Gunderson, 2002). The
researcher designed a questionnaire to collect data from participants which had close-ended
question items and a 5 point Likert scale to measure the independent and dependent variables.
This source of data collection is primary. The instrument had five sections that include the
background information of respondents, a section on the three independent variables, and a
section on the dependent variable. The study adopted an instrument developed by Jbarah
(2017), the balanced scorecard consist of 9 items, target costing has 10 items, just in time
production system consists of 9 items, and 7 items on investment decision.
Page 31
20
Table 3.2: Operationalization of Study variables
Variable Measurement Scale Source
Investment
decisions
12 items Interval scale Musau (2016); Nyang’au &
Muturi (2018)
Balance
scorecard
Nine items Interval scale Jbarah (2017)
Just in time
production
Nine items Interval scale Jbarah (2017)
Target costing Ten items Interval scale Jbarah (2017)
3.5.1 Diagnostic tests
The diagnostics tests that were conducted include the tolerance and Variance Inflation Factor
(VIF) was used to determine multicollinearity issues in the data. The tolerance point is the 1-
R2 value when each explanatory variables is regressed on other explanatory variables whose
low tolerance levels display excessive points of multicollinearity. The VIF is utilized as an
indicator of multicollinearity and is described as the mutuality of tolerance. The rule of thumb
is to have low points of VIF, as high points of VIF are recognized to adversely influence of the
result linked with a multiple regression analyses (Belsley, Kuh, & Welsch, 2004).
Kolmogorov–Smirnov test and the Shapiro–Wilk test are popular for checking a dataset’s
normality. In this study, the Kolmogorov–Smirnov tests were used as it is more suitable for
samples > 50 and continuous data (Belsley et al., 2004).
3.6 Data Analysis
3.6.1 Reliability and Validity of the Instrument
Reliability quantifies the level of consistency of an instrument, including internal consistency,
stability, and equivalence (Neuman, 2012). The study used Cronbach’s Alpha to measure the
internal reliability of a questionnaire. The value of Cronbach’s Alpha gives an evaluation of
the accuracy or uniformity of the research questions with the study objectives (Kember &
Leung, 2008). A pilot study was conducted among 10 participants from a similar population
which was managers from manufacturing firms not listed in the NSE. A universal accepted
rule is that a value of 0.6-0.7 points out accepted levels of reliability (Sitjma, 2009).
Page 32
21
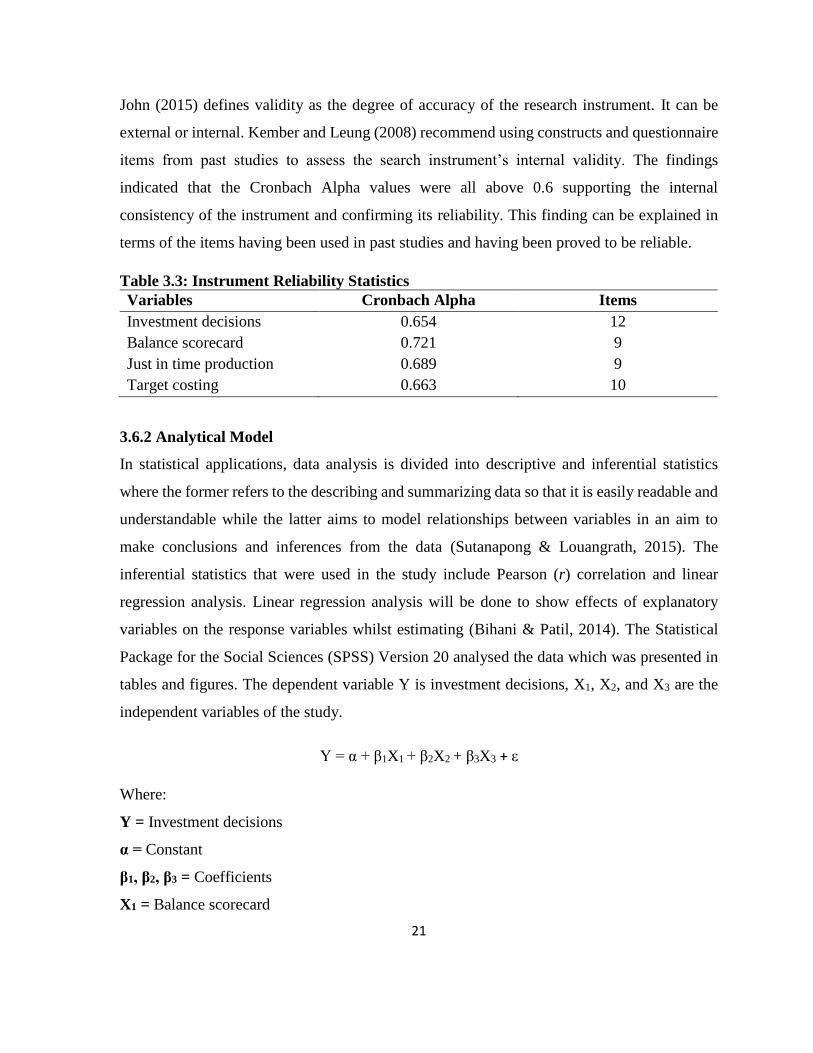
John (2015) defines validity as the degree of accuracy of the research instrument. It can be
external or internal. Kember and Leung (2008) recommend using constructs and questionnaire
items from past studies to assess the search instrument’s internal validity. The findings
indicated that the Cronbach Alpha values were all above 0.6 supporting the internal
consistency of the instrument and confirming its reliability. This finding can be explained in
terms of the items having been used in past studies and having been proved to be reliable.
Table 3.3: Instrument Reliability Statistics
Variables Cronbach Alpha Items
Investment decisions 0.654 12
Balance scorecard 0.721 9
Just in time production 0.689 9
Target costing 0.663 10
3.6.2 Analytical Model
In statistical applications, data analysis is divided into descriptive and inferential statistics
where the former refers to the describing and summarizing data so that it is easily readable and
understandable while the latter aims to model relationships between variables in an aim to
make conclusions and inferences from the data (Sutanapong & Louangrath, 2015). The
inferential statistics that were used in the study include Pearson (r) correlation and linear
regression analysis. Linear regression analysis will be done to show effects of explanatory
variables on the response variables whilst estimating (Bihani & Patil, 2014). The Statistical
Package for the Social Sciences (SPSS) Version 20 analysed the data which was presented in
tables and figures. The dependent variable Y is investment decisions, X1, X2, and X3 are the
independent variables of the study.
Y = α + β1X1 + β2X2 + β3X3 + ε
Where:
Y = Investment decisions
α = Constant
β1, β2, β3 = Coefficients
X1 = Balance scorecard
Page 33
22
X2 = Just in time production
X3 = Target costing
ε = Error term
3.6.3 Significance Tests
Significance tests are a function of empirical quantitative data analysis. The null hypothesis
significance test is the most common form of significance tests and is a method that is used
widely to legitimize claims of knowledge from statistical analysis from randomly distributed
data. The correlation and regression statistics on the relationship between variables was done
at the 95 % confidence level.
Page 34
23
CHAPTER FOUR: DATA ANALYSIS OF INTERPRETATION
4.1 Introduction
This chapter is the data analysed results and presentation done in sub sections that include a
description of the response rate, the position of respondents in the sampled firms, descriptive
statistics section for each of the study variables, correlation analysis, multiple regression
analysis, and closes with by discussing the outcomes.
4.2 Response Rate
Table 4.1 shows the rate of response from the field survey which shows that out of the 69
questionnaires administered, the study was able to receive back 57 that were used in the
analysis. This represents a response rate of 82.6 %.
Table 4.1: Study’s Rate of Response
Position in firm Frequency Percent
Questionnaires administered 69 100.0
Questionnaires not returned 12 17.4
Questionnaires returned 57 82.6
4.3 Multicollinearity
The rule of thumb is to have low points of VIF, as high points of VIF are recognized to
adversely influence of the result linked with a multiple regression analyses (Belsley, Kuh, &
Welsch, 2004). The VIF values are all below 5 and this means that there is no collinearity in
the data.
Table 4.2: Collinearity Statistics
Tolerance VIF
Target costing 0.798 1.253
Balanced scorecard 0.626 1.597
Just in time production 0.757 1.322
4.4 Normality
The Kolmogorov–Smirnov test will be used as it is more suitable for samples > 50 and
continuous data (Belsley et al., 2004). Table 4.3 shows that data exhibited a normal distribution
based on the significance levels which were greater than 0.05 which means we reject the null
hypothesis that data do not follow the specified distribution. This means normality is present.
Page 35
24
Table 4.3: Tests of Normality
Kolmogorov-Smirnova
Statistic df Sig.
Investment Decisions .106 57 .168
Target Costing .108 57 .093
Balanced Scorecard .131 57 .066
Just in time production .110 57 .085
a. Lilliefors Significance Correction
4.5 Respondent Position
The questionnaire was administered to staff concerned with financial information and
operations in the sampled firms and these responses were categorised into finance managers
(15.8 %), financial controllers (28.1 %), production managers (15.8 %), production managers
(15.8 %), production supervisors (14.0 %), and accounting managers (26.3 %) given in Table
4.4.
Table 4.4: Respondents Distribution in Positions
Position in firm Frequency Percent
Finance Managers 9 15.8
Financial controller 16 28.1
Production Mangers 9 15.8
Production Supervisors 8 14.0
Accounting Managers 15 26.3
Total 57 100.0
4.6 Descriptive Statistics
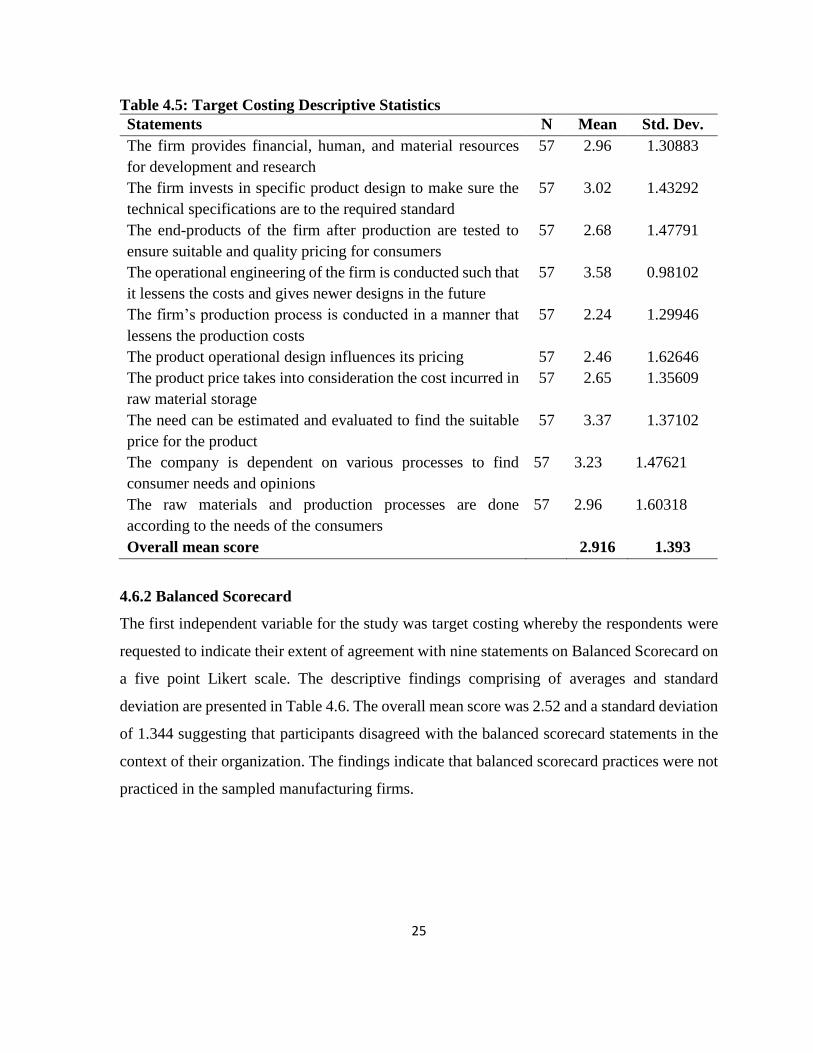
4.6.1 Target Costing
The first independent variable for the study was target costing whereby the respondents were
requested to indicate their extent of agreement with twelve statements on target costing on a
five point Likert scale. The descriptive findings comprising of averages and standard deviation
are presented in Table 4.5. The overall mean for this statements is 2.916 and a standard
deviation of 1.39 indicative of respondents’ disagreement with the statements on target costing
from the context of their firms.
Page 36
25
Table 4.5: Target Costing Descriptive Statistics
Statements N Mean Std. Dev.
The firm provides financial, human, and material resources
for development and research
57 2.96 1.30883
The firm invests in specific product design to make sure the
technical specifications are to the required standard
57 3.02 1.43292
The end-products of the firm after production are tested to
ensure suitable and quality pricing for consumers
57 2.68 1.47791
The operational engineering of the firm is conducted such that
it lessens the costs and gives newer designs in the future
57 3.58 0.98102
The firm’s production process is conducted in a manner that
lessens the production costs
57 2.24 1.29946
The product operational design influences its pricing 57 2.46 1.62646
The product price takes into consideration the cost incurred in
raw material storage
57 2.65 1.35609
The need can be estimated and evaluated to find the suitable
price for the product
57 3.37 1.37102
The company is dependent on various processes to find
consumer needs and opinions
57 3.23 1.47621
The raw materials and production processes are done
according to the needs of the consumers
57 2.96 1.60318
Overall mean score 2.916 1.393
4.6.2 Balanced Scorecard
The first independent variable for the study was target costing whereby the respondents were
requested to indicate their extent of agreement with nine statements on Balanced Scorecard on
a five point Likert scale. The descriptive findings comprising of averages and standard
deviation are presented in Table 4.6. The overall mean score was 2.52 and a standard deviation
of 1.344 suggesting that participants disagreed with the balanced scorecard statements in the
context of their organization. The findings indicate that balanced scorecard practices were not
practiced in the sampled manufacturing firms.
Page 37
26
Table 4.6: Balanced Scorecard Descriptive Statistics
Statements N Mean Std. Dev.
The firm makes clarification on the strategy to its shareholder and
is clear about the goals of the firm
57 3.9649 1.14899
The firm pays attention to the performance measurements to
achieve its operations and has strategies linked to the operations
57 2.0351 1.26724
The firm collaborates with the firm and individuals about its
performance
57 2.1053 1.23468
The firm has a plan to reach its tactical aims and makes efforts to
ease the annual budget preparation process
57 2.9474 1.38127
The firm aims to escalate the administrative coordination among
employees and create knowledge in the firm to enhance their
capabilities
57 2.0175 1.26054
The firm pays attention to the operations’ performance
measurement linking shore-term and long-term objectives of the
firm
57 2.8246 1.45311
The strategy of the firm is translated to the initiatives, goals,
standards, and parameters for continuous improvement
57 2.3509 1.39503
The firm’s strategy is communicated to all staff and extends to the
firm’s learning and change
57 2.386 1.44858
The firm aims to match the personal goals and the departmental
goals with the strategy
57 2.0877 1.41775
Overall mean score 2.52 1.344
4.6.3 Just in time production
Table 4.7 shows the descriptive statistics for the Just in time production which was the study’s
third variable. The respondents were requested to indicate their extent of agreement to nine
statements on JIT production in their respective forms on five point Likert scale. The overall
mean score was observed as 2.73 which fall under disagree level and a standard deviation of
1.282. This means that participants disagreed with just in time production processes, system,
and techniques were adopted in their respective firms.
Page 38
27
Table 4.7: Just in time production Descriptive Statistics
Statements
The JIT processes have contributed to the control of times of
delivery to clients
57 2.7544 1.41775
The JIT system lessens amount of stock and the expenses
associated
57 3.0351 1.47557
The JIT system has made the stock delivery to a small quantity of
suppliers
57 2.2105 1.31932
The JIT system has contributed to the employees developing
various skills
57 2.0175 0.95415
The utilization of control cards in production has led to the control
of production and needed specifications
57 1.8246 1.28345
The JIT system has assisted in stock purchasing with the matching
amount of production quantity
57 2.33 1.38013
The JIT system is linked to enhancing product quality and reduce
expenses by controlling and testing processes
57 3.18 1.67036
The JIT system has made the firm to rely on a low stock levels to
reduce losses
57 3.56 1.01801
The JIT system has made it possible for the firm to produce to 57 3.67 1.02353
Overall mean score 2.73 1.282
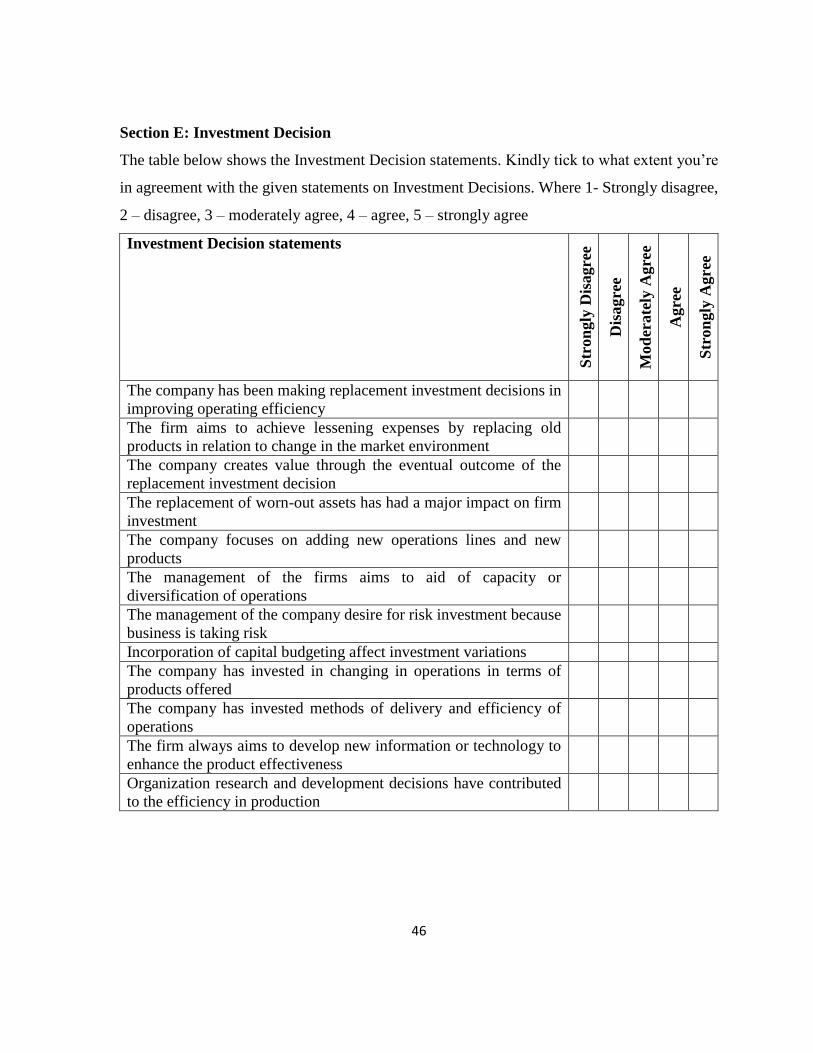
4.6.4 Investment Decisions
The dependent variable was measured by twelve statements that participants were requested
to show their level of disagreement on a five point Likert scale. The overall mean score for
investment decisions is shown as 2.70 and a standard deviation of 1.305 as shown in Table 4.8.
This findings suggest that manufacturing firms were not making investment decisions and this
can be a barrier to these firms achieving optimum firm performance.
Table 4.8: Investment Decisions Descriptive Statistics
Statements
Page 39
28
The company has been making replacement investment
decisions in improving operating efficiency
57 2.84 1.41155
The firm aims to achieve lessening expenses by replacing old
products in relation to change in the market environment
57 2.07 1.26575
The company creates value through the eventual outcome of the
replacement investment decision
57 3.65 1.35609
The replacement of worn-out assets has had a major impact on
firm investment
57 2.40 1.33443
The company focuses on adding new operations lines and new
products
57 2.60 1.26575
The management of the firms aims to aid of capacity or
diversification of operations
57 2.30 1.28125
The management of the company desire for risk investment
because business is taking risk
57 2.93 1.27978
Incorporation of capital budgeting affect investment variations 57 3.28 1.1141
The company has invested in changing in operations in terms of
products offered
57 2.47 1.29705
The company has invested methods of delivery and efficiency of
operations
57 2.93 1.16281
The firm always aims to develop new information or technology
to enhance the product effectiveness
57 2.40 1.30739
Organization research and development decisions have
contributed to the efficiency in production
57 2.53 1.58233
Overall mean score 2.70 1.305
4.7 Correlation Analysis
Table 4.9 gives the findings of the Pearson correlation coefficients between strategic
management accounting techniques and investment decisions. The outcomes indicates that
there was a favorable and significant association between target costing and investment choices
from the correlation coefficient of 0.341 and this was significant at the 5 % alpha level. A
positive and significant association was also observed for the balanced scorecard and
investment decisions by a correlation coefficient of 0.256 significant at the 5 % alpha level.
Just in time production had the least correlation coefficient of 0.057 that was favorable and
significant at the 5 % alpha level. These findings explain that an increase in target costing, just
in time production, and balanced scorecard move in the same direction with investment
decisions.
Page 40
29
Table 4.9: Correlation coefficient Results
Target Costing Balanced Scorecard Just in time Production
Target
Costing
Balanced
Scorecard
.448**
0.000
Just in time
Production
0.184 .492** 1
0.171 0.000
Investment
Decisions
0.341 0.256 0.057
0.004 0.004 0.270
** Significant correlation from the test value at the 0.01 level (2-tailed).
4.8 Regression Analysis
A regression analysis helped determine the influence of target costing, just in time production,
and balanced scorecard. The model summary for this analysis is shown in Table 4.10 and this
shows that the model explained 54.1 % (R2 = 0.541) of change in investment decisions.
Table 4.10: Model Summary
Model R R Square Adjusted R Square Std. Error of the Estimate
1 .710a 0.541 0.045 0.45156
a Predictors: (Constant), Just in time Production, Target Costing, Balanced Scorecard
Table 4.6 presents the Analysis of Variance (ANOVA) outcomes and shows the variability
level of a regression model and tests the significance of a model. The F statistic (F = 1.879), is
positive and the significance value is less than 0.05 (p value = 0.044), which points to the
significance of the model in explaining variation in investment decisions.
Table 4.11: ANOVAa
Model Sum of Squares df Mean Square F Sig.
1 Regression 1.149 3 0.383 1.879 0.044b
Residual 10.807 53 0.204
Total 11.956 56
Page 41
30
a Dependent Variable: Investment Decisions
b Predictors: (Constant), Just in time Production, Target Costing, Balanced Scorecard
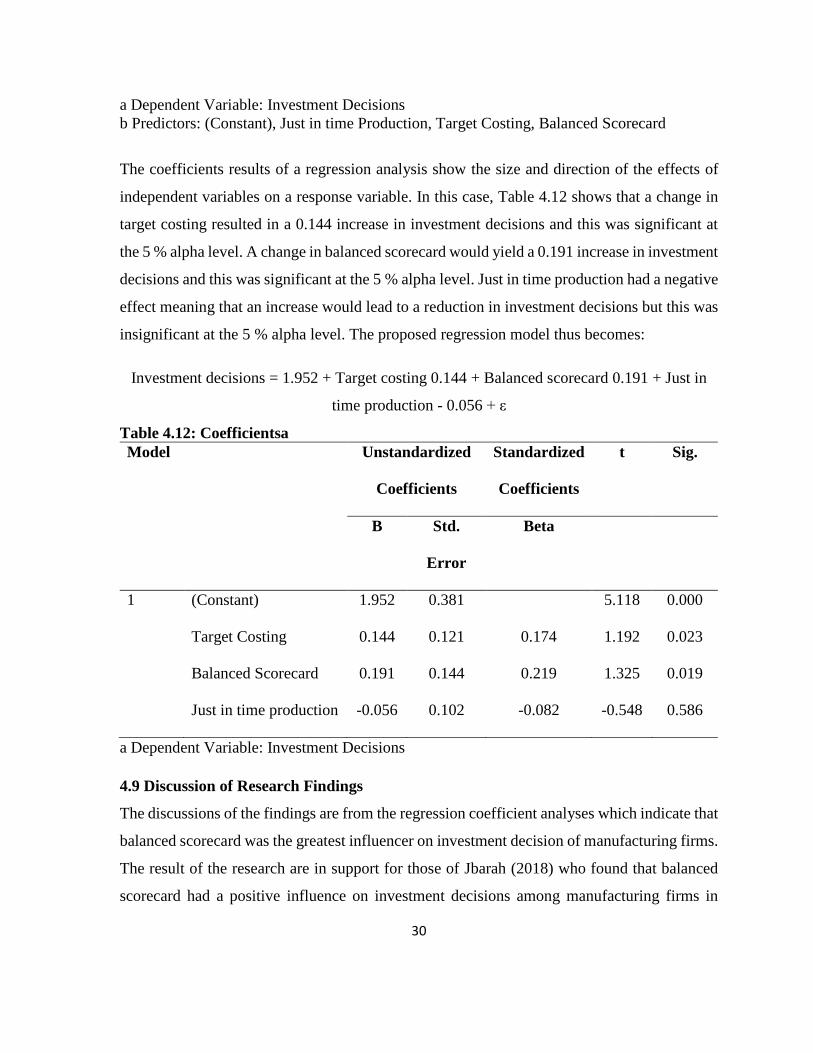
The coefficients results of a regression analysis show the size and direction of the effects of
independent variables on a response variable. In this case, Table 4.12 shows that a change in
target costing resulted in a 0.144 increase in investment decisions and this was significant at
the 5 % alpha level. A change in balanced scorecard would yield a 0.191 increase in investment
decisions and this was significant at the 5 % alpha level. Just in time production had a negative
effect meaning that an increase would lead to a reduction in investment decisions but this was
insignificant at the 5 % alpha level. The proposed regression model thus becomes:
Investment decisions = 1.952 + Target costing 0.144 + Balanced scorecard 0.191 + Just in
time production - 0.056 + ε
Table 4.12: Coefficientsa
Model Unstandardized
Coefficients
Standardized
Coefficients
t Sig.
B Std.
Error
Beta
1 (Constant) 1.952 0.381 5.118 0.000
Target Costing 0.144 0.121 0.174 1.192 0.023
Balanced Scorecard 0.191 0.144 0.219 1.325 0.019
Just in time production -0.056 0.102 -0.082 -0.548 0.586
a Dependent Variable: Investment Decisions
4.9 Discussion of Research Findings
The discussions of the findings are from the regression coefficient analyses which indicate that
balanced scorecard was the greatest influencer on investment decision of manufacturing firms.
The result of the research are in support for those of Jbarah (2018) who found that balanced
scorecard had a positive influence on investment decisions among manufacturing firms in
Page 42
31
Jordan. The outcome of this study is in contradiction with other studies conducted in Kenya’s
manufacturing sector that reported less use of the balanced scorecard. These include Arithi’s
(2001) survey which found that the BSC was not being implemented among the large
manufacturing companies. This observation is elucidated as the study was conducted in the
early 2000s and a lot has changed since then in the competitiveness in Kenya’s manufacturing
sector.
Studies that followed also had similar findings, for instance, Aduda and Ndaita (2013) found
limited implementation of the balanced scorecard among large manufacturing firms. Kaplan
and Norton (1992) are credited with the creation of the BSC as a method of managing and
measuring performance using four perspectives to overcome limitations and measure
performance of previous methods. The findings suggest that manufacturing firms that use the
BSC to collect information and feedback which is used to make strategic investment decisions
that ultimately contribute to superior firms against competitors.
The outcome of the study indicates that target costing had a positive and significant effect on
investment decision after balanced scorecard. According to Altin et al. (2020), target costing
is one of the most influential factors affecting investment making decisions since many of the
costs related to production are fixed before the production process is started, and subsequent
replacement of resources designated for production will lead to extra costs to the operations.
The result match Waihenya’s (2019) study finding that Kenyan manufacturing firms were
using target costing as a managerial accounting technique to enhance their performance
although the study did not link this with the firms’ investment decision.
Moreover, the results corroborate those of Jbarah (2018) study in the Jordanian manufacturing
industry that established manufacturing firms’ investment decision were determined by
adoption of the balanced scorecard. The researcher however notes that the positive effects of
target costing on investment decisions are contradicted because past studies include (Arithi’s
2001; Aduda & Ndaita, 2013) conducted among manufacturing firms have indicated that target
costing is a SMAT that is seldom adopted in the industry. But this findings can be defended
by focusing on the fact that these studies focused on performance of the organization as a
Page 43
32
dependent variable not investment decision. The variable of just in time production did not
have any effect on investment decision of firms as influence was not statistically significant.
The findings disagree with those of Jbarah (2018) that revealed a positive outcome of
investment decisions from implementation of just in time production of manufacturing firms
in Jordan. The results also contradict those of Altin et al. (2020) that found just in time
production had highest rate of effect on efficiency of making investment decision of SMEs.
Sukarma (1997) that firms adopting JIT production contributes to less risky investment
decision. This means that manufacturing firms were facing much more risk in investment
decisions as there was no impact of JIT production.
Page 44
33
CHAPTER FIVE: SUMMARY, CONCLUSION AND
RECOMMENDATIONS
5.1 Introduction
This chapter is a presentation of the summarized results, reached conclusions, and
recommendations, study limitations, and suggestions made for future research. This sub-
sections of the chapter are presented along the research objectives of the study.
5.2 Summary of Findings
The first objective of the study aimed to determine the influence of target costing on
manufacturing firms’ investment decision. The regression analysis revealed that this variable
has a positive effect meaning that increased application of target costing influenced investment
decisions. The descriptive findings show that manufacturing firms predicted and studied
market and the products design influenced their pricing and that firms were dependent on
several procedures to determine the customers’ needs and took into account the feedback and
opinion from their clients in a moderate extent and this influenced their investment decisions.
The second major finding of the research is that balanced scorecard had the greatest effect on
manufacturing firms’ investment choices. In applying the balanced scorecard in their
investment choices, the descriptive findings found that firms made known their strategy to their
stakeholders and clearly presented their strategic goals to a moderate extent. In terms of the
influence of just in time production on manufacturing firms’ investment decision, the outcome
of the study showed that this form of SMATs did not have any impact.
5.3 Conclusion
From the presented results, the first objective conclusion was that target costing positively
impacted investment decision of manufacturing firms. In relation to the second objective, the
study further concludes that balanced scorecard had the greatest effect on investment decision
of Kenyan manufacturing firms. From the results, just in time production has no effect on
investment decision and it is this study’s conclusion that just in time production does not
influence investment choices.
Page 45
34
5.4 Recommendations
One recommendation made is that manufacturing firms ought to adopt target costing approach
where production is manageable to reduce the costs of products which has a direct influence
on investment decision of manufacturing firms. Second, the study recommends that
manufacturing firms should enhance the adoption balanced scorecard principles in their
operations clarifying its strategy to the stakeholders and clearly presenting its strategic
objectives. This practice of the balanced scorecard contributes to support for investment
decisions from a firm’s stakeholders. Third recommendation is that manufacturing firms
should strive to just in time production such as continuous improvement, controlling material
flow and production scheduling that can help firms reduce cost whilst increasing productivity
and improving quality due to the ever rising costs of production such as raw materials, labour
and operating materials in Kenya.
5.5 Limitations of the Study
The study examined the effect of strategic management accounting techniques on investment
decisions among manufacturing firms in Kenya. But this research could only focus on
manufacturing firms in the industrial area of Kenya and did not include other manufacturing
firms outside the Nairobi County Boundaries. The study was limited to quantitative data
whereas some qualitative information would have added value to the study owing to the
description on the influence of SMATs on investment decisions.
5.6 Suggestions for Further Research
The study examined the effect of strategic management accounting techniques on investment
decisions among manufacturing firms in Kenya. The study focused on manufacturing firms
but it is equally important for a similar study to include industrial firms in the future. The study
used quantitative methods and there is space for future studies to include qualitative methods
so as to get more in-depth information on how balanced scorecard and target costing have
contribute to investment decisions among manufacturing firms.
Page 46
35
REFERENCES
Adler, R. W., Waldron, M., & Everett, A. M. (2000). Advanced Management Accounting
Techniques in Manufacturing: Utilization, Benefits, and Barriers to Implementation.
Accounting Forum, 24(2), 131-150.
Adom, D., Hussein, E. K., & Agyem, J. A. (2018). Theoretical and conceptual framework:
mandatory ingredients of a quality research. International Journal of Scientific
Research, 7(1), 438-441.
Aduda, J., & Ndaita, B. S. (2013). Management Accounting Systems Changes and Practices
Adopted by Large Manufacturing Companies in Nairobi Kenya. The Operations
Research Society of Eastern African Journal, 3(2), 1-42.
Al Shra'ah, A. E. M. (2015). The Impact of Decision Making Styles on Organizational
Learning: An Empirical Study on the Public Manufacturing Companies in Jordan.
International Journal of Business and Social Science, 6(4), 55-62.
Aliaga, M., & Gunderson, B. (2002). Interactive Statistics. Thousand Oaks, CA: Sage
Publications.
Alkaraan, E., & Northcott, D. (2006). Strategic Capital Investment Decision-Making: A Role
for Emergent Analysis Tools? A study of Practice in Large UK manufacturing
companies. The British Accounting Review, 38, 149–173.
AlMaryani, M. A. H., & Sadi, H. H. (2012). Emerging Markets Queries in Finance and
Business Strategic Management Accounting Techniques in Romanian Companies:
Some Survey Evidence. Procedia Economics and Finance, 3, 387 – 396.
Altin, A. Y., Akgün, L., & Kasimoğlu, M. (2020). Measuring the effect of strategic
management accounting techniques on making investment decisions of SMEs: Eastern
Anatolian Case. Istanbul Commerce University Journal of Social Sciences, 19(37),
463-492.
Amuko, D. A. (2015). SMEs’ Investment Decisions: An Assessment on Technology Investments
by SMEs in Nairobi, Kenya. Unpublished research project. United States International
University – Africa. Nairobi. Kenya.
Page 47
36
Anaja, B., & Onoja, E. E. (2015). The role of financial statements on investment decision
making: A case of United Bank for Africa plc (2004-2013). European Journal of
Business, Economics and Accountancy, 3(2), 12-37.
Arithi P. M. (2001). Application of strategic management accounting by large manufacturing
companies in Nairobi. Unpublished research project. University of Nairobi. Nairobi.
Kenya
Atkinson, A. A., Kaplan, R. S., Matsumura, E. M. & Young, S. M. (2012). Management
accounting: information for decision-making and strategy execution. Upper Saddle
River, NJ: Prentice Hall.
Atrill, P., & Mclaney, E. (2009). Management Accounting for Decision Makers. Upper Saddle
River, NJ: Prentice Hall.
Bawaneh, S. S. (2018). Management Accounting Practices: A Case of Jordanian
Manufacturing Companies. Asia-Pacific Management Accounting Journal, 13(3), 26-
53.
Belsley, D. A., Kuh, E., & Welsch, R. E. (2004). Regression diagnostics: identifying influential
data and sources of collinearity. New York, NY: John Wiley
Bialowolski, P., & Weziak-Bialowolska, D. (2014). External Factors Affecting Investment
Decisions of Companies. Economics: The Open-Access, Open-Assessment E-Journal,
8(11), 1-21.
Blumberg, B., Cooper, D. R., & Schindler, P. S. (2008). Business research methods. Berkshire,
UK: McGraw-Hill.
Bulle, H. I., & Omagwa, J. (2017). Financial Management and Financial Performance of Firms
Listed under Manufacturing and Allied Sector at the Nairobi Securities Exchange,
Kenya. The International Journal of Business & Management, 5(11), 290-296.
Cadez, S. & Guilding, C. (2008). An exploratory investigation of an integrated contingency
model of strategic management accounting. Accounting, Organisations and Society,
836-873.
Chartered Institute of Management Accountants (2009). Management Accounting Tools For
Today And Tomorrow. Retrieved from
Page 48
37
https://www.cimaglobal.com/Documents/Thought_leadership_docs/2009-12-16-
CIMA-Tools-and-Techniques.pdf
Cyert, R. M., & March, J. G. (1963). A behavioral theory of the firm. Englewood Cliffs, NJ:
Prentice-Hall.
Dik, R. (2011). Arab management accounting systems under the influence of their culture.
Unpublished PhD Dissertation. Dortmund University of Technology, Germany.
Doust, A. N., & Pakmaram, A. (2015). Investigating Effect of Governmental Ownership on
the Investment Decisions of Managers. International Journal of Academic Research in
Accounting, Finance and Management Sciences, 5(3), 14–32
Edusei-Mensah, W. (2015). Determinants of Investment Decisions of Selected Listed Firms in
Ghana. Unpublished dissertation. Kwame Nkrumah University of Science and
Technology. Kumasi. Ghana.
Fiedler, F. E. (1964). A contingency model of leadership effectiveness. In L. Berkowitz (ed.),
Advances in experimental social psychology (pp. I50- I90). NY: Academic Press
Gichaaga, P. M. (2014). Effects of Management Accounting Practices on Financial
Performance of Manufacturing Companies in Kenya. Unpublished Research Project.
Nairobi. Kenya.
Government of Kenya (2018). Second Medium Term Plan 2018-2022: Nairobi. Government
Printers.
Gray, D. E. (2014). Doing Research in the Real World. (3rd ed.). Thousand Oaks, CA: Sage.
Islam, J. & Hu, Hui. (2012). A review of literature on contingency theory in managerial
accounting. African Journal of Business Management, 6(15), 5159-5164.
James C. V., & John, M. (2010). Financial Management. (13th edn). Phi Learning Private
Limited. New Delhi, India.
Jbarah, S. S. (2018). The Impact of Strategic Management Accounting Techniques in Taking
Investment Decisions in the Jordanian Industrial Companies. International Business
Research, 11(1), 145-156.
John, A. C. (2015). Reliability and Validity: A Sine Qua Non for Fair Assessment of
Undergraduate Technical and Vocational Education Projects in Nigerian Universities,
Journal of Education and Practice, 6(34), 68-75.
Page 49
38
Karanja, J. C. N., Mwangi, E., & Nyaanga, P. (2012). Adoption of Modern Management
Accounting Techniques in Small and Medium (SMEs) in Developing Countries: A Case
Study of SMEs in Kenya. Unpublished paper. St Paul’s University. Nairobi. Kenya.
Kariuki, S. N., & Kamau, C. G. (2016). Organizational Contingencies Influencing The
Adoption of Strategic Management Accounting Practices among Manufacturing Firms
in Kenya. International Journal of Advanced Research, 5(4), 167-182.
Kember, D., & Leung, D. Y. P. (2008). Establishing the validity and reliability of course
evaluation questionnaires, Assessment & Evaluation in Higher Education, 33(4), 341–
353.
Kemuma, M. C. (2014). Effect of Investment Decision on the Performance of Firms Listed in
the Nairobi Securities Exchange. Unpublished research project. University of Nairobi.
Nairobi. Kenya.
Kivisi, F. S. (2019). Japan-Kenya Relationship, The Human Security Concept and Kenya’s
Big Four Agenda. American Journal of Public Policy and Administration, 4(1), 1–17.
Koroti, M. (2014). The Effect of Investing and Financing Decisions on Financial Performance
of the Sugar Factories in Kenya. Unpublished research project. University of Nairobi.
Nairobi. Kenya.
Lyons, B., Gumbus, A., & Bellhouse, D. E. (2003). Aligning Capital Investment Decisions
with the Balanced Scorecard. Journal of Cost Management, 34-38.
Ma, Y., & Tayles, M., (2009). On The Emergence of Strategic Management Accounting: An
Institutional Perspective. Accounting and Business Research, 39(5), 473-495.
Majerčák, P., Cisko, S., & Majerčáková, E. (2013). The Impact of Theory of Constraints on
the Management Accounting. The 7th International Days of Statistics and Economics,
Prague, September 19-21.
Mugenda, O. & Mugenda, A. (2019). Research Methods: Quantitative and Qualitative
Approaches. (3rd ed.). Nairobi: African Centre for Technology Studies.
Muraguri, M. D., Irura, N. S., & Kyaloteresia, N. (2014). Analysis of Factors Influencing
Investment Decisions of SACCO Funds in Kenya. International journal of research in
commerce & management, 5(7), 6-9.
Page 50
39
Musau, M. A. (2016). Effect of Investment Decision on Financial Performance of Savings and
Credit Cooperatives in Kitui Central Sub-County, Kenya. Unpublished research
project. South Eastern Kenya University. Kitui. Kenya.
Mweresa, S. O., & Muturi, W. (2018). Effects of Investment Decisions on the Financial
Performance of Public Sugar Firms in Western Kenya. International Journal of Social
Sciences and Information Technology, 4(5), 197-210.
Myrelid, A. (2013). Essays on Manufacturing-Related Management Accounting. Unpublished
Thesis. Linköping University. Linköping. Finland.
Neuman, W. (2012). Basics of Social Research. (3rd ed.). Boston, MA: Pearson/Allyn and
Bacon.
Nixon, B. Technology Investment and Management Accounting Practice. British journal of
management, 6(4), 271-288.
Nuraliati, A. (2018). Strategic Accounting Management Where Are You Going? International
Journal of Economics, Commerce and Management, 6(12), 633-643.
Nyang’au, S. M., & Muturi, (2018). Effect of Investment Decisions on Financial Performance
of Retail Investors in Kisii Town. International Journals of Academics & Research,
1(1), 194-203.
Ojra, J. (2014). Strategic Management Accounting Practices in Palestinian Companies:
Application of Contingency Theory Perspective. Unpublished PhD thesis. University
of East Anglia, United Kingdom.
Osoro, M. O., Nyang’au, A. S., & Nyarige, E. (2017). An Assessment of the Effect of
Investment Decision Techniques on Financial Performance of Medium Enterprises in
Kenya: A Case of Kisii Town. African Journal of Business and Management, 3(2), 138-
144.
Otley, D.T. (1980). The Contingency Theory of Management Accounting: Achievement
And Prognosis. In: Emmanuel C., Otley D., Merchant K. (eds) Readings in
Accounting for Management Control. Springer, Boston, MA.
Pacheco, L. M. (2017). Investment determinants At The Firm-Level: The Case Of Portuguese
Industrial SMEs. International Journal of Business Science and Applied Management,
12(1), 2-17.
Page 51
40
Pandey, I. M. (2008). Financial Management. Vikas Publishing House Pvt Ltd. New Delhi,
India
Perić, M., & Đurkin, J. (2015). Determinants of Investment Decisions in a Crisis: Perspective
of Croatian Small Firms. Management, 20(2), 115-133.
Petera, P., & Šoljaková, L. (2020). Use of strategic management accounting techniques by
companies in the Czech Republic. Economic Research-Ekonomska Istraživanja, 33(1),
46-67.
Pylypiv, N., & Pіatnychuk, I. (2018). Essential Strategic Management Accounting Tools used
for Making Investment Decisions at Enterprises in EU. Journal of Vasyl Stefanyk
Precarpathian National University. 5(4), 50-56.
Qureshi, A. S., Rehamn, K. S., & Hunjra, A. I. (2014). Factors Affecting Investment Decision
Making of Equity Fund Managers. Wulfenia Journal, 19(10), 280-291.
Rahman, S-U. (1998). Theory of Constraints. International Journal of Operations &
Production Management, 18(4), 336 – 355.
Rajes, M., Lechner, C. & Floyd, S (2013). A Behavioural Theory of Strategic Renewal: The
Impact of Performance Feedback and Organizational Learning on strategic Renewal
Actions. Unpublished dissertation. The University of St. Gallen Germany. St. Gallen.
Switzerland.
Reid, G. C., & Smith, J. A. (2000). The Impact of Contingencies On Management Accounting
System Development. Management Accounting Research, 427-450.
Robson, C. (2007). How to do a Research Project: A Guide for Undergraduate Students.
Oxford, UK: Blackwell publishing.
Rogerson, W. P. (2008). Intertemporal Cost Allocation and Investment Decisions. Journal of
political economy, 116(5), 931-950.
Sajid, A. (2015). Factors Affecting Investment Decision Making: Evidence from Equity Fund
Managers and Individual Investors in Pakistan. Research Journal of Finance and
Accounting, 6, 135-141.
Saunders, M., Lewis, P., & Thronhill, A. (2012). Research Methods for Business Student. (4th
ed). Harlow, UK: Pearson Education Ltd.
Page 52
41
Shanteau, J. (2001). Encyclopedia of Psychology and Behavioral Science (3rd ed). Craighead,
W. E., & Nemeroff, C. B. (Eds). NY: Wiley.
Şimşita, Z. T., Günayb, N. S., & Vayvayc, O. (2014). Theory of Constraints: A Literature
Review. Procedia - Social and Behavioral Sciences, 150, 930 – 936.
Sitjma, K. (2009). On The Use, Misuse and the Very Limited Usefulness of Cronbach's Alpha.
Psychometrika, 74, 107–120.
Soh, C, Carr, C, Kinder, T, Lin, Y., & Mousavi, M. (2015). What Are the Top Variables
Leading to Strategic Investment Decision Making Performance? Journal of Economics,
Business and Management, 3(12), 1169-1173.
Sutanapong, C., & Louangrath, P. I. (2015). Descriptive and Inferential Statistics. International
Journal of Research and Methodology in Social Science, 1(1), 22-35.
Taherdoost, M. (2016). Sampling Methods in Research Methodology: How to Choose a
Sampling Technique for Research, SSRN Electronic Journal, 5(2), 18-27.
Turner, M. J., & Coote, L. V. (2018). Incentives and monitoring: Impact on the financial and
non-financial orientation of capital budgeting. Meditari Accountancy Research. 26(1),
122-144.
Uleng, T., Mus, R., Mas’ud, M., & Nurpadila, M. (2017). The Effect of Macro Factors on
Investment Decisions in Manufacturing Companies Listed in Indonesia Stock
Exchange (IDX). Journal of research in business management, 5(5), 7-16.
Waihenya, C. (2019). Effects of Managerial Accounting Practices on Financial Performance:
A Case of Manufacturing Firms in Industrial Area, Nairobi. Unpublished Research
Project. United States International University – Africa. Nairobi. Kenya.
World Bank Group (2019). Unbundling the Slack in Private Sector Investment Transforming
Agriculture Sector Productivity and Linkages to Poverty Reduction. Washington, D.C.
World Bank Group.
Worzie, P. (2020). Factors Affecting Investment Decisions among Listed Firms in the Nairobi
Securities Exchange. International Journal of Engineering Technologies and
Management Research, 7(2), 124-142.
Page 53
42
Wu, C-L., Huang, P. H., & Brown, D. (2013). Target Costing As A Role Of Strategic
Management Accounting In Real-Estate Investment Industry. African Journal of
Business Management, 7(8), 641-648.
Zheng, X. (2012). Management Accounting Practices In China: Key Problems And Solutions.
Social Research. 4(29), 91–98.
Page 54
43
APPENDICES
APPENDIX 1: QUESTIONNAIRE
Section A: Background Information
1. Please indicate your workplace role
Finance Managers [ ]
Financial Controller [ ]
Production Mangers [ ]
Production Supervisors [ ]
Accounting Managers [ ]
Section B: Target Costing
The table below shows the Balanced Scorecard statements. Kindly tick to what extent you’re
in agreement with the given statements on Target Costing. Where 1- Strongly disagree, 2 –
disagree, 3 – moderately agree, 4 – agree, 5 – strongly agree
Target costing statements
Str
on
gly
dis
agre
e
Dis
agre
e
Mod
erate
ly a
gre
e
Agre
e
Str
on
gly
agre
e
The firm provides financial, human, and material resources for
development and research
The firm invests in specific product design to make sure the technical
specifications are to the required standard
The end-products of the firm after production are tested to ensure
suitable and quality pricing for consumers
The operational engineering of the firm is conducted such that it
lessens the costs and gives newer designs in the future
The firm’s production process is conducted in a manner that lessens
the production costs
The product operational design influences its pricing
The product price takes into consideration the cost incurred in raw
material storage
The need can be estimated and evaluated to find the suitable price for
the product
The company is dependent on various processes to find consumer
needs and opinions
The raw materials and production processes are done according to the
needs of the consumers
Page 55
44
Section C: Balanced Scorecard
The table below shows the Balanced Scorecard statements. Kindly tick to what extent you’re
in agreement with the given statements on Balanced Scorecard. Where 1- Strongly disagree, 2
– disagree, 3 – moderately agree, 4 – agree, 5 – strongly agree
Balanced scorecard statements
Str
on
gly
dis
ag
ree
Dis
ag
ree
Mo
der
ate
ly a
gre
e
Ag
ree
Str
on
gly
agre
e
The firm makes clarification on the strategy to its shareholder and
is clear about the goals of the firm
The firm pays attention to the performance measurements to
achieve its operations and has strategies linked to the operations
The firm collaborates with the firm and individuals about its
performance
The firm has a plan to reach its tactical aims and makes efforts to
ease the annual budget preparation process
The firm aims to escalate the administrative coordination among
employees and create knowledge in the firm to enhance their
capabilities
The firm pays attention to the operations’ performance
measurement linking shore-term and long-term objectives of the
firm
The strategy of the firm is translated to the initiatives, goals,
standards, and parameters for continuous improvement
The firm’s strategy is communicated to all staff and extends to
the firm’s learning and change
The firm aims to match the personal goals and the departmental
objectives with the strategy
Page 56
45
Section D: Just In Time Production
The table below shows the just in time production statements. Kindly tick to what extent you’re
in agreement with the given statements on Just In Time Production. Where 1- Strongly
disagree, 2 – disagree, 3 – moderately agree, 4 – agree, 5 – strongly agree
Just In Time Production statements
Str
on
gly
dis
agre
e
Dis
agre
e
Mod
erate
ly a
gre
e
Agre
e
Str
on
gly
agre
e
The JIT processes have contributed to the control of times of
delivery to clients
The JIT system lessens amount of stock and the expenses
associated
The JIT system has made the stock delivery to a small quantity
of suppliers
The JIT system has contributed to the employees developing
various skills
The utilization of control cards in production has led to the
control of production and needed specifications
The JIT system has assisted in stock purchasing with the
matching amount of production quantity
The JIT system is linked to enhancing product quality and reduce
expenses by controlling and testing processes
The JIT system has made the firm to rely on a low stock levels
to reduce losses
The JIT system has made it possible for the firm to produce to
Page 57
46
Section E: Investment Decision
The table below shows the Investment Decision statements. Kindly tick to what extent you’re
in agreement with the given statements on Investment Decisions. Where 1- Strongly disagree,
2 – disagree, 3 – moderately agree, 4 – agree, 5 – strongly agree
Investment Decision statements
Str
on
gly
Dis
agre
e
Dis
agre
e
Mod
erate
ly A
gre
e
Agre
e
Str
on
gly
Agre
e
The company has been making replacement investment decisions in
improving operating efficiency
The firm aims to achieve lessening expenses by replacing old
products in relation to change in the market environment
The company creates value through the eventual outcome of the
replacement investment decision
The replacement of worn-out assets has had a major impact on firm
investment
The company focuses on adding new operations lines and new
products
The management of the firms aims to aid of capacity or
diversification of operations
The management of the company desire for risk investment because
business is taking risk
Incorporation of capital budgeting affect investment variations
The company has invested in changing in operations in terms of
products offered
The company has invested methods of delivery and efficiency of
operations
The firm always aims to develop new information or technology to
enhance the product effectiveness
Organization research and development decisions have contributed
to the efficiency in production
Page 58
47
APPENDIX 2: LIST OF MANUFACTURING FIRMS
1. ACME Containers Ltd
2 Alloy Steel Casting Ltd
3 Alloy Steel Casting Ltd
4 Allpack Industries Ltd
5 Alpine Coolers Limited
6 Ashut Engineers Ltd
7 ASL Limited- Steel Division
8 Associated Vehicle Assemblers Ltd
9 Bayer East Africa Ltd
10 Beta Healthcare International
11 Bobmil Industries Ltd
12 Broadway Bakery Ltd
13 Brookside Dairy Ltd
14 C. Dorman’s Ltd
15 City Engineering Works (K) Limited
16 Corrugated Sheets Ltd
17 Crown Berger Kenya Ltd
18 Crown Paints (Kenya) Ltd
19 Deepa Industries Limited
20 Devki Steel Mills Ltd
21 Dodhia Packaging Limited
22 Doshi Enterprises Ltd
23 East Africa breweries ltd
24 East African Cables Ltd
25 Farmers Choice Ltd
Page 59
48
26 General Motors East Africa Limited
27 General Plastics Limited
28 Glaxo Smithkline Kenya Ltd
29 Impala Glass Industries Ltd.
30 Kaluworks Ltd
31 Kapa Oil Refineries Limited
32 Kenafric Industries Ltd
33 Kenblest Limited
34 Ken-Knit (Kenya) Ltd
35 Kenpoly Manufacturers Limited
36 Kevian Kenya Ltd
37 Kikoy Co. Ltd
38 Kim-Fay East Africa Ltd
39 Mabati Rolling Mills Limited
40 Metal Crowns Ltd
41 Mini Bakeries (Nbi) Ltd
42 Nampak Kenya Ltd
43 Nestle Foods Kenya Ltd
44 Ngecha Industries Ltd
45 Orbit Enterprises Ltd
46 Pembe Flour Mills Ltd
47 Proctor and Allan (E.A.) Ltd
48 PZ Cussons EA Ltd
49 Reckitt Benckiser (E.A.) Ltd
50 Regal Pharmaceuticals Ltd
51 Revital Healthcare (EPZ) Ltd
52 Revolution Stores Ltd
Page 60
49
53 Rosewood Furniture Manufacturers
54 Rumorth Group of Companies Ltd
55 S C Johnson And Son Kenya
56 Sadolin Paints (E.A.) Ltd
57 Saj Ceramics Ltd
58 Savannah Cement
59 Sheffield Steel Systems Ltd
60 Sollatek Electronics (Kenya) Limited
61 Spinners and Spinners Ltd
62 Techpak Industries Ltd
63 Toyota Kenya Ltd
64 Twiga Chemical Industries Limited
65 Twiga Stationers and Printers Ltd
66 Unga Group Ltd
67 Unilever East and Southern Africa
68 Vajas Manufacturers Ltd
69 Vitafoam Products Limited